Transcontinental Realty Investors, Inc. (NYSE: TCI), a
Dallas-based real estate investment company, reported results of
operations for the second quarter ended June 30, 2016. TCI
announced today that the Company reported net income applicable to
common shares of approximately $4.4 million, or $0.51 per diluted
earnings per share, for the three months ended June 30, 2016, as
compared to a net loss applicable to common shares of $86 thousand,
or $0.01 per diluted earnings per share for the same period ended
2015.
“The Company’s strategic posture of maintaining a strong focus
on our multi-family portfolio has created valuable results. We are
committed to solidifying the portfolio and paying very close
attention to all operational details, while at the same time
maintaining our commitment to creating value. We believe our second
quarter 2016 operating results, combined with our recent
acquisitions, demonstrates yet another quarter of stabilized
performance for the Company. We believe the portfolio is well
positioned to deliver solid financial returns for the remainder of
2016,” said Danny Moos, the Company’s Chief Executive Officer and
President. “We are pleased that we are seeing continued
improvements in our operations from these endeavors and will
continue to adapt to market challenges with an eye on both
near-term economic challenges and long-term prospects as the real
estate market improves.”
Rental and other property revenues were $30.5 million for the
three months ended June 30, 2016. This represents an increase of
$6.7 million compared to the prior period revenues of $23.8
million. The change by segment is an increase in the apartment
portfolio of approximately $4.7 million and an increase in the
commercial portfolio of $2.0 million. During the three months ended
June 30, 2016, we recorded $2.5 million rental revenue for six
apartment communities purchased since June 30, 2015 and had a
decrease in rental revenue of $0.6 million for two apartment
communities sold since June 30, 2015, for a net increase of $1.9
million. In addition, we purchased seven apartment communities in
the second quarter of 2015, which produced rental revenue of $3.1
million and $1.3 million during the three months ended June 30,
2016 and 2015, respectively, for a net increase of $1.8 million.
The $2.0 million increase in revenues for the commercial portfolio
was primarily due to the acquisition of a commercial building in
Houston, Texas late in the second quarter of 2015.
Property operating expenses were $14.9 million for the three
months ended June 30, 2016. This represents an increase of $4.0
million compared to the prior period operating expenses of $10.9
million. The change by segment is an increase in the apartment
portfolio of $2.5 million and an increase in the commercial
portfolio of $1.5 million. The primary reason for the increase in
property operating expenses for the Company’s apartment portfolio
was the purchase of six communities with a total of 1,144 units,
net of two communities sold with a total of 360 units since June
30, 2015, for a net increase of 784 units. In addition, we
purchased seven apartment communities during the second quarter of
2015 which have a total of 1,261 units. Property operating expenses
for our commercial portfolio increased $1.5 million due to the
acquisition of an office building in Houston, Texas late in the
second quarter of 2015.
Mortgage and loan interest expense was $12.1 million for the
three months ended June 30, 2016. This represents an increase of
$3.9 million compared to the prior period expense of $8.2 million.
The change by segment was an increase of $2.8 million in the
apartment portfolio due to acquisitions, an increase of $1.8
million in the other portfolio primarily due to securing a new
mezzanine debt obligation in June 2015 and an increase in the
commercial portfolio of $0.1 million. These increases were
partially offset by a decrease in the land portfolio of $0.8
million due to the transfer of mortgage obligations related to land
sold.
Gain on sale of income-producing properties was $5.2 million for
the three months ended June 30, 2016. During 2016, the Company sold
one apartment community located in Irving, Texas to an independent
third party for a total sales price of $8.1 million which resulted
in a gain of $5.2 million. There were no sales of income-producing
properties during the three months ended June 30, 2015.
Gain on land sales was $1.7 million for the three months ended
June 30, 2016 compared to $1.2 million for the three months ended
June 30, 2015. In the current period we sold 12.2 acres of land for
a total sales price of $3.1 million and recorded a gain of $1.7
million. In 2015, we sold 9.7 acres of land for a total sales price
of $1.9 million and recorded a gain of $1.2 million.
About Transcontinental Realty Investors, Inc.
Transcontinental Realty Investors, Inc., a Dallas-based real
estate investment company, holds a diverse portfolio of equity real
estate located across the U.S., including office buildings,
apartments, shopping centers and developed and undeveloped land.
The Company invests in real estate through direct ownership, leases
and partnerships and invests in mortgage loans on real estate. For
more information, visit the Company’s website at
www.transconrealty-invest.com.
TRANSCONTINENTAL REALTY INVESTORS, INC.
CONSOLIDATED STATEMENTS OF OPERATIONS (unaudited)
Three Months Ended June 30,
Six Months Ended June 30, 2016
2015 2016 2015
Revenues: Rental and other property revenues (including $174
and $173 for the three months and $347 and $343 for the six months
ended 2016 and 2015, respectively, from related parties) $ 30,521 $
23,756 $ 59,424 $ 46,060
Expenses: Property operating
expenses (including $223 and $178 for the three months and $423 and
$331 for the six months ended 2016 and 2015, respectively, from
related parties) 14,919 10,929 29,882 21,793 Depreciation and
amortization 5,843 5,107 11,651 9,751 General and administrative
(including $753 and $727 for the three months and $1,502 and $1,547
for the six months ended 2016 and 2015, respectively, from related
parties) 1,604 1,278 3,213 3,045 Net income fee to related party 54
45 126 90 Advisory fee to related party 2,331
1,951 4,702 3,894 Total
operating expenses 24,751 19,310
49,574 38,573 Net operating income 5,770 4,446
9,850 7,487
Other income (expenses): Interest income
(including $3,274 and $2,748 for the three months and $6,008 and
$6,167 for the six months ended 2016 and 2015, respectively, from
related parties) 3,289 2,994 7,136 6,755 Other income 902 14 1,169
81 Mortgage and loan interest (including $165 and $190 for the
three months and $627 and $408 for the six months ended 2016 and
2015, respectively, from related parties) (12,092 ) (8,216 )
(25,258 ) (18,401 ) Earnings (losses) from unconsolidated joint
ventures and investees - 10 (2 ) 43 Litigation expense -
(45 ) - (118 ) Total other
expenses (7,901 ) (5,243 ) (16,955 )
(11,640 ) Loss before gain on sale of income-producing properties,
gain on land sales, non-controlling interest, and taxes (2,131 )
(797 ) (7,105 ) (4,153 ) Gain on sale of income-producing
properties 5,168 - 4,925 - Gain on land sales 1,719
1,250 3,370 4,126 Net
income (loss) from continuing operations before taxes 4,756 453
1,190 (27 ) Income tax benefit (expense) - (12
) 1 90 Net income from continuing
operations 4,756 441 1,191 63 Discontinued operations: Net income
(loss) from discontinued operations - (34 ) 3 258 Income tax
expense (benefit) from discontinued operations -
12 (1 ) (90 ) Net income (loss) from
discontinued operations - (22 ) 2
168 Net income 4,756 419 1,193 231 Net
(income) loss attributable to non-controlling interest (97 )
(281 ) (74 ) 12 Net income attributable
to Transcontinental Realty Investors, Inc. 4,659 138 1,119 243
Preferred dividend requirement (224 ) (224 )
(446 ) (446 ) Net income (loss) applicable to common shares
$ 4,435 $ (86 ) $ 673 $ (203 )
Earnings per
share - basic Net income (loss) from continuing operations $
0.51 $ (0.01 ) $ 0.08 $ (0.04 ) Net income from discontinued
operations - - -
0.02 Net income (loss) applicable to common shares $ 0.51
$ (0.01 ) $ 0.08 $ (0.02 )
Earnings per
share - diluted Net income (loss) from continuing operations $
0.51 $ (0.01 ) $ 0.08 $ (0.04 ) Net income from discontinued
operations - - -
0.02 Net income (loss) applicable to common shares $ 0.51
$ (0.01 ) $ 0.08 $ (0.02 ) Weighted average
common shares used in computing earnings per share 8,717,767
8,717,767 8,717,767 8,717,767 Weighted average common shares used
in computing diluted earnings per share 8,717,767 8,717,767
8,717,767 8,717,767
Amounts attributable to
Transcontinental Realty Investors, Inc. Net income from
continuing operations $ 4,659 $ 160 $ 1,117 $ 75 Net income (loss)
from discontinued operations - (22 ) 2
168 Net income $ 4,659 $ 138 $
1,119 $ 243
TRANSCONTINENTAL REALTY
INVESTORS, INC. CONSOLIDATED BALANCE SHEETS
June 30, December 31,
2016 2015 (unaudited) (dollars in
thousands, except share and par value amounts) Assets
Real estate, at cost $ 993,060 $ 935,635 Real estate subject to
sales contracts at cost, net of depreciation 47,192 47,192 Less
accumulated depreciation (148,718 ) (138,808 ) Total
real estate 891,534 844,019 Notes and interest receivable:
Performing (including $67,829 in 2016 and $64,181 in 2015 from
related parties) 76,002 71,376 Less allowance for doubtful accounts
(including $1,825 in 2016 and 2015 from related parties)
(1,825 ) (1,825 ) Total notes and interest receivable 74,177
69,551 Cash and cash equivalents 19,953 15,171 Restricted cash
29,880 44,060 Investments in unconsolidated joint ventures and
investees 2,460 5,243 Receivable from related party 75,615 90,515
Other assets 39,741 41,645 Total assets
$ 1,133,360 $ 1,110,204
Liabilities and
Shareholders’ Equity Liabilities: Notes and interest payable $
800,398 $ 772,636 Notes related to real estate held for sale 376
376 Notes related to real estate subject to sales contracts 6,072
6,422 Deferred revenue (including $50,669 in 2016 and $50,645 in
2015 to related parties) 71,045 71,021 Accounts payable and other
liabilities (including $6,060 in 2016 and $5,845 in 2015 to related
parties) 29,667 34,694 Total
liabilities 907,558 885,149 Shareholders’ equity: Preferred
stock, Series C: $0.01 par value, authorized 10,000,000 shares;
issued and outstanding zero shares in 2016 and 2015. Series D:
$0.01 par value, authorized, issued and outstanding 100,000 shares
in 2016 and 2015 (liquidation preference $100 per share) 1 1 Common
stock, $0.01 par value, authorized 10,000,000 shares; issued
8,717,967 shares in 2016 and 2015; outstanding 8,717,767 shares in
2016 and 2015 87 87 Treasury stock at cost, 200 shares in 2016 and
2015 (2 ) (2 ) Paid-in capital 270,303 270,749 Retained earnings
(62,968 ) (64,087 ) Total Transcontinental Realty
Investors, Inc. shareholders' equity 207,421 206,748
Non-controlling interest 18,381 18,307
Total shareholders' equity 225,802 225,055
Total liabilities and shareholders' equity $ 1,133,360
$ 1,110,204
View source
version on businesswire.com: http://www.businesswire.com/news/home/20160815006140/en/
Transcontinental Realty Investors, Inc.Investor
RelationsGene Bertcher,
800-400-6407investor.relations@transconrealty-invest.com
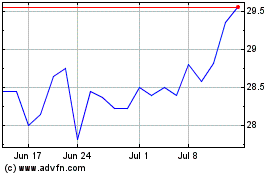
Transcontinental Realty ... (NYSE:TCI)
Historical Stock Chart
From Mar 2024 to Apr 2024

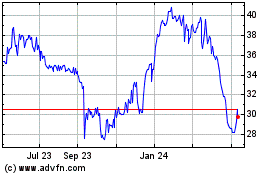
Transcontinental Realty ... (NYSE:TCI)
Historical Stock Chart
From Apr 2023 to Apr 2024
