Kellogg Up Over 4%, on Pace for Largest Percent Increase Since October 2017 -- Data Talk
March 21 2019 - 3:44PM
Dow Jones News
Kellogg Company (K) is currently at $56.58, up $2.47 or
4.56%
-- Would be highest close since March 1, 2019, when it closed at
$56.84
-- On pace for largest percent increase since Oct. 31, 2017,
when it rose 6.22%
-- Currently up four of the past six days
-- Up 0.57% month-to-date
-- Down 0.75% year-to-date
-- Down 34.95% from its all-time closing high of $86.98 on July
19, 2016
-- Traded as high as $56.64; highest intraday level since March
1, 2019, when it hit $56.86
-- Up 4.68% at today's intraday high; largest intraday percent
increase since Aug. 3, 2018, when it rose as much as 4.81%
All data as of 3:02:02 PM
Source: Dow Jones Market Data, FactSet
(END) Dow Jones Newswires
March 21, 2019 15:29 ET (19:29 GMT)
Copyright (c) 2019 Dow Jones & Company, Inc.
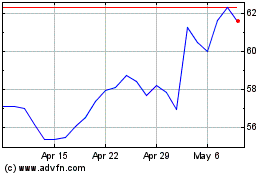
Kellanova (NYSE:K)
Historical Stock Chart
From Aug 2024 to Sep 2024

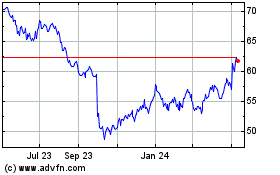
Kellanova (NYSE:K)
Historical Stock Chart
From Sep 2023 to Sep 2024
