| QUARTERLY RESULTS - 2Q23
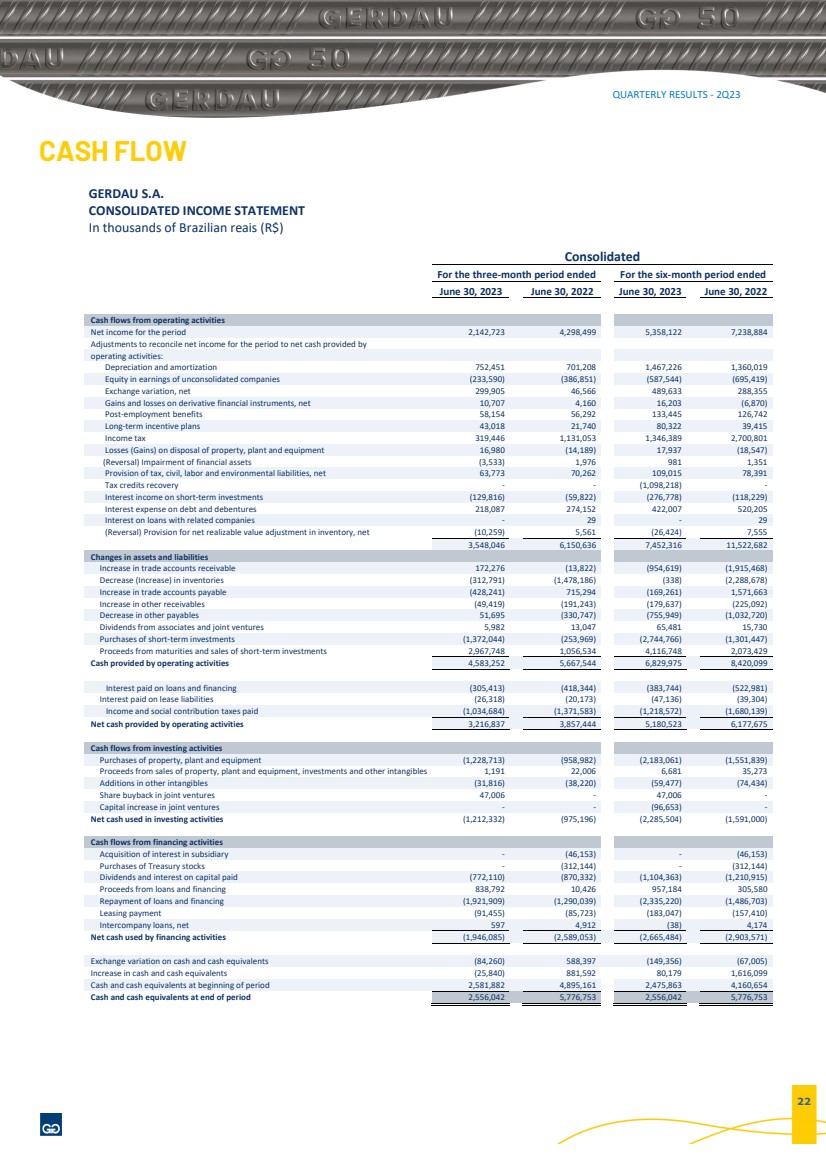
CASH FLOW
GERDAU S.A.
CONSOLIDATED INCOME STATEMENT
In thousands of Brazilian reais (R$)
Consolidated
For the three-month period ended For the six-month period ended
June 30, 2023 June 30, 2022 June 30, 2023 June 30, 2022
Cash flows from operating activities
Net income for the period 2,142,723 4,298,499 5,358,122 7,238,884
Adjustments to reconcile net income for the period to net cash provided by
operating activities:
Depreciation and amortization 752,451 701,208 1,467,226 1,360,019
Equity in earnings of unconsolidated companies (233,590) (386,851) (587,544) (695,419)
Exchange variation, net 299,905 46,566 489,633 288,355
Gains and losses on derivative financial instruments, net 10,707 4,160 16,203 (6,870)
Post-employment benefits 58,154 56,292 133,445 126,742
Long-term incentive plans 43,018 21,740 80,322 39,415
Income tax 319,446 1,131,053 1,346,389 2,700,801
Losses (Gains) on disposal of property, plant and equipment 16,980 (14,189) 17,937 (18,547)
(Reversal) Impairment of financial assets (3,533) 1,976 981 1,351
Provision of tax, civil, labor and environmental liabilities, net 63,773 70,262 109,015 78,391
Tax credits recovery - - (1,098,218) -
Interest income on short-term investments (129,816) (59,822) (276,778) (118,229)
Interest expense on debt and debentures 218,087 274,152 422,007 520,205
Interest on loans with related companies - 29 - 29
(Reversal) Provision for net realizable value adjustment in inventory, net (10,259) 5,561 (26,424) 7,555
3,548,046 6,150,636 7,452,316 11,522,682
Changes in assets and liabilities
Increase in trade accounts receivable 172,276 (13,822) (954,619) (1,915,468)
Decrease (Increase) in inventories (312,791) (1,478,186) (338) (2,288,678)
Increase in trade accounts payable (428,241) 715,294 (169,261) 1,571,663
Increase in other receivables (49,419) (191,243) (179,637) (225,092)
Decrease in other payables 51,695 (330,747) (755,949) (1,032,720)
Dividends from associates and joint ventures 5,982 13,047 65,481 15,730
Purchases of short-term investments (1,372,044) (253,969) (2,744,766) (1,301,447)
Proceeds from maturities and sales of short-term investments 2,967,748 1,056,534 4,116,748 2,073,429
Cash provided by operating activities 4,583,252 5,667,544 6,829,975 8,420,099
Interest paid on loans and financing (305,413) (418,344) (383,744) (522,981)
Interest paid on lease liabilities (26,318) (20,173) (47,136) (39,304)
Income and social contribution taxes paid (1,034,684) (1,371,583) (1,218,572) (1,680,139)
Net cash provided by operating activities 3,216,837 3,857,444 5,180,523 6,177,675
Cash flows from investing activities
Purchases of property, plant and equipment (1,228,713) (958,982) (2,183,061) (1,551,839)
Proceeds from sales of property, plant and equipment, investments and other intangibles 1,191 22,006 6,681 35,273
Additions in other intangibles (31,816) (38,220) (59,477) (74,434)
Share buyback in joint ventures 47,006 - 47,006 -
Capital increase in joint ventures - - (96,653) -
Net cash used in investing activities (1,212,332) (975,196) (2,285,504) (1,591,000)
Cash flows from financing activities
Acquisition of interest in subsidiary - (46,153) - (46,153)
Purchases of Treasury stocks - (312,144) - (312,144)
Dividends and interest on capital paid (772,110) (870,332) (1,104,363) (1,210,915)
Proceeds from loans and financing 838,792 10,426 957,184 305,580
Repayment of loans and financing (1,921,909) (1,290,039) (2,335,220) (1,486,703)
Leasing payment (91,455) (85,723) (183,047) (157,410)
Intercompany loans, net 597 4,912 (38) 4,174
Net cash used by financing activities (1,946,085) (2,589,053) (2,665,484) (2,903,571)
Exchange variation on cash and cash equivalents (84,260) 588,397 (149,356) (67,005)
Increase in cash and cash equivalents (25,840) 881,592 80,179 1,616,099
Cash and cash equivalents at beginning of period 2,581,882 4,895,161 2,475,863 4,160,654
Cash and cash equivalents at end of period 2,556,042 5,776,753 2,556,042 5,776,753
22 |