Equus Announces Second Quarter Net Asset Value
August 15 2023 - 4:15PM

Equus Total Return, Inc. (NYSE: EQS) (“Equus” or
the “Company”) reports net assets as of June 30, 2023, of $40.1
million. Net asset value per share increased to $2.96 as of June
30, 2023, from $2.52 as of March 31, 2023. Comparative data is
summarized below (in thousands, except per share
amounts):
|
As of the Quarter Ended |
6/30/2023 |
3/31/2023 |
12/31/2022 |
9/30/2022 |
6/30/2022 |
|
Net assets |
$40,051 |
$34,106 |
$35,237 |
$36,230 |
$37,155 |
|
Shares outstanding |
13,518 |
13,518 |
13,518 |
13,518 |
13,518 |
|
Net assets per share |
$2.96 |
$2.52 |
$2.61 |
$2.68 |
$2.75 |
The following was the principal contributor to
the increase in fair value of the Company’s portfolio holdings in
the second quarter of 2023:
Investment in Morgan E&P. On
May 22, 2023, Morgan E&P, LLC (“Morgan”), a wholly owned
subsidiary of the Company completed the acquisition of 4,747.52 net
acres, in the Bakken/Three Forks formation in the Williston Basin
of North Dakota. Additional acreage of up to 6,705 net acres will
also be acquired in the coming months. During the six months ended
June 30, 2023, we made a $750,000 investment in Morgan. As of June
30, 2023, we recorded the fair value of Morgan at approximately
$7.5 million. The fair value is based principally on our
expectation of Morgan drilling new wells and generating operating
cash flow therefrom in the future.
The Company received advice and assistance from
a third-party valuation firm to support its determination of the
fair value of this investment.
About Equus
The Company is a business development company
that trades as a closed-end fund on the New York Stock Exchange
under the symbol "EQS". Additional information on the Company may
be obtained from the Company’s website at www.equuscap.com.
This press release may contain certain
forward-looking statements regarding future circumstances. These
forward-looking statements are based upon the Company’s current
expectations and assumptions and are subject to various risks and
uncertainties that could cause actual results to differ materially
from those contemplated in such forward-looking statements
including, in particular, the performance of the Company, including
our ability to achieve our expected financial and business
objectives, and the other risks and uncertainties described in the
Company’s filings with the SEC. Actual results, events, and
performance may differ. Readers are cautioned not to place undue
reliance on these forward-looking statements, which speak only as
to the date hereof. Except as required by law, the Company
undertakes no obligation to release publicly any revisions to these
forward-looking statements that may be made to reflect events or
circumstances after the date hereof or to reflect the occurrence of
unanticipated events. The inclusion of any statement in this
release does not constitute an admission by the Company or any
other person that the events or circumstances described in such
statements are material.
Contact:
Patricia Baronowski Pristine Advisers, LLC(631) 756-2486
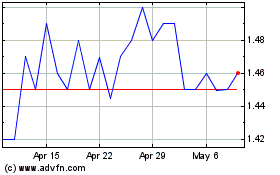
Equus Total Return (NYSE:EQS)
Historical Stock Chart
From Mar 2024 to Apr 2024

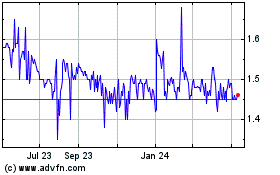
Equus Total Return (NYSE:EQS)
Historical Stock Chart
From Apr 2023 to Apr 2024
