SECURITIES AND EXCHANGE COMMISSION
Washington, D.C. 20549
FORM 6-K
Report of Foreign Private Issuer
Pursuant to Rule 13a-16 or 15d-16 of the
Securities Exchange Act of 1934
For the month of December, 2023
Commission File Number 1-14732
COMPANHIA SIDERÚRGICA NACIONAL
(Exact name of registrant as specified in its charter)
National Steel Company
(Translation of Registrant's name into English)
Av. Brigadeiro Faria Lima 3400, 20º andar
São Paulo, SP, Brazil
04538-132
(Address of principal executive office)
Indicate by check mark whether the registrant files or will file annual reports
under cover Form 20-F or Form 40-F. Form 20-F ___X___ Form 40-F _______
Indicate by check mark whether the registrant by furnishing the information contained in this Form is also thereby furnishing the information to the Commission pursuant to Rule 12g3-2(b) under the Securities Exchange Act of 1934.
Yes _______ No ___X____
Quarterly Financial Information – September 30, 2023 – Companhia Siderúrgica Nacional (CONVENIENCE TRANSLATION INTO ENGLISH FROM THE ORIGINAL PREVIOUSLY ISSUED IN PORTUGUESE) |  |
Table of Contents
| Company Information |
|
| Capital Breakdown |
1 |
| Parent Company Financial Statements |
|
| Balance Sheet – Assets |
2 |
| Balance Sheet – Liabilities |
3 |
| Statement of Income |
4 |
| Statement of Comprehensive Income |
5 |
| Statement of Cash Flows |
6 |
| Statement of Changes in Shareholders’ Equity |
|
| 01/01/2023 to 09/30/2023 |
7 |
| 01/01/2022 to 09/30/2022 |
8 |
| Statement of Value Added |
9 |
| Consolidated Financial Statements |
|
| Balance Sheet – Assets |
10 |
| Balance Sheet - Liabilities |
11 |
| Statement of Income |
12 |
| Statement of Comprehensive Income |
13 |
| Statement of Cash Flows |
14 |
| Statement of Changes in Shareholders’ Equity |
|
| 01/01/2023 to 09/30/2023 |
15 |
| 01/01/2022 to 09/30/2022 |
16 |
| Statement of Value Added |
17 |
| Comments on the Company’s Consolidated Performance |
18 |
| Notes to the financial information |
39 |
| Comments on the Performance of Business Projections |
86 |
| Reports and Statements |
|
| Unqualified Independent Auditors’ Review Report |
90 |
| Officers Statement on the Financial Statements |
91 |
| Officers Statement on Auditor’s Report |
92 |
Quarterly Financial Information – September 30, 2023 – Companhia Siderúrgica Nacional (CONVENIENCE TRANSLATION INTO ENGLISH FROM THE ORIGINAL PREVIOUSLY ISSUED IN PORTUGUESE) | |
Company Information / Capital Breakdown
|
Number of Shares
(Units) |
Current Period
9/30/2023 |
|
| Paid-in Capital |
|
|
| Common |
1,326,093,947 |
|
| Preferred |
0 |
|
| Total |
1,326,093,947 |
|
| Treasury Shares |
|
|
| Common |
0 |
|
| Preferred |
0 |
|
| Total |
0 |
|
Quarterly Financial Information – September 30, 2023 – Companhia Siderúrgica Nacional (CONVENIENCE TRANSLATION INTO ENGLISH FROM THE ORIGINAL PREVIOUSLY ISSUED IN PORTUGUESE) | |
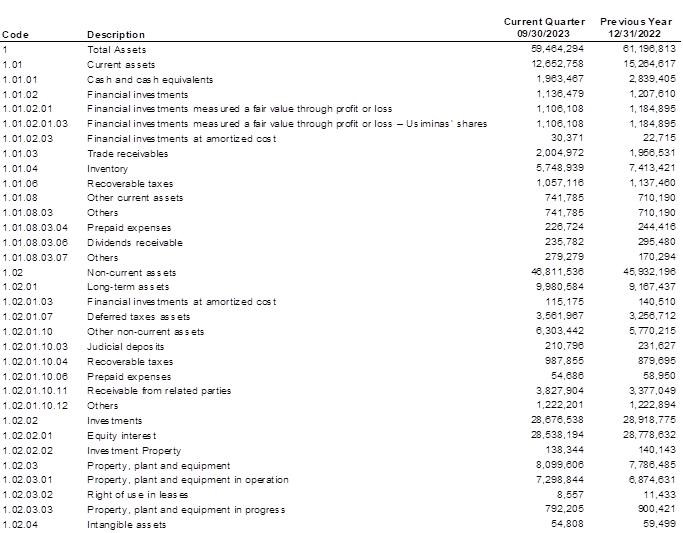
| Parent Company Financial Statements / Balance Sheet - Assets |
|
| (R$ thousand) |
|
|
| |
|
|
Quarterly Financial Information – September 30, 2023 – Companhia Siderúrgica Nacional (CONVENIENCE TRANSLATION INTO ENGLISH FROM THE ORIGINAL PREVIOUSLY ISSUED IN PORTUGUESE) | |
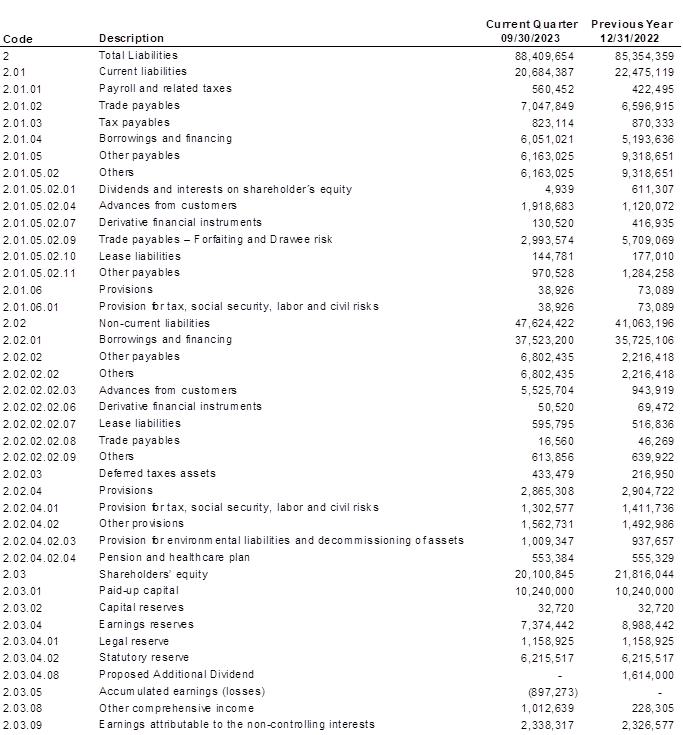
| Parent Company Financial Statements / Balance Sheet – Liabilities |
| (R$ thousand) |
|
|
|

Quarterly Financial Information – September 30, 2023 – Companhia Siderúrgica Nacional (CONVENIENCE TRANSLATION INTO ENGLISH FROM THE ORIGINAL PREVIOUSLY ISSUED IN PORTUGUESE) | |
| Parent Company Financial Statements / Statement of Income |
| (R$ thousand) |
|

Quarterly Financial Information – September 30, 2023 – Companhia Siderúrgica Nacional (CONVENIENCE TRANSLATION INTO ENGLISH FROM THE ORIGINAL PREVIOUSLY ISSUED IN PORTUGUESE) | |
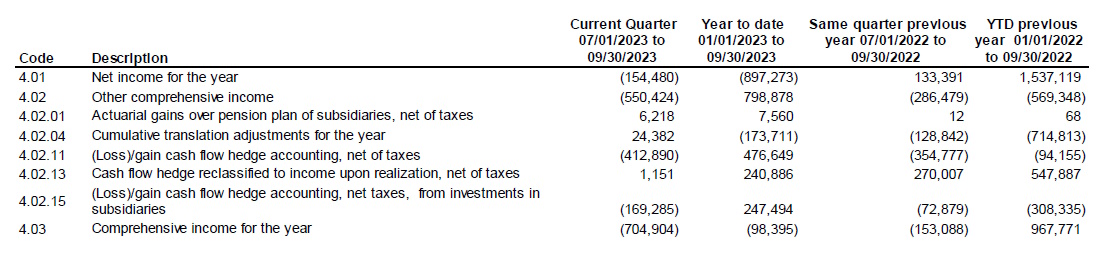
| Parent Company Financial Statements / Statement of Comprehensive Income |
| (R$ thousand) |
Quarterly Financial Information – September 30, 2023 – Companhia Siderúrgica Nacional (CONVENIENCE TRANSLATION INTO ENGLISH FROM THE ORIGINAL PREVIOUSLY ISSUED IN PORTUGUESE) | |
| Parent Company Financial Statements / Statements of Cash Flows – Indirect Method |
| (R$ thousand) |

Quarterly Financial Information – September 30, 2023 – Companhia Siderúrgica Nacional (CONVENIENCE TRANSLATION INTO ENGLISH FROM THE ORIGINAL PREVIOUSLY ISSUED IN PORTUGUESE) | |
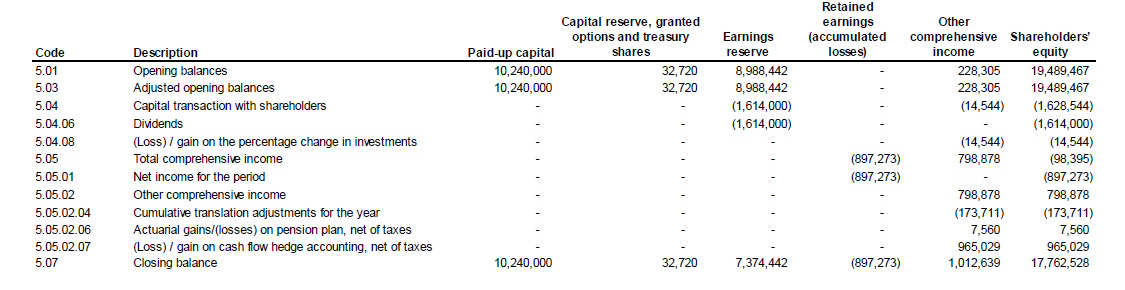
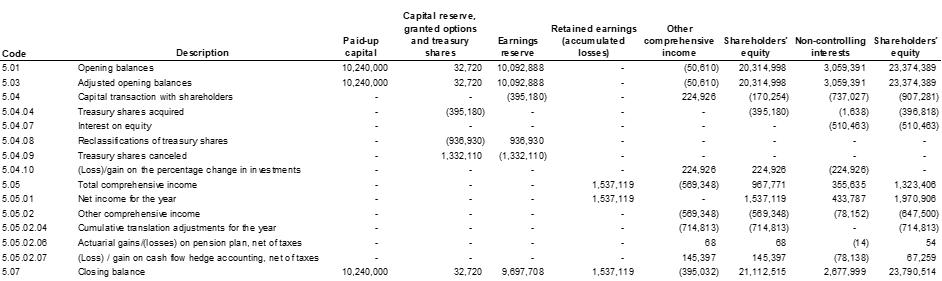
| Parent Company Financial Statements / Statement of Changes in Equity - 01/01/2023 to 09/30/2023 |
| (R$ thousand) |
|
|
|
|
|
Quarterly Financial Information – September 30, 2023 – Companhia Siderúrgica Nacional (CONVENIENCE TRANSLATION INTO ENGLISH FROM THE ORIGINAL PREVIOUSLY ISSUED IN PORTUGUESE) | |
| Parent Company Financial Statements / Statement of Changes in Equity - 01/01/2022 to 09/30/2022 |
| (R$ thousand) |
|
|
|
|

Quarterly Financial Information – September 30, 2023 – Companhia Siderúrgica Nacional (CONVENIENCE TRANSLATION INTO ENGLISH FROM THE ORIGINAL PREVIOUSLY ISSUED IN PORTUGUESE) | |
| Parent Company Financial Statements / Statement of Value Added |
| (R$ thousand) |

Quarterly Financial Information – September 30, 2023 – Companhia Siderúrgica Nacional (CONVENIENCE TRANSLATION INTO ENGLISH FROM THE ORIGINAL PREVIOUSLY ISSUED IN PORTUGUESE) | |
| Consolidated Financial Statements / Balance Sheet - Assets |
| (R$ thousand) |
|

Quarterly Financial Information – September 30, 2023 – Companhia Siderúrgica Nacional (CONVENIENCE TRANSLATION INTO ENGLISH FROM THE ORIGINAL PREVIOUSLY ISSUED IN PORTUGUESE) | |
| Consolidated Financial Statements / Balance Sheet – Liabilities |
| (R$ thousand) |
|
| |
|
Quarterly Financial Information – September 30, 2023 – Companhia Siderúrgica Nacional (CONVENIENCE TRANSLATION INTO ENGLISH FROM THE ORIGINAL PREVIOUSLY ISSUED IN PORTUGUESE) | |


Quarterly Financial Information – September 30, 2023 – Companhia Siderúrgica Nacional (CONVENIENCE TRANSLATION INTO ENGLISH FROM THE ORIGINAL PREVIOUSLY ISSUED IN PORTUGUESE) | |
| Consolidated Financial Statements / Statement of Comprehensive Income |
| (R$ thousand) |

Quarterly Financial Information – September 30, 2023 – Companhia Siderúrgica Nacional (CONVENIENCE TRANSLATION INTO ENGLISH FROM THE ORIGINAL PREVIOUSLY ISSUED IN PORTUGUESE) | |
| Consolidated Financial Statements / Statements of Cash Flows – Indirect Method |

Quarterly Financial Information – September 30, 2023 – Companhia Siderúrgica Nacional (CONVENIENCE TRANSLATION INTO ENGLISH FROM THE ORIGINAL PREVIOUSLY ISSUED IN PORTUGUESE) | |
Quarterly Financial Information – September 30, 2023 – Companhia Siderúrgica Nacional (CONVENIENCE TRANSLATION INTO ENGLISH FROM THE ORIGINAL PREVIOUSLY ISSUED IN PORTUGUESE) | |
| Consolidated Financial Statements / Statements of Changes in Equity - 01/01/2023 to 09/30/2023 |
| (R$ thousand) |
|
|
|
|
|

Quarterly Financial Information – September 30, 2023 – Companhia Siderúrgica Nacional (CONVENIENCE TRANSLATION INTO ENGLISH FROM THE ORIGINAL PREVIOUSLY ISSUED IN PORTUGUESE) | |
| Consolidated Financial Statements / Statements of Changes in Equity - 01/01/2022 to 09/30/2022 |
| (R$ thousand) |
|
|
|
|
Quarterly Financial Information – September 30, 2023 – Companhia Siderúrgica Nacional (CONVENIENCE TRANSLATION INTO ENGLISH FROM THE ORIGINAL PREVIOUSLY ISSUED IN PORTUGUESE) | |
| Consolidated Financial Statements / Statements of Value Added |
| (R$ thousand) |

Quarterly Financial Information – September 30, 2023 – Companhia Siderúrgica Nacional (CONVENIENCE TRANSLATION INTO ENGLISH FROM THE ORIGINAL PREVIOUSLY ISSUED IN PORTUGUESE) | |
Quarterly Financial Information – September 30, 2023 – Companhia Siderúrgica Nacional (CONVENIENCE TRANSLATION INTO ENGLISH FROM THE ORIGINAL PREVIOUSLY ISSUED IN PORTUGUESE) | |
Quarterly Financial Information – September 30, 2023 – Companhia Siderúrgica Nacional (CONVENIENCE TRANSLATION INTO ENGLISH FROM THE ORIGINAL PREVIOUSLY ISSUED IN PORTUGUESE) | |
Consolidated Table - Highlights

¹ Adjusted EBITDA is calculated from net income
(loss), plus depreciation and amortization, taxes on profit, net financial result, investment participation result, other operating income/expenses
result and includes the proportional share of 37.27% of the EBITDA of the joint subsidiary MRS Logística.
² Adjusted EBITDA Margin is calculated from Adjusted
EBITDA divided by Management Net Revenue.
³ Adjusted Net Debt and Adjusted Cash/Availability
consider 37.27% of MRS, in addition to not considering Forfaiting and Drawn Risk operations.
Consolidated Results
| · | Net Revenue totaled R$ 11,125 million
in 3Q23, which represents an increase of 1.2% when compared to 2Q23, mainly as a result of the strong performance in the mining segment,
which combined a new sales record with an increase in realized price. In addition, the logistics and cement segments also contributed
positively to the higher revenues recorded in the period. |
| · | Cost of Goods Sold (COGS) totaled R$
8,320 million in 3Q23, down 4.9% from the previous quarter, reflecting the normalization of production in the steel industry. |
| · | In 3Q23, CSN recorded Gross Profit of R$ 2,805
million, with a Gross Margin of 25.2% or 4.8 p.p. higher than in the previous quarter. This growth in profitability reflects the
strong operational performance seen in the period, in addition to the positive effect of the increase in the exchange rate on sales to
the foreign market. |
| · | Selling, General and Administrative Expenses
totaled R$ 1,175 million in 3Q23, 8.6% higher than in 2Q23, as a result of the higher volume sold in mining, resulting in higher freight
expenses. |
| · | The group of Other Revenues and Operating
Expenses was negative by R$ 113 million in 3Q23, which represents a reduction of 11.5% compared to 2Q23, explained by the positive
effect of iron ore hedging operations, which generated a gain of R$ 31 million in the period. |
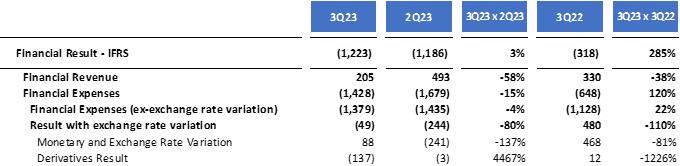
| · | In 3Q23, the Financial Result was negative
by R$ 1,223 million, in line with the previous quarter, as a consequence of the maintenance of the cost of debt and a lesser impact of
Usiminas' shares. |
Quarterly Financial Information – September 30, 2023 – Companhia Siderúrgica Nacional (CONVENIENCE TRANSLATION INTO ENGLISH FROM THE ORIGINAL PREVIOUSLY ISSUED IN PORTUGUESE) | |
| · | Equity Result was positive by R$ 131
million in 3Q23, an increase of 22.4% compared to the previous quarter, as a result of the strong performance achieved by MRS. |

| · | CSN recorded Net Income of R$ 91 million
in 3Q23, which represents a reduction of 67.8% compared to the previous quarter, as 2Q23 was positively impacted by a reversal of
the provision with IR/CSLL. This situation ended up offsetting the operational improvement seen in this quarter. |
Adjusted EBITDA
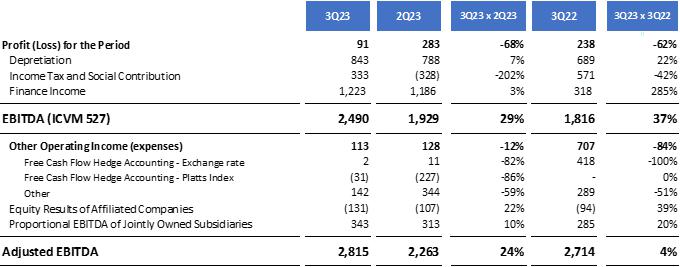
*The Company discloses its Adjusted EBITDA excluding
participation in investments and other operating income (expenses) because it understands that they should not be considered in the calculation
of recurring operating cash generation.
| · | In 3Q23, Adjusted EBITDA was R$ 2,815 million,
with an Adjusted EBITDA Margin of 24.3% or 4.7 p.p. above that seen in the last quarter. This increase in profitability is a direct
consequence of the improvement in prices in the mining segment, which, combined with a higher sales volume, ended up offsetting the more
challenging situation in the steel segment. Additionally, the stronger performance achieved in the logistics segment and the positive dynamics seen in the cement segment, with
price increases and capture of synergies, also contributed favorably to the EBITDA improvement. |
Quarterly Financial Information – September 30, 2023 – Companhia Siderúrgica Nacional (CONVENIENCE TRANSLATION INTO ENGLISH FROM THE ORIGINAL PREVIOUSLY ISSUED IN PORTUGUESE) | |
Adjusted EBITDA (R$ MM) and Adjusted
EBITDA Margin¹ (%)

¹ The Adjusted EBITDA Margin is calculated from
the division between Adjusted EBITDA and Adjusted Net Revenue, which considers the interests of 100% in the consolidation of CSN Mineração
and 37.27% in MRS.
Adjusted Cash Flow
Adjusted Cash Flow in 3Q23 was positive by R$ 1,022
million, as a result of the combination of strong operating performance and efficient working capital management, yet with another reduction
in inventory observed during the period.
Adjusted cash flow¹ in 3Q23
(R$ MM)
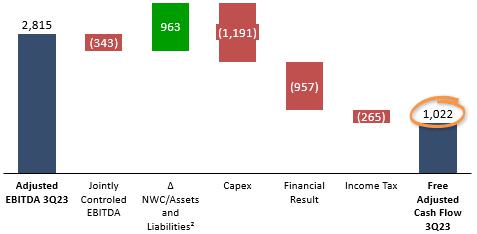
¹ The concept of Adjusted cash flow is calculated
from Adjusted EBITDA, subtracting Ebitda from Joint Subsidiaries, CAPEX, IR, Financial Result and changes in Assets and Liabilities²,
excluding the effect of the Glencore advance.
² The Adjusted Working Capital is composed of
the variation of the Net Working Capital, plus the variation of accounts of long-term assets and liabilities and disregarding the net
variation of IR and CS.
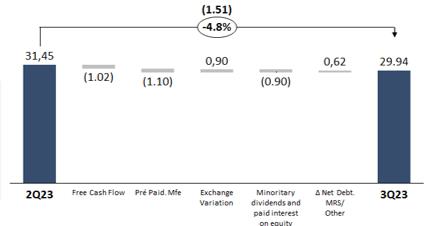
Indebtedness
On 09/30/2023, consolidated net debt reached R$ 29,939
million, with the leverage indicator measured by the LTM Net Debt/EBITDA ratio reaching 2.63x, which represents a reduction of 150 basis
points compared to the previous quarter. With the peak leverage of the year behind us, the Company remains firm in its path of reducing
its debt ratio and is on track to deliver an increasingly solid capital structure, even more so when considering the normalization of
the steel operation and the growth potential of the cement segment, after
synergy captures are complete. In addition, CSN maintained its policy of carrying a high cash position, which reached R$ 16 billion in
this quarter.
Quarterly Financial Information – September 30, 2023 – Companhia Siderúrgica Nacional (CONVENIENCE TRANSLATION INTO ENGLISH FROM THE ORIGINAL PREVIOUSLY ISSUED IN PORTUGUESE) | |
Indebtedness (R$ Billion) and
Net Debt / Adjusted EBITDA (x)
|
|
Net Debt Build-Up
(R$ Billions) |
 |
|
 |
¹ Net Debt / EBITDA: For debt calculation considers the final dollar
of each period and for net debt and EBITDA the average dollar of the period.
The Company remains very active in its objective
of extending the amortization period, focusing on long-term operations and the local capital market. Among the main transactions in 3Q23,
CSN's 14th issuance of simple debentures stands out, in the total amount of R$ 700 million, with the objective of investing
in railway infrastructure, in the logistics and transportation segment.
Amortization Schedule (R$ Bi)
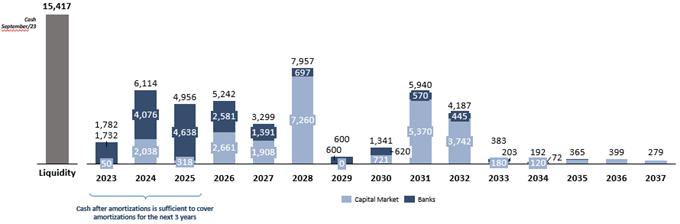
¹ IFRS: does not consider participation in MRS
(37.27%).
² Management Gross / Net Debt considers participation
in MRS (37.27%), without accrued interest.
3 Average Term after completion of the Liability Management
Plan.
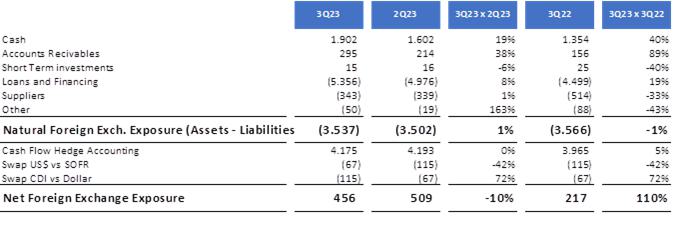
Foreign Exchange Exposure
The accumulated net foreign
exchange exposure in the consolidated balance sheet up to 3Q23 was US$ 456 million, as shown in the table below, in line with the company's
policy of minimizing the impacts of exchange rate volatility on the result. The Hedge Accounting adopted by CSN correlates the
projected flow of dollar exports in dollars with the future maturities of the debt in the same currency. As a result, the exchange variation
of the dollar debt is temporarily recorded in the shareholders' equity and is taken to the result when the dollar revenues from such exports
occur.
Quarterly Financial Information – September 30, 2023 – Companhia Siderúrgica Nacional (CONVENIENCE TRANSLATION INTO ENGLISH FROM THE ORIGINAL PREVIOUSLY ISSUED IN PORTUGUESE) | |
Investments
A total of R$ 1,191 million were invested in 3Q23,
20.2% higher than the amount invested in 2Q23, with emphasis on repairs to coke batteries at UPV and general repairs to steel operations.
In the mining segment, we highlight the current investments to maintain operational capacity and progress in expansion projects (mainly
related to P15, recovery of tailings from dams and expansion of the Itaguaí port), accompanied by current investments in cement
operations.

Net Working Capital
Net Working Capital applied to the business totaled
R$ 1,922 million in 3Q23, a reduction of 36.1% compared to 2Q23, due to (i) the Company's lower inventory volume, in line with
the increase in sales recorded in the period, and (ii) an increase in the number of CSN suppliers.
The calculation of the Net Working Capital applied
to the business disregards the advance on the sales of ore, as shown in the following table:
Quarterly Financial Information – September 30, 2023 – Companhia Siderúrgica Nacional (CONVENIENCE TRANSLATION INTO ENGLISH FROM THE ORIGINAL PREVIOUSLY ISSUED IN PORTUGUESE) | |
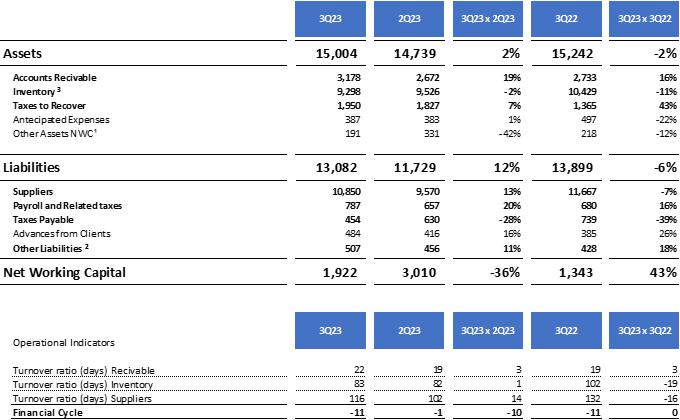
¹ Other CCL Assets: Considers
employee advances and other accounts receivable.
² Other CCL Liabilities:
Considers other accounts payable, dividends payable, installment taxes and other provisions.
³ Inventories: Does not
consider the effect of the provision for inventory/inventory losses. For the calculation of the SME, the balances of warehouse stocks
are not considered.
Quarterly Financial Information – September 30, 2023 – Companhia Siderúrgica Nacional (CONVENIENCE TRANSLATION INTO ENGLISH FROM THE ORIGINAL PREVIOUSLY ISSUED IN PORTUGUESE) | |
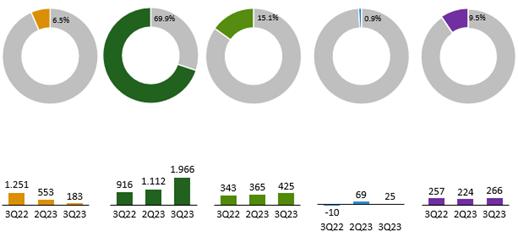
Results by Business Segments
Net Revenue by Segment – 3Q23 (R$ million-before
eliminations)

Adjusted EBITDA by Segment – 3Q23 (R$ million
- before eliminations)
Quarterly Financial Information – September 30, 2023 – Companhia Siderúrgica Nacional (CONVENIENCE TRANSLATION INTO ENGLISH FROM THE ORIGINAL PREVIOUSLY ISSUED IN PORTUGUESE) | |
| 3Q23 Results (R$ million) |
Steel |
Mining |
Logistics (Port) |
Logistics (Rail) |
Energy |
Cement |
Corporate Expenses/
Eliminations |
Consolidated |
| |
|
|
|
|
|
|
|
|
| Net Revenue |
5,344 |
4,335 |
75 |
730 |
122 |
1,159 |
(640) |
11,125 |
| Internal Market |
4,130 |
567 |
75 |
730 |
122 |
1,159 |
(1,170) |
5,613 |
| Foreign Market |
1,214 |
3,768 |
- |
- |
- |
- |
530 |
5,512 |
| COGS |
(5,209) |
(2,567) |
(65) |
(367) |
(106) |
(915) |
909 |
(8,320) |
| Gross profit |
135 |
1,768 |
10 |
363 |
16 |
244 |
270 |
2,805 |
| DGA/DVE |
(299) |
(71) |
(3) |
(57) |
(16) |
(145) |
(588) |
(1,175) |
| Depreciation |
346 |
269 |
12 |
100 |
25 |
167 |
(77) |
842 |
| Proportional EBITDA of jointly controlled Companies |
- |
- |
- |
- |
|
- |
343 |
343 |
| Adjusted EBITDA |
183 |
1,966 |
19 |
406 |
25 |
266 |
(50) |
2,815 |
| |
|
|
|
|
|
|
|
|
| 2Q23 Results (R$ million) |
Steel |
Mining |
Logistics (Port) |
Logistics (Rail) |
Energy |
Cement |
Corporate Expenses/
Eliminations |
Consolidated |
| |
|
|
|
|
|
|
|
|
| Net Revenue |
5,943 |
3,631 |
54 |
668 |
159 |
1,142 |
(609) |
10,989 |
| Internal Market |
4,368 |
372 |
54 |
668 |
159 |
1,142 |
(1,012) |
5,752 |
| Foreign Market |
1,574 |
3,260 |
- |
- |
- |
- |
403 |
5,237 |
| COGS |
(5,419) |
(2,626) |
(61) |
(352) |
(100) |
(952) |
765 |
(8,746) |
| Gross profit |
523 |
1,006 |
(7) |
316 |
59 |
191 |
156 |
2,243 |
| DGA/DVE |
(288) |
(147) |
(3) |
(51) |
(15) |
(123) |
(455) |
(1,082) |
| Depreciation |
318 |
254 |
13 |
98 |
24 |
156 |
(75) |
788 |
| Proportional EBITDA of jointly controlled Companies |
- |
|
- |
- |
- |
- |
313 |
313 |
| Adjusted EBITDA |
553 |
1,112 |
3 |
362 |
69 |
224 |
(60) |
2,263 |
| |
|
|
|
|
|
|
|
|
| 3Q22 Results (R$ million) |
Steel |
Mining |
Logistics (Port) |
Logistics (Rail) |
Energy |
Cement |
Corporate Expenses/
Eliminations |
Consolidated |
| |
|
|
|
|
|
|
|
|
| Net Revenue |
7,698 |
2,527 |
69 |
653 |
48 |
778 |
(875) |
10,897 |
| Internal Market |
5,655 |
438 |
69 |
653 |
48 |
778 |
(1,091) |
6,549 |
| Foreign Market |
2,044 |
2,089 |
- |
- |
- |
- |
215 |
4,348 |
| COGS |
(6,426) |
(1,800) |
(54) |
(397) |
(53) |
(501) |
873 |
(8,359) |
| Gross profit |
1,272 |
727 |
14 |
256 |
(5) |
276 |
(3) |
2,538 |
| DGA/DVE |
(334) |
(63) |
(7) |
(37) |
(10) |
(100) |
(248) |
(798) |
| Depreciation |
313 |
253 |
9 |
108 |
4 |
82 |
(78) |
689 |
| Proportional EBITDA of jointly controlled Companies |
- |
- |
- |
- |
- |
- |
285 |
285 |
| Adjusted EBITDA |
1,251 |
916 |
16 |
327 |
(10) |
257 |
(44) |
2,713 |
Results of the Steel Industry
According to the World Steel
Association (WSA), global crude steel production totaled 460.4 million tons (Mt) in the third quarter of 2023, which represents a decrease
of 4.5% compared to the previous quarter as a consequence of the seasonality of the period, but an increase of 1.9% compared to the same
period in 2022, reflecting the higher level of activity in the Chinese market. The European Union reduced its production by 9.9% compared
to the previous quarter and 6.5% compared to the same period last year, impacted by the environment of high interest rates, inflation
and still high energy costs. In turn, China produced 56.3% of the global volume (259.3 Mt) in 3Q23, which corresponds to a quarterly reduction
of 5.3 p.p., but an increase of 2.8 p.p. compared to the same period of the previous year. The expectations for 2023 remain positive as
Chinese government incentives indicate a prospect of a 1.8% increase in global steel production, after a 3.3% contraction in 2022. Brazil,
on the other hand, produced 8.0 Mt in 3Q23, which corresponds to a decrease of 2.4% in relation to the previous quarter and 3.6% when
compared to the same period of the previous year, mainly impacted by the increase in imports. The outlook for local market activity in
2023 is less encouraging, even after the normalization of production by relevant players, but with intense competition with imported material
and with demand still responding slowly to the cycle of cuts in the Selic rate and government stimulus through programs such as PAC, Minha
Casa, Minha Vida, Plano Safra and etc.
Quarterly Financial Information – September 30, 2023 – Companhia Siderúrgica Nacional (CONVENIENCE TRANSLATION INTO ENGLISH FROM THE ORIGINAL PREVIOUSLY ISSUED IN PORTUGUESE) | |
Steel Production (thousand tons)
In the case of CSN, Slab Production in 3Q23
totaled 922 thousand tons, a performance 25.9% higher than in the previous quarter, which reflects the normalization of the operation
after a series of bottlenecks faced in the first semester. In turn, the production of flat rolled products, our main market, reached 835
Kton, which represents an increase of 7.8% compared to 2Q23, reflecting the resumption of the production process and bringing the volume
produced to numbers closer to previous periods.
Sales Volume (Kton) – Steel
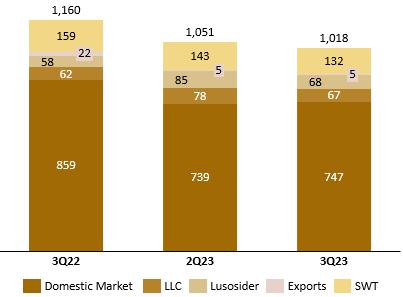
Total sales reached 1,018 thousand tons in
the third quarter of 2023, a volume 3.1% lower than in 2Q23. When analyzing the behavior in different markets, it can be seen that
the domestic market showed growth even with all the pressure faced with imported products, with emphasis on the hot rolled products
performance. Domestic sales totaled 747 thousand tons of steel products in 3Q23, which represents an increase of 1.1% compared
to 2Q23 and reinforces the normalization of the operation and the Company's resilience in managing to maintain an assertive commercial
strategy even with all the pressure seen in the period. In the foreign market, sales totaled 271 thousand tons in 3Q23 and were
13.0% lower than in 2Q23, as a result of seasonality and weaker dynamics in the European market. During the quarter, 5,000 tons were
exported directly, and 267,000 tons were sold by subsidiaries abroad, of which, 67,000 tons were sold by LLC, 132,000 tons by SWT and
68,000 tons by Lusosider.
Regarding total Sales Volume in 3Q23, the
main highlight was the flat steel segment for construction, with a 24.1% increase compared to the previous quarter. On the other hand,
Automotive (-11.9%) and Home Appliances (-4.2%) appear among the main negative highlights after a stronger start to the year. In the year-on-year
comparison, there was a significant recovery in Home Appliances and flat steel for construction, but with decreases in the other segments.
Quarterly Financial Information – September 30, 2023 – Companhia Siderúrgica Nacional (CONVENIENCE TRANSLATION INTO ENGLISH FROM THE ORIGINAL PREVIOUSLY ISSUED IN PORTUGUESE) | |
| According to ANFAVEA (National Association of Automotive Vehicle
Manufacturers), production in 3Q23 registered 619 thousand units,
an increase of 3.8% over the previous quarter. According to the Association, the volume of vehicle registrations increased by 19.8% in
the third quarter.
When looking at data from the Brazil Steel Institute
(IABr), Crude Steel production in 3Q23 reached 7.96 Mton, a performance 6.6% lower than in the same period of 2022 and 1.6% below
2Q23. Apparent Consumption was 6.34 Mton, an increase of 2.8% year-on-year and 7.9% compared to 2Q23. In turn, the Steel Industry Confidence
Indicator (ICIA) for September was 37.7 points, which represents a reduction of 4.9 p.p. compared to December 2022, a performance that
reflects all the dissatisfaction and insecurity with the greater entry of imported products into the Brazilian market.
According to IBGE data, the production
of home appliances for the month of September 2023 registered an increase of 6.8% compared to the previous year, reinforcing the continuous
improvement of the home appliances segment after the weak performance observed last year.
|
|
Sales by Market Segment
 |
| · | Net Revenue in the Steel Industry reached
R$ 5,344 million in 3Q23, a performance 10.1% lower than in 2Q23, as a result of the adjustment in prices in the domestic market
and the lower dynamism in the foreign market. In this sense, the Average Price in 3Q23 in the domestic market was 6.7% lower than
in 2Q23, which shows the pressure exerted by imported material. On the other hand, the price in the foreign market was even lower, with
a drop of 11.5% compared to the previous quarter, impacted both by lower commercial activity and by a greater penetration of external
material at more competitive prices. |
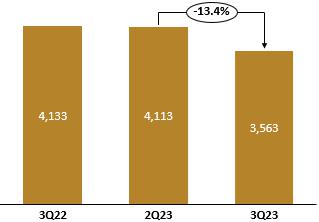
| · | In turn, the Slab Cost in 3Q23 reached
R$ 3,563/t, a reduction of 13.4% compared to the previous quarter, as a direct consequence of the normalization of production, helping
to dilute fixed costs, in addition to the lower volume of plates purchased. |
Slab Cost with deprec. (R$/t)
|
|
3Q23 Production Cost
|
 |
|
 |
| · | The steel industry's Adjusted EBITDA
reached R$ 183 million in 3Q23 and was 67.0% lower than in 2Q23, with an Adjusted EBITDA Margin of 3.4% (-5.9 p.p.). This result
reflects the combination of a weaker foreign market and a domestic performance marked by operational normalization and price adjustments
in order to make the local product more competitive. On the other hand, it
is worth highlighting the transient effect of this lower profitability, as all necessary adjustments have already been made, while a gradual
recovery of the Brazilian market is becoming evident. |
Quarterly Financial Information – September 30, 2023 – Companhia Siderúrgica Nacional (CONVENIENCE TRANSLATION INTO ENGLISH FROM THE ORIGINAL PREVIOUSLY ISSUED IN PORTUGUESE) | |
|
Adjusted EBITDA and Steel Margin
(R$ MM and %) |

Mining Result
In the mining sector, the quarter was marked by
high demand for iron ore in China and an improvement in price levels, with the appreciation of Platts that closed 3Q23 US$ 3.06 above
the average observed in the previous quarter. Steel production in China remains at high levels, leading to increases in capacity utilization
at Chinese steel mills and low levels of ore inventories at both Chinese mills and ports. This situation ended up weighing favorably
on the price of ore and has been driven by the Chinese government's stimulus packages, in an attempt to inject liquidity into the economy
and ensure low financing costs for the consumer, manufacturing, infrastructure and real estate segments. Such moves have boosted demand
for iron ore, including for lower-quality products as margins at Chinese steel mills remain quite tight. In this scenario, the iron
ore price closed 3Q23 with an average of US$ 114.04/dmt (Platts, Fe62%, N. China), 2.8% higher than in 2Q23 (US$ 110.98/dmt) and
10.4% higher than in 3Q22 (US$ 103.31 /dmt).
Regarding Sea Freight, the BCI-C3 Route (Tubarão-Qingdao)
presented an average of US$ 20.3/wmt in 3Q23, which represents a reduction of 3.6% compared to the freight cost of the previous
quarter, as a reflection of the increase in spot supply in the Atlantic Ocean. In addition, the rainy season in Africa and the large amount
of cargo negotiated within contracts supported this scenario, helping to offset the increase in fuel prices in the period.
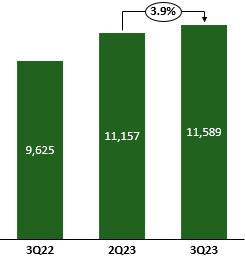
Total Production – Mining
(Thousand tons)
|
|
Sales Volume – Mining
(Thousand tons) |
 |
|
 |
| · | Iron Ore Production added yet another
record volume of 11,589 thousand tons in 3Q23, which represents an increase of 3.9% compared to the volume recorded in 2Q23 and an increase
of 20.4% compared to the same period last year. This is the second consecutive production record achieved by the Company and confirms
the excellent operational momentum seen this year, even more so when it is
observed that there was a significant improvement in the mix of own production and consequent reduction in the volume of purchases
from third parties when compared to the previous period. Additionally, the performance achieved in 9M23 places CSN in a comfortable position
to revise its production and purchase guidance to 42.0 - 42.5 Mton stipulated for 2023. |
Quarterly Financial Information – September 30, 2023 – Companhia Siderúrgica Nacional (CONVENIENCE TRANSLATION INTO ENGLISH FROM THE ORIGINAL PREVIOUSLY ISSUED IN PORTUGUESE) | |
| · | Sales Volume, in turn, also reached a
record result of 11,641 thousand tons in 3Q23, surpassing by 3.4% the record set in the previous quarter and 28.0% above the same period
of the previous year. The company was able to take advantage of the favorable scenario with strong Chinese demand and the dryer period
to deliver a quarterly sales record. |
| · | In 3Q23, Adjusted Net Revenue totaled R$
4,335 million and was 19.4% higher than in 2Q23, a performance that reflects not only the higher volume of shipments, but also the
higher price realization seen in the period. As a result, Net Unitary Revenue was US$ 75.23 per wet ton, which represents
an increase of 14.5% compared to 2Q23, following the upward trajectory of the price of Platts and open cargoes that offset the 5.1% appreciation
of the exchange rate. |
| · | In turn, the Cost of Goods
Sold from mining totaled R$ 2,567 million in 3Q23, a reduction of 2.2% compared to the previous quarter, even with higher
commercial activity, which is justified by the lower volume of third-party purchases and lower use of third-party ports. On the other
hand, the C1 cost reached US$ 21.3/t in 3Q23, 1.4% lower than in the previous quarter, reflecting the higher dilution of fixed
costs and lower SG&A unit costs that ended up offsetting the increase in diesel in the period. |
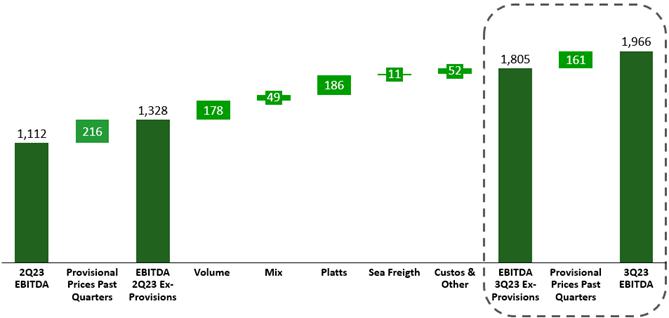
| · | Adjusted EBITDA reached R$ 1,966 million
in 3Q23, with a significant quarterly Adjusted EBITDA Margin, reaching 45.4% or 14.7 p.p. higher than in the previous quarter. This
increase in profitability is the result of a very favorable situation that combined record sales volume with better ore prices. |
Cement Result
According to the National Union of the Cement
Industry (SNIC), cement sales in Brazil from January to September 2023 had a slight decrease of 2.0% when compared to the same period
of the previous year. This scenario reflects a normalization of the market after the boom experienced during the pandemic, plus
the effects of a still high interest rate, the maturation of the new public policies of a government in its first year in office and a
volume of rainfall above the historical average, especially in some regions such as the South of the country. On the other hand, even
considering all these effects, the market remains quite resilient and already shows some signs of recovery. For example, cement sales
in Brazil grew 8.3% in 3Q23 compared to the previous quarter and the consumer confidence index reached the highest level since 2014. In
addition, job recovery scenario and GDP, in addition to the cooling of inflation and the beginning of the downward trajectory of interest
rates are other indications that should boost sales in the coming months. Finally, the announcement of the new modality of the Growth Acceleration Program (PAC) and the
reformulation of Minha Casa, Minha Vida are new evidence that should provide even more support for a new growth cycle in the sector.
Quarterly Financial Information – September 30, 2023 – Companhia Siderúrgica Nacional (CONVENIENCE TRANSLATION INTO ENGLISH FROM THE ORIGINAL PREVIOUSLY ISSUED IN PORTUGUESE) | |
In terms of commercial performance, CSN's
sales in 3Q23 totaled 3,263 Kton, which represents a small decrease of 2.1% compared to the previous quarter, but 4% above
the same period of the previous year.
Sales Volume - Cement (thousand tons)
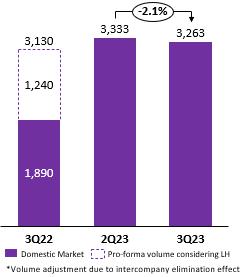
* LafargeHolcim's operations were integrated
in September 2022.
| · | Net Revenue, in turn, reached R$ 1,159
million in 3Q23 and was 1.5% higher than in the previous quarter, reinforcing the more assertive commercial strategy and the better price
level practiced in the period, especially for the structured cement and bulk market. This eventually compensated for the lower sales volume
in the period. |
| · | In 3Q23, cement Unitary Cost fell 1.8%
compared to the previous quarter, as a result of lower costs with raw materials. |
| · | In turn, the segment’s Adjusted EBITDA
increased by 19.1% compared to the previous quarter, reaching R$ 266 million in 3Q23 and with an Adjusted EBITDA Margin of 23.0%,
or 3.4 p.p. higher than in 2Q23, reinforcing all the synergy capture achieved in the period. In addition, the environment remains favorable
for margin expansion as there is room for further recovery in prices and sales in the coming months. |
Energy Result
In 3Q23, energy prices remained at a level
still below the average of recent years, due to the high level of water that has been recorded in the reservoirs. As a result, the volume
of energy traded in the quarter generated Net Revenue of R$ 122 million, which represents a reduction of 23.5% compared to the
previous quarter. Adjusted EBITDA also decreased in the period, reaching R$ 25 million and generating an Adjusted EBITDA Margin
of 20.3%, which represents a reduction of 23.1 p.p. compared to the previous quarter, when the recognition of tax credits favored
profitability.
Logistics Result
Railway Logistics: In 3Q23, Net Revenue
reached RR$ 730 million, with an Adjusted EBITDA of R$ 406 million and Adjusted EBITDA Margin of 55.7%. Compared to 2Q23, revenue
increased 9.2% due to the seasonality of the period and a higher volume of goods transported. In the same line of comparison, Adjusted
EBITDA was 12.2% higher.
Port Logistics: In 3Q23, 292 thousand
tons of steel products were shipped by Sepetiba Tecon, in addition to 14 thousand containers, 4 thousand tons of general cargo and 239
thousand tons of bulk. Compared to the previous quarter, the Company
Quarterly Financial Information – September 30, 2023 – Companhia Siderúrgica Nacional (CONVENIENCE TRANSLATION INTO ENGLISH FROM THE ORIGINAL PREVIOUSLY ISSUED IN PORTUGUESE) | |
significantly increased its shipments, with the
increase in the volume of steel products and in the volume of bulk. As a result, Net Revenue from the port segment was 37.3% higher
than in the previous quarter, reaching R$ 75 million in 3Q23, with a positive impact on Adjusted EBITDA for the period, which was
R$ 19 million in the quarter and Adjusted EBITDA Margin of 25.2%, or 20.2 p.p. higher than in 2Q23.
Quarterly Financial Information – September 30, 2023 – Companhia Siderúrgica Nacional (CONVENIENCE TRANSLATION INTO ENGLISH FROM THE ORIGINAL PREVIOUSLY ISSUED IN PORTUGUESE) | |
ESG – Environmental, Social & Governance
ESG PERFORMANCE – CSN GROUP
Since the beginning of 2023,
CSN has adopted a new format for disclosing its ESG actions and performance, providing its performance in ESG indicators on an individual
basis. The new model allows stakeholders to have access to the main results and indicators on a quarterly basis and to monitor them effectively
and even more quickly. Access can be made through the results center on CSN's IR website: https://ri.csn.com.br/informacoes-financeiras/central-de-resultados/
The information included in
this release was selected based on relevance and materiality to the company. Quantitative indicators are presented compared to the period
that best represents the metric for monitoring them. Thus, some are compared to the same quarter of the previous year, and others will
be compared to the average of the previous period, ensuring a comparison based on seasonality and periodicity. Additionally, it is important
to highlight that the ESG Performance Report also incorporates the performance indicators of the new assets of CSN Cimentos, acquired
in 2022, so that some absolute indicators will change significantly when compared to the previous period.
More detailed historical data
on CSN's performance and initiatives can be found in the 2022 Integrated Report, released in April 2023 (https://esg.csn.com.br/nossa-empresa/relatorio-integrado-gri
). ESG indicator assurance occurs annually for the Integrated Report's closing, so the information contained in quarterly releases
is subject to adjustments resulting from this process.
It is also possible to track
CSN's ESG performance in an agile and transparent manner on our website through the following electronic address: https://esg.csn.com.br
.
Quarterly Financial Information – September 30, 2023 – Companhia Siderúrgica Nacional (CONVENIENCE TRANSLATION INTO ENGLISH FROM THE ORIGINAL PREVIOUSLY ISSUED IN PORTUGUESE) | |
Capital Markets
In the third quarter of 2023, CSN's shares
were practically stable (+0.1%), while the Ibovespa index fell 1.3%. The average daily volume (CSNA3) traded on B3, in turn, was R$ 100.8
million in 3Q23. On the New York Stock Exchange (NYSE), the Company's American Depositary Receipts (ADRs) depreciated 7.7%
in dollar terms, while the Dow Jones index decreased 2.6%. The average daily trading of ADRs (SIDs) on the NYSE in 3Q23 was US$
5.9 million.
| |
3Q23 |
| No. of shares in thousands |
|
1,326,094 |
| Market Cap |
|
|
| Closing Quote (R$/share) |
|
12.14 |
| Closing Quote (US$/ADR) |
|
2.39 |
| Market Value (R$ million) |
|
16,099 |
| Market Value (US$ million) |
|
3,169 |
| Change in the period |
|
|
| CSNA3 (R$) |
|
-0.08% |
| SID (US$) |
|
-7.72% |
| Ibovespa (R$) |
|
-1.29% |
| Dow Jones (US$) |
|
-2.62% |
| Volume |
|
|
| Daily average (thousand shares) |
|
8,013 |
| Daily average (R$ thousands) |
|
100,786 |
| Daily average (thousand ADRs) |
|
2,316 |
| Daily Average (US$ thousand) |
|
5,995 |
|
Source: Bloomberg
|
|
|
| |
|
|
|
Earnings Conference Call:
3Q23
Earnings Presentation Webcast Investor Relations Team
Conference Call in Portuguese with Simultaneous Translation into English November 14, 2023
11:30 a.m. (Brasilia time)
09:30 a.m. (New York time)
+55 11 3181-8565 / +55 11 4090-1621
Code: CSN
Replay Phone: +55 11 4118-5151
Replay Code: 219011#
Webcast: click
here |
Marcelo Cunha Ribeiro – CFO and Executive Director of IR
Pedro Gomes de Souza (pedro.gs@csn.com.br)
Rafael Costa Byrro (rafael.byrro@csn.com.br)
Ricardo Reis (ricardo.reis.rr2@csn.com.br)
|
| Some of the statements contained herein are forward-looking
statements that express or imply expected results, performance or events. These perspectives include future results that may be influenced
by historical results and the statements made in 'Outlook'. Current results, performance and events may differ materially from assumptions
and prospects and involve risks such as: general and economic conditions in Brazil and other countries; interest and exchange rate levels,
protectionist measures in the U.S., Brazil, and other countries, changes in laws and regulations, and general competitive factors (on
a global, regional, or national basis). |
Quarterly Financial Information – September 30, 2023 – Companhia Siderúrgica Nacional (CONVENIENCE TRANSLATION INTO ENGLISH FROM THE ORIGINAL PREVIOUSLY ISSUED IN PORTUGUESE) | |
INCOME STATEMENT
CONSOLIDATED – Corporate Law – In Thousands of Reais

Quarterly Financial Information – September 30, 2023 – Companhia Siderúrgica Nacional (CONVENIENCE TRANSLATION INTO ENGLISH FROM THE ORIGINAL PREVIOUSLY ISSUED IN PORTUGUESE) | |
BALANCE SHEET
CONSOLIDATED – Corporate Law – In Thousands of Reais
Quarterly Financial Information – September 30, 2023 – Companhia Siderúrgica Nacional (CONVENIENCE TRANSLATION INTO ENGLISH FROM THE ORIGINAL PREVIOUSLY ISSUED IN PORTUGUESE) | |

Quarterly Financial Information – September 30, 2023 – Companhia Siderúrgica Nacional (CONVENIENCE TRANSLATION INTO ENGLISH FROM THE ORIGINAL PREVIOUSLY ISSUED IN PORTUGUESE) | |
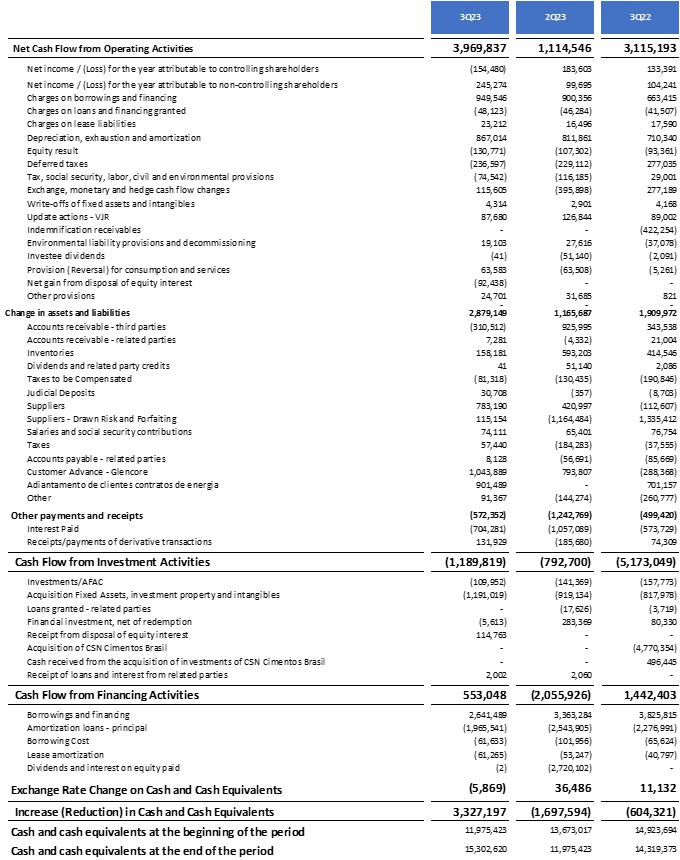
CASH FLOW STATEMENT
CONSOLIDATED – Corporate Law – In Thousands of Reais
Quarterly Financial Information – September 30, 2023 – Companhia Siderúrgica Nacional (CONVENIENCE TRANSLATION INTO ENGLISH FROM THE ORIGINAL PREVIOUSLY ISSUED IN PORTUGUESE) | |
EXPLANATORY NOTES TO THE FINANCIAL STATEMENTS
(In thousands of reais, unless otherwise noted)
| 1. | DESCRIPTION OF BUSINESS |
Companhia Siderúrgica Nacional (“CSN”,
also referred to as “Company” or “Parent company”), is a publicly held company incorporated on April 9, 1941,
under the laws of the Federative Republic of Brazil (Companhia Siderúrgica Nacional, its subsidiaries, joint ventures, joint operations
and associates are collectively referred to herein as the "Group”). The Company’s registered office is located in São
Paulo, SP, Brazil.
CSN is listed on the São Paulo Stock Exchange
(B3 S.A. - Brasil, Bolsa, Balcão) and on the New York Stock Exchange (“NYSE”), reporting its information to the Brazilian
Securities and Exchange Commission (“CVM”) and to the U.S. Securities and Exchange Commission (“SEC”).
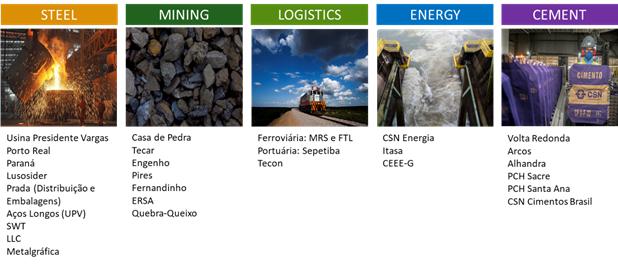
The Group's main operating activities are divided
into five 5 segments as follows:
The Company’s main industrial facility is
the Presidente Vargas Steelworks (“UPV”), located in the city of Volta Redonda, State of Rio de Janeiro. This segment consolidates
all operations related to the production, distribution and sale of flat steel, long steel, metallic containers and galvanized steel. In
addition to the facilities in Brazil, CSN has commercial operations in the United States and operations in Portugal and Germany in order
to gain markets and provide excellent services to final consumers. Its steel is used in home appliances, civil construction, package and
automobile industries.
The production of iron ore is developed in the
cities of Congonhas, Belo Vale and Ouro Preto, State of Minas Gerais, by its subsidiary CSN Mineração S.A. (“CSN Mineração”).
The Company’s mining activities also include tin exploration in the state of Rondônia by CSN's subsidiary Estanho de Rondônia
S.A. (“ERSA”), to supply the needs of the UPV. The surplus of this raw material is sold to subsidiaries and third parties.
Iron ore is sold basically in the international
market, especially in Europe and Asia. The prices charged in these markets are historically cyclical and subject to significant fluctuations
over short periods of time, driven by several factors related to global demand, strategies adopted by the major steel producers, and the
foreign exchange rate. All these factors are beyond the Company’s control. The ore is transported by rail to the Terminal de Carvão
e Minérios from the Itaguaí Port (“TECAR”), a solid bulk terminal, one of the four terminals that comprise the
Itaguai Port, located in the State of Rio de Janeiro and from TECAR to customers around the world. The imports of coal and coke are also
carried out through this terminal by provision of services by CSN Mineração to CSN.
As a pioneer in the use of technologies that result
in the possibility of stacking the tailings generated in the iron ore production process, CSN Mineração has its iron
ore production, since January 2020, 100% independent of tailings dams. After significant investments in recent years to raise the level
of reliability, disposal and dry stacking, CSN Mineração has advanced to a scenario in which 100% of our tailings goes
through a dry filtering process and are stacked in piles, geotechnically controlled, in areas exclusively destined for stacking.
As a consequence of these measures, decommissioning
of dams is the natural path for processing filtered tailings. All of our mining dams are positively certified and comply with the environmental
legislation in force.
CSN entered the cement market driven by the synergy
between this activity and its existing businesses. The cement production unit located next to the UPV facilities, in Volta Redonda/RJ,
produces CP-III type cement using slag produced by UPV's own blast furnaces. There is also the exploration of limestone and dolomite at
the Arcos/MG unit to meet the needs of the steel industry and the cement factory, as well as the production of clinker at the same unit.
On August 31, 2021, the subsidiary CSN Cimentos
S.A. (“CSN Cimentos”) concluded the acquisition of control of Elizabeth Cimentos S.A. and Elizabeth Mineração
Ltda., operating in the Northeast region, especially in Paraíba and Pernambuco. On May 1, 2022, Elizabeth Mineração
was merged into CSN Cimentos.
Quarterly Financial Information – September 30, 2023 – Companhia Siderúrgica Nacional (CONVENIENCE TRANSLATION INTO ENGLISH FROM THE ORIGINAL PREVIOUSLY ISSUED IN PORTUGUESE) | |
On September 9, 2021, CSN Cimentos entered into
the Agreement for the Sale and Purchase of the Shares in LafargeHolcim (Brasil) S.A., for the acquisition of 100% of the shares issued
by LafargeHolcim (Brasil) S.A. (“LafargeHolcim”). On September 6, 2022, the acquisition of all shares issued by LafargeHolcim
S.A. was completed, with the corporate name of LafargeHolcim being changed to "CSN Cimentos Brasil S.A.", which became controlled
by CSN Cimentos. The Company's main activities are: production, industry and general trade of cement, lime, mortar, minerals and metals
in general and complementary products for civil construction, in natura with industrial plants, warehouses and branches across a large
part of the national territory.
On August 31, 2023, the Extraordinary General Meeting
approved the incorporation of CSN Cimentos by CSN Cimentos Brasil with the consequent transfer of all assets, properties (movable and immovable),
rights and obligations, in accordance with the terms of the “Protocol and Justification of the Incorporation of CSN Cimentos S.A.
by CSN Cimentos Brasil S.A.”. Thus, CSN Cimentos was extinguished, all its shares were canceled and, in replacement, its shareholders
received shares in CSN Cimentos Brasil. All activities carried out by CSN Cimentos are now carried out by CSN Cimentos Brasil. The Valuation
Report of CSN Cimentos' assets was prepared on June 30, 2023, serving as the basis for determining a capital increase in CSN Cimentos Brasil in
the amount of R$2,383,276.
Railroads:
CSN has interests in three railroad companies:
MRS Logística S.A. (“MRS”), which manages the former Southeast Railway System of Rede Ferroviária Federal S.A.
(“RFFSA”), Transnordestina Logística S.A. (“TLSA”) and FTL - Ferrovia Transnordestina Logística
S.A. (“FTL”), which holds the concession to operate the former Northeast Railway System of RFFSA, in the States of Maranhão,
Piauí, Ceará, Rio Grande do Norte, Paraíba, Pernambuco, Alagoas - stretches from São Luís to Altos,
Altos to Fortaleza, Fortaleza to Sousa, Sousa to Recife/Jorge Lins, Recife/Jorge Lins to Salgueiro, Jorge Lins to Propriá, Paula
Cavalcante to Cabedelo, Itabaiana to Macau (Mesh I) and TLSA is responsible for the stretches from Eliseu Martins-Trindade, Trindade-Salgueiro,
Salgueiro-Missão Velha and Missão Velha-Pecém (Mesh II), under construction.
Ports:
The Company operates in the State of Rio de Janeiro,
by means of its subsidiary Sepetiba Tecon S.A., the Container Terminal (“TECON”) and by means of its subsidiary CSN Mineração,
the TECAR, both located at the Itaguaí Port. Established in the harbor of Sepetiba, the mentioned port has a privileged highway,
railroad, and maritime access.
TECON is responsible for the movement and storage
of containers, vehicles, steel products, general cargo, among other products, and TECAR performs the operational activities of loading
and unloading of solid bulk ships, storage and distribution (road and rail) of coal, coke, petroleum coke, clinker, zinc concentrate,
sulfur, iron ore and other bulk, intended for the seaborne market, for our own operation and for different customers.
Since the energy supply is fundamental in CSN”s
production process, the Company has electricity generation assets to mitigate costs, aiming at greater competitiveness.
On June 30, 2022, the Company's subsidiaries, CSN
Cimentos and CSN Energia S.A. ("CSN Energia"), completed the acquisition of Santa Ana Energética S.A. (“Santa Ana”),
as well as Topázio Energética S.A. ("Topázio") and, indirectly, Brasil Central Energia Ltda. ("BCE"),
a subsidiary of Topázio, under the terms of the Share Purchase Agreement entered into on April 8, 2022 with Brookfield Americas
Infrastructure (Brazil Power) Fundo de Investimento em Participações Multiestratégia, managed by Brookfield Brasil
Asset Management Investimentos Ltda. On October 7, 2022, subsidiaries CSN Mineração and CSN Energia S.A. concluded the acquisition
of 100% of the shares of Companhia Energética Chapecó – CEC, holder of the grant of Quebra-Queixo Hydroelectric Power
Plant (“Chapecó”), as provided for in the Agreement for the Purchase and Sale of Shares and Other Covenants and in
the Private Instrument of Assignment of Rights and Obligations entered into on July 1, 2022 and July 25, 2022, respectively.
In July 2022, The Company won the auction held
by the State of Rio Grande do Sul, for the sale of 100% of the shares in its possession, 6,381,908 equivalent to 66.23% of the share capital,
of Companhia Estadual de Energia Elétrica - CEEE-G, as part of the CEEE Group privatization program, in accordance with State Law
15.298/19.On October 21, 2022, the transaction was completed with payment by the company of the
auction winning price. On December 22, 2022, the acquisition of Eletrobras' 32.74% interest in CEEE-G was concluded, and the Company currently
holds 99% of the share capital of CEEE-G.
Quarterly Financial Information – September 30, 2023 – Companhia Siderúrgica Nacional (CONVENIENCE TRANSLATION INTO ENGLISH FROM THE ORIGINAL PREVIOUSLY ISSUED IN PORTUGUESE) | |
Management understands that the Company has adequate
resources to continue its operations. Accordingly, the Company's interim financial information for the period ended September 30, 2023,
have been prepared on a going concern basis.
| 2. | BASIS OF PREPARATION AND STATEMENT OF COMPLIANCE |
| 2.a) | Statement of compliance |
The parent company and consolidated interim financial
information (“interim financial information”) have been prepared and are being presented in accordance with the accounting
practices adopted in Brazil issued by the Brazilian Accounting Pronouncements Committee (“CPC”), approved by the Brazilian
Securities and Exchange Commission (“CVM”) and by the Brazilian Federal Accounting Council (“CFC”), and in accordance
with the International Financial Reporting Standards (“IFRS”) issued by the International Accounting Standard Board (“IASB”)
and disclose all the relevant information of the interim financial information, and only this information, which corresponds to that used
by the Company's management in its activities. The consolidated interim financial information are identified as “Consolidated”
and the parent company's individual interim financial information are identified as “Parent Company”.
| 2.b) | Basis of presentation |
The interim financial statements were prepared based on the historical cost
and were adjusted to reflect: (i) the fair value measurement of certain financial assets and liabilities (including derivative instruments),
as well as pension plan assets; and (ii) impairment losses. When IFRS and CPCs allows the option between cost or another measurement criterion,
the cost of acquisition criterion was used.
The preparation of these interim financial statements
requires Management to use certain accounting estimates, judgments and assumptions that affect the application of Accounting Polices and
the amounts reported on the balance sheet date of assets, liabilities, income, and expenses may differ from actual future results. The
assumptions used are based on history and other factors considered relevant and are reviewed by the Company’s management.
The interim financial information has been prepared
and is being presented in accordance with CPC 21 (R1) - “Interim Financial Reporting” and IAS 34 - “Interim Financial
Reporting”, consistently with the standards issued by the CVM. This interim financial information does not include all requirements
of annual or full financial statements and, accordingly, should be read in conjunction with the Company’s financial statements for
the year ended December 31, 2022.
Therefore, in this interim financial information
the following notes are not repeated, either due to redundancy or to the materiality in relation to those already presented in the annual
financial statements:
Note 10 - Basis of consolidation and investments
Note 12 - Intangible assets
Note 18 - Income tax and social contribution
Note 19 - Installment taxes
Note 20 - Tax, social security, labor, civil, environmental
provisions and judicial deposits
Note 29 - Information by business segment
Note 30 - Employee benefits
Note 31 - Commitments
The consolidated financial statements were approved
by Board of Directors on November 13, 2023.
| 2.c) | Functional currency and presentation currency |
The accounting records included in the interim
financial statements of each of the Company’s subsidiaries are measured using the currency of the principal of the economic environment
in which each subsidiary operates (“the functional currency”). The consolidated and parent company interim financial statements
are presented in BRL (reais), which is the Company’s functional and reporting currency.
Quarterly Financial Information – September 30, 2023 – Companhia Siderúrgica Nacional (CONVENIENCE TRANSLATION INTO ENGLISH FROM THE ORIGINAL PREVIOUSLY ISSUED IN PORTUGUESE) | |
Foreign currency transactions are translated into
the functional currency using the exchange rates prevailing on the transaction or valuation dates, in which the items are remeasured.
The balances of the asset and liability accounts are converted using the exchange rate on the balance sheet date. As of September 30,
2023, US$1.00 was equivalent to BRL5.0076 (BRL5.2177 on December 31, 2022) and €1.00 was equivalent to BRL5.3000 (BRL5.5694 on December
31, 2022), according to the rates obtained from Central Bank of Brazil website.
| 2.d) | Statement of value added |
Pursuant to Law 11,638/07, the presentation
of the statement of added value is required for all publicly held companies. These statements were prepared in accordance with CPC 09
- Added Value Statement, approved by CVM Resolution 557/08. The IFRS does not require the presentation of this statement and for IFRS
purposes is presented as additional information.
| 3. | CASH AND CASH EQUIVALENTS |
| |
|
|
Consolidated |
|
|
|
Parent Company |
| |
09/30/2023 |
|
12/31/2022 |
|
09/30/2023 |
|
12/31/2022 |
| Cash and banks |
|
|
|
|
|
|
|
| In Brazil |
66,387 |
|
85,120 |
|
29,600 |
|
49,794 |
| Abroad |
10,744,016 |
|
6,310,338 |
|
121,776 |
|
136,756 |
| |
10,810,403 |
|
6,395,458 |
|
151,376 |
|
186,550 |
| |
|
|
|
|
|
|
|
| Investments |
|
|
|
|
|
|
|
| In Brazil |
4,426,577 |
|
5,110,749 |
|
1,810,687 |
|
2,652,855 |
| Abroad |
65,640 |
|
485,149 |
|
1,404 |
|
|
| |
4,492,217 |
|
5,595,898 |
|
1,812,091 |
|
2,652,855 |
| |
15,302,620 |
|
11,991,356 |
|
1,963,467 |
|
2,839,405 |
Our investments are basically in private and public
securities with yields linked to the variation of Interbank Deposit Certificates (CDI) and repo operations backed by National Treasury
Notes, respectively. The Company invests part of the funds through exclusive investment funds which have been consolidated in this interim
financial information.
Our investments are in private securities in top-rated
banks and are remunerated at pre-fixed rates.
| |
|
|
|
|
|
|
|
Consolidated |
|
|
|
|
|
|
|
Parent Company |
| |
|
Current |
|
Non-current |
|
Current |
|
Non-current |
| |
|
09/30/2023 |
|
12/31/2022 |
|
09/30/2023 |
|
12/31/2022 |
|
09/30/2023 |
|
12/31/2022 |
|
09/30/2023 |
|
12/31/2022 |
| Investments (1) |
|
38,491 |
|
271,590 |
|
16,731 |
|
15,675 |
|
30,371 |
|
22,715 |
|
|
|
|
| Usiminas shares (2) |
|
1,106,108 |
|
1,184,895 |
|
|
|
|
|
1,106,108 |
|
1,184,895 |
|
|
|
|
| Bonds (3) |
|
|
|
|
|
115,175 |
|
140,510 |
|
|
|
|
|
115,175 |
|
140,510 |
| |
|
1,144,599 |
|
1,456,485 |
|
131,906 |
|
156,185 |
|
1,136,479 |
|
1,207,610 |
|
115,175 |
|
140,510 |
| (1) | These are restricted financial investments and
linked to a Bank Deposit Certificate (CDB) to guarantee a letter of guarantee from financial institutions and financial investments in
Public Securities (LFT - Letras Financeiras do Tesouro) managed by their exclusive funds. |
| (2) | A guarantee (fiduciary alienation) was constituted
over a portion of the shares of Usiminas Siderúrgica de Minas Gerais S.A. held by the Company. |
| (3) | Bonds with Banco Fibra maturing in February 2028
(see note 20.a). |
Quarterly Financial Information – September 30, 2023 – Companhia Siderúrgica Nacional (CONVENIENCE TRANSLATION INTO ENGLISH FROM THE ORIGINAL PREVIOUSLY ISSUED IN PORTUGUESE) | |
5.
TRADE RECEIVABLES
| |
|
|
Consolidated |
|
|
|
Parent Company |
| |
09/30/2023 |
|
12/31/2022 |
|
09/30/2023 |
|
12/31/2022 |
| Trade receivables |
|
|
|
|
|
|
|
| Third parties |
|
|
|
|
|
|
|
| Domestic market |
1,690,718 |
|
1,636,804 |
|
1,089,062 |
|
860,942 |
| Foreign market |
1,612,720 |
|
1,720,056 |
|
38,940 |
|
92,679 |
| |
3,303,438 |
|
3,356,860 |
|
1,128,002 |
|
953,621 |
| Expected credit losses |
(220,460) |
|
(232,830) |
|
(116,806) |
|
(122,872) |
| |
3,082,978 |
|
3,124,030 |
|
1,011,196 |
|
830,749 |
| Related parties (Note 20 a) |
96,070 |
|
109,134 |
|
993,776 |
|
1,125,782 |
| |
3,179,048 |
|
3,233,164 |
|
2,004,972 |
|
1,956,531 |
The composition of the gross balance of accounts
receivable from third party consumers is shown as follows:
| |
|
|
|
Consolidated |
|
|
|
Parent Company |
| |
|
09/30/2023 |
|
12/31/2022 |
|
09/30/2023 |
|
12/31/2022 |
| Current |
|
2,994,055 |
|
2,934,057 |
|
953,331 |
|
781,406 |
| Past-due up to 30 days |
|
38,009 |
|
163,959 |
|
16,291 |
|
37,036 |
| Past-due up to 180 days |
|
83,801 |
|
54,452 |
|
62,404 |
|
28,526 |
| Past-due over 180 days |
|
187,573 |
|
204,392 |
|
95,976 |
|
106,653 |
| |
|
3,303,438 |
|
3,356,860 |
|
1,128,002 |
|
953,621 |
The changes in estimated credit losses are as follows:
| |
|
|
|
Consolidated |
|
|
|
Parent Company |
| |
|
09/30/2023 |
|
12/31/2022 |
|
09/30/2023 |
|
12/31/2022 |
| Opening balance |
|
(232,830) |
|
(236,927) |
|
(122,872) |
|
(133,227) |
| (Loss)/Reversal estimated |
|
3,968 |
|
(87) |
|
3,475 |
|
1,623 |
| Recovery and write-offs of receivables |
|
8,402 |
|
13,197 |
|
2,591 |
|
8,732 |
| Consolidation in the acquisition of companies |
|
|
|
(9,013) |
|
|
|
|
| Closing balance |
|
(220,460) |
|
(232,830) |
|
(116,806) |
|
(122,872) |
| |
|
|
Consolidated |
|
|
|
Parent Company |
| |
09/30/2023 |
|
12/31/2022 |
|
09/30/2023 |
|
12/31/2022 |
| Finished goods |
3,524,674 |
|
4,421,166 |
|
1,977,693 |
|
2,308,211 |
| Work in progress |
2,994,954 |
|
3,501,145 |
|
1,372,784 |
|
2,123,539 |
| Raw materials |
2,665,375 |
|
3,297,213 |
|
1,780,210 |
|
2,492,779 |
| Storeroom supplies |
1,439,984 |
|
1,174,244 |
|
610,810 |
|
474,846 |
| Advances to suppliers |
59,700 |
|
37,619 |
|
29,984 |
|
30,170 |
| Provision for losses |
(89,745) |
|
(96,493) |
|
(22,542) |
|
(16,124) |
| |
10,594,942 |
|
12,334,894 |
|
5,748,939 |
|
7,413,421 |
| |
|
|
|
|
|
|
|
| Classified: |
|
|
|
|
|
|
|
| Current |
9,283,122 |
|
11,289,229 |
|
5,748,939 |
|
7,413,421 |
| Non-current (1) |
1,311,820 |
|
1,045,665 |
|
|
|
|
| |
10,594,942 |
|
12,334,894 |
|
5,748,939 |
|
7,413,421 |
| (1) | Long-term iron ore inventories that will be used after the construction of the processing plant, which
will produce pellet feed. |
The changes in estimated losses on inventories
are as follows:
Quarterly Financial Information – September 30, 2023 – Companhia Siderúrgica Nacional (CONVENIENCE TRANSLATION INTO ENGLISH FROM THE ORIGINAL PREVIOUSLY ISSUED IN PORTUGUESE) | |
| |
|
|
|
Consolidated |
|
|
|
Parent Company |
| |
|
09/30/2023 |
|
12/31/2022 |
|
09/30/2023 |
|
12/31/2022 |
| Opening balance |
|
(96,493) |
|
(98,730) |
|
(16,124) |
|
(14,426) |
| Reversal/(Estimated losses) of inventories with low turnover and obsolescence |
6,748 |
|
3,621 |
|
(6,418) |
|
(1,698) |
| Consolidation in the acquisition of companies |
|
|
|
(1,384) |
|
|
|
|
| Closing balance |
|
(89,745) |
|
(96,493) |
|
(22,542) |
|
(16,124) |
| |
|
|
Consolidated |
|
|
|
Parent Company |
| |
09/30/2023 |
|
12/31/2022 |
|
09/30/2023 |
|
12/31/2022 |
| State Value-Added Tax |
1,286,785 |
|
1,130,843 |
|
860,122 |
|
793,761 |
| Brazilian federal contributions (1) |
2,051,405 |
|
1,862,828 |
|
1,058,179 |
|
1,094,392 |
| Other taxes |
156,800 |
|
189,087 |
|
126,670 |
|
129,002 |
| |
3,494,990 |
|
3,182,758 |
|
2,044,971 |
|
2,017,155 |
| |
|
|
|
|
|
|
|
| Classified: |
|
|
|
|
|
|
|
| Current |
2,045,442 |
|
1,865,626 |
|
1,057,116 |
|
1,137,460 |
| Non-current |
1,449,548 |
|
1,317,132 |
|
987,855 |
|
879,695 |
| |
3,494,990 |
|
3,182,758 |
|
2,044,971 |
|
2,017,155 |
| (1) | In a judgment finalized on September 24, 2021,
the Federal Supreme Court, with general repercussion, decided for the unconstitutionality of the levy of IRPJ and CSLL on amounts of interest
on arrears at the SELIC rate received because of the repetition of undue tax payment. Although the decision is still pending publication,
and the Company's specific lawsuit is still pending judgment, based on its best estimate to date CSN reassessed the judgment on this lawsuit,
as required by ICPC 22/IFRIC 23 and recorded a credit in the amount of R$229,000. After the final and unappealable court decision of the
Company's legal action, these amounts will be considered in the tax assessments, in accordance with Federal Tax Authorities of Brazil. |
Credits arise mainly from ICMS, PIS and COFINS
on purchases of raw materials and fixed assets, in accordance with current legislation. These credits are naturally realized through offsetting
with debts of the same nature or with other federal taxes, in the cases authorized by law. Based on analyses and projections made by Management,
the Company does not expect risks of non-realization of these tax credits.
| 8. | OTHER CURRENT AND NON-CURRENT ASSETS |
Other current and non-current assets are as follows:
| |
|
|
|
|
|
|
Consolidated |
|
|
|
|
|
|
|
Parent Company |
| |
Current |
|
Non-current |
|
Current |
|
Non-current |
| |
09/30/2023 |
|
12/31/2022 |
|
09/30/2023 |
|
12/31/2022 |
|
09/30/2023 |
|
12/31/2022 |
|
09/30/2023 |
|
12/31/2022 |
| Judicial deposits (note 18) |
|
|
|
|
506,817 |
|
533,664 |
|
|
|
|
|
210,796 |
|
231,627 |
| Dividends receivables (note 20 a) |
155,809 |
|
77,377 |
|
|
|
|
|
235,782 |
|
295,480 |
|
|
|
|
| Prepaid expenses |
386,098 |
|
347,870 |
|
72,736 |
|
82,586 |
|
226,736 |
|
244,416 |
|
54,686 |
|
58,950 |
| Prepaid expenses |
301,720 |
|
311,087 |
|
37,259 |
|
47,109 |
|
226,736 |
|
244,416 |
|
26,614 |
|
30,878 |
| Prepaid expenses with sea freight |
84,378 |
|
36,783 |
|
|
|
|
|
|
|
|
|
|
|
|
| Actuarial asset (note 20 a) |
|
|
|
|
35,477 |
|
35,477 |
|
|
|
|
|
28,072 |
|
28,072 |
| Receivables from related parties |
7,165 |
|
7,241 |
|
3,323,245 |
|
2,869,532 |
|
239,931 |
|
107,078 |
|
3,827,904 |
|
3,377,049 |
| Loans with related parties (note 20 a ) |
5,335 |
|
5,383 |
|
1,617,913 |
|
1,384,773 |
|
5,335 |
|
5,383 |
|
2,020,000 |
|
1,668,382 |
| Other receivables from related parties (note 20 a) |
1,830 |
|
1,858 |
|
1,705,332 |
|
1,484,759 |
|
234,596 |
|
101,695 |
|
1,807,904 |
|
1,708,667 |
| Other assets |
208,579 |
|
344,012 |
|
1,255,579 |
|
1,263,936 |
|
39,336 |
|
63,216 |
|
1,222,201 |
|
1,222,894 |
| Trading securities |
8,096 |
|
9,596 |
|
|
|
|
|
7,981 |
|
9,488 |
|
|
|
|
| Compulsory loans from Eletrobrás |
|
|
|
|
54,254 |
|
58,030 |
|
|
|
|
|
51,624 |
|
55,336 |
| Employee debts |
64,602 |
|
59,578 |
|
|
|
|
|
31,333 |
|
28,101 |
|
|
|
|
| Receivables by indemnity (1) |
22,209 |
|
|
|
1,169,494 |
|
1,166,353 |
|
|
|
|
|
1,169,494 |
|
1,166,353 |
| Term of Agreement GSF DFESA |
14,264 |
|
14,264 |
|
20,208 |
|
30,906 |
|
|
|
|
|
|
|
|
| Advances from Suppliers |
13,233 |
|
12,335 |
|
|
|
|
|
|
|
|
|
|
|
|
| Others |
86,175 |
|
248,239 |
|
11,623 |
|
8,647 |
|
22 |
|
25,627 |
|
1,083 |
|
1,205 |
| |
757,651 |
|
776,500 |
|
5,158,377 |
|
4,749,718 |
|
741,785 |
|
710,190 |
|
5,315,587 |
|
4,890,520 |
| (1) | In April 2023, the subsidiary CEEE-G recognized the amount of R$ 37,486, referring to the Taxes and Contributions
Amounts (VIC) of the Hydroelectric Plants committed to Physical Guarantee Quota Contracts (CCGFs).In the 3rd quarter of 2022,
the uncontroversial amount of R$422,254 was recognized in the same account, as a refund of the amounts overpaid for railroad freight from
April 1994 to March 1994 and March 1996 to the company RFFSA, and that after its extinction, the Federal Government became a defendant.
Additionally, in 2020, a credit was recognized, which is a net, certain and payable amount, arising from the final and unappealable decision
of a court in favor of the Company, due to losses and damages arising from voltage sinking in the energy supply in the periods from January/1991
to June/2002, in the amount of R$ 561,466. |
Quarterly Financial Information – September 30, 2023 – Companhia Siderúrgica Nacional (CONVENIENCE TRANSLATION INTO ENGLISH FROM THE ORIGINAL PREVIOUSLY ISSUED IN PORTUGUESE) | |
| 9. | BASIS OF CONSOLIDATION AND INVESTMENTS |
The information related to the activities of jointly
controlled subsidiaries, joint operations, associates and other investments did not change in relation to what was disclosed in the Company's
financial statements as of December 31, 2022. Therefore, Management decided not to repeat them in the accounting information interim of
September 30, 2023.
Quarterly Financial Information – September 30, 2023 – Companhia Siderúrgica Nacional (CONVENIENCE TRANSLATION INTO ENGLISH FROM THE ORIGINAL PREVIOUSLY ISSUED IN PORTUGUESE) | |
| |
|
Equity interests (%) |
|
|
| Companies |
|
09/30/2023 |
|
12/31/2022 |
|
Core business |
| Direct interest in subsidiaries: full consolidation |
|
|
|
|
|
|
| CSN Islands VII Corp. |
|
100.00 |
|
100.00 |
|
Financial transactions |
| CSN Inova Ventures |
|
100.00 |
|
100.00 |
|
Equity interests and Financial transactions |
| CSN Islands XII Corp. |
|
100.00 |
|
100.00 |
|
Financial transactions |
| CSN Steel S.L.U. |
|
100.00 |
|
100.00 |
|
Equity interests and Financial transactions |
| TdBB S.A (*) |
|
100.00 |
|
100.00 |
|
Equity interests |
| Sepetiba Tecon S.A. |
|
99.99 |
|
99.99 |
|
Port services |
| Minérios Nacional S.A. |
|
99.99 |
|
99.99 |
|
Mining and Equity interests |
| Companhia Florestal do Brasil |
|
99.99 |
|
99.99 |
|
Reforestation |
| Estanho de Rondônia S.A. |
|
99.99 |
|
99.99 |
|
Tin Mining |
| Companhia Metalúrgica Prada |
|
99.89 |
|
99.89 |
|
Manufacture of containers and distribution of steel products |
| CSN Mineração S.A. |
|
79.75 |
|
79.75 |
|
Mining |
| CSN Energia S.A. |
|
99.99 |
|
99.99 |
|
Sale of electric power |
| FTL - Ferrovia Transnordestina Logística S.A. |
|
92.71 |
|
92.71 |
|
Railroad logistics |
| Nordeste Logística S.A. |
|
99.99 |
|
99.99 |
|
Port services |
| CSN Inova Ltd. |
|
100.00 |
|
100.00 |
|
Advisory and implementation of new development projec |
| CBSI - Companhia Brasileira de Serviços de Infraestrutura |
|
99.99 |
|
99.99 |
|
Equity interests and product sales and iron ore |
| CSN Cimentos Brasil S.A. |
|
99.99 |
|
99.99 |
|
Manufacturing and sale of cement |
| Berkeley Participações e Empreendimentos S.A. |
|
100.00 |
|
100.00 |
|
Electric power generation and equity interests |
| CSN Inova Soluções S.A. |
|
99.90 |
|
99.99 |
|
Equity interests |
| CSN Participações I |
|
99.90 |
|
99.99 |
|
Equity interests |
| Circula Mais Serviços de Intermediação Comercial S.A. |
|
0.10 |
|
0.01 |
|
Commercial intermediation for the purchase and sale of assets and materials in general |
| CSN Participações III |
|
99.90 |
|
99.99 |
|
Equity interests |
| CSN Participações IV |
|
99.90 |
|
99.99 |
|
Equity interests |
| CSN Participações V |
|
99.90 |
|
99.99 |
|
Equity interests |
| |
|
|
|
|
|
|
| Indirect interest in subsidiaries: full consolidation |
|
|
|
|
|
|
| Lusosider Projectos Siderúrgicos S.A. |
|
100.00 |
|
100.00 |
|
Equity interests and product sales |
| Lusosider Aços Planos, S. A. |
|
99.99 |
|
99.99 |
|
Steel and Equity interests |
| CSN Resources S.A. |
|
100.00 |
|
100.00 |
|
Financial transactions and Equity interests |
| Companhia Brasileira de Latas |
|
99.88 |
|
99.88 |
|
Sale of cans and containers in general and Equity interests |
| Companhia de Embalagens Metálicas MMSA |
|
99.87 |
|
99.87 |
|
Production and sale of cans and related activities |
| Companhia de Embalagens Metálicas - MTM |
|
99.87 |
|
99.87 |
|
Production and sale of cans and related activities |
| CSN Productos Siderúrgicos S.L. |
|
100.00 |
|
100.00 |
|
Financial transactions, product sales and Equity interests |
| Stalhwerk Thüringen GmbH |
|
100.00 |
|
100.00 |
|
Production and sale of long steel and related activities |
| CSN Steel Sections Polska Sp.Z.o.o |
|
100.00 |
|
100.00 |
|
Financial transactions, product sales and Equity interests |
| CSN Mining Holding, S.L.U. |
|
79.75 |
|
79.75 |
|
Financial transactions, product sales and Equity interests |
| CSN Mining GmbH |
|
79.75 |
|
79.75 |
|
Financial transactions, product sales and Equity interests |
| CSN Mining Asia Limited |
|
79.75 |
|
79.75 |
|
Commercial representation |
| Lusosider Ibérica S.A. |
|
100.00 |
|
100.00 |
|
Steel, commercial and industrial activities and equity interests |
| CSN Mining Portugal, Unipessoal Lda. |
|
79.75 |
|
79.75 |
|
Commercial and representation of products |
| Companhia Siderúrgica Nacional, LLC |
|
100.00 |
|
100.00 |
|
Import and distribution/resale of products |
| Elizabeth Cimentos S.A. |
|
99.98 |
|
99.98 |
|
Manufacturing and sale of cement |
| Santa Ana Energética S.A. |
|
99.98 |
|
99.99 |
|
Electric power generation |
| Topázio Energética S.A. |
|
99.98 |
|
99.99 |
|
Electric power generation |
| Brasil Central Energia Ltda. |
|
99.98 |
|
99.99 |
|
Electric power generation |
| Circula Mais Serviços de Intermediação Comercial S.A. |
|
99.99 |
|
99.99 |
|
Commercial intermediation for the purchase and sale of assets and materials in general |
| Metalgráfica Iguaçu S.A |
|
99.89 |
|
99.89 |
|
Metal packaging manufacturing |
| Companhia Energética Chapecó |
|
79.75 |
|
79.75 |
|
Electric power generation |
| Companhia Estadual de Geração de Energia Elétrica - CEEE-G |
|
98.95 |
|
98.96 |
|
Electric power generation |
| Ventos de Vera Cruz S.A. |
|
98.95 |
|
98.95 |
|
Electric power generation |
| Ventos de Curupira S.A |
|
98.95 |
|
98.95 |
|
Electric power generation |
| Ventos de Povo Novo S.A. |
|
98.95 |
|
98.95 |
|
Electric power generation |
| MAZET - Maschinenbau Zerspanungstechnik GmbH (1) |
|
100.00 |
|
|
|
Production and sale of long steel and related activities |
| |
|
|
|
|
|
|
| Direct interest in joint operations: proportionate consolidation |
|
|
|
|
|
|
| Itá Energética S.A. |
|
48.75 |
|
48.75 |
|
Electric power generation |
| Consórcio da Usina Hidrelétrica de Igarapava |
|
17.92 |
|
17.92 |
|
Electric power consortium |
| Consórcio Itaúba(2) |
|
36.60 |
|
36.60 |
|
Electric power generation |
| Consórcio Passo Real (2) |
|
46.97 |
|
|
|
Electric power generation |
| |
|
|
|
|
|
|
| Direct interest in joint ventures: equity method |
|
|
|
|
|
|
| MRS Logística S.A. |
|
18.64 |
|
18.64 |
|
Railroad transportation |
| Aceros Del Orinoco S.A. (*) |
|
31.82 |
|
31.82 |
|
Dormant company |
| Transnordestina Logística S.A. |
|
48.03 |
|
48.03 |
|
Railroad logistics |
| Equimac S.A |
|
50.00 |
|
50.00 |
|
Rental of commercial and industrial machinery and equipment |
| Consórcio Itaúba(2) |
|
63.40 |
|
63.40 |
|
Electric power generation |
| Consórcio Passo Real (2) |
|
53.03 |
|
|
|
Electric power generation |
| |
|
|
|
|
|
|
| Indirect interest in joint ventures: equity method |
|
|
|
|
|
|
| MRS Logística S.A. |
|
14.86 |
|
14.86 |
|
Railroad transportation |
| |
|
|
|
|
|
|
| Direct interest in associates: equity method |
|
|
|
|
|
|
| Arvedi Metalfer do Brasil S.A. |
|
20.00 |
|
20.00 |
|
Metallurgy and Equity interests |
| |
|
|
|
|
|
|
| Indirect interest in affiliates: equity method |
|
|
|
|
|
|
| Ventos da Lagoa Energia S.A. (3) |
|
|
|
10.00 |
|
Electric power generation |
| Jaguari Energética S.A. |
|
10.39 |
|
10.39 |
|
Electric power generation |
| Chapecoense Geração S.A. |
|
8.91 |
|
8.91 |
|
Electric power generation |
| Parques Eólicos Palmares S.A. (3) |
|
|
|
10.00 |
|
Electric power generation |
| Ventos do Litoral Energia S.A. (3) |
|
|
|
10.00 |
|
Electric power generation |
| Ventos dos índios Energia S.A. (3) |
|
|
|
10.00 |
|
Electric power generation |
| Companhia Energética Rio das Antas - Ceran |
|
29.69 |
|
29.69 |
|
Electric power generation |
| Ventos do Sul Energia S.A. |
|
9.90 |
|
10.00 |
|
Electric power generation |
| Foz Chapecó Energia S.A. |
|
8.91 |
|
8.91 |
|
Electric power generation |
| |
|
|
|
|
|
|
| Exclusive funds: full consolidation |
|
|
|
|
|
|
| Diplic II - Private credit balanced mutual fund |
|
100.00 |
|
100.00 |
|
Investment fund |
| Caixa Vértice - Private credit balanced mutual fund |
|
100.00 |
|
100.00 |
|
Investment fund |
| VR1 - Private credit balanced mutual fund |
|
100.00 |
|
100.00 |
|
Investment fund |
(*) Dormant companies.
Quarterly Financial Information – September 30, 2023 – Companhia Siderúrgica Nacional (CONVENIENCE TRANSLATION INTO ENGLISH FROM THE ORIGINAL PREVIOUSLY ISSUED IN PORTUGUESE) | |
(1) On June 1, 2023,
MAZET - Maschinenbau Zerspanungstechnik GmbH was acquired by the indirect subsidiary Stalhwerk Thüringen GmbH.
(2) On December
26, 2022, the Itaúba Consortium was formed, with Companhia Siderúrgica Nacional S.A., with a 63.4% stake, and CSN Cimentos
Brasil S.A., with a 36.6% stake. Additionally, on January 17, 2023, the Passo Real Consortium was formed, with the consortium members
Companhia Siderúrgica Nacional S.A., Elizabeth Cimentos S.A., CSN Mineração S.A. and Minérios Nacional S.A.,
with stakes of 46.97%, 28.18%, 23.29% and 1.56%, respectively.
(3) CEEE-G sold
its ownership interest in affiliated companies Ventos Lagoa Energia S.A., Parques Eólicos Palmares S.A., Ventos do Litoral Energia
S.A. and Ventos dos Índios Energia S.A.
| 9.a) | Changes in investments in subsidiaries, joint ventures, joint operations,
associates and other investments |
The positions presented as of September 30, 2023
and the changes refer to the interest held by CSN in these companies:
| |
|
|
|
|
|
|
|
|
|
|
|
|
|
Consolidated |
| Companies |
|
Final balance on 12/31/2022 |
|
Capital increase |
|
Dividends |
|
Equity Income (2) |
|
Comprehensive income |
|
Others |
|
Final balance on 09/30/2023 |
| |
|
|
|
|
|
|
| |
|
|
|
|
|
|
| Investments under the equity method |
|
|
|
|
|
|
|
|
|
|
|
|
|
|
| Joint-venture, Joint-operation and Affiliate |
|
|
|
|
|
|
|
|
|
|
|
|
|
|
| MRS Logistica |
|
2,054,898 |
|
|
|
|
|
337,534 |
|
12 |
|
(16,181) |
|
2,376,263 |
| Fair Value MRS |
|
480,622 |
|
|
|
|
|
|
|
|
|
|
|
480,622 |
| Fair Value MRS amortization |
|
(82,225) |
|
|
|
|
|
(8,809) |
|
|
|
|
|
(91,034) |
| Transnordestina Logística S.A. |
|
1,184,514 |
|
|
|
|
|
(17,898) |
|
|
|
|
|
1,166,616 |
| Fair Value -Transnordestina |
|
659,106 |
|
|
|
|
|
|
|
|
|
|
|
659,106 |
| Arvedi Metalfer do Brasil (affiliate) |
|
25,782 |
|
11,037 |
|
|
|
(918) |
|
|
|
|
|
35,901 |
| Equimac S.A |
|
18,482 |
|
|
|
|
|
3,782 |
|
|
|
|
|
22,264 |
| Indirect interest in affiliates - CEEE-G (1) |
|
216,307 |
|
|
|
(33,608) |
|
34,680 |
|
|
|
(47,313) |
|
170,066 |
| Fair Value indirect participation CEEE-G (2) |
|
359,024 |
|
|
|
|
|
(39,315) |
|
|
|
|
|
319,709 |
| Fair Value amortization indirect participation CEEE-G |
|
(25,889) |
|
|
|
|
|
6,648 |
|
|
|
|
|
(19,241) |
| |
|
4,890,621 |
|
11,037 |
|
(33,608) |
|
315,704 |
|
12 |
|
(63,494) |
|
5,120,272 |
| |
|
|
|
|
|
|
|
|
|
|
|
|
|
|
| Equity interests evaluated by the cost method (3) |
|
41,093 |
|
9,000 |
|
|
|
|
|
|
|
|
|
50,093 |
| Investments at fair value through profit or loss (note 13) |
|
94,700 |
|
|
|
|
|
|
|
|
|
(26,651) |
|
68,049 |
| Other |
|
33,588 |
|
|
|
|
|
|
|
|
|
(24,282) |
|
9,306 |
| |
|
169,381 |
|
9,000 |
|
|
|
|
|
|
|
(50,933) |
|
127,448 |
| |
|
|
|
|
|
|
|
|
|
|
|
|
|
|
| Total shareholdings |
|
5,060,002 |
|
20,037 |
|
(33,608) |
|
315,704 |
|
12 |
|
(114,427) |
|
5,247,720 |
| |
|
|
|
|
|
|
|
|
|
|
|
|
|
|
| Classification of investments in the balance sheet |
|
|
|
|
|
|
|
|
|
|
|
|
|
|
| Equity interests |
|
5,060,002 |
|
|
|
|
|
|
|
|
|
|
|
5,247,720 |
| Investment Property |
|
159,080 |
|
|
|
|
|
|
|
|
|
|
|
212,079 |
| Total investments in the asset |
|
5,219,082 |
|
|
|
|
|
|
|
|
|
|
|
5,459,799 |
(1) Refers mainly to the alienation by CEEE-G in
the first quarter of its equity interest in affiliates Ventos Lagoa Energia S.A., Parques Eólicos Palmares S.A., Ventos do Litoral
Energia S.A. and Ventos dos Índios Energia S.A., consequently, there was a write-off of these investments in the amount of (R$47,611),
the effect of the operation was classified under the category of other operating expenses and revenues;
(2) The balance of R$359,024 refers to the Fair
Value generated in the acquisition of the company CEEE-G, with the disposals mentioned in the item above, the Fair Value was written off
in the amount of (R$39,314) referring to the capital gains of the companies sold, the effect of the write-off was classified under the
equity method category;
(3) These are strategic investments in startups
made by the subsidiary CSN Inova Ventures, which are valued using the cost method, in the following companies: Alinea Health Holdings
Ltda. I.Systems Aut. Ind., 2D Materials, H2Pro Ltda, 1S1 Energy, Traive INC., OICO Holdings, Clarke Software and Global Dot, the latter
acquired on June 5, 2023;
(4) The reconciliation of equity income from
companies with shared control classified as joint ventures and associates with the amount presented in the income statement is presented
below and results from the elimination of the results of CSN's transactions with these companies:
Quarterly Financial Information – September 30, 2023 – Companhia Siderúrgica Nacional (CONVENIENCE TRANSLATION INTO ENGLISH FROM THE ORIGINAL PREVIOUSLY ISSUED IN PORTUGUESE) | |
| |
|
|
Consolidated |
| |
09/30/2023 |
|
09/30/2022 |
| |
|
| Equity in results of affiliated companies |
|
|
|
| MRS Logística S.A. |
337,534 |
|
233,735 |
| Transnordestina |
(17,898) |
|
(23,333) |
| Arvedi Metalfer do Brasil |
(918) |
|
3,466 |
| Equimac S.A |
3,782 |
|
2,590 |
| Indirect interest in affiliates - CEEE-G |
34,680 |
|
- |
| Fair Value Amortization |
(41,476) |
|
(3,025) |
| |
315,704 |
|
213,433 |
| Other adjustments |
|
|
|
| Cost of sales |
(89,983) |
|
(56,965) |
| To taxes |
30,594 |
|
19,368 |
| Others |
3,267 |
|
(8,810) |
| Equity in results |
259,582 |
|
167,026 |
(1) The operating margin of intercompany transactions
with group companies classified as joint ventures, which are not consolidated, are reclassified in the Statement of Income from the Investment
group to the costs and income tax and social contribution groups.
The changes in the Parent Company's investment
are presented below:
Quarterly Financial Information – September 30, 2023 – Companhia Siderúrgica Nacional (CONVENIENCE TRANSLATION INTO ENGLISH FROM THE ORIGINAL PREVIOUSLY ISSUED IN PORTUGUESE) | |
| |
|
|
|
|
|
|
|
|
|
|
|
|
|
Parent Company |
| Companies |
|
Final balance on 12/31/2022 |
|
Increase (Decrease) of capital |
|
Dividends |
|
Equity Income |
|
Comprehensive income |
|
Others |
|
Final balance on 09/30/2023 |
| |
|
|
|
|
|
|
| |
|
|
|
|
|
|
| Investments under the equity method |
|
|
|
|
|
|
|
|
|
|
|
|
|
|
| Subsidiaries |
|
|
|
|
|
|
|
|
|
|
|
|
|
|
| CSN Steel S.L.U. |
|
5,028,262 |
|
|
|
|
|
(98,317) |
|
(173,714) |
|
|
|
4,756,231 |
| Sepetiba Tecon S.A. |
|
294,460 |
|
|
|
|
|
(17,317) |
|
|
|
|
|
277,143 |
| Minérios Nacional S.A. |
|
121,242 |
|
|
|
6,390 |
|
24,100 |
|
|
|
|
|
151,732 |
| Fair Value - Minérios Nacional |
|
2,123,507 |
|
|
|
|
|
|
|
|
|
|
|
2,123,507 |
| Companhia Metalúrgica Prada |
|
424,317 |
|
|
|
|
|
(62,557) |
|
|
|
|
|
361,760 |
| Goodwill - Companhia Metalúrgica Prada |
|
63,509 |
|
|
|
|
|
|
|
|
|
|
|
63,509 |
| CSN Mineração S.A. |
|
9,086,716 |
|
|
|
(1,963,023) |
|
1,762,488 |
|
241,047 |
|
|
|
9,127,228 |
| CSN Energia S.A. |
|
56,736 |
|
|
|
|
|
(18,734) |
|
|
|
|
|
38,002 |
| FTL - Ferrovia Transnordestina Logística S.A. |
|
163,740 |
|
|
|
|
|
(17,918) |
|
|
|
|
|
145,822 |
| Companhia Florestal do Brasil |
|
1,300,726 |
|
|
|
(4,270) |
|
56,782 |
|
5,251 |
|
|
|
1,358,489 |
| CBSI - Companhia Brasileira de Serviços de Infraestrutura |
|
29,057 |
|
|
|
(933) |
|
6,684 |
|
|
|
|
|
34,808 |
| Goodwill - CBSI - Companhia Brasileira de Serviços de Infraestrutura |
|
15,225 |
|
|
|
|
|
|
|
|
|
|
|
15,225 |
| CSN Cimentos S.A. (1) |
|
6,938,822 |
|
|
|
|
|
(163,710) |
|
|
|
(6,775,112) |
|
|
| CSN Cimentos Brasil S.A. |
|
|
|
6,775,112 |
|
|
|
(38,021) |
|
2,301 |
|
|
|
6,739,392 |
| Others |
|
120 |
|
2,560 |
|
|
|
(2,152) |
|
|
|
|
|
528 |
| |
|
25,646,439 |
|
6,777,672 |
|
(1,961,836) |
|
1,431,328 |
|
74,885 |
|
(6,775,112) |
|
25,193,376 |
| Joint-venture, Joint-operation and Affiliate |
|
|
|
|
|
|
|
|
|
|
|
|
|
|
| Itá Energética S.A. |
|
189,513 |
|
|
|
|
|
5,743 |
|
|
|
|
|
195,256 |
| MRS Logística S.A. |
|
1,027,709 |
|
|
|
|
|
168,810 |
|
6 |
|
(8,094) |
|
1,188,431 |
| Transnordestina Logística S.A. |
|
1,184,512 |
|
|
|
|
|
(17,898) |
|
|
|
|
|
1,166,614 |
| Fair Value -Transnordestina |
|
659,106 |
|
|
|
|
|
|
|
|
|
|
|
659,106 |
| Equimac S.A |
|
18,482 |
|
|
|
|
|
3,782 |
|
|
|
|
|
22,264 |
| Arvedi Metalfer do Brasil (affiliate) |
|
25,783 |
|
11,037 |
|
|
|
(918) |
|
|
|
|
|
35,902 |
| |
|
3,105,105 |
|
11,037 |
|
|
|
159,519 |
|
6 |
|
(8,094) |
|
3,267,573 |
| Other participations |
|
|
|
|
|
|
|
|
|
|
|
|
|
|
| Investments at fair value through profit or loss (note 13) |
|
94,700 |
|
|
|
|
|
|
|
|
|
(26,651) |
|
68,049 |
| Profits on subsidiaries' inventories |
|
(67,640) |
|
|
|
|
|
76,807 |
|
|
|
|
|
9,167 |
| Other investments |
|
28 |
|
|
|
|
|
1 |
|
|
|
|
|
29 |
| |
|
27,088 |
|
|
|
|
|
76,808 |
|
|
|
(26,651) |
|
77,245 |
| |
|
|
|
|
|
|
|
|
|
|
|
|
|
|
| Total shareholdings |
|
28,778,632 |
|
6,788,709 |
|
(1,961,836) |
|
1,667,655 |
|
74,891 |
|
(6,809,857) |
|
28,538,194 |
| |
|
|
|
|
|
|
|
|
|
|
|
|
|
|
| Subsidiaries with unsecured liabilities |
|
|
|
|
|
|
|
|
|
|
|
|
|
|
| CSN Islands VII Corp. |
|
(2,661,734) |
|
|
|
|
|
75,495 |
|
|
|
|
|
(2,586,239) |
| CSN Inova Ventures |
|
(1,755,949) |
|
|
|
|
|
(305,826) |
|
|
|
|
|
(2,061,775) |
| CSN Islands XII Corp. |
|
(3,340,129) |
|
|
|
|
|
1,606 |
|
|
|
|
|
(3,338,523) |
| Estanho de Rondônia S.A. |
|
(76,295) |
|
|
|
|
|
(32,603) |
|
|
|
|
|
(108,898) |
| Total subsidiaries with unsecured liabilities |
|
(7,834,107) |
|
|
|
|
|
(261,328) |
|
|
|
|
|
(8,095,435) |
| |
|
|
|
|
|
|
|
|
|
|
|
|
|
|
| Equity Income |
|
|
|
|
|
|
|
1,406,327 |
|
|
|
|
|
|
| |
|
|
|
|
|
|
|
|
|
|
|
|
|
|
| Classification of investments in the balance sheet |
|
|
|
|
|
|
|
|
|
|
|
|
|
|
| Equity interests |
|
28,778,632 |
|
|
|
|
|
|
|
|
|
|
|
28,538,194 |
| Investment Property |
|
140,143 |
|
|
|
|
|
|
|
|
|
|
|
138,344 |
| Total active investments |
|
28,918,775 |
|
|
|
|
|
|
|
|
|
|
|
28,676,538 |
| Provision for Investments with Unsecured Liabilities (liabilities) |
|
(7,834,107) |
|
|
|
|
|
|
|
|
|
|
|
(8,095,435) |
| Total active and passive investments |
|
21,084,668 |
|
|
|
|
|
|
|
|
|
|
|
20,581,103 |
(1) On August 31, 2023, the reverse incorporation
of CSN Cimentos into CSN Cimentos Brasil and the transfer of all assets, properties (movable and immovable), rights and obligations were approved.
| 9.b) | Joint ventures and joint operations financial information |
The balance sheet and income statement balances
of the companies with shared control are shown below and refer to 100% of the companies’ results:
Quarterly Financial Information – September 30, 2023 – Companhia Siderúrgica Nacional (CONVENIENCE TRANSLATION INTO ENGLISH FROM THE ORIGINAL PREVIOUSLY ISSUED IN PORTUGUESE) | |
| |
|
|
|
|
|
|
|
09/30/2023 |
|
|
|
|
|
|
|
12/31/2022 |
| |
|
Joint-Venture |
|
Joint-Operation |
|
Joint-Venture |
|
Joint-Operation |
| Equity interest (%) |
|
MRS Logística |
|
Transnordestina Logística |
|
Equimac S.A. |
|
Itá Energética |
|
MRS Logística |
|
Transnordestina Logística |
|
Equimac S.A. |
|
Itá Energética |
| |
37.27% |
|
48.03% |
|
50.00% |
|
48.75% |
|
37.27% |
|
48.03% |
|
50.00% |
|
48.75% |
| Balance sheet |
|
|
|
|
|
|
|
|
|
|
|
|
|
|
|
|
| Current Assets |
|
|
|
|
|
|
|
|
|
|
|
|
|
|
|
|
| Cash and cash equivalents |
|
1,744,910 |
|
1,543 |
|
9,103 |
|
98,880 |
|
867,937 |
|
1,164 |
|
8,983 |
|
46,946 |
| Advances to suppliers |
|
104,385 |
|
3,633 |
|
36 |
|
1,389 |
|
29,500 |
|
21,036 |
|
1,384 |
|
1,273 |
| Other current assets |
|
1,019,836 |
|
67,175 |
|
17,842 |
|
27,113 |
|
1,351,335 |
|
78,777 |
|
11,648 |
|
30,735 |
| Total current assets |
|
2,869,131 |
|
72,351 |
|
26,981 |
|
127,382 |
|
2,248,772 |
|
100,977 |
|
22,015 |
|
78,954 |
| Non-current Assets |
|
|
|
|
|
|
|
|
|
|
|
|
|
|
|
|
| Other non-current assets |
|
571,073 |
|
99,335 |
|
599 |
|
18,397 |
|
887,987 |
|
255,367 |
|
1,643 |
|
19,007 |
| Investments, PP&E and intangible assets |
|
12,102,558 |
|
11,815,712 |
|
42,765 |
|
303,388 |
|
11,541,779 |
|
11,029,525 |
|
41,709 |
|
325,911 |
| Total non-current assets |
|
12,673,631 |
|
11,915,047 |
|
43,364 |
|
321,785 |
|
12,429,766 |
|
11,284,892 |
|
43,352 |
|
344,918 |
| Total Assets |
|
15,542,762 |
|
11,987,398 |
|
70,345 |
|
449,167 |
|
14,678,538 |
|
11,385,869 |
|
65,367 |
|
423,872 |
| |
|
|
|
|
|
|
|
|
|
|
|
|
|
|
|
|
| Current Liabilities |
|
|
|
|
|
|
|
|
|
|
|
|
|
|
|
|
| Borrowings and financing |
|
870,439 |
|
137,819 |
|
6,766 |
|
|
|
735,231 |
|
142,073 |
|
5,497 |
|
|
| Lease liabilities |
|
538,290 |
|
|
|
863 |
|
|
|
472,129 |
|
|
|
701 |
|
|
| Other current liabilities |
|
1,608,480 |
|
78,724 |
|
6,692 |
|
26,915 |
|
1,682,928 |
|
150,268 |
|
5,777 |
|
14,326 |
| Total current liabilities |
|
3,017,209 |
|
216,543 |
|
14,321 |
|
26,915 |
|
2,890,288 |
|
292,341 |
|
11,975 |
|
14,326 |
| Non-current Liabilities |
|
|
|
|
|
|
|
|
|
|
|
|
|
|
|
|
| Borrowings and financing |
|
3,781,516 |
|
7,557,342 |
|
9,417 |
|
|
|
3,604,793 |
|
7,142,895 |
|
14,446 |
|
|
| Lease liabilities |
|
1,625,443 |
|
|
|
253 |
|
|
|
1,928,931 |
|
|
|
630 |
|
|
| Other non-current liabilities |
|
742,684 |
|
1,785,025 |
|
1,827 |
|
21,727 |
|
740,892 |
|
1,484,884 |
|
1,353 |
|
18,914 |
| Total non-current liabilities |
|
6,149,643 |
|
9,342,367 |
|
11,497 |
|
21,727 |
|
6,274,616 |
|
8,627,779 |
|
16,429 |
|
18,914 |
| Shareholders’ equity |
|
6,375,910 |
|
2,428,488 |
|
44,527 |
|
400,525 |
|
5,513,634 |
|
2,465,749 |
|
36,963 |
|
390,632 |
Total liabilities and shareholders’
equity |
|
15,542,762 |
|
11,987,398 |
|
70,345 |
|
449,167 |
|
14,678,538 |
|
11,385,869 |
|
65,367 |
|
423,872 |
| |
|
|
|
|
|
|
|
01/01/2023 a 09/30/2023 |
|
|
|
|
|
|
|
01/01/2022 a 09/30/2022 |
| |
|
Joint-Venture |
|
Joint-Operation |
|
|
|
Joint-Venture |
|
Joint-Operation |
| Equity interest (%) |
|
MRS Logística |
|
Transnordestina Logística |
|
Equimac S.A. |
|
Itá Energética |
|
MRS Logística |
|
Transnordestina Logística |
|
Equimac S.A. |
|
Itá Energética |
| |
37.27% |
|
48.03% |
|
50.00% |
|
48.75% |
|
37.27% |
|
48.03% |
|
50.00% |
|
48.75% |
| Statements of Income |
|
|
|
|
|
|
|
|
|
|
|
|
|
|
|
|
| Net revenue |
|
4,655,746 |
|
562 |
|
37,948 |
|
145,136 |
|
4,118,869 |
|
309 |
|
28,351 |
|
140,165 |
| Cost of sales and services |
|
(2,429,094) |
|
|
|
(20,782) |
|
(69,762) |
|
(2,585,717) |
|
|
|
(17,480) |
|
(73,053) |
| Gross profit |
|
2,226,652 |
|
562 |
|
17,166 |
|
75,374 |
|
1,533,152 |
|
309 |
|
10,871 |
|
67,112 |
| Operating (expenses) income |
|
(375,268) |
|
(30,859) |
|
(3,406) |
|
(62,265) |
|
(182,821) |
|
(30,798) |
|
(2,535) |
|
(56,903) |
| Financial income (expenses), net |
|
(483,120) |
|
(6,961) |
|
(2,196) |
|
4,425 |
|
(489,263) |
|
(18,881) |
|
(2,256) |
|
1,162 |
Income before income tax and social
contribution |
|
1,368,264 |
|
(37,258) |
|
11,564 |
|
17,534 |
|
861,068 |
|
(49,370) |
|
6,080 |
|
11,371 |
Current and deferred income tax
and social contribution |
|
(462,604) |
|
|
|
(848) |
|
(5,753) |
|
(233,918) |
|
|
|
(900) |
|
(4,111) |
| Profit / (loss) for the period |
|
905,660 |
|
(37,258) |
|
10,716 |
|
11,781 |
|
627,150 |
|
(49,370) |
|
5,180 |
|
7,260 |
| 9.c) | TRANSNORDESTINA LOGÍSTICA S.A. (“TLSA”) |
TSA is primarily engaged in the public service
operation and development of a railroad network in the Northeast of Brazil, comprising the rail links Velha-Salgueiro, Salgueiro-Trindade,
Trindade-Eliseu Martins, Salgueiro- Porto de Suape, and Missão Velha-Porto de Pecém (“Malha II”). On December
23, 2022, after extensive negotiations involving ANTT, TCU and the then Ministry of Infrastructure, signed first amendment to the Concession
Agreement , which redefined the scope and deadlines for completion of the TLSA sections, notably to provide for the return of the section
Salgueiro-Porto de Suape, which results in a project with the current 1,206 km of rail network and completion deadline up to December
2029.
Management relies on resources from its shareholders
and third parties to complete the work, which is expected to be available, based on previously conducted agreements and recent discussions
between the parties involved. After evaluating this matter, Management concluded that the use of the project’s business continuity
accounting basis in the preparation of the interim financial information was considered appropriate.
| 9.d) | Incorporation of CSN Cimentos S.A. by CSN Cimentos Brasil S.A. |
On August 31, 2023, the reverse incorporation of
CSN Cimentos into CSN Cimentos Brasil and the transfer of all assets, properties (movable and immovable), rights and obligations were approved.
The Valuation Report of CSN Cimentos' net equity was prepared based on a specific balance sheet as of June 30, 2023.
As a result of the incorporation, the net equity
of CSN Cimentos Brasil was increased by R$2,383,275,916.52 (two billion, three hundred and eighty-three million, two hundred and seventy-five
thousand, nine hundred and sixteen reais and fifty-two cents), of which R$2,300,489,487.22 (two billion, three hundred million, four hundred
and eighty-nine thousand, four hundred and eighty-seven reais and twenty-two cents) were
allocated to the share capital and R$82,786,429.30 (eighty-two million, seven hundred and eighty-six thousand, four hundred and twenty-nine
reais and thirty cents) to the capital reserve account.
Quarterly Financial Information – September 30, 2023 – Companhia Siderúrgica Nacional (CONVENIENCE TRANSLATION INTO ENGLISH FROM THE ORIGINAL PREVIOUSLY ISSUED IN PORTUGUESE) | |
| Balance Sheet (R$ 000) |
|
Accounting collection as of June 30, 2023 |
| Cash and cash equivalents |
|
111,937 |
| Trade receivables |
|
95,506 |
| Inventories |
|
245,701 |
| Other assets |
|
229,560 |
| Corporate investments |
|
1,198,743 |
| Property, plant and equipment |
|
3,573,944 |
| Intangíible assets |
|
889,979 |
| Investment properties |
|
631 |
| Total Assets |
|
6,346,001 |
| Trade payables |
|
375,049 |
| Borrowings and financing |
|
2,678,625 |
| Salaries and social charges |
|
15,432 |
| Taxes payable |
|
42,383 |
| Lease liabilities |
|
15,392 |
| Tax, social security, labor and civil |
|
11,489 |
| Provisions for environmental liabilities and asset decommissioning |
|
83,076 |
| Other payables |
|
741,279 |
| Total Liabilities |
|
3,962,725 |
| |
|
|
| Net assets |
|
2,383,276 |
| 9.e) | Sale of shareholding – Consórcio Machadinho |
The Machadinho Consortium is responsible for the
exploration of HPP Machadinho, located on the Uruguay River, on the border of the states of Santa Catarina and Rio Grande do Sul, with
an installed capacity of 1,140 MW and a physical guarantee of 519.8 average MW. CEEE-G's share in the Consortium was 5.53%, which implied
the same percentage of costs and charges for the project under its responsibility.
As provided for in item 5.54 of the Privatization
Notice of Auction Notice No. 01/2022 and under the terms of the contract establishing the Machadinho Consortium, the other consortium
members exercised their right of preference to acquire the entire stake in CEEE-G. The sale of CEEE-G's stake in Consórcio Machadinho
occurred after the parties agreed to all the terms and conditions of the definitive transaction documents and the usual conditions for
closing.
Under the terms and conditions of the agreed contract,
the completion of the transaction was subject to compliance with the Precedent Condition, with the closure subject to the parties obtaining
prior approval from the National Electric Energy Agency – ANEEL to carry out the Transaction, the which was granted in August 2023.
The Closing of the transaction was carried out on 09/29/2023, for the amount of R$ 114,763,385.98 (one hundred and fourteen million, seven
hundred and sixty-three thousand, three hundred and eighty-five reais and ninety-eight cents).
| 9.f) | Investment properties |
The balance of investment properties is shown below:
Quarterly Financial Information – September 30, 2023 – Companhia Siderúrgica Nacional (CONVENIENCE TRANSLATION INTO ENGLISH FROM THE ORIGINAL PREVIOUSLY ISSUED IN PORTUGUESE) | |
| |
|
|
|
|
|
Consolidated |
|
|
|
|
|
Parent Company |
| |
|
Land |
|
Buildings |
|
Total |
|
Land |
|
Buildings |
|
Total |
| Balance at December 31, 2022 |
|
101,513 |
|
57,567 |
|
159,080 |
|
94,257 |
|
45,886 |
|
140,143 |
| Cost |
|
101,513 |
|
87,977 |
|
189,490 |
|
94,257 |
|
74,392 |
|
168,649 |
| Accumulated depreciation |
|
|
|
(30,410) |
|
(30,410) |
|
|
|
(28,506) |
|
(28,506) |
| Balance at December 31, 2022 |
|
101,513 |
|
57,567 |
|
159,080 |
|
94,257 |
|
45,886 |
|
140,143 |
| Acquisitions |
|
48,000 |
|
|
|
48,000 |
|
|
|
|
|
- |
| Depreciation (note 24) |
|
|
|
(2,299) |
|
(2,299) |
|
|
|
(1,799) |
|
(1,799) |
| Transfer between groups - fixed assets and investment property |
|
7,298 |
|
|
|
7,298 |
|
|
|
|
|
- |
| Balance at September 30, 2023 |
|
156,811 |
|
55,268 |
|
212,079 |
|
94,257 |
|
44,087 |
|
138,344 |
| Cost |
|
156,811 |
|
88,112 |
|
244,923 |
|
94,257 |
|
74,391 |
|
168,648 |
| Accumulated depreciation |
|
|
|
(32,844) |
|
(32,844) |
|
|
|
(30,304) |
|
(30,304) |
| Balance at September 30, 2023 |
|
156,811 |
|
55,268 |
|
212,079 |
|
94,257 |
|
44,087 |
|
138,344 |
The Company’s estimate of the fair value of investment
properties was made for December 31, 2022. The fair value of investment property in the consolidated balance as of September 30, 2023,
and December 31, 2022 is R$2,163,610 and in the parent company R$2,097,290.
The estimated average useful lives for the periods
are as follows (in years):
| |
|
|
Consolidated |
|
|
|
Parent Company |
| |
09/30/2023 |
|
12/31/2022 |
|
09/30/2023 |
|
12/31/2022 |
| Buildings |
27 |
|
27 |
|
28 |
|
28 |
| 10. | PROPERTY, PLANT AND EQUIPMENT |
| |
|
|
|
|
|
|
|
|
|
|
|
|
|
|
Consolidated |
| |
Land |
|
Buildings and Infrastructure |
|
Machinery, equipment and facilities |
|
Furniture and fixtures |
|
Construction in progress |
|
Right of use (i) |
|
Other (*) |
|
Total |
| Balance at December 31, 2022 |
485,107 |
|
4,451,114 |
|
16,525,293 |
|
40,882 |
|
4,025,550 |
|
644,880 |
|
197,619 |
|
26,370,445 |
| Cost |
485,107 |
|
8,741,911 |
|
36,373,386 |
|
284,863 |
|
4,025,550 |
|
1,057,566 |
|
643,304 |
|
51,611,687 |
| Accumulated depreciation |
|
|
(4,290,797) |
|
(19,848,093) |
|
(243,981) |
|
|
|
(412,686) |
|
(445,685) |
|
(25,241,242) |
| Balance at December 31, 2022 |
485,107 |
|
4,451,114 |
|
16,525,293 |
|
40,882 |
|
4,025,550 |
|
644,880 |
|
197,619 |
|
26,370,445 |
| Effect of foreign exchange differences |
(4,586) |
|
(5,859) |
|
(20,930) |
|
(335) |
|
(2,973) |
|
(2,134) |
|
(104) |
|
(36,921) |
| Acquisitions |
46,495 |
|
41,397 |
|
202,304 |
|
1,439 |
|
2,572,342 |
|
70,397 |
|
14,453 |
|
2,948,827 |
| Capitalized interest (1) (notes 26) |
|
|
|
|
|
|
|
|
133,864 |
|
|
|
|
|
133,864 |
| Write-offs (note 25) (2) |
(1,627) |
|
(12,021) |
|
(13,642) |
|
(28) |
|
|
|
|
|
(47) |
|
(27,365) |
| Depreciation (note 24) |
|
|
(218,318) |
|
(1,910,034) |
|
(7,501) |
|
|
|
(113,531) |
|
(44,445) |
|
(2,293,829) |
| Transfers to other asset categories |
2,304 |
|
171,690 |
|
1,952,991 |
|
354 |
|
(2,410,621) |
|
|
|
283,282 |
|
|
| Transfer between groups - intangible assets and investment property |
(6,637) |
|
(21,528) |
|
3,420 |
|
101 |
|
(6,951) |
|
|
|
|
|
(31,595) |
| Right of use - Remesurement |
|
|
|
|
|
|
|
|
|
|
80,481 |
|
|
|
80,481 |
| Mazet Acquisition |
|
|
380 |
|
5,040 |
|
390 |
|
|
|
|
|
814 |
|
6,624 |
| Others |
|
|
175 |
|
730 |
|
|
|
13,352 |
|
|
|
|
|
14,257 |
| Balance at September 30, 2023 |
521,056 |
|
4,407,030 |
|
16,745,172 |
|
35,302 |
|
4,324,563 |
|
680,093 |
|
451,572 |
|
27,164,788 |
| Cost |
521,056 |
|
8,887,061 |
|
37,408,300 |
|
284,600 |
|
4,324,563 |
|
1,162,831 |
|
1,856,401 |
|
54,444,812 |
| Accumulated depreciation |
|
|
(4,480,031) |
|
(20,663,128) |
|
(249,298) |
|
|
|
(482,738) |
|
(1,404,829) |
|
(27,280,024) |
| Balance at September 30, 2023 |
521,056 |
|
4,407,030 |
|
16,745,172 |
|
35,302 |
|
4,324,563 |
|
680,093 |
|
451,572 |
|
27,164,788 |
| |
|
|
|
|
|
|
|
|
|
|
|
|
|
|
|
Parent Company |
| |
|
Land |
|
Buildings and Infrastructure |
|
Machinery, equipment and facilities |
|
Furniture and fixtures |
|
Construction in progress |
|
Right of use (i) |
|
Other (*) |
|
Total |
| Balance at December 31, 2022 |
|
25,618 |
|
287,746 |
|
6,533,142 |
|
10,201 |
|
900,421 |
|
11,433 |
|
17,924 |
|
7,786,485 |
| Cost |
|
25,618 |
|
520,372 |
|
15,233,464 |
|
100,323 |
|
900,421 |
|
38,133 |
|
132,073 |
|
16,950,404 |
| Accumulated depreciation |
|
|
|
(232,626) |
|
(8,700,322) |
|
(90,122) |
|
|
|
(26,700) |
|
(114,149) |
|
(9,163,919) |
| Balance at December 31, 2022 |
|
25,618 |
|
287,746 |
|
6,533,142 |
|
10,201 |
|
900,421 |
|
11,433 |
|
17,924 |
|
7,786,485 |
| Acquisitions |
|
|
|
|
|
87,944 |
|
|
|
1,040,122 |
|
3,990 |
|
176 |
|
1,132,232 |
| Capitalized interest (1) (note 26) |
|
|
|
|
|
|
|
|
|
46,503 |
|
|
|
|
|
46,503 |
| Write-offs (note 25) |
|
|
|
|
|
(659) |
|
|
|
|
|
|
|
|
|
(659) |
| Depreciation (note 24) |
|
|
|
(13,187) |
|
(833,431) |
|
(1,352) |
|
|
|
(6,866) |
|
(5,428) |
|
(860,264) |
| Transfers to other asset categories |
|
|
|
393 |
|
1,166,963 |
|
|
|
(1,190,218) |
|
|
|
22,862 |
|
|
| Transfer between groups - intangible assets and investment property |
|
|
|
|
|
|
|
|
|
(4,623) |
|
|
|
|
|
(4,623) |
| Others |
|
|
|
|
|
(68) |
|
|
|
|
|
|
|
|
|
(68) |
| Balance at September 30, 2023 |
|
25,618 |
|
274,952 |
|
6,953,891 |
|
8,849 |
|
792,205 |
|
8,557 |
|
35,534 |
|
8,099,606 |
| Cost |
|
25,618 |
|
520,766 |
|
16,487,592 |
|
100,323 |
|
792,205 |
|
41,583 |
|
155,220 |
|
18,123,307 |
| Accumulated depreciation |
|
|
|
(245,814) |
|
(9,533,701) |
|
(91,474) |
|
|
|
(33,026) |
|
(119,686) |
|
(10,023,701) |
| Balance at September 30, 2023 |
|
25,618 |
|
274,952 |
|
6,953,891 |
|
8,849 |
|
792,205 |
|
8,557 |
|
35,534 |
|
8,099,606 |
(*) Refer substantially to: i) in the consolidated
table: assets for railway use, such as yards, rails, mines, and sleepers; and ii) in the parent company's table: improvements to
third-party assets, vehicles and hardware.
(1) The costs of capitalized
borrowing are basically determined for the projects in Steelmaking and Mining and refer substantially, to:
Quarterly Financial Information – September 30, 2023 – Companhia Siderúrgica Nacional (CONVENIENCE TRANSLATION INTO ENGLISH FROM THE ORIGINAL PREVIOUSLY ISSUED IN PORTUGUESE) | |
- CSN: Technological updates and acquisition of
new equipment for maintenance of the production capacity of UPV Plant (RJ);
- CSN Mineração: Expansion of Casa
de Pedra (MG) and TECAR (RJ).
(2) In September 2023, CEEE-G
sold its stake in Consórcio Machadinho, where it recognized the write-off of assets related to this stake in the amount of R$22,326,
an amount recognized in other operating expenses (see note 25).
Below are the movements of the right of use:
| |
|
|
|
|
|
|
|
|
Consolidated |
| |
Land |
|
Buildings and Infrastructure |
|
Machinery, equipment and facilities |
|
Others |
|
Total |
| Balance at December 31, 2022 |
465,048 |
|
62,431 |
|
83,161 |
|
34,240 |
|
644,880 |
| Cost |
548,756 |
|
107,782 |
|
277,865 |
|
123,164 |
|
1,057,567 |
| Accumulated depreciation |
(83,708) |
|
(45,351) |
|
(194,704) |
|
(88,924) |
|
(412,687) |
| Balance at December 31, 2022 |
465,048 |
|
62,431 |
|
83,161 |
|
34,240 |
|
644,880 |
| Effect of foreign exchange differences |
- |
|
(1,315) |
|
133 |
|
(952) |
|
(2,134) |
| Addition |
65,081 |
|
4,400 |
|
- |
|
917 |
|
70,398 |
| Remesurement |
16,704 |
|
37,485 |
|
20,948 |
|
5,343 |
|
80,480 |
| Depreciation |
(25,380) |
|
(13,993) |
|
(56,906) |
|
(17,252) |
|
(113,531) |
| Transfers to other asset categories |
(2,702) |
|
2,340 |
|
2,296 |
|
(1,934) |
|
|
| Balance at September 30, 2023 |
518,751 |
|
91,348 |
|
49,632 |
|
20,362 |
|
680,093 |
| Cost |
630,169 |
|
143,888 |
|
291,573 |
|
97,201 |
|
1,162,831 |
| Accumulated depreciation |
(111,418) |
|
(52,540) |
|
(241,941) |
|
(76,839) |
|
(482,738) |
| Balance at September 30, 2023 |
518,751 |
|
91,348 |
|
49,632 |
|
20,362 |
|
680,093 |
| |
|
|
|
|
|
|
|
Parent Company |
| |
|
Land |
|
Machinery, equipment and facilities |
|
Others |
|
Total |
| Balance at December 31, 2022 |
|
9,400 |
|
1,870 |
|
163 |
|
11,433 |
| Cost |
|
33,307 |
|
2,639 |
|
2,187 |
|
38,133 |
| Accumulated depreciation |
|
(23,907) |
|
(769) |
|
(2,024) |
|
(26,700) |
| Balance at December 31, 2022 |
|
9,400 |
|
1,870 |
|
163 |
|
11,433 |
| Remesurement |
|
3,906 |
|
84 |
|
- |
|
3,990 |
| Depreciation |
|
(6,112) |
|
(589) |
|
(165) |
|
(6,866) |
| Transfers to other asset categories |
|
201 |
|
(203) |
|
2 |
|
|
| Balance at September 30, 2023 |
|
7,395 |
|
1,162 |
|
- |
|
8,557 |
| Cost |
|
37,415 |
|
2,477 |
|
1,691 |
|
41,583 |
| Accumulated depreciation |
|
(30,020) |
|
(1,315) |
|
(1,691) |
|
(33,026) |
| Balance at September 30, 2023 |
|
7,395 |
|
1,162 |
|
- |
|
8,557 |
The estimated average useful lives are as follows
(in years):
| |
|
|
Consolidated |
|
|
|
Parent Company |
| |
09/30/2023 |
|
12/31/2022 |
|
09/30/2023 |
|
12/31/2022 |
| Buildings and Infrastructure |
34 |
|
34 |
|
31 |
|
31 |
| Machinery, equipment and facilities |
18 |
|
18 |
|
19 |
|
20 |
| Furniture and fixtures |
11 |
|
12 |
|
13 |
|
13 |
| Others |
11 |
|
9 |
|
11 |
|
12 |
Quarterly Financial Information – September 30, 2023 – Companhia Siderúrgica Nacional (CONVENIENCE TRANSLATION INTO ENGLISH FROM THE ORIGINAL PREVIOUSLY ISSUED IN PORTUGUESE) | |
11.
INTANGIBLE ASSETS
| |
|
|
|
|
|
|
|
|
|
|
|
|
Consolidated |
|
|
|
Parent Company |
| |
Goodwill |
|
Customer relationships |
|
Software |
|
Trademarks
and
patents |
|
Rights and licenses (*) |
|
Others |
|
Total |
|
Software |
|
Total |
| Balance at December 31, 2022 |
4,131,483 |
|
152,484 |
|
87,846 |
|
225,187 |
|
6,188,654 |
|
2,400 |
|
10,788,054 |
|
59,499 |
|
59,499 |
| Cost |
4,371,890 |
|
753,307 |
|
296,456 |
|
226,581 |
|
6,400,593 |
|
2,400 |
|
12,051,227 |
|
178,747 |
|
178,747 |
| Accumulated amortization |
(131,077) |
|
(600,823) |
|
(208,610) |
|
(1,394) |
|
(211,939) |
|
|
|
(1,153,843) |
|
(119,248) |
|
(119,248) |
| Adjustment for accumulated recoverable value |
(109,330) |
|
|
|
|
|
|
|
|
|
|
|
(109,330) |
|
|
|
|
| Balance at December 31, 2022 |
4,131,483 |
|
152,484 |
|
87,846 |
|
225,187 |
|
6,188,654 |
|
2,400 |
|
10,788,054 |
|
59,499 |
|
59,499 |
| Effect of foreign exchange differences |
|
|
(4,983) |
|
(163) |
|
(9,104) |
|
|
|
(116) |
|
(14,366) |
|
|
|
|
| Acquisitions |
|
|
349 |
|
1,063 |
|
|
|
|
|
|
|
1,412 |
|
|
|
|
| Transfer between groups - fixed assets and investment property |
(5,228) |
|
|
|
9,180 |
|
83 |
|
20,262 |
|
|
|
24,297 |
|
4,623 |
|
4,623 |
| Amortization (note 24) |
|
|
(57,694) |
|
(15,228) |
|
(2,165) |
|
(110,662) |
|
|
|
(185,749) |
|
(9,314) |
|
(9,314) |
| Others |
|
|
|
|
652 |
|
|
|
|
|
|
|
652 |
|
|
|
|
| Balance at September 30, 2023 |
4,126,255 |
|
90,156 |
|
83,350 |
|
214,001 |
|
6,098,254 |
|
2,284 |
|
10,614,300 |
|
54,808 |
|
54,808 |
| Cost |
4,675,302 |
|
718,929 |
|
301,357 |
|
217,560 |
|
6,422,018 |
|
2,284 |
|
12,337,450 |
|
183,370 |
|
183,370 |
| Accumulated amortization |
(549,047) |
|
(628,773) |
|
(218,007) |
|
(3,559) |
|
(323,764) |
|
|
|
(1,723,150) |
|
(128,562) |
|
(128,562) |
| Balance at September 30, 2023 |
4,126,255 |
|
90,156 |
|
83,350 |
|
214,001 |
|
6,098,254 |
|
2,284 |
|
10,614,300 |
|
54,808 |
|
54,808 |
(*) Composed mainly of: (i) mining rights whose amortization
is based on production volume and (ii) Concession agreement for the use of water resources in the acquisition of control of Companhia
Estadual de Geração de Energia Elétrica, amortized over the agreement term (note 3.c).
The estimated average useful lives are as follows
(in years):
| |
|
|
Consolidated |
|
|
|
Parent Company |
| |
09/30/2023 |
|
12/31/2022 |
|
09/30/2023 |
|
12/31/2022 |
| Software |
10 |
|
10 |
|
10 |
|
10 |
| Customer relationships |
13 |
|
13 |
|
|
|
|
| 11.a) | Goodwill impairment test |
Goodwill arising from expected future profitability
of acquired companies and intangible assets with indefinite useful lives (brands) were allocated to CSN’s cash generating units
(CGUs) which represent the lowest level of assets or group of assets of the Company. According to NBC
TG 01(R4)/IAS36, when a CGU has an intangible asset with no defined useful life allocated, the Company must perform an impairment
test.
The assumptions used for impairment assessment
in December 2022 remain in place and there is no event that would justify recording impairment on September 30, 2023.
| 12. | BORROWINGS, FINANCING AND DEBENTURES |
The balances of borrowings, financing and debentures
that are recorded at amortized cost are as follows:
Quarterly Financial Information – September 30, 2023 – Companhia Siderúrgica Nacional (CONVENIENCE TRANSLATION INTO ENGLISH FROM THE ORIGINAL PREVIOUSLY ISSUED IN PORTUGUESE) | |
| |
|
|
|
|
|
|
|
|
Consolidated |
|
|
|
|
|
|
Parent Company |
| |
|
|
Current Liabilities |
|
Non-current Liabilities |
|
Current Liabilities |
Non-current Liabilities |
| |
|
|
09/30/2023 |
|
12/31/2022 |
|
09/30/2023 |
|
12/31/2022 |
|
09/30/2023 |
|
12/31/2022 |
09/30/2023 |
|
12/31/2022 |
| |
|
|
|
|
|
|
|
|
|
|
|
|
|
|
|
|
| Foreign Debt |
|
|
|
|
|
|
|
|
|
|
|
|
|
|
|
|
| Floating Rates: |
|
|
|
|
|
|
|
|
|
|
|
|
|
|
|
|
| Prepayment |
|
|
587,584 |
|
1,571,208 |
|
6,916,730 |
|
5,474,359 |
|
197,206 |
|
956,219 |
1,869,079 |
|
1,147,894 |
| Fixed Rates: |
|
|
|
|
|
|
|
|
|
|
|
|
|
|
|
|
| Bonds, Perpetual bonds, Facility, CCE and ACC |
|
|
2,672,443 |
|
1,189,717 |
|
16,102,336 |
|
16,790,284 |
|
2,061,884 |
|
616,954 |
751,140 |
|
782,655 |
| Intercompany |
|
|
|
|
|
|
|
|
|
|
624,413 |
|
43,196 |
6,756,884 |
|
8,216,508 |
| Fixed interest in EUR |
|
|
|
|
|
|
|
|
|
|
|
|
|
|
|
|
| Intercompany |
|
|
|
|
|
|
|
|
|
|
1,065,513 |
|
858 |
662,047 |
|
1,767,536 |
| Facility |
|
|
378,102 |
|
62,187 |
|
126,139 |
|
166,302 |
|
|
|
|
|
|
|
| |
|
|
3,638,129 |
|
2,823,112 |
|
23,145,205 |
|
22,430,945 |
|
3,949,016 |
|
1,617,227 |
10,039,150 |
|
11,914,593 |
| |
|
|
|
|
|
|
|
|
|
|
|
|
|
|
|
|
| Debt agreements in Brazil |
|
|
|
|
|
|
|
|
|
|
|
|
|
|
|
|
| Floating Rate Securities in R$: |
|
|
|
|
|
|
|
|
|
|
|
|
|
|
|
|
| BNDES/FINAME/FINEP, Debentures, NCE and CCB |
|
|
2,502,516 |
|
2,446,840 |
|
14,910,155 |
|
13,740,051 |
|
2,230,637 |
|
1,827,077 |
7,282,210 |
|
6,110,174 |
| |
|
|
2,502,516 |
|
2,446,840 |
|
14,910,155 |
|
13,740,051 |
|
2,230,637 |
|
1,827,077 |
7,282,210 |
|
6,110,174 |
| Total Borrowings and Financing |
|
|
6,140,645 |
|
5,269,952 |
|
38,055,360 |
|
36,170,996 |
|
6,179,653 |
|
3,444,304 |
17,321,360 |
|
18,024,767 |
| Transaction Costs and Issue Premiums |
|
|
(89,624) |
|
(76,316) |
|
(532,160) |
|
(445,890) |
|
(23,210) |
|
(25,285) |
(60,690) |
|
(30,518) |
| Total Borrowings and Financing + Transaction cost |
|
|
6,051,021 |
|
5,193,636 |
|
37,523,200 |
|
35,725,106 |
|
6,156,443 |
|
3,419,019 |
17,260,670 |
|
17,994,249 |
| 12.a) | Borrowing and amortization, financing, and debentures |
The following table shows amortization and funding
during the period:
| |
|
|
|
Consolidated |
|
|
|
Parent Company |
| |
|
09/30/2023 |
|
12/31/2022 |
|
09/30/2023 |
|
12/31/2022 |
| Opening balance |
|
40,918,742 |
|
32,507,522 |
|
21,413,268 |
|
20,432,844 |
| New debts |
|
9,994,046 |
|
20,248,223 |
|
6,327,750 |
|
9,922,074 |
| Repayment |
|
(6,401,408) |
|
(10,782,858) |
|
(4,119,008) |
|
(8,270,606) |
| Payments of charges |
|
(2,376,367) |
|
(2,315,586) |
|
(1,002,965) |
|
(1,128,874) |
| Accrued charges (note 26) |
|
2,744,583 |
|
2,595,011 |
|
1,350,256 |
|
1,270,946 |
| Consolidation of companies |
|
|
|
81,978 |
|
|
|
|
| Others (1) |
|
(1,305,375) |
|
(1,415,548) |
|
(552,188) |
|
(813,116) |
| Closing balance |
|
43,574,221 |
|
40,918,742 |
|
23,417,113 |
|
21,413,268 |
| (1) | Including unrealized exchange and monetary variations and funding cost. |
The Company raised and amortized borrowings, financing
and debentures during 2023, as shown below:
| |
|
|
|
|
|
|
|
Consolidated |
| |
|
|
|
|
|
|
|
09/30/2023 |
| Nature |
|
New debts |
|
Maturities |
|
Repayment |
|
Interest payment |
| Pre-Payment |
|
1,890,333 |
|
2023 to 2028 |
|
(1,111,083) |
|
(301,860) |
| Bonds, ACC, CCE and Facility |
|
3,732,296 |
|
2023 to 2024 |
|
(2,050,568) |
|
(692,384) |
| BNDES/FINAME/FINEP, Debentures, NCE, Facility and CCB |
|
4,371,417 |
|
2023 to 2025 |
|
(3,239,757) |
|
(1,382,123) |
| |
|
9,994,046 |
|
|
|
(6,401,408) |
|
(2,376,367) |
Quarterly Financial Information – September 30, 2023 – Companhia Siderúrgica Nacional (CONVENIENCE TRANSLATION INTO ENGLISH FROM THE ORIGINAL PREVIOUSLY ISSUED IN PORTUGUESE) | |
| 12.b) | Maturities of borrowings, financing and debentures presented in current and non-current liabilities |
| |
|
|
|
|
|
Consolidated |
|
|
|
|
|
Parent Company |
| |
|
|
|
|
|
09/30/2023 |
|
|
|
|
|
09/30/2023 |
| |
|
Borrowings and financing in foreign currency |
|
Borrowings and financing in national currency |
|
Total |
|
Borrowings and financing in foreign currency |
|
Borrowings and financing in national currency |
|
Total |
| Average rate |
|
in Dollar 6.81% in Euro 5.49% |
|
in Real 14.32% |
|
|
in Dollar 4.56% in Euro 3.41% |
|
in Real 14.43% |
|
| 2023 |
|
1,545,426 |
|
1,182,382 |
|
2,727,808 |
|
1,218,433 |
|
963,229 |
|
2,181,662 |
| 2024 |
|
2,302,924 |
|
3,887,860 |
|
6,190,784 |
|
2,812,398 |
|
1,788,626 |
|
4,601,024 |
| 2025 |
|
3,165,621 |
|
1,789,986 |
|
4,955,607 |
|
3,030,141 |
|
1,320,598 |
|
4,350,739 |
| 2026 |
|
2,874,253 |
|
2,368,226 |
|
5,242,479 |
|
769,663 |
|
1,812,598 |
|
2,582,261 |
| 2027 |
|
937,703 |
|
2,360,969 |
|
3,298,672 |
|
91,138 |
|
1,832,098 |
|
1,923,236 |
| 2028 to 2031 |
|
12,830,896 |
|
3,007,220 |
|
15,838,116 |
|
3,321,163 |
|
1,383,320 |
|
4,704,483 |
| After 2031 |
|
3,126,511 |
|
2,816,028 |
|
5,942,539 |
|
2,745,230 |
|
412,378 |
|
3,157,608 |
| |
|
26,783,334 |
|
17,412,671 |
|
44,196,005 |
|
13,988,166 |
|
9,512,847 |
|
23,501,013 |
·
Covenants
The Company maintains contracts that provide for
the fulfillment of certain non-financial obligations, as well as the maintenance of certain parameters and performance indicators, such
as the equity ratio disclosure of its audited interim financial information according to regulatory deadlines or payment of commission
for risk assumption, if the indicator of net debt to EBITDA reaches the levels foreseen in those contracts.
To the moment, the Company is compliant with the
financial and non-financial obligations (covenants) of its existing contracts.
13.
FINANCIAL INSTRUMENTS
| 13.a) | Identification and valuation of financial instruments |
The Company may operate with several financial
instruments, with emphasis on cash and cash equivalents, including financial investments, marketable securities, accounts receivable from
customers, accounts payable to suppliers and borrowings and financing. Additionally, we may also operate with derivative financial instruments,
such as swap exchange rate swap, swap interest and derivatives with commodities.
Considering the nature of these instruments, their
fair value is basically determined by the use of quotations in the capital markets in Brazil and the Mercantile and Futures Exchange.
The amounts recorded in current assets and liabilities have immediate liquidity or maturity, mostly in the short term. Considering the
terms and characteristics of these instruments, the carrying amounts approximate the fair values.
Quarterly Financial Information – September 30, 2023 – Companhia Siderúrgica Nacional (CONVENIENCE TRANSLATION INTO ENGLISH FROM THE ORIGINAL PREVIOUSLY ISSUED IN PORTUGUESE) | |
| · | Classification of financial
instruments |
| |
|
|
|
|
|
|
|
|
|
|
|
|
|
|
|
|
|
Consolidated |
| Consolidated |
|
|
|
|
|
09/30/2023 |
|
|
|
12/31/2022 |
| |
Notes |
|
Fair value through other comprehensive income |
|
Fair value through profit or loss |
|
Measured at amortized cost |
|
Balances |
|
Fair value through other comprehensive income |
|
Fair value through profit or loss |
|
Measured at amortized cost |
|
Balances |
| |
|
|
|
|
|
|
|
|
| Assets |
|
|
|
|
|
|
|
|
|
|
|
|
|
|
|
|
|
|
| Current |
|
|
|
|
|
|
|
|
|
|
|
|
|
|
|
|
|
|
| Cash and cash equivalents |
|
3 |
|
|
|
|
|
15,302,620 |
|
15,302,620 |
|
|
|
|
|
11,991,356 |
|
11,991,356 |
| Short-term investments |
|
4 |
|
|
|
1,106,108 |
|
38,491 |
|
1,144,599 |
|
|
|
1,184,895 |
|
271,590 |
|
1,456,485 |
| Trade receivables |
|
5 |
|
|
|
|
|
3,179,048 |
|
3,179,048 |
|
|
|
|
|
3,233,164 |
|
3,233,164 |
| Dividends and interest on equity |
|
8 |
|
|
|
|
|
155,808 |
|
155,808 |
|
|
|
|
|
77,377 |
|
77,377 |
| Trading securities |
|
8 |
|
|
|
8,096 |
|
|
|
8,096 |
|
|
|
9,596 |
|
|
|
9,596 |
| Loans - related parties |
|
8 |
|
|
|
|
|
5,335 |
|
5,335 |
|
|
|
|
|
5,383 |
|
5,383 |
| Total |
|
|
|
|
|
1,114,204 |
|
18,681,302 |
|
19,795,506 |
|
|
|
1,194,491 |
|
15,578,870 |
|
16,773,361 |
| |
|
|
|
|
|
|
|
|
|
|
|
|
|
|
|
|
|
|
| Non-current |
|
|
|
|
|
|
|
|
|
|
|
|
|
|
|
|
|
|
| Investments |
|
4 |
|
|
|
|
|
131,906 |
|
131,906 |
|
|
|
|
|
156,185 |
|
156,185 |
| Other trade receivables |
|
8 |
|
|
|
|
|
10,406 |
|
10,406 |
|
|
|
|
|
8,059 |
|
8,059 |
| Eletrobrás compulsory loan |
|
8 |
|
|
|
|
|
54,254 |
|
54,254 |
|
|
|
|
|
58,030 |
|
58,030 |
| Receivables by indemnity |
|
8 |
|
|
|
|
|
988,148 |
|
988,148 |
|
|
|
|
|
974,863 |
|
974,863 |
| Loans - related parties |
|
8 |
|
|
|
|
|
1,617,913 |
|
1,617,913 |
|
|
|
|
|
1,384,773 |
|
1,384,773 |
| Investments |
|
9 |
|
|
|
68,049 |
|
|
|
68,049 |
|
|
|
94,700 |
|
|
|
94,700 |
| Total |
|
|
|
|
|
68,049 |
|
2,802,627 |
|
2,870,676 |
|
|
|
94,700 |
|
2,581,910 |
|
2,676,610 |
| |
|
|
|
|
|
|
|
|
|
|
|
|
|
|
|
|
|
|
| Total Assets |
|
|
|
|
|
1,182,253 |
|
21,483,929 |
|
22,666,182 |
|
|
|
1,289,191 |
|
18,160,780 |
|
19,449,971 |
| |
|
|
|
|
|
|
|
|
|
|
|
|
|
|
|
|
|
|
| Liabilities |
|
|
|
|
|
|
|
|
|
|
|
|
|
|
|
|
|
|
| Current |
|
|
|
|
|
|
|
|
|
|
|
|
|
|
|
|
|
|
| Borrowings and financing |
|
12 |
|
|
|
|
|
6,140,645 |
|
6,140,645 |
|
|
|
|
|
5,269,952 |
|
5,269,952 |
| Leases |
|
14 |
|
|
|
|
|
144,781 |
|
144,781 |
|
|
|
|
|
177,010 |
|
177,010 |
| Trade payables |
|
15 |
|
|
|
|
|
7,047,849 |
|
7,047,849 |
|
|
|
|
|
6,596,915 |
|
6,596,915 |
| Trade payables - drawee risk |
|
16 |
|
|
|
|
|
2,993,574 |
|
2,993,574 |
|
|
|
|
|
5,709,069 |
|
5,709,069 |
| Dividends and interest on capital |
|
16 |
|
|
|
|
|
4,939 |
|
4,939 |
|
|
|
|
|
611,307 |
|
611,307 |
| Derivative financial instruments (note 16) |
|
|
|
87,099 |
|
43,421 |
|
|
|
130,520 |
|
416,935 |
|
|
|
|
|
416,935 |
| Total |
|
|
|
87,099 |
|
43,421 |
|
16,331,788 |
|
16,462,308 |
|
416,935 |
|
|
|
18,364,253 |
|
18,781,188 |
| |
|
|
|
|
|
|
|
|
|
|
|
|
|
|
|
|
|
|
| Non-current |
|
|
|
|
|
|
|
|
|
|
|
|
|
|
|
|
|
|
| Borrowings and financing |
|
12 |
|
|
|
|
|
38,055,360 |
|
38,055,360 |
|
|
|
|
|
36,170,996 |
|
36,170,996 |
| Leases |
|
14 |
|
|
|
|
|
595,795 |
|
595,795 |
|
|
|
|
|
516,836 |
|
516,836 |
| Trade payables |
|
15 |
|
|
|
|
|
16,560 |
|
16,560 |
|
|
|
|
|
46,269 |
|
46,269 |
| Derivative financial instruments (note 16) |
|
16 |
|
|
|
50,520 |
|
|
|
50,520 |
|
|
|
69,472 |
|
|
|
69,472 |
| Total |
|
|
|
|
|
50,520 |
|
38,667,715 |
|
38,718,235 |
|
|
|
69,472 |
|
36,734,101 |
|
36,803,573 |
| |
|
|
|
|
|
|
|
|
|
|
|
|
|
|
|
|
|
|
| Total Liabilities |
|
|
|
87,099 |
|
93,941 |
|
54,999,503 |
|
55,180,543 |
|
416,935 |
|
69,472 |
|
55,098,354 |
|
55,584,761 |
Quarterly Financial Information – September 30, 2023 – Companhia Siderúrgica Nacional (CONVENIENCE TRANSLATION INTO ENGLISH FROM THE ORIGINAL PREVIOUSLY ISSUED IN PORTUGUESE) | |
| |
|
|
|
|
|
|
|
|
|
|
|
|
|
Parent Company |
| Parent Company |
|
|
|
|
|
09/30/2023 |
|
|
|
12/31/2022 |
| |
Notes |
|
Fair value through profit or loss |
|
Measured at amortized cost |
|
Balances |
|
Fair value through profit or loss |
|
Measured at amortized cost |
|
Balances |
| |
|
|
|
|
|
|
| Assets |
|
|
|
|
|
|
|
|
|
|
|
|
|
|
| Current |
|
|
|
|
|
|
|
|
|
|
|
|
|
|
| Cash and cash equivalents |
|
3 |
|
|
|
1,963,467 |
|
1,963,467 |
|
|
|
2,839,405 |
|
2,839,405 |
| Short-term investments |
|
4 |
|
1,106,108 |
|
30,371 |
|
1,136,479 |
|
1,184,895 |
|
22,715 |
|
1,207,610 |
| Trade receivables |
|
5 |
|
|
|
2,004,972 |
|
2,004,972 |
|
|
|
1,956,531 |
|
1,956,531 |
| Dividends and interest on equity |
|
8 |
|
|
|
235,782 |
|
235,782 |
|
|
|
295,480 |
|
295,480 |
| Trading securities |
|
8 |
|
7,981 |
|
|
|
7,981 |
|
9,488 |
|
|
|
9,488 |
| Loans - related parties |
|
8 |
|
|
|
5,335 |
|
5,335 |
|
|
|
5,383 |
|
5,383 |
| Total |
|
|
|
1,114,089 |
|
4,239,927 |
|
5,354,016 |
|
1,194,383 |
|
5,119,514 |
|
6,313,897 |
| |
|
|
|
|
|
|
|
|
|
|
|
|
|
|
| Non-current |
|
|
|
|
|
|
|
|
|
|
|
|
|
|
| Investments |
|
4 |
|
|
|
115,175 |
|
115,175 |
|
|
|
140,510 |
|
140,510 |
| Other trade receivables |
|
8 |
|
|
|
1,003 |
|
1,003 |
|
|
|
1,003 |
|
1,003 |
| Eletrobrás compulsory loan |
|
8 |
|
|
|
51,624 |
|
51,624 |
|
|
|
55,336 |
|
55,336 |
| Receivables by indemnity |
|
8 |
|
|
|
988,148 |
|
988,148 |
|
|
|
974,863 |
|
974,863 |
| Loans - related parties |
|
8 |
|
|
|
2,020,000 |
|
2,020,000 |
|
|
|
1,668,382 |
|
1,668,382 |
| Investments |
|
9 |
|
68,049 |
|
|
|
68,049 |
|
94,700 |
|
|
|
94,700 |
| Total |
|
|
|
68,049 |
|
3,175,950 |
|
3,243,999 |
|
94,700 |
|
2,840,094 |
|
2,934,794 |
| |
|
|
|
|
|
|
|
|
|
|
|
|
|
|
| Total Assets |
|
|
|
1,182,138 |
|
7,415,877 |
|
8,598,015 |
|
1,289,083 |
|
7,959,608 |
|
9,248,691 |
| |
|
|
|
|
|
|
|
|
|
|
|
|
|
|
| Liabilities |
|
|
|
|
|
|
|
|
|
|
|
|
|
|
| Current |
|
|
|
|
|
|
|
|
|
|
|
|
|
|
| Borrowings and financing |
|
12 |
|
|
|
6,179,653 |
|
6,179,653 |
|
|
|
3,444,304 |
|
3,444,304 |
| Leases |
|
14 |
|
|
|
8,902 |
|
8,902 |
|
|
|
8,451 |
|
8,451 |
| Trade payables |
|
15 |
|
|
|
3,985,582 |
|
3,985,582 |
|
|
|
3,684,793 |
|
3,684,793 |
| Trade payables - drawee risk |
|
16 |
|
|
|
2,691,691 |
|
2,691,691 |
|
|
|
5,318,425 |
|
5,318,425 |
| Dividends and interest on capital |
|
16 |
|
|
|
4,642 |
|
4,642 |
|
|
|
598,267 |
|
598,267 |
| Derivative financial instruments (note 16) |
|
|
|
43,421 |
|
|
|
43,421 |
|
|
|
|
|
|
| Total |
|
|
|
43,421 |
|
12,870,470 |
|
12,913,891 |
|
|
|
13,054,240 |
|
13,054,240 |
| |
|
|
|
|
|
|
|
|
|
|
|
|
|
|
| Non-current |
|
|
|
|
|
|
|
|
|
|
|
|
|
|
| Borrowings and financing |
|
12 |
|
|
|
17,321,360 |
|
17,321,360 |
|
|
|
18,024,767 |
|
18,024,767 |
| Derivative financial instruments (note 16) |
|
16 |
|
|
|
|
|
|
|
58,005 |
|
|
|
58,005 |
| Leases |
|
14 |
|
|
|
865 |
|
865 |
|
|
|
4,729 |
|
4,729 |
| Trade payables |
|
15 |
|
|
|
7,524 |
|
7,524 |
|
|
|
14,352 |
|
14,352 |
| Total |
|
|
|
|
|
17,329,749 |
|
17,329,749 |
|
58,005 |
|
18,043,848 |
|
18,101,853 |
| |
|
|
|
|
|
|
|
|
|
|
|
|
|
|
| Total Liabilities |
|
|
|
43,421 |
|
30,200,219 |
|
30,243,640 |
|
58,005 |
|
31,098,088 |
|
31,156,093 |
The following table shows the financial instruments
recorded at fair value by classifying them according to the fair value hierarchy:
Quarterly Financial Information – September 30, 2023 – Companhia Siderúrgica Nacional (CONVENIENCE TRANSLATION INTO ENGLISH FROM THE ORIGINAL PREVIOUSLY ISSUED IN PORTUGUESE) | |
| Consolidated |
|
|
|
|
|
09/30/2023 |
|
|
|
|
|
12/31/2022 |
| |
Level 1 |
|
Level 2 |
|
Balances |
|
Level 1 |
|
Level 2 |
|
Balances |
| Assets |
|
|
|
|
|
|
|
|
|
|
|
|
| Current |
|
|
|
|
|
|
|
|
|
|
|
|
| Financial investments |
|
1,106,108 |
|
|
|
1,106,108 |
|
1,184,895 |
|
|
|
1,184,895 |
| Trading securities |
|
8,096 |
|
|
|
8,096 |
|
9,596 |
|
|
|
9,596 |
| Non-current |
|
|
|
|
|
|
|
|
|
|
|
|
| Investments |
|
68,049 |
|
|
|
68,049 |
|
94,700 |
|
|
|
94,700 |
| Total Assets |
|
1,182,253 |
|
|
|
1,182,253 |
|
1,289,191 |
|
|
|
1,289,191 |
| |
|
|
|
|
|
|
|
|
|
|
|
|
| Liabilities |
|
|
|
|
|
|
|
|
|
|
|
|
| Current |
|
|
|
|
|
|
|
|
|
|
|
|
| Derivative financial instruments |
|
|
|
43,421 |
|
43,421 |
|
|
|
416,935 |
|
416,935 |
| Non-current |
|
|
|
|
|
|
|
|
|
|
|
|
| Derivative financial instruments |
|
|
|
50,520 |
|
50,520 |
|
|
|
69,472 |
|
69,472 |
| Total Liabilities |
|
|
|
93,941 |
|
93,941 |
|
|
|
486,407 |
|
486,407 |
Level 1
- Data prices are quoted in an active market for items identical to the assets and liabilities being measured.
Level 2
- Consider inputs observable in the market, such as interest rates, exchange rates, etc., but are not prices negotiated in active markets.
Level 3 - There
are no assets and liabilities classified as level 3.
| 13.b) | Financial risk management |
The Company uses risk management strategies with
guidance on the risks incurred by us. The nature and general position of financial risks are regularly monitored and managed in order
to assess results and the financial impact on cash flow. Credit limits and hedge quality of counterparties are also reviewed periodically.
Market risks are hedged when we consider necessary
to support the corporate strategy or when it is necessary to maintain the level of financial flexibility.
We are exposed to exchange rate, interest rate,
market price and liquidity risks.
The Company may manage some of the risks through
the use of derivative instruments not associated with any speculative trading or short selling.
The exposure arises from the existence of assets
and liabilities denominated in Dollar or Euro, since the Company’s functional currency is substantially the Real and is referred
to as natural exchange exposure. The net exposure is the result of the offsetting of the natural exchange exposure by the instruments
of hedge adopted by CSN.
The consolidated net exposure as of September 30,
2023, is shown below.
Quarterly Financial Information – September 30, 2023 – Companhia Siderúrgica Nacional (CONVENIENCE TRANSLATION INTO ENGLISH FROM THE ORIGINAL PREVIOUSLY ISSUED IN PORTUGUESE) | |
| |
|
|
|
|
| |
|
09/30/2023 |
12/31/2022 |
| Foreign Exchange Exposure |
|
(Amounts in US$’000) |
|
(Amounts in US$’000) |
| Cash and cash equivalents overseas |
|
2,000,598 |
|
1,191,036 |
| Trade receivables |
|
294,906 |
|
315,920 |
| Financial investments |
|
15,079 |
|
26,930 |
| Borrowings and financing |
|
(5,355,872) |
|
(4,594,471) |
| Trade payables |
|
(342,828) |
|
(366,149) |
| Others |
|
(50,142) |
|
(23,079) |
| Natural Gross Foreign Exchange Exposure (assets - liabilities) |
|
(3,438,259) |
|
(3,449,813) |
| Cash flow hedge accounting |
|
4,175,190 |
|
4,409,760 |
| Exchange rate swap CDI x Dollar |
|
(67,000) |
|
(67,000) |
| Exchange rate swap Real x Dollar |
|
(115,000) |
|
(115,000) |
| Net foreign exchange exposure |
|
554,931 |
|
777,947 |
CSN uses Hedge Accounting strategy, as well as
derivative financial instruments to protect future cash flows.
Sensitivity analysis of Derivative Financial
Instruments and Consolidated Foreign Exchange Exposure
The Company considered scenarios 1 and 2 to be
25% and 50% deterioration for currency volatility, using the exchange rate closing rate as of September 30, 2023, as a reference.
The currencies used in the sensitivity analysis and their respective
scenarios are shown below:
| |
|
|
|
|
|
|
|
09/30/2023 |
| Currency |
|
Exchange rate |
|
Probable scenario |
|
Scenario 1 |
|
Scenario 2 |
| USD |
|
5.0076 |
|
4.9219 |
|
6.2595 |
|
7.5114 |
| EUR |
|
5.3000 |
|
5.2517 |
|
6.6250 |
|
7.9500 |
| USD x EUR |
|
1.0584 |
|
1.0670 |
|
1.3230 |
|
1.5876 |
The effects on the result,
considering scenarios 1 and 2, are shown below:
| |
|
|
|
|
|
|
|
|
|
09/30/2023 |
| Instruments |
|
Notional |
|
Risk |
|
Probable scenario (*) R$ |
|
Scenario 1 R$ |
|
Scenario 2 R$ |
| |
|
|
|
|
|
|
|
|
|
|
| Gross exchange position |
|
(3,438,259) |
|
Dollar |
|
294,659 |
|
(4,304,356) |
|
(8,608,713) |
| |
|
|
|
|
|
|
|
|
|
|
| Cash flow hedge accounting |
|
4,175,190 |
|
Dollar |
|
(357,814) |
|
5,226,920 |
|
10,453,841 |
| |
|
|
|
|
|
|
|
|
|
|
| Exchange rate swap CDI x Dollar |
|
(67,000) |
|
Dollar |
|
5,742 |
|
(83,877) |
|
(167,755) |
| |
|
|
|
|
|
|
|
|
|
|
| Exchange rate swap Real x Dollar |
|
(115,000) |
|
Dollar |
|
9,856 |
|
(143,969) |
|
(287,937) |
| |
|
|
|
|
|
|
|
|
|
|
| Net exchange position |
|
554,931 |
|
Dollar |
|
(47,557) |
|
694,718 |
|
1,389,436 |
(*) The probable scenarios were calculated considering
the following variations for the risks: Real x Dollar – valuation of the Real by 1.71% / Real x Euro - valuation of the Real by
0.91% / Euro x Dollar – devaluation of the dollar by 0.81%. Source: Central Bank of Brazil and European Central Bank quotations
on November 10, 2023.
This risk arises from financial investments, borrowings
and financing and debentures linked to the fixed and floating interest rates of the CDI, TLP, EURIBOR and SOFR, exposing these financial
assets and liabilities to interest rate fluctuations as shown in the sensitivity analysis table below.
With the modification of the global financial market
in recent years and in line with the recommendations of international regulatory bodies, the market began to transition from the Libor
rate (London Interbank Offered Rate) to the SOFR (Secured Overnight Financing Rate) as of 2022. On September 30, all contracts were migrated
to SOFR, as evidenced in the interest rate sensitivity analysis.
Quarterly Financial Information – September 30, 2023 – Companhia Siderúrgica Nacional (CONVENIENCE TRANSLATION INTO ENGLISH FROM THE ORIGINAL PREVIOUSLY ISSUED IN PORTUGUESE) | |
Sensitivity analysis of changes in interest
rates
We present below the sensitivity analysis for interest
rate risks. The Company considered scenarios 1 and 2 to be 25% and 50% deterioration in interest rate volatility using the closing rate
as of September 30, 2023, as a reference.
The interest rates used in the sensitivity analysis
and their scenarios are shown below:
| |
|
|
|
|
|
Consolidated |
| |
|
|
|
|
|
09/30/2023 |
| Interest |
|
Interest rate |
|
Scenario 1 |
|
Scenario 2 |
| CDI |
|
12.65% |
|
15.81% |
|
18.98% |
| TJLP |
|
7.00% |
|
8.75% |
|
10.50% |
| IPCA |
|
4.61% |
|
5.76% |
|
6.92% |
| SOFR 6M |
|
5.47% |
|
6.84% |
|
8.21% |
| SOFR |
|
5.31% |
|
6.64% |
|
7.97% |
| EURIBOR 3M |
|
3.95% |
|
4.94% |
|
5.93% |
| EURIBOR 6M |
|
4.13% |
|
5.16% |
|
6.20% |
The effects on balances, considering scenarios
1 and 2, are shown below:
| |
|
|
|
|
|
|
|
|
|
|
|
Impact on balances on 09/30/2023 |
| Changes in interest rates |
|
% p.a |
|
Assets |
|
Liabilities |
|
Probable scenario (*)
|
|
Scenario 1 |
|
Scenario 2 |
| CDI |
|
12.65 |
|
4,541,580 |
|
(15,563,121) |
|
(12,415,766) |
|
(12,764,322) |
|
(13,112,878) |
| TJLP |
|
7.00 |
|
|
|
(864,409) |
|
(924,918) |
|
(940,045) |
|
(955,172) |
| IPCA |
|
4.61 |
|
|
|
(36,115) |
|
(37,780) |
|
(38,196) |
|
(38,612) |
| SOFR 6M |
|
5.47 |
|
|
|
(2,085,665) |
|
(2,199,751) |
|
(2,228,272) |
|
(2,256,794) |
| SOFR |
|
5.31 |
|
|
|
(5,830,376) |
|
(6,139,969) |
|
(6,217,367) |
|
(6,294,765) |
| EURIBOR 3M |
|
3.95 |
|
|
|
(474,592) |
|
(493,338) |
|
(498,025) |
|
(502,712) |
| EURIBOR 6M |
|
4.13 |
|
|
|
(28,977) |
|
(30,174) |
|
(30,473) |
|
(30,772) |
(*) The sensitivity analysis is based on the premise
of maintaining the market values as of September 30, 2023 as a probable scenario recorded in the company´s assets and liabilities.
The Company is also exposed to market risks related
to the volatility of commodity and input prices. In line with its risk management policy, risk mitigation strategies involving commodities
can be used to reduce cash flow volatility. These mitigation strategies may incorporate derivative instruments, predominantly forward
transactions, futures, and options.
Below are the instruments for price risk protection,
as shown in the following topics:
a) Cash flow hedge accounting
- “Platts” index
The Company had derivative operations for iron
ore, contracted by the subsidiary CSN Mineração, with the objective of reducing the volatility of its exposure to the commodity.
In order to better reflect the accounting effects
of the Platts hedge strategy in the result, CSN Mineração opted to make the formal designation of the hedge and consequently
adopted hedge accounting of the iron ore derivative as a hedge accounting instrument of its highly probable future iron ore sales. With
this, the mark-to-market resulting from the volatility of Platts will be temporarily recorded in shareholders' equity and will be taken
to the result when the referred sales occur according to the contracted period of assessment, thus allowing the recognition of the volatility
of Platts on the sales of iron ore to be recognized at the same moment.
The table below shows the result of the derivative
instrument until September 30, 2023:
Quarterly Financial Information – September 30, 2023 – Companhia Siderúrgica Nacional (CONVENIENCE TRANSLATION INTO ENGLISH FROM THE ORIGINAL PREVIOUSLY ISSUED IN PORTUGUESE) | |
| |
|
|
|
|
|
|
|
09/30/2023 |
|
09/30/2023 |
|
09/30/2022 |
|
09/30/2023 |
|
09/30/2022 |
|
09/30/2023 |
|
09/30/2022 |
| |
|
|
|
Appreciation (R$) |
|
Fair value (market) |
|
Other income and expenses (note 25) |
|
Other comprehensive income |
|
Exchange variation |
| Maturity |
|
Notional |
|
Asset position |
|
Liability position |
|
Amounts receivable / (payable) |
|
|
|
| 05/31/2022 (Settled) |
|
Platts |
|
|
|
|
|
|
|
|
|
23,374 |
|
|
|
|
|
|
|
(1,087) |
| 01/01/2023 to 01/31/2023 (Settled) |
|
Platts |
|
|
|
|
|
|
|
(196,908) |
|
|
|
|
|
|
|
(1,107) |
|
|
| 02/01/2023 to 02/28/2023 (Settled) |
|
Platts |
|
|
|
|
|
|
|
(212,418) |
|
|
|
|
|
|
|
2,423 |
|
|
| 03/01/2023 to 03/31/2023 (Settled) |
|
Platts |
|
|
|
|
|
|
|
(158,701) |
|
|
|
|
|
|
|
1,982 |
|
|
| 04/01/2023 to 04/30/2023 (Settled) |
|
Platts |
|
|
|
|
|
|
|
21,394 |
|
|
|
|
|
|
|
65 |
|
|
| 05/01/2023 to 05/31/2023 (Settled) |
|
Platts |
|
|
|
|
|
|
|
186,366 |
|
|
|
|
|
|
|
(3,629) |
|
|
| 06/01/2023 to 06/31/2023 (Settled) |
|
Platts |
|
|
|
|
|
|
|
19,092 |
|
|
|
|
|
|
|
(4,801) |
|
|
| 07/01/2023 to 07/31/2023 (Settled) |
|
Platts |
|
|
|
|
|
|
|
29,229 |
|
|
|
|
|
|
|
(3,106) |
|
|
| 08/01/2023 to 08/31/2023 (Settled) |
|
Platts |
|
|
|
|
|
|
|
23,336 |
|
|
|
|
|
|
|
(2,664) |
|
|
| 09/01/2023 to 09/31/2023 (*) |
|
Platts |
|
766,881 |
|
(786,693) |
|
(19,812) |
|
(21,554) |
|
|
|
|
|
|
|
(38) |
|
|
| 10/01/2023 to 10/31/2023 |
|
Platts |
|
1,552,437 |
|
(1,602,215) |
|
(49,778) |
|
|
|
|
|
(48,837) |
|
|
|
(941) |
|
|
| 11/01/2023 to 11/30/2023 |
|
Platts |
|
1,374,467 |
|
(1,393,509) |
|
(19,042) |
|
|
|
|
|
(18,691) |
|
|
|
(351) |
|
|
| 12/01/2023 to 12/31/2023 |
|
Platts |
|
1,151,485 |
|
(1,150,947) |
|
538 |
|
|
|
|
|
527 |
|
|
|
11 |
|
|
| 01/01/2024 to 01/31/2024 |
|
Platts |
|
170,872 |
|
(169,877) |
|
995 |
|
|
|
|
|
975 |
|
|
|
20 |
|
|
| |
|
|
|
5,016,142 |
|
(5,103,241) |
|
(87,099) |
|
(310,164) |
|
23,374 |
|
(66,026) |
|
- |
|
(12,136) |
|
(1,087) |
(*) The operation matured on September 30, 2023
and was settled in early October 2023.
The changes in the amounts related to cash flow
hedge accounting - Platts index recorded in shareholders' equity on September 30, 2023, are shown as follows:
| |
12/31/2022 |
|
Movement |
|
Realization |
|
09/30/2023 |
| Cash flow hedge accounting – “Platts” |
(341,269) |
|
(34,921) |
|
310,164 |
|
(66,026) |
| Income tax and social contribution on cash flow hedge accounting |
116,031 |
|
11,873 |
|
(105,456) |
|
22,448 |
| Fair Value of cash flow accounting - Platts, net |
(225,238) |
|
(23,048) |
|
204,708 |
|
(43,578) |
The cash flow hedge accounting - Platts index –
is fully effective since the derivative instruments were contracted.
To support the above-mentioned designations, the
Company prepared formal documentation indicating how the designation of cash flow hedge accounting - Platts index is aligned with CSN's
risk management objective and strategy, identifying the hedge instruments used, the hedge object, the nature of the risk to be protected
and demonstrating the expectation of high effectiveness of the relations designated. Iron ore derivative instruments (“Platts”
index) were designated in amounts equivalent to the portion of future sales, comparing the amounts designated with the amounts expected
and approved in the Management and Board budgets.
Sensitivity analysis for Platts price risks
We present below the sensitivity analysis for Platts
price risks. The Company considered scenarios 1 and 2 with 25% and 50% price devaluation using as a reference the probable price at the
maturity of each operation.
The effects on the result, considering probable
scenarios 1 and 2, are shown below:
| |
|
09/30/2023 |
| Maturity |
|
Probable scenario (*) R$ |
|
Scenario 1 R$ |
|
Scenario 2 R$ |
| 10/01/2023 to 10/31/2023 |
|
(24,388) |
|
(411,180) |
|
(797,972) |
| 11/01/2023 to 11/30/2023 |
|
9,554 |
|
(325,110) |
|
(659,775) |
| 12/01/2023 to 12/31/2023 |
|
26,267 |
|
(249,539) |
|
(525,344) |
| 01/01/2024 to 01/31/2024 |
|
5,587 |
|
(34,918) |
|
(75,423) |
| |
|
17,020 |
|
(1,020,747) |
|
(2,058,514) |
(*) The probable scenario was calculated considering the Platts quotation
on October 13,2023.
b) Cash flow hedge accounting
The Company and its subsidiary CSN Mineração
formally designates relations of hedge of cash flows to protect highly probable future flows exposed to the dollar related to sales made
in dollars.
Quarterly Financial Information – September 30, 2023 – Companhia Siderúrgica Nacional (CONVENIENCE TRANSLATION INTO ENGLISH FROM THE ORIGINAL PREVIOUSLY ISSUED IN PORTUGUESE) | |
With the objective of better reflecting the accounting
effects of the hedge exchange rate in the result, CSN and its subsidiary CSN Mineração designated part of their dollar liabilities
as an instrument of future hedge exports. As a result, the exchange rate variation resulting from the designated liabilities will be temporarily
recorded in shareholders’ equity and will be reflected in the income statement when said exports occur, thus allowing the recognition
of dollar fluctuations on liabilities and on exports to be recorded at the same time. It is noteworthy that the adoption of this hedge
accounting does not imply the contracting of any financial instrument.
The table below presents a summary of the relations
of hedge as of September 30, 2023:
| |
|
|
|
|
|
|
|
|
|
|
|
|
|
|
|
|
|
09/30/2023 |
| Designation Date |
|
Hedging Instrument |
|
Hedged item |
|
Type of hedged risk |
|
Hedged period |
|
Exchange rate on designation |
|
Designated amounts (US$’000) |
|
Amortizated part (USD'000) |
|
Effect on Result (*) (R$'000) |
|
Impact on Shareholders' equity (R$'000) |
| 4/2/2018 |
|
Bonds |
|
Part of the highly probable future monthly iron ore exports |
|
Foreign exchange - R$ vs. US$ spot rate |
|
July 2018 - February 2023 |
|
3.3104 |
|
1,170,045 |
|
(1,170,045) |
|
(281,258) |
|
|
| 07/31/2019 |
|
Bonds and Export prepayments in US$ to third parties |
|
Part of the highly probable future monthly iron ore exports |
|
Foreign exchange - R$ vs. US$ spot rate |
|
January 2020 - April 2026 |
|
3.7649 |
|
1,342,761 |
|
(871,761) |
|
(57,873) |
|
(585,311) |
| 1/10/2020 |
|
Bonds |
|
Part of the highly probable future monthly iron ore exports |
|
Foreign exchange - R$ vs. US$ spot rate |
|
March 2027 - January 2028 |
|
4.0745 |
|
1,416,000 |
|
(1,287,000) |
|
|
|
(1,334,970) |
| 01/28/2020 |
|
Bonds |
|
Part of the highly probable future monthly iron ore exports |
|
Foreign exchange - R$ vs. US$ spot rate |
|
March 2027 - January 2028 |
|
4.2064 |
|
1,000,000 |
|
|
|
|
|
(801,200) |
| 6/1/2022 |
|
Bonds and Export prepayments in US$ to third parties |
|
Part of the highly probable future monthly iron ore exports |
|
Foreign exchange - R$ vs. US$ spot rate |
|
June 2022 - April 2032 |
|
4.7289 |
|
1,145,300 |
|
(137,300) |
|
(24,475) |
|
(280,930) |
| 6/1/2022 |
|
Export prepayments in US$ to third parties |
|
Part of the highly probable future monthly iron ore exports |
|
Foreign exchange - R$ vs. US$ spot rate |
|
June 2022 - May 2033 |
|
4.7289 |
|
878,640 |
|
(91,450) |
|
(10,546) |
|
(219,390) |
| 12/1/2022 |
|
Advance on foreign exchange contract |
|
Part of the highly probable future monthly iron ore exports |
|
Foreign exchange - R$ vs. US$ spot rate |
|
December 2022 - November 2023 |
|
5.1643 |
|
60,000 |
|
|
|
|
|
9,402 |
| 12/1/2022 |
|
Advance on foreign exchange contract |
|
Part of the highly probable future monthly iron ore exports |
|
Foreign exchange - R$ vs. US$ spot rate |
|
December 2022 - December 2025 |
|
5.2565 |
|
100,000 |
|
|
|
|
|
24,890 |
| 12/1/2022 |
|
Advance on foreign exchange contract |
|
Part of the highly probable future monthly iron ore exports |
|
Foreign exchange - R$ vs. US$ spot rate |
|
December 2022 - January 2024 |
|
5.2660 |
|
50,000 |
|
|
|
|
|
12,920 |
| 12/1/2022 |
|
Advance on foreign exchange contract |
|
Part of the highly probable future monthly iron ore exports |
|
Foreign exchange - R$ vs. US$ spot rate |
|
December 2022 - November 2023 |
|
5.3270 |
|
20,000 |
|
|
|
|
|
6,388 |
| 12/1/2022 |
|
Bonds |
|
Part of the highly probable future monthly iron ore exports |
|
Foreign exchange - R$ vs. US$ spot rate |
|
December 2022 - June 2031 |
|
5.0360 |
|
490,000 |
|
(10,000) |
|
(1,373) |
|
13,632 |
| 12/1/2022 |
|
Export prepayments in US$ to third parties |
|
Part of the highly probable future monthly iron ore exports |
|
Foreign exchange - R$ vs. US$ spot rate |
|
December 2022 - June 2027 |
|
5.0360 |
|
70,000 |
|
|
|
|
|
1,988 |
| Total |
|
|
|
|
|
|
|
|
|
|
|
7,742,746 |
|
(3,567,556) |
|
(375,525) |
|
(3,152,581) |
(*) The realization of Hedge accounting cash flow
is recognized in Other operating income and expenses, note 25.
The net balance of amounts designated and already
amortized in dollars totals US$3.567.556.
In the hedging relationships described above, the
amounts of the debt instruments were fully designated for equivalent iron ore export portions.
As of September 30, 2023, the hedging relationships
established by the Company were effective according to the retrospective and prospective tests performed. Thus, no reversal for cash flow
hedge accounting ineffectiveness was recognized.
c) Net investment hedge in
foreign subsidiaries
The information related to the net investment hedge
did not change in relation to that disclosed in the Company's interim financial information as of December 31, 2022. The balance recorded
as of September 30, 2023 and December 31, 2022 is R$6,293.
d) Hedge accounting movements
The changes in the amounts related to cash flow
hedge accounting recorded in shareholders’ equity as of September 30, 2023 are shown as follows:
Quarterly Financial Information – September 30, 2023 – Companhia Siderúrgica Nacional (CONVENIENCE TRANSLATION INTO ENGLISH FROM THE ORIGINAL PREVIOUSLY ISSUED IN PORTUGUESE) | |
| |
|
|
|
|
|
|
Consolidated |
| |
12/31/2022 |
|
Movement |
|
Realization |
|
09/30/2023 |
| Cash flow hedge accounting |
(4,434,697) |
|
906,591 |
|
375,525 |
|
(3,152,581) |
| Income tax and social contribution on cash flow hedge accounting |
1,507,797 |
|
(308,241) |
|
(127,679) |
|
1,071,877 |
| Fair Value of cash flow accounting, net taxes |
(2,926,900) |
|
598,350 |
|
247,846 |
|
(2,080,704) |
| |
|
|
|
|
|
|
|
| |
|
|
|
|
|
|
Parent Company |
| |
12/31/2022 |
|
Movement |
|
Realization |
|
09/30/2023 |
| Cash flow hedge accounting |
(4,022,353) |
|
722,195 |
|
364,979 |
|
(2,935,179) |
| Income tax and social contribution on cash flow hedge accounting |
1,367,600 |
|
(245,546) |
|
(124,093) |
|
997,961 |
| Fair Value of cash flow accounting, net taxes |
(2,654,753) |
|
476,649 |
|
240,886 |
|
(1,937,218) |
The exposure to credit risks of financial institutions
considers the parameters established in the financial policy. The Company practices a detailed analysis of the financial situation of
its customers and suppliers, the determination of a credit limit and the permanent monitoring of its outstanding balance.
With regard to financial investments, the Company
only invests in institutions with low credit risk assessed by credit rating agencies. Since part of the funds is invested in repo operations
that are backed by Brazilian government bonds, there is also exposure to the credit risk of the country.
As for the exposure to credit risk in accounts
receivable and other receivables, the Company has a credit risk committee, in which each new customer is analyzed individually regarding
their financial condition, before granting the credit limit and payment terms, and periodically reviewed based on procedures and circumstances
of each business area.
It is the risk that the Company may not have sufficient
net funds to honor its financial commitments as a result of the mismatch of term or volume between expected receipts and payments.
Future receipt and payment premises are established
to manage cash liquidity in domestic and foreign currencies, which are monitored on a day-to-day basis by the Treasury Department. The
payment schedules for long-term installments of borrowings, financing and debentures are shown in note 12.
The following are the contractual maturities of
financial liabilities including interest.
| |
|
|
|
|
|
|
|
|
Consolidated |
| At September 30, 2023 |
Less than one year |
|
From one to two years |
|
From two to five years |
|
Over five years |
|
Total |
| Borrowings, financing and debentures (note 12) |
6,140,645 |
|
7,733,030 |
|
16,498,130 |
|
13,824,200 |
|
44,196,005 |
| Lease Liabilities (note 14) |
144,781 |
|
198,537 |
|
141,391 |
|
255,867 |
|
740,576 |
| Derivative financial instruments (note 13 a) |
130,520 |
|
50,520 |
|
|
|
|
|
181,040 |
| Trade payables (note 15) |
7,047,849 |
|
12,851 |
|
1,803 |
|
1,906 |
|
7,064,409 |
| Trade payables - Drawee Risk (note 16) |
2,993,574 |
|
|
|
|
|
|
|
2,993,574 |
| Dividends and interest on equity (note 16) |
4,939 |
|
|
|
|
|
|
|
4,939 |
| |
16,462,308 |
|
7,994,938 |
|
16,641,324 |
|
14,081,973 |
|
55,180,543 |
IV - Fair values of assets and liabilities in
relation to the book value
Financial assets and liabilities measured at fair
value through profit or loss are recorded in current and non-current assets and liabilities and gains and losses are recorded as financial
income and expenses, respectively.
The amounts are recorded in the interim financial
information at their book values, which are substantially similar to those that would be obtained if they were traded on the market. The
fair values of other long-term assets and liabilities do not differ significantly from their book values, except for the amounts below.
Quarterly Financial Information – September 30, 2023 – Companhia Siderúrgica Nacional (CONVENIENCE TRANSLATION INTO ENGLISH FROM THE ORIGINAL PREVIOUSLY ISSUED IN PORTUGUESE) | |
The estimated fair value for certain consolidated
long-term borrowings and financing was calculated at current market rates, considering the nature, term and risks similar to those of
the registered contracts, as follows:
| |
|
|
09/30/2023 |
|
|
|
12/31/2022 |
| |
Closing Balance |
|
Fair value |
|
Closing Balance |
|
Fair value |
| Fixed Rate Notes (*) |
15,030,441 |
|
12,825,475 |
|
15,656,088 |
|
13,782,836 |
(*) Source: Bloomberg
| 13.c) | Protection instruments: Derivatives |
· Derivative
financial instruments portfolio position
Swap exchange rate CDI x Dollar
The Company has derivative transactions to protect
its debt in NCE raised in September 2019 with maturity in October 2023 in the amount of US$67.000 (equivalent to R$278.000) at a cost
compatible with that usually practiced by the Company.
Swap exchange rate Real x Dollar
The subsidiary CSN Cimentos, after contracting
a borrowing in foreign currency of US$115,000, contracted derivative operations to protect its exposure to the dollar, maturing on June
10, 2027.
Swap exchange rate CDI x IPCA
The subsidiaries CSN Mineração and
CSN Cimentos issued debentures during 2021 and 2022, respectively, and entered derivative transactions to hedge their exposure to the
IPCA. CSN Mineração's contracts have maturities scheduled from 2031 to 2037, while CSN Cimentos' contracts mature in 2032.
Below is the position of the derivatives:
| |
|
|
|
|
|
|
|
|
|
|
|
|
|
|
|
Consolidated |
| |
|
|
|
|
|
|
|
|
|
|
|
|
|
09/30/2023 |
|
09/30/2022 |
| |
|
|
|
|
|
|
|
Appreciation (R$) |
|
Fair value (market) |
|
Impact on financial income (expenses) (note 26) |
| Instrument |
|
Maturity |
|
Functional Currency |
|
Notional amount |
|
Asset position |
|
Liability position |
|
Amounts receivable / (payable) |
|
| Exchange rate swap |
|
|
|
|
|
|
|
|
|
|
|
|
|
|
|
|
| |
|
|
|
|
|
|
|
|
|
|
|
|
|
|
|
|
| Exchange rate swap Dollar x Real |
|
Settled |
|
Dollar |
|
|
|
|
|
|
|
|
|
|
|
176,992 |
| Exchange rate swap CDI x Dollar |
|
10/02/2023 |
|
Dollar |
|
67,000 |
|
23,470 |
|
(66,891) |
|
(43,421) |
|
29,923 |
|
32,428 |
| Exchange rate swap Real x Dollar |
|
6/10/2027 |
|
Dollar |
|
115,000 |
|
606,920 |
|
(657,440) |
|
(50,520) |
|
(64,497) |
|
(21,535) |
| Total Swap |
|
|
|
|
|
182,000 |
|
630,390 |
|
(724,331) |
|
(93,941) |
|
(34,574) |
|
187,885 |
| |
|
|
|
|
|
|
|
|
|
|
|
|
|
|
|
|
| Interest rate swap |
|
|
|
|
|
|
|
|
|
|
|
|
|
|
|
|
| Interest rate (Debentures) CDI x IPCA |
|
07/15/2031 |
|
Real |
|
576,448 |
|
649,062 |
|
(627,849) |
|
21,213 |
|
22,771 |
|
(48,073) |
| Interest rate (Debentures) CDI x IPCA |
|
07/15/2032 |
|
Real |
|
745,000 |
|
855,235 |
|
(825,520) |
|
29,715 |
|
(1,823) |
|
(6,910) |
| Interest rate (Debentures) CDI x IPCA |
|
07/15/2036 |
|
Real |
|
423,552 |
|
474,781 |
|
(476,492) |
|
(1,711) |
|
40,779 |
|
(7,164) |
| Interest rate (Debentures) CDI x IPCA |
|
07/15/2037 |
|
Real |
|
655,382 |
|
716,306 |
|
(699,140) |
|
17,166 |
|
(44,937) |
|
(10,704) |
| Interest rate (Debentures) CDI x IPCA |
|
02/16/2032 |
|
Real |
|
600,000 |
|
692,872 |
|
(645,018) |
|
47,854 |
|
9,595 |
|
(3,348) |
| Interest rate (Debentures) CDI x IPCA |
|
2/12/2032 |
|
Real |
|
600,000 |
|
689,825 |
|
(640,595) |
|
49,230 |
|
11,719 |
|
(23,535) |
| Total interest rate (Debentures) CDI x IPCA |
|
|
|
|
|
3,600,382 |
|
4,078,081 |
|
(3,914,614) |
|
163,467 |
|
38,104 |
|
(99,734) |
| |
|
|
|
|
|
|
|
|
|
|
|
|
|
|
|
|
| |
|
|
|
|
|
|
|
4,708,471 |
|
(4,638,945) |
|
69,526 |
|
3,530 |
|
88,151 |
Quarterly Financial Information – September 30, 2023 – Companhia Siderúrgica Nacional (CONVENIENCE TRANSLATION INTO ENGLISH FROM THE ORIGINAL PREVIOUSLY ISSUED IN PORTUGUESE) | |
| · | Classification of derivatives in the balance sheet and income statement |
| |
|
|
|
|
|
|
|
09/30/2023 |
|
09/30/2022 |
| Instruments |
|
Liabilities |
|
Financial income (expenses), net (note 26) |
| |
Current |
|
Non-current |
|
Total |
|
| Exchange rate swap (NDF) Dollar x real (settled) |
|
|
|
|
|
|
|
|
|
176,992 |
| Exchange rate swap Real x Dollar |
|
|
|
(50,520) |
|
(50,520) |
|
(64,497) |
|
(21,535) |
| Exchange rate swap CDI x Dollar |
|
(43,421) |
|
|
|
(43,421) |
|
29,923 |
|
32,428 |
| Iron ore derivative |
|
(87,099) |
|
|
|
(87,099) |
|
(12,136) |
|
(1,087) |
| Interest rate swap CDI x IPCA |
|
|
|
163,467 |
|
163,467 |
|
38,104 |
|
(99,734) |
| |
|
(130,520) |
|
112,947 |
|
(17,573) |
|
(8,606) |
|
87,064 |
Derivative instruments Swap CDI x IPCA are fully
classified in the borrowings and financing group, since they are linked to debentures in order to protect exposure to the IPCA.
| 13.d) | Investments in securities measured at fair value through profit or
loss |
The Company has common shares (USIM3), preferred
shares (USIM5) of Siderúrgica de Minas Gerais S.A. (“Usiminas”) and shares of Panatlântica S.A. (PATI3), which
are designated as fair value through profit or loss.
Usiminas shares are classified as current assets
in financial investments and Panatlântica shares are classified as non-current assets under the investment line item. They are recorded
at fair value, based on the market price quote in B3.
In accordance with the Company’s policy,
the gains and losses arising from the variation in the share price are recorded directly in the income statement as financial result in
the case of financial investments, or as other operating income and expenses in the case of long-term investments.
| Class of shares |
|
09/30/2023 |
|
12/31/2022 |
|
09/30/2023 |
|
09/30/2022 |
| |
Quantity |
|
Equity interest (%) |
|
Share price |
|
Closing Balance |
|
Quantity |
|
Equity interest (%) |
|
Share price |
|
Closing Balance |
|
Profit or loss (notes 25 and 26) |
| USIM3 |
|
106,620,851 |
|
15.12% |
|
6.94 |
|
739,949 |
|
106,620,851 |
|
15.12% |
|
7.41 |
|
790,061 |
|
(50,112) |
|
(672,778) |
| USIM5 |
|
55,144,456 |
|
10.07% |
|
6.64 |
|
366,159 |
|
55,144,456 |
|
10.07% |
|
7.16 |
|
394,834 |
|
(28,675) |
|
(421,303) |
| |
|
|
|
|
|
|
|
1,106,108 |
|
|
|
|
|
|
|
1,184,895 |
|
(78,787) |
|
(1,094,081) |
| PATI3 |
|
2,705,726 |
|
11.31% |
|
25.15 |
|
68,049 |
|
2,705,726 |
|
11.31% |
|
35.00 |
|
94,700 |
|
(26,651) |
|
(27,977) |
| |
|
|
|
|
|
|
|
1,174,157 |
|
|
|
|
|
|
|
1,279,595 |
|
(105,438) |
|
(1,122,058) |
| · | Stock market price risks |
The Company is exposed to the risk of changes in
the stock price due to the investments measured at fair value through profit or loss that have their quotations based on the market price
on the B3.
Sensitivity analysis for stock price risks
We present below the sensitivity analysis for the
stock price risks. The Company considered scenarios 1 and 2 with 25% and 50% devaluation in the stock price using as reference the closing
price on September 30, 2023. The probable scenario considered a 5% devaluation in the stock price.
The effects on the result, considering probable
scenarios, 1 and 2 are demonstrated below:
| |
|
|
|
09/30/2023 |
| Class of shares |
|
Probable scenario |
|
Scenario 1 |
|
Scenario 2 |
| |
|
5% |
|
25% |
|
50% |
| USIM3 |
|
(36,997) |
|
(184,987) |
|
(369,974) |
| USIM5 |
|
(18,308) |
|
(91,540) |
|
(183,080) |
| PATI3 |
|
(3,402) |
|
(17,012) |
|
(34,025) |
Quarterly Financial Information – September 30, 2023 – Companhia Siderúrgica Nacional (CONVENIENCE TRANSLATION INTO ENGLISH FROM THE ORIGINAL PREVIOUSLY ISSUED IN PORTUGUESE) | |
The Company seeks to optimize its capital structure
in order to reduce its financial costs and maximize the return to its shareholders. The table below shows the evolution of the Company’s
consolidated capital structure, with financing by equity and third-party capital:
| Thousands of reais |
|
09/30/2023 |
|
12/31/2022 |
| Shareholder's equity (equity) |
|
20,100,845 |
|
21,816,044 |
| Borrowings and Financing (Third-party capital) |
|
43,574,221 |
|
40,918,742 |
| Gross Debit/Shareholder's equity |
|
2.17 |
|
1.88 |
14.
LEASE LIABILITIES
Lease liabilities are
shown below:
| |
|
|
Consolidated |
|
|
|
Parent Company |
| |
09/30/2023 |
|
12/31/2022 |
|
09/30/2023 |
|
12/31/2022 |
| Leases |
2,066,975 |
|
1,916,636 |
|
10,258 |
|
14,306 |
| Present value adjustment - Leases |
(1,326,399) |
|
(1,222,790) |
|
(491) |
|
(1,126) |
| |
740,576 |
|
693,846 |
|
9,767 |
|
13,180 |
| Classified: |
|
|
|
|
|
|
|
| Current |
144,781 |
|
177,010 |
|
8,902 |
|
8,451 |
| Non-current |
595,795 |
|
516,836 |
|
865 |
|
4,729 |
| |
740,576 |
|
693,846 |
|
9,767 |
|
13,180 |
The Company has lease
agreements for port terminals in Itaguaí, the Solid Bulk Terminal - TECAR, used for loading and unloading iron ores and others
and the Container Terminal - TECON, with remaining terms of 24 and 27 years, respectively, and lease agreement for railway operation using
the Northeast network with a remaining term of 7 years.
Additionally, the Company
has operating equipment lease agreements, used mainly in the mining and steel operations, and real estate, used as operating facilities
and administrative and sales offices, in several locations where the Company operates, with remaining terms of 1 to 12 years.
The present value of the
future obligations was measured using the implicit rate observed in the contracts and for the contracts that did not have a rate, the
Company applied the incremental borrowing rate - IBR, both in nominal terms.
The movement of lease
liabilities is shown in the table below:
| |
|
|
Consolidated |
|
|
|
Parent Company |
| |
09/30/2023 |
|
12/31/2022 |
|
09/30/2023 |
|
12/31/2022 |
| Opening balance |
693,846 |
|
611,551 |
|
13,180 |
|
17,941 |
| New leases |
186,494 |
|
29,633 |
|
|
|
2,808 |
| Present Value Adjustments - New leases |
(116,097) |
|
(3,300) |
|
|
|
(508) |
| Contract review |
80,481 |
|
99,419 |
|
3,990 |
|
201 |
| Write-off |
|
|
(781) |
|
|
|
|
| Payments |
(163,388) |
|
(155,995) |
|
(8,300) |
|
(8,836) |
| Interest appropriated |
58,740 |
|
69,510 |
|
897 |
|
1,574 |
| Acquisition of companies |
|
|
45,352 |
|
|
|
|
| Exchange variation |
500 |
|
(1,543) |
|
|
|
|
| Net balance |
740,576 |
|
693,846 |
|
9,767 |
|
13,180 |
The estimated future minimum
payments for the lease agreements include determinable variable payments, which are certain to occur, based on minimum performance and
contractually fixed rates.
As of September 30, 2023,
the expected minimum payments are the following:
Quarterly Financial Information – September 30, 2023 – Companhia Siderúrgica Nacional (CONVENIENCE TRANSLATION INTO ENGLISH FROM THE ORIGINAL PREVIOUSLY ISSUED IN PORTUGUESE) | |
| |
|
|
|
|
|
|
Consolidated |
| |
Less than one year |
|
Between one and five years |
|
Over five years |
|
Total |
| Leases |
155,968 |
|
475,348 |
|
1,435,659 |
|
2,066,975 |
| Present value adjustment - Leases |
(11,187) |
|
(135,420) |
|
(1,179,792) |
|
(1,326,399) |
| |
144,781 |
|
339,928 |
|
255,867 |
|
740,576 |
| · | Recoverable PIS / COFINS |
Lease liabilities were
measured at the amount of consideration with suppliers, that is, without considering the tax credits incurred after payment. The potential
right of PIS and COFINS embedded in the lease liability is shown below.
| |
|
|
Consolidated |
|
|
|
Parent Company |
| |
09/30/2023 |
|
12/31/2022 |
|
09/30/2023 |
|
12/31/2022 |
| Leases |
1,787,427 |
|
1,835,101 |
|
9,953 |
|
13,466 |
| Present value adjustment - Leases |
(1,212,464) |
|
(1,221,378) |
|
(476) |
|
(1,066) |
| Potencial PIS and COFINS credit |
165,337 |
|
169,747 |
|
921 |
|
1,246 |
| Present value adjustment – Potential PIS and COFINS credit |
(112,153) |
|
(112,977) |
|
(44) |
|
(99) |
| · | Lease payments not recognized as a liability: |
The Company chose not
to recognize lease liabilities in contracts with a term of less than 12 months and for low value assets. Payments made for these contracts
are recognized as expenses when incurred.
The Company has contracts
for the right to use ports (TECAR) and railways (FTL) which, even if they establish minimum performance, it is not possible to determine
its cash flow since these payments are fully variable and will only be known when they occur. In such cases, payments will be recognized
as expenses when incurred.
The expenses related to
payments not included in the measurement of the lease liability during the period are:
| |
|
|
|
|
|
|
|
Consolidated |
| |
Nine months ended |
|
|
Three months ended |
| |
09/30/2023 |
|
09/30/2022 |
|
|
09/30/2023 |
|
09/30/2022 |
| Contract less than 12 months |
3,431 |
|
905 |
|
|
736 |
|
66 |
| Lower Assets value |
11,795 |
|
2,548 |
|
|
3,671 |
|
644 |
| Variable lease payments |
302,302 |
|
259,739 |
|
|
102,466 |
|
81,037 |
| |
317,528 |
|
263,192 |
|
|
106,873 |
|
81,747 |
| |
|
|
|
|
|
|
|
Parent Company |
| |
Nine months ended |
|
|
Three months ended |
| |
09/30/2023 |
|
09/30/2022 |
|
|
09/30/2023 |
|
09/30/2022 |
| Lower Assets value |
6,146 |
|
927 |
|
|
1,993 |
|
416 |
| Variable lease payments |
- |
|
955 |
|
|
- |
|
147 |
| |
6,146 |
|
1,882 |
|
|
1,993 |
|
563 |
| |
|
|
Consolidated |
|
|
|
Parent Company |
| |
09/30/2023 |
|
12/31/2022 |
|
09/30/2023 |
|
12/31/2022 |
| Trade payables |
7,147,708 |
|
6,723,077 |
|
4,049,548 |
|
3,750,724 |
| (-) Adjustment present value |
(83,299) |
|
(79,893) |
|
(56,442) |
|
(51,579) |
| |
7,064,409 |
|
6,643,184 |
|
3,993,106 |
|
3,699,145 |
| |
|
|
|
|
|
|
|
| |
|
|
|
|
|
|
|
| Classified: |
|
|
|
|
|
|
|
| Current |
7,047,849 |
|
6,596,915 |
|
3,985,582 |
|
3,684,793 |
| Non-current |
16,560 |
|
46,269 |
|
7,524 |
|
14,352 |
| |
7,064,409 |
|
6,643,184 |
|
3,993,106 |
|
3,699,145 |
Quarterly Financial Information – September 30, 2023 – Companhia Siderúrgica Nacional (CONVENIENCE TRANSLATION INTO ENGLISH FROM THE ORIGINAL PREVIOUSLY ISSUED IN PORTUGUESE) | |
The other payables classified in current and non-current
liabilities are comprised as follows:
| |
|
|
|
|
|
|
Consolidated |
|
|
|
|
|
|
|
Parent Company |
| |
Current |
Non-current |
|
Current |
Non-current |
| |
09/30/2023 |
|
12/31/2022 |
|
09/30/2023 |
|
12/31/2022 |
|
09/30/2023 |
|
12/31/2022 |
|
09/30/2023 |
|
12/31/2022 |
| Payables to related parties (note 20 a) |
31,478 |
|
109,087 |
|
36,784 |
|
53,356 |
|
377,845 |
|
406,583 |
|
2,803 |
|
41,694 |
| Derivative financial instruments (note 13 a) |
130,520 |
|
416,935 |
|
50,520 |
|
69,472 |
|
43,421 |
|
|
|
|
|
58,005 |
| Dividends and interest on capital |
4,939 |
|
611,307 |
|
|
|
|
|
4,642 |
|
598,267 |
|
|
|
|
| Advances from customers (1) |
1,918,683 |
|
1,120,072 |
|
5,525,704 |
|
943,919 |
|
298,421 |
|
83,300 |
|
783,181 |
|
|
| Taxes in installments |
145,454 |
|
280,721 |
|
173,256 |
|
184,106 |
|
15,855 |
|
9,173 |
|
56,649 |
|
|
| Profit sharing - employees |
225,873 |
|
266,705 |
|
|
|
|
|
111,713 |
|
136,909 |
|
|
|
|
| Taxes payable |
|
|
|
|
30,620 |
|
10,925 |
|
|
|
|
|
9,251 |
|
8,962 |
| Provision for consumption and services |
253,844 |
|
241,965 |
|
|
|
|
|
121,449 |
|
110,910 |
|
|
|
|
| Third party materials in our possession |
214,891 |
|
303,858 |
|
|
|
|
|
198,213 |
|
286,805 |
|
|
|
|
| Trade payables - Drawee Risk and forfaiting (2) |
2,993,574 |
|
5,709,069 |
|
|
|
|
|
2,691,691 |
|
5,318,425 |
|
|
|
|
| Trade payables (note 15) |
|
|
|
|
16,560 |
|
46,269 |
|
|
|
|
|
7,524 |
|
14,352 |
| Lease Liabilities (note 14) |
144,781 |
|
177,010 |
|
595,795 |
|
516,836 |
|
8,902 |
|
8,451 |
|
865 |
|
4,729 |
| Other payables |
98,988 |
|
81,922 |
|
373,196 |
|
391,535 |
|
23,435 |
|
2,358 |
|
57,839 |
|
21,248 |
| |
6,163,025 |
|
9,318,651 |
|
6,802,435 |
|
2,216,418 |
|
3,895,587 |
|
6,961,181 |
|
918,112 |
|
148,990 |
(1) Advances from Customers: On December
31, 2022 the subsidiaries CSN Mineração and CSN Cimentos entered into advance contracts for the sale of electricity with
national operators in the sector to be executed up to 8 years. Additionally, the subsidiary CSN Mineração S.A. received
in advance the total amount of US$500.000 (R$2,599,300) referring to supply contracts of approximately 13 million tons of iron ore signed
with a major international player, to be executed within 4 years, with supply expected to begin in 2024. On June 30, 2023, the subsidiary
CSN Mineração entered into an amendment to the advance contract, signed on January 16, 2023, in the amount of US$300,000
for additional supply of 6.3 million tons of iron ore. From this amendment, the Company received on June 30, 2023 the amount of US$205,000
(R$987,936), the remaining balance of US$95,000 will be received until July 31, 2023.
(2) The Company classifies drawee risk and forfaiting
transactions with suppliers under other liabilities. These transactions are negotiated with financial institutions by which suppliers
to anticipate receivables arising from sales of goods and, consequently, lengthen the payment terms of the Company's own obligations.
The actual anticipation of receivables depends on the acceptance by its suppliers, since their participation is not compulsory. The Company
is not reimbursed and/or benefited by the financial institution for discounts for payment executed before the due date agreed with the
supplier, there is no alteration in the degree of subordination of the title in the case of judicial execution and no alteration in the
existing commercial conditions between the Company and its suppliers.
| 17. | INCOME TAX AND SOCIAL CONTRIBUTION |
| 17.a) | Income tax and social contribution recognized in profit or loss: |
The income tax and social contribution recognized
in net income for the period are as follows:
| |
|
|
|
|
|
|
Consolidated |
| |
Nine months ended |
|
Three months ended |
| |
09/30/2023 |
|
09/30/2022 |
|
09/30/2023 |
|
09/30/2022 |
| Income tax and social contribution income (expense) |
|
|
|
|
|
|
| Current |
(828,108) |
|
(1,563,960) |
|
(569,846) |
|
(293,759) |
| Deferred |
609,660 |
|
(584,923) |
|
236,597 |
|
(277,035) |
| |
(218,448) |
|
(2,148,883) |
|
(333,249) |
|
(570,794) |
| |
|
|
|
|
|
|
|
| |
|
|
|
|
|
|
|
| |
|
|
|
|
|
|
Parent Company |
| |
Nine months ended |
|
Three months ended |
| |
09/30/2023 |
|
09/30/2022 |
|
09/30/2023 |
|
09/30/2022 |
| Income tax and social contribution income (expense) |
|
|
|
|
|
|
| Current |
179,100 |
|
(195,974) |
|
(2,346) |
|
41,423 |
| Deferred |
675,341 |
|
(512,722) |
|
267,752 |
|
(207,637) |
| |
854,441 |
|
(708,696) |
|
265,406 |
|
(166,214) |
The reconciliation of income tax and social contribution
expenses and income of the consolidated and parent company and the product of the current tax rate on income before income tax and social
contribution are shown below:
Quarterly Financial Information – September 30, 2023 – Companhia Siderúrgica Nacional (CONVENIENCE TRANSLATION INTO ENGLISH FROM THE ORIGINAL PREVIOUSLY ISSUED IN PORTUGUESE) | |
| |
|
|
|
|
|
|
Consolidated |
| |
Nine months ended |
|
Three months ended |
| |
09/30/2023 |
|
09/30/2022 |
|
09/30/2023 |
|
09/30/2022 |
| Income before income tax and social contribution |
(230,008) |
|
4,119,789 |
|
424,043 |
|
808,426 |
| Tax rate |
34% |
|
34% |
|
34% |
|
34% |
| Income tax and social contribution at combined statutory rate |
78,203 |
|
(1,400,728) |
|
(144,175) |
|
(274,865) |
| Adjustment to reflect the effective rate: |
|
|
|
|
|
|
|
| Equity in results of affiliated companies |
127,467 |
|
71,375 |
|
48,612 |
|
36,225 |
| Difference Tax Rate in companies abroad |
(184,189) |
|
(146,918) |
|
(166,066) |
|
(153,729) |
| Tax loss carryforwards without recognizing deferred taxes |
- |
|
(18,631) |
|
- |
|
(4,677) |
| Indebtdness limit |
- |
|
(6,382) |
|
- |
|
(2,058) |
| Unrecorded deferred taxes on temporary differences |
- |
|
(13,658) |
|
- |
|
(14,116) |
| Income taxes and social contribution on foreign profit |
121,271 |
|
11,803 |
|
121,271 |
|
11,803 |
| Tax incentives |
27,463 |
|
30,411 |
|
21,048 |
|
9,679 |
| Interest on equity |
19,235 |
|
|
|
- |
|
|
| Recognition/(reversal) of tax credits |
(344,710) |
|
(696,590) |
|
(203,226) |
|
(179,915) |
| Other permanent deductions (additions) |
(63,188) |
|
20,435 |
|
(10,713) |
|
859 |
| Income tax and social contribution in net income for the period |
(218,448) |
|
(2,148,883) |
|
(333,249) |
|
(570,794) |
| Effective tax rate |
-95% |
|
52% |
|
79% |
|
71% |
| |
|
|
|
|
|
|
|
| |
|
|
|
|
|
|
Parent Company |
| |
Nine months ended |
|
Three months ended |
| |
09/30/2023 |
|
09/30/2022 |
|
09/30/2023 |
|
09/30/2022 |
| Income before income tax and social contribution |
(1,751,714) |
|
2,245,815 |
|
(419,886) |
|
299,605 |
| Tax rate |
34% |
|
34% |
|
34% |
|
34% |
| Income tax and social contribution at combined statutory rate |
595,583 |
|
(763,577) |
|
142,761 |
|
(101,866) |
| Adjustment to reflect the effective rate: |
|
|
|
|
|
|
|
| Equity in results of affiliated companies |
478,151 |
|
719,815 |
|
145,581 |
|
100,741 |
| Indebtdness limit |
|
|
(6,382) |
|
|
|
(2,058) |
| Income taxes and social contribution on foreign profit |
90,687 |
|
11,803 |
|
90,687 |
|
11,803 |
| Interest on equity |
(75,772) |
|
|
|
|
|
|
| Tax incentives |
|
|
4,702 |
|
|
|
(1,327) |
| Recognition/(reversal) of tax credits |
(190,456) |
|
(696,590) |
|
(30,599) |
|
(179,915) |
| Other permanent deductions (additions) |
(43,752) |
|
21,533 |
|
(83,024) |
|
6,408 |
| Income tax and social contribution in net income for the period |
854,441 |
|
(708,696) |
|
265,406 |
|
(166,214) |
| Effective tax rate |
49% |
|
32% |
|
63% |
|
55% |
| 17.b) | Deferred income tax and social contribution: |
Deferred income tax and social contribution balances
are as follows:
| |
|
|
|
Consolidated |
|
|
|
Parent Company |
| |
|
09/30/2023 |
|
12/31/2022 |
|
09/30/2023 |
|
12/31/2022 |
| Deferred |
|
|
|
|
|
|
|
|
| Income tax losses |
|
4,045,386 |
|
2,679,028 |
|
2,092,535 |
|
1,279,792 |
| Social contribution tax losses |
|
1,386,685 |
|
894,183 |
|
775,608 |
|
482,104 |
| Temporary differences |
|
(458,916) |
|
1,305,557 |
|
693,824 |
|
1,494,816 |
| Tax, social security, labor, civil and environmental provisions |
|
534,687 |
|
584,834 |
|
182,390 |
|
205,440 |
| Estimated losses on assets |
|
192,004 |
|
369,826 |
|
138,447 |
|
143,926 |
| Gains/(Losses) on financial assets |
|
491,592 |
|
468,813 |
|
498,327 |
|
442,333 |
| Actuarial Liabilities (Pension and Health Plan) |
|
191,142 |
|
226,875 |
|
182,679 |
|
222,745 |
| Provision for consumption and services |
|
209,671 |
|
205,880 |
|
197,555 |
|
172,566 |
| Cash Flow Hedge Accounting and Unrealized Exchange Variations |
|
477,022 |
|
1,459,012 |
|
402,323 |
|
1,206,064 |
| (Gain) on loss of control of Transnordestina |
|
(224,096) |
|
(224,096) |
|
(224,096) |
|
(224,096) |
| Fair Value SWT/CBL Acquisition |
|
(149,489) |
|
(149,489) |
|
|
|
|
| Business combination |
|
(1,401,675) |
|
(1,632,370) |
|
(721,992) |
|
(721,992) |
| Others |
|
(779,774) |
|
(3,728) |
|
38,191 |
|
47,830 |
| Total |
|
4,973,155 |
|
4,878,768 |
|
3,561,967 |
|
3,256,712 |
| |
|
|
|
|
|
|
|
|
| Total Deferred Assets |
|
6,360,579 |
|
5,095,718 |
|
4,515,912 |
|
4,219,717 |
| Total Deferred Liabilities |
|
(1,387,424) |
|
(216,950) |
|
(953,945) |
|
(963,005) |
| Total Deferred |
|
4,973,155 |
|
4,878,768 |
|
3,561,967 |
|
3,256,712 |
Quarterly Financial Information – September 30, 2023 – Companhia Siderúrgica Nacional (CONVENIENCE TRANSLATION INTO ENGLISH FROM THE ORIGINAL PREVIOUSLY ISSUED IN PORTUGUESE) | |
The
Company has in its corporate structure subsidiaries abroad, whose income is taxed by the income tax in the respective countries where
they were constituted at rates lower than those in force in Brazil. In the period between 2019 and 2023, these subsidiaries generated
income in the amount of R$156,367. If the Brazilian tax authorities understand that this income is subject to additional taxation in Brazil
for income tax and social contribution, these, if due, would reach approximately R$53,165. The Company, based on the position of its legal
advisors, assessed only the likelihood of loss as possible in the event of possible tax questioning and, therefore, no provision was recognized
in the interim financial information.
In addition, management evaluated the precepts
of IFRIC 23 - “Uncertainty Over Income Tax Treatments” and recognized in 2021 the credit for the unconstitutionality of the
levy of the IRPJ and CSLL on the amounts of default interest referring to the SELIC rate received due to the repetition of tax undue payment.
| 17.c) | Changes in deferred income tax and social contribution |
The changes in deferred taxes is shown below:
| |
|
|
|
|
| |
|
Consolidated |
|
Parent Company |
| Balance at January 1, 2022 |
|
4,569,011 |
|
4,843,653 |
| Recognized in the result |
|
(420,773) |
|
(988,588) |
| Recognized in other comprehensive income |
|
(322,876) |
|
(598,353) |
| Acquisition of companies |
|
1,053,406 |
|
|
| Balance at December 31, 2022 |
|
4,878,768 |
|
3,256,712 |
| Recognized in the result |
|
609,660 |
|
675,341 |
| Recognized in other comprehensive income |
|
(521,640) |
|
(369,642) |
| Use of tax credit in installment program |
|
(451) |
|
(444) |
| Reverse incorporation |
|
6,818 |
|
|
| Balance at September 30, 2023 |
|
4,973,155 |
|
3,561,967 |
| 17.d) | Income tax and social contribution recognized in equity: |
The income tax and social contribution recognized
directly in equity are shown below:
| |
|
|
Consolidated |
|
|
|
Parent Company |
| |
09/30/2023 |
|
12/31/2022 |
|
09/30/2023 |
|
12/31/2022 |
| Income tax and social contribution |
|
|
|
|
|
|
|
| Actuarial gains on defined benefit pension plan |
104,455 |
|
100,139 |
|
99,288 |
|
99,288 |
| Exchange differences on translating foreign operations |
(325,350) |
|
(325,350) |
|
(325,350) |
|
(325,350) |
| Cash flow hedge accounting |
954,186 |
|
1,571,953 |
|
997,961 |
|
1,367,601 |
| |
733,291 |
|
1,346,742 |
|
771,899 |
|
1,141,539 |
| 18. | PROVISIONS FOR TAX, SOCIAL SECURITY, LABOR, CIVIL AND ENVIRONMENTAL RISKS
AND JUDICIAL DEPOSITS |
Claims of different nature are being challenged
at the appropriate courts. Details of the accrued amounts and related judicial deposits are as follows:
Quarterly Financial Information – September 30, 2023 – Companhia Siderúrgica Nacional (CONVENIENCE TRANSLATION INTO ENGLISH FROM THE ORIGINAL PREVIOUSLY ISSUED IN PORTUGUESE) | |
| |
|
|
|
|
|
|
|
Consolidated |
|
|
|
|
|
|
|
Parent Company |
| |
|
Accrued liabilities |
|
Judicial deposits |
|
Accrued liabilities |
|
Judicial deposits |
| |
|
09/30/2023 |
|
12/31/2022 |
|
09/30/2023 |
|
12/31/2022 |
|
09/30/2023 |
|
12/31/2022 |
|
09/30/2023 |
|
12/31/2022 |
| Tax |
|
149,512 |
|
219,196 |
|
152,585 |
|
184,687 |
|
16,939 |
|
96,865 |
|
57,088 |
|
57,316 |
| Social security |
|
1,595 |
|
1,567 |
|
4 |
|
|
|
1,595 |
|
1,549 |
|
|
|
|
| Labor |
|
368,177 |
|
375,416 |
|
303,494 |
|
297,507 |
|
159,536 |
|
177,902 |
|
138,421 |
|
160,983 |
| Civil |
|
779,387 |
|
851,305 |
|
26,503 |
|
25,502 |
|
151,667 |
|
130,250 |
|
14,134 |
|
12,174 |
| Environmental |
|
42,832 |
|
37,341 |
|
3,212 |
|
2,859 |
|
12,087 |
|
15,250 |
|
1,153 |
|
1,154 |
| Deposit of a guarantee |
|
|
|
|
|
21,019 |
|
23,109 |
|
|
|
|
|
|
|
|
| |
|
1,341,503 |
|
1,484,825 |
|
506,817 |
|
533,664 |
|
341,824 |
|
421,816 |
|
210,796 |
|
231,627 |
| |
|
|
|
|
|
|
|
|
|
|
|
|
|
|
|
|
| Classified: |
|
|
|
|
|
|
|
|
|
|
|
|
|
|
|
|
| Current |
|
38,926 |
|
73,089 |
|
|
|
|
|
22,218 |
|
31,371 |
|
|
|
|
| Non-current |
|
1,302,577 |
|
1,411,736 |
|
506,817 |
|
533,664 |
|
319,606 |
|
390,445 |
|
210,796 |
|
231,627 |
| |
|
1,341,503 |
|
1,484,825 |
|
506,817 |
|
533,664 |
|
341,824 |
|
421,816 |
|
210,796 |
|
231,627 |
The changes in tax, social security, labor, civil
and environmental provisions in the year ended September 30, 2023 can be summarized as follows:
| |
|
|
|
|
|
|
|
|
|
Consolidated |
| |
|
|
|
|
|
|
|
|
|
Current + Non-current |
| Nature |
|
12/31/2022 |
|
Additions |
|
Accrued charges |
|
Net utilization of reversal |
|
09/30/2023 |
| Tax |
|
219,196 |
|
2,327 |
|
12,511 |
|
(84,522) |
|
149,512 |
| Social security |
|
1,567 |
|
|
|
68 |
|
(40) |
|
1,595 |
| Labor |
|
375,416 |
|
32,064 |
|
39,061 |
|
(78,364) |
|
368,177 |
| Civil |
|
851,305 |
|
20,834 |
|
51,851 |
|
(144,603) |
|
779,387 |
| Environmental |
|
37,341 |
|
2,993 |
|
5,970 |
|
(3,472) |
|
42,832 |
| |
|
1,484,825 |
|
58,218 |
|
109,461 |
|
(311,001) |
|
1,341,503 |
| |
|
|
|
|
|
|
|
|
|
Parent Company |
| |
|
|
|
|
|
|
|
|
|
Current + Non-current |
| Nature |
|
12/31/2022 |
|
Additions |
|
Accrued charges |
|
Net utilization of reversal |
|
09/30/2023 |
| Tax |
|
96,865 |
|
928 |
|
2,896 |
|
(83,750) |
|
16,939 |
| Social security |
|
1,549 |
|
|
|
68 |
|
(22) |
|
1,595 |
| Labor |
|
177,902 |
|
11,263 |
|
16,200 |
|
(45,829) |
|
159,536 |
| Civil |
|
130,250 |
|
724 |
|
25,301 |
|
(4,608) |
|
151,667 |
| Environmental |
|
15,250 |
|
83 |
|
113 |
|
(3,359) |
|
12,087 |
| |
|
421,816 |
|
12,998 |
|
44,578 |
|
(137,568) |
|
341,824 |
The provision for tax, social security, labor,
civil and environmental risks was estimated by Management and is mainly based on the legal advisors’ assessment. Only lawsuits for
which the risk is classified as probable loss are provisioned. Additionally, tax liabilities from actions initiated by the Company is
included in this provision and is subject to SELIC (Central Bank’s policy rate).
| § | Possible administrative and judicial proceedings |
The Company does not make provisions for lawsuits,
which Management’s expectations, based on the opinion of legal counsel, is a possible loss. The following table shows a summary
of the balance of the main matters classified as possible risk compared to the balance as of September 30, 2023 and December 31, 2022.
Quarterly Financial Information – September 30, 2023 – Companhia Siderúrgica Nacional (CONVENIENCE TRANSLATION INTO ENGLISH FROM THE ORIGINAL PREVIOUSLY ISSUED IN PORTUGUESE) | |
| |
|
|
|
Consolidated |
| |
|
09/30/2023 |
|
12/31/2022 |
| Notice of Violation and Imposition of Fine (AIIM) / Tax Foreclosure - RFB - IRPJ/CSLL - Capital Gain for alleged sale of equity interest in subsidiary NAMISA |
|
15,311,254 |
|
14,174,838 |
| |
|
|
|
|
| Notice of Violation and Imposition of Fine (AIIM) / Tax Foreclosure - RFB - IRPJ/CSLL - Disallowance of goodwill deductions generated in the reverse incorporation of Big Jump by Namisa |
|
5,334,695 |
|
4,920,177 |
| |
|
|
|
|
| Notice of Violation and Imposition of Fine (AIIM) / Tax Enforcement - RFB - IRPJ/CSLL - Disallowance of prepayment interest arising from iron ore supply and port services contracts |
|
2,628,747 |
|
2,388,423 |
| |
|
|
|
|
| Infraction and Fine Imposition Notices (AIIM) / Writ of Mandamus - RFB - IRPJ/CSLL - Profits earned abroad in 2008, 2010, 2011, 2012, 2014, 2015, 2016 and 2017 |
|
4,377,939 |
|
4,104,626 |
| |
|
|
|
|
| Unapproved compensation - RFB - IRPJ/CSLL, PIS/COFINS and IPI |
|
2,254,133 |
|
2,138,608 |
| |
|
|
|
|
| ICMS - SEFAZ/RJ - Assessment Notice - questions about sales for incentive area |
|
1,365,927 |
|
1,255,251 |
| |
|
|
|
|
| Notice of Violation and Imposition of Fine (AIIM) - RFB - Disallowance of PIS/COFINS Credits for inputs and freight |
|
1,357,989 |
|
1,238,018 |
| |
|
|
|
|
| CFEM – difference of understanding between CSN and ANM on the calculation basis |
|
1,248,299 |
|
1,143,275 |
| |
|
|
|
|
| Notice of Infraction and Imposition of Fine (AIIM) - RFB - Collection IRRF - Business Combinations CMIN 2015 |
|
1,081,763 |
|
986,196 |
| |
|
|
|
|
| ICMS - SEFAZ/RJ - Electricity Credits |
|
1,042,238 |
|
950,469 |
| |
|
|
|
|
| Notice of Violation and Imposition of Fine (AIIM) - IRPJ/CSLL - Disallowance of deductions of goodwill generated in the acquisition of Cimentos Mauá |
|
790,649 |
|
715,152 |
| |
|
|
|
|
| ICMS - SEFAZ/RJ - Disallowance of the ICMS credits - Transfer of iron ore |
|
718,090 |
|
666,816 |
| |
|
|
|
|
| ICMS - SEFAZ/RJ - Disallowance of credits on purchases of intermediate products |
|
433,788 |
|
623,748 |
| |
|
|
|
|
| Disallowance of tax loss and negative calculation base resulting from adjustments in SAPLI - RFB |
|
725,077 |
|
663,594 |
| |
|
|
|
|
| Infraction and Fine Imposition Notices (AIIM) - RFB - IRPJ/CSLL - Transfer Pricing |
|
355,531 |
|
|
| |
|
|
|
|
| ICMS - SEFAZ/RJ - Transfer of imported raw material for a value lower than the TECAR import document |
|
387,055 |
|
357,006 |
| |
|
|
|
|
| Notice of Violation and Imposition of Fine (AIIM) / Annulment Action - RFB - IRRF - Capital gain of CFM company sellers located abroad |
|
311,722 |
|
289,406 |
| |
|
|
|
|
| Other tax lawsuits (federal, state, and municipal) |
|
5,986,631 |
|
5,579,232 |
| |
|
|
|
|
| Social security lawsuits |
|
257,498 |
|
187,338 |
| |
|
|
|
|
| Action to discuss the balance of the construction contract – Tebas |
|
593,716 |
|
560,638 |
| |
|
|
|
|
| Action related to power supply payment’s charge - Light |
|
432,416 |
|
386,834 |
| |
|
|
|
|
| Action that discusses Negotiation of energy sales - COPEN - CEEE-G |
|
194,475 |
|
193,469 |
| |
|
|
|
|
| Collection of defaulted amounts of contracts for the execution of the Presidente Médici Thermoelectric Power Plant - SACE - CEEE-G |
|
197,237 |
|
192,212 |
| |
|
|
|
|
| Enforcement action applied by Brazilian antitrust authorities (CADE) |
|
119,468 |
|
109,206 |
| |
|
|
|
|
| Other civil lawsuits |
|
1,377,128 |
|
1,168,591 |
| |
|
|
|
|
| Labor and social security lawsuits |
|
2,039,759 |
|
1,726,517 |
| |
|
|
|
|
| Tax foreclosures – Fine – Volta Redonda IV |
|
135,720 |
|
122,639 |
| |
|
|
|
|
| ACP landfill Márcia |
|
306,389 |
|
306,389 |
| |
|
|
|
|
| Other environmental lawsuits |
|
627,364 |
|
539,410 |
| |
|
|
|
|
| |
|
51,992,697 |
|
47,688,078 |
In the first quarter of 2021, the Company was notified
of an arbitration proceeding based on an alleged unfulfillment of iron ore supply contracts. The counterparty asks for approximately US$1
billion, and the Company has no knowledge of the basis for the estimates of the amount asked. Finally, the Company informs that has responded
the arbitration requirements in conjunction with its legal counselors and is currently at the initial stage of its defense. The Company
expects the arbitration will be concluded in 2 years. The relevance of the arbitration
to the Company is related to the amount attributed to the cause and its eventual financial impact. The discussion involves arbitration
disputes initiated by both parties.
Quarterly Financial Information – September 30, 2023 – Companhia Siderúrgica Nacional (CONVENIENCE TRANSLATION INTO ENGLISH FROM THE ORIGINAL PREVIOUSLY ISSUED IN PORTUGUESE) | |
The Company has been offering judicial guarantees
(Guarantee Insurance/Letter of Guarantee) in the total amount updated to September 30, 2023, of R$8.462.939 (December 31, 2022, R$4,939,419),
as determined by the procedural legislation in force.
The assessments made by legal advisors define these
administrative and judicial proceedings as a possible risk of loss and, consequently, no loss provisions have been recognized in accordance
with Management's judgment and with the accounting practices adopted in Brazil.
| 19. | PROVISION FOR ENVIRONMENTAL LIABILITIES AND ASSET RETIREMENT OBLIGATIONS |
The balance of provisions for environmental liabilities
and asset retirement obligation is as follows:
| |
|
|
Consolidated |
|
|
|
Parent Company |
| |
09/30/2023 |
|
12/31/2022 |
|
09/30/2023 |
|
12/31/2022 |
| Environmental liabilities |
186,744 |
|
172,574 |
|
170,369 |
|
158,213 |
| Asset retirement obligations |
822,603 |
|
765,083 |
|
|
|
|
| |
1,009,347 |
|
937,657 |
|
170,369 |
|
158,213 |
| 20. | RELATED-PARTY BALANCES AND TRANSACTIONS |
| 20.a) | Transactions with subsidiaries, jointly controlled entities, associates, exclusive funds and other
related parties |
| |
|
|
|
|
|
|
|
|
|
|
|
|
|
|
|
|
| |
|
Consolidated |
| |
|
09/30/2023 |
|
12/31/2022 |
| |
|
Subsidiaries and associates |
|
Joint-ventures and Joint Operation |
|
Other related parties |
|
Total |
|
Subsidiaries and associates |
|
Joint-ventures and Joint Operation |
|
Other related parties |
|
Total |
| Assets |
|
|
|
|
|
|
|
|
|
|
|
|
|
|
|
|
| Current Assets |
|
|
|
|
|
|
|
|
|
|
|
|
|
|
|
|
| Investments |
(1) |
|
|
|
|
1,179,172 |
|
1,179,172 |
|
|
|
|
|
1,768,915 |
|
1,768,915 |
| Trade receivables (note 5) |
(2) |
42,845 |
|
4,636 |
|
48,589 |
|
96,070 |
|
48,236 |
|
1,182 |
|
59,716 |
|
109,134 |
| Dividends (note 8) |
(3) |
|
|
77,377 |
|
|
|
77,377 |
|
|
|
77,377 |
|
|
|
77,377 |
| Loans (note 8) |
(4) |
|
|
5,335 |
|
|
|
5,335 |
|
|
|
5,383 |
|
|
|
5,383 |
| Other receivables (note 8) |
|
|
|
2 |
|
1,828 |
|
1,830 |
|
30 |
|
|
|
1,828 |
|
1,858 |
| |
|
42,845 |
|
87,350 |
|
1,229,589 |
|
1,359,784 |
|
48,266 |
|
83,942 |
|
1,830,459 |
|
1,962,667 |
| Non-current Assets |
|
|
|
|
|
|
|
|
|
|
|
|
|
|
|
|
| Investments |
(1) |
|
|
|
|
115,175 |
|
115,175 |
|
|
|
|
|
140,510 |
|
140,510 |
| Loans (note 8) |
(4) |
3,718 |
|
1,614,195 |
|
|
|
1,617,913 |
|
3,678 |
|
1,381,095 |
|
|
|
1,384,773 |
| Actuarial asset (note 8) |
|
|
|
|
|
35,477 |
|
35,477 |
|
|
|
|
|
35,477 |
|
35,477 |
| Other receivables (note 8) |
(5) |
|
|
1,705,332 |
|
|
|
1,705,332 |
|
|
|
1,484,759 |
|
|
|
1,484,759 |
| |
|
3,718 |
|
3,319,527 |
|
150,652 |
|
3,473,897 |
|
3,678 |
|
2,865,854 |
|
175,987 |
|
3,045,519 |
| |
|
46,563 |
|
3,406,877 |
|
1,380,241 |
|
4,833,681 |
|
51,944 |
|
2,949,796 |
|
2,006,446 |
|
5,008,186 |
| |
|
|
|
|
|
|
|
|
|
|
|
|
|
|
|
|
| Liabilities |
|
|
|
|
|
|
|
|
|
|
|
|
|
|
|
|
| Current Liabilities |
|
|
|
|
|
|
|
|
|
|
|
|
|
|
|
|
| Trade payables |
|
299 |
|
64,790 |
|
25,042 |
|
90,131 |
|
|
|
93,115 |
|
37,448 |
|
130,563 |
| Accounts payable |
|
|
|
21,456 |
|
|
|
21,456 |
|
|
|
23,555 |
|
24,134 |
|
47,689 |
| Provision for consumption |
|
|
|
10,022 |
|
|
|
10,022 |
|
|
|
61,398 |
|
|
|
61,398 |
| |
|
299 |
|
96,268 |
|
25,042 |
|
121,609 |
|
|
|
178,068 |
|
61,582 |
|
239,650 |
| Non-current Liabilities |
|
|
|
|
|
|
|
|
|
|
|
|
|
|
|
|
| Accounts payable |
|
|
|
36,784 |
|
|
|
36,784 |
|
|
|
53,356 |
|
|
|
53,356 |
| |
|
|
|
36,784 |
|
|
|
36,784 |
|
|
|
53,356 |
|
|
|
53,356 |
| |
|
299 |
|
133,052 |
|
25,042 |
|
158,393 |
|
|
|
231,424 |
|
61,582 |
|
293,006 |
| |
|
Consolidated |
| |
|
09/30/2023 |
|
09/30/2022 |
| |
|
Subsidiaries and associates |
|
Joint-ventures and Joint Operation |
|
Other related parties |
|
Total |
|
Subsidiaries and associates |
|
Joint-ventures and Joint Operation |
|
Other related parties |
|
Total |
| P&L |
|
|
|
|
|
|
|
|
|
|
|
|
|
|
|
|
| Sales |
|
74,457 |
|
14,562 |
|
1,254,418 |
|
1,343,437 |
|
168,475 |
|
22,308 |
|
1,926,149 |
|
2,116,932 |
| Cost and expenses |
|
(779) |
|
(1,504,666) |
|
(196,710) |
|
(1,702,155) |
|
(66) |
|
(1,114,540) |
|
(151,952) |
|
(1,266,558) |
| Financial income (expenses) |
|
|
|
|
|
|
|
|
|
|
|
|
|
|
|
|
| Interest (note 26) |
|
|
|
135,812 |
|
17,160 |
|
152,972 |
|
|
|
104,851 |
|
23,031 |
|
127,882 |
| Financial investments |
(1) |
|
|
|
|
(78,787) |
|
(78,787) |
|
|
|
|
|
(1,094,081) |
|
(1,094,081) |
| |
|
73,678 |
|
(1,354,292) |
|
996,081 |
|
(284,533) |
|
168,409 |
|
(987,381) |
|
703,147 |
|
(115,825) |
Quarterly Financial Information – September 30, 2023 – Companhia Siderúrgica Nacional (CONVENIENCE TRANSLATION INTO ENGLISH FROM THE ORIGINAL PREVIOUSLY ISSUED IN PORTUGUESE) | |
| |
|
Parent Company |
| |
|
09/30/2023 |
|
12/31/2022 |
| |
|
Subsidiaries and associates |
|
Joint-ventures and Joint Operation |
|
Other related parties and exclusive funds |
|
Total |
|
Subsidiaries and associates |
|
Joint-ventures and Joint Operation |
|
Other related parties and exclusive funds |
|
Total |
| Assets |
|
|
|
|
|
|
|
|
|
|
|
|
|
|
|
|
| Current Assets |
|
|
|
|
|
|
|
|
|
|
|
|
|
|
|
|
| Investments |
(1) |
|
|
|
|
1,186,312 |
|
1,186,312 |
|
|
|
|
|
1,125,578 |
|
1,125,578 |
| Trade receivables (note 5) |
(2) |
946,398 |
|
|
|
47,378 |
|
993,776 |
|
1,066,375 |
|
|
|
59,407 |
|
1,125,782 |
| Loans (note 8) |
(4) |
|
|
5,335 |
|
|
|
5,335 |
|
|
|
5,383 |
|
|
|
5,383 |
| Dividends (note 8) |
(3) |
196,161 |
|
39,621 |
|
|
|
235,782 |
|
255,859 |
|
39,621 |
|
|
|
295,480 |
| Other receivables (note 8) |
|
232,765 |
|
2 |
|
1,829 |
|
234,596 |
|
99,866 |
|
|
|
1,829 |
|
101,695 |
| |
|
1,375,324 |
|
44,958 |
|
1,235,519 |
|
2,655,801 |
|
1,422,100 |
|
45,004 |
|
1,186,814 |
|
2,653,918 |
| Non-current Assets |
|
|
|
|
|
|
|
|
|
|
|
|
|
|
|
|
| Investments |
(1) |
|
|
|
|
115,175 |
|
115,175 |
|
|
|
|
|
140,510 |
|
140,510 |
| Loans (note 8) |
(4) |
503,254 |
|
1,516,746 |
|
|
|
2,020,000 |
|
380,913 |
|
1,287,469 |
|
|
|
1,668,382 |
| Actuarial asset (note 8) |
|
|
|
|
|
28,072 |
|
28,072 |
|
|
|
|
|
28,072 |
|
28,072 |
| Other receivables (note 8) |
(5) |
102,572 |
|
1,705,332 |
|
|
|
1,807,904 |
|
223,908 |
|
1,484,759 |
|
|
|
1,708,667 |
| |
|
605,826 |
|
3,222,078 |
|
143,247 |
|
3,971,151 |
|
604,821 |
|
2,772,228 |
|
168,582 |
|
3,545,631 |
| |
|
1,981,150 |
|
3,267,036 |
|
1,378,766 |
|
6,626,952 |
|
2,026,921 |
|
2,817,232 |
|
1,355,396 |
|
6,199,549 |
| |
|
|
|
|
|
|
|
|
|
|
|
|
|
|
|
|
| Liabilities |
|
|
|
|
|
|
|
|
|
|
|
|
|
|
|
|
| Current Liabilities |
|
|
|
|
|
|
|
|
|
|
|
|
|
|
|
|
| Intercompany Loans (note 12) |
(6) |
1,689,921 |
|
|
|
|
|
1,689,921 |
|
43,806 |
|
|
|
|
|
43,806 |
| Trade payables |
|
548,687 |
|
28,673 |
|
24,096 |
|
601,456 |
|
269,264 |
|
41,654 |
|
36,289 |
|
347,207 |
| Accounts payable |
|
48,794 |
|
|
|
|
|
48,794 |
|
103,012 |
|
|
|
24,134 |
|
127,146 |
| Provision for consumption |
|
319,029 |
|
10,022 |
|
|
|
329,051 |
|
279,437 |
|
|
|
|
|
279,437 |
| |
|
2,606,431 |
|
38,695 |
|
24,096 |
|
2,669,222 |
|
695,519 |
|
41,654 |
|
60,423 |
|
797,596 |
| Non-current Liabilities |
|
|
|
|
|
|
|
|
|
|
|
|
|
|
|
|
| Intercompany Loans (note 12) |
(6) |
7,418,931 |
|
|
|
|
|
7,418,931 |
|
9,984,044 |
|
|
|
|
|
9,984,044 |
| Accounts payable |
|
2,803 |
|
|
|
|
|
2,803 |
|
41,694 |
|
|
|
|
|
41,694 |
| |
|
7,421,734 |
|
|
|
|
|
7,421,734 |
|
10,025,738 |
|
|
|
|
|
10,025,738 |
| |
|
10,028,165 |
|
38,695 |
|
24,096 |
|
10,090,956 |
|
10,721,257 |
|
41,654 |
|
60,423 |
|
10,823,334 |
| |
|
Parent Company |
| |
|
09/30/2023 |
|
09/30/2022 |
| |
|
Subsidiaries and associates |
|
Joint-ventures and Joint Operation |
|
Other related parties and exclusive funds |
|
Total |
|
Subsidiaries and associates |
|
Joint-ventures and Joint Operation |
|
Other related parties and exclusive funds |
|
Total |
| Net revenue and cost |
|
|
|
|
|
|
|
|
|
|
|
|
|
|
|
|
| Sales |
|
2,371,865 |
|
(15) |
|
1,242,813 |
|
3,614,663 |
|
3,295,037 |
|
284 |
|
1,925,793 |
|
5,221,114 |
| Cost and expenses |
|
(1,981,717) |
|
(342,956) |
|
(243,246) |
|
(2,567,919) |
|
(2,088,264) |
|
(396,557) |
|
(131,310) |
|
(2,616,131) |
| Financial income (expenses) |
|
|
|
|
|
|
|
|
|
|
|
|
|
|
|
|
| Interest (note 26) |
|
(134,880) |
|
133,515 |
|
16,635 |
|
15,270 |
|
(52,236) |
|
103,958 |
|
3,391 |
|
55,113 |
| Exclusive funds (note 26) |
|
|
|
|
|
11,141 |
|
11,141 |
|
|
|
|
|
9,753 |
|
9,753 |
| Financial investments |
(1) |
|
|
|
|
(78,786) |
|
(78,786) |
|
|
|
|
|
(1,075,238) |
|
(1,075,238) |
| Exchange rate variations and monetary, net |
|
392,346 |
|
|
|
|
|
392,346 |
|
362,843 |
|
|
|
|
|
362,843 |
| |
|
647,614 |
|
(209,456) |
|
948,557 |
|
1,386,715 |
|
1,517,380 |
|
(292,315) |
|
732,389 |
|
1,957,454 |
Consolidated and Parent Company Information:
| (1) | Financial investments: Refers mainly to
investments in Usiminas shares, cash and cash equivalents and Bonds with Banco Fibra and government bonds and CDBs with the exclusive
funds. |
| (2) | Accounts receivables: refers mainly to
sales transactions of steel products from the Parent Company to related parties. |
| (3) | Dividends receivable: In the Parent Company
on September 30, 2023, it mainly refers to interest on equity from Minérios Nacional S.A in the amount of R$9,353 (R$14,785 in
December 2022) and dividends from the subsidiary CSN Cimentos Brasil S.A in the amount of R$178,348 on September 30, 2023 (R$178,348 on
December 31, 2022) and in the Consolidated dividends from MRS Logística S.A in the amount of R$77,377 (R$77,377 in December 2022). |
Long term:
In Consolidated refers mainly to loan agreements with Transnordestina Logística amounting to R$1,603,482 (R$1,384,773 as of December
31, 2022) with an average rate of 125.0% to 130.0% of CDI.
| (5) | Others (Assets): In Consolidated as of September 30, 2023, refers advance
for future capital increase with Transnordestina Logística S.A. in the amount of R$1,705,332 (R$1,484,759 as of December 31, 2022). |
| (6) | Borrowings (Liabilities): |
Foreign currency: In the Parent
Company these are intercompany contracts amounting to R$7,342,254 as of September 30, 2023 (R$10,027,850 as of December 31, 2022).
Quarterly Financial Information – September 30, 2023 – Companhia Siderúrgica Nacional (CONVENIENCE TRANSLATION INTO ENGLISH FROM THE ORIGINAL PREVIOUSLY ISSUED IN PORTUGUESE) | |
| 20.b) | Key management personnel |
The key management personnel with authority and
responsibility for planning, directing, and controlling the Company’s activities include members of the Board of Directors and statutory
officers. The following is information on the compensation of such personnel and the related balances as of September 30, 2023, and 2022.
| |
|
09/30/2023 |
|
09/30/2022 |
| |
|
P&L |
| Short-term benefits for employees and officers |
|
47,354 |
|
47,196 |
| Post-employment benefits |
|
354 |
|
195 |
| |
|
47,708 |
|
47,391 |
The Company is liable for guarantees of its subsidiaries
and jointly controlled entities as follows:
| |
Currency |
|
Maturities |
|
Borrowings |
Tax foreclosure |
Others |
Total |
| |
|
|
|
|
09/30/2023 |
|
12/31/2022 |
|
09/30/2023 |
|
12/31/2022 |
|
09/30/2023 |
|
12/31/2022 |
|
09/30/2023 |
|
12/31/2022 |
| Transnordestina Logísitca |
R$ |
|
Up to 09/19/2056 and Indefinite |
|
2,132,291 |
|
2,096,291 |
|
10,029 |
|
9,365 |
|
4,235 |
|
3,853 |
|
2,146,555 |
|
2,109,509 |
| Group subsidiaries |
R$ |
|
Up to 12/21/2024 and indefinite |
|
1,900,000 |
|
|
|
|
|
197 |
|
131,920 |
|
2,163 |
|
2,031,920 |
|
2,360 |
| CSN Mineração |
R$ |
|
Up to 12/21/2024 |
|
|
|
540,946 |
|
|
|
|
|
|
|
|
|
|
|
540,946 |
| Total in R$ |
|
|
|
|
4,032,291 |
|
2,637,237 |
|
10,029 |
|
9,562 |
|
136,155 |
|
6,016 |
|
4,178,475 |
|
2,652,815 |
| |
|
|
|
|
|
|
|
|
|
|
|
|
|
|
|
|
|
|
|
| CSN Inova Ventures |
US$ |
|
01/28/2028 |
|
1,300,000 |
|
1,300,000 |
|
|
|
|
|
|
|
|
|
1,300,000 |
|
1,300,000 |
| CSN Resources |
US$ |
|
Up to 04/17/2026 |
|
1,150,000 |
|
1,150,000 |
|
|
|
|
|
|
|
|
|
1,150,000 |
|
1,150,000 |
| |
|
|
|
|
|
|
|
|
|
|
|
|
|
|
|
|
|
|
|
| CSN Cimentos |
US$ |
|
Indefinite |
|
115,000 |
|
115,000 |
|
|
|
|
|
|
|
|
|
115,000 |
|
115,000 |
| |
|
|
|
|
|
|
|
|
|
|
|
|
|
|
|
|
|
|
|
| Total in US$ |
|
|
|
|
2,565,000 |
|
2,565,000 |
|
|
|
|
|
|
|
|
|
2,565,000 |
|
2,565,000 |
| |
|
|
|
|
|
|
|
|
|
|
|
|
|
|
|
|
|
|
|
| Lusosider Aços Planos |
EUR |
|
Indefinite |
|
|
|
|
|
|
|
|
|
75,000 |
|
75,000 |
|
75,000 |
|
75,000 |
| Total in EUR |
|
|
|
|
|
|
|
|
|
|
|
|
75,000 |
|
75,000 |
|
75,000 |
|
75,000 |
| Total in R$ |
|
|
|
|
12,844,494 |
|
13,867,929 |
|
|
|
|
|
397,500 |
|
396,780 |
|
13,241,994 |
|
14,264,709 |
| |
|
|
|
|
16,876,785 |
|
16,505,166 |
|
10,029 |
|
9,562 |
|
533,655 |
|
402,796 |
|
17,420,469 |
|
16,917,524 |
The fully subscribed and paid-up capital as of
September 30, 2023, is R$10,240,000, divided into 1,326,093,947 common and book-entry shares (as of December 31, 2022, R$10,240,000 divided
into 1, 326,093,947 common and book-entry shares), with no par value. Each common share entitles to one vote in the resolutions of the
General Meeting.
The Company’s bylaws in effect on September
30, 2023, define that the share capital may be increased to up to 2,400,000,000 shares, by decision of the Board of Directors, regardless
of amendments to the bylaws.
It is constituted at the rate of 5% of the net
income calculated in each fiscal year, before any other allocation, pursuant to art. 193 of Law 6,404/86, up to a limit of 20% of the
capital stock.
As of September 30, 2023, and December 31, 2022,
the Company’s ownership structure was as follows:
Quarterly Financial Information – September 30, 2023 – Companhia Siderúrgica Nacional (CONVENIENCE TRANSLATION INTO ENGLISH FROM THE ORIGINAL PREVIOUSLY ISSUED IN PORTUGUESE) | |
| |
|
|
|
|
|
09/30/2023 |
|
|
|
|
|
12/31/2022 |
| |
|
Number of common shares |
|
% of total shares |
|
% of voting capital |
|
Number of common shares |
|
% of total shares |
|
% of voting capital |
| Vicunha Aços S.A. |
|
543,617,803 |
|
40.99% |
|
40.99% |
|
679,522,254 |
|
51.24% |
|
51.24% |
| Rio Iaco Participações S.A. |
|
45,706,242 |
|
3.45% |
|
3.45% |
|
45,706,242 |
|
3.45% |
|
3.45% |
| CFL Participações S.A. |
|
135,904,451 |
|
10.25% |
|
10.25% |
|
0 |
|
0.00% |
|
0.00% |
| NYSE (ADRs) |
|
269,650,326 |
|
20.33% |
|
20.33% |
|
254,520,040 |
|
19.19% |
|
19.19% |
| Other shareholders |
|
331,215,125 |
|
24.98% |
|
24.98% |
|
346,345,411 |
|
26.12% |
|
26.12% |
| Outstanding shares |
|
1,326,093,947 |
|
100.00% |
|
100.00% |
|
1,326,093,947 |
|
100.00% |
|
100.00% |
As of March 31, 2023, an Asset Restructuring Agreement
was entered into between Rio Purus Participações S.A. and CFL Participações S.A. ("CFL"), the shareholders
that directly and indirectly hold all the shares of Vicunha Aços S.A. ("Vicunha Aços"). Thus, the implementation
of this Transaction results in CFL Ana Participações S.A. ("CFL Ana"), a subsidiary of CFL, holding 135,904,451
common shares, book-entry and without par value issued by CSN, representing on this date 10.25% of its capital stock.
On September 30, 2023, the Company did not have
an open treasury share buyback program, below is the movement of the programs that were closed:
| Program |
|
Board’s Authorization |
|
Authorized quantity |
|
Program period |
|
Average buyback price |
|
Minimum and maximum buyback price |
|
Number bought back |
|
Share cancelation |
|
Sale of shares |
|
Balance in treasury |
| |
|
04/20/2018 |
|
30,391,000 |
|
From 4/20/2018 to 4/30/2018 |
|
Not applicable |
|
Not applicable |
|
|
|
|
|
22,981,500 |
|
7,409,500 |
| 1º |
|
06/21/2021 |
|
24,154,500 |
|
From 06/22/2021 to 12/22/2021 |
|
R$ 21.82 |
|
R$20,06 and R$23,22 |
|
24,082,000 |
|
|
|
|
|
31,491,500 |
| 2º |
|
6/12/2021 |
|
30,000,000 |
|
From 12/07/2021 to 6/30/2022 |
|
R$ 25.00 |
|
R$17,20 and R$26,76 |
|
29,938,600 |
|
|
|
|
|
61,430,100 |
| |
|
05/18/2022 |
|
|
|
|
|
Not applicable |
|
Not applicable |
|
|
|
61,430,100 |
|
|
|
|
| 3º |
|
05/18/2022 |
|
58,000,000 |
|
From 05/19/2022 to 05/18/2023 |
|
|
|
|
|
|
|
|
|
|
|
|
The earnings per share are shown below:
| |
|
|
|
|
|
|
Parent Company |
| |
Nine months ended |
|
Three months ended |
| |
09/30/2023 |
|
09/30/2022 |
|
09/30/2023 |
|
09/30/2022 |
| |
Common Shares |
|
Common Shares |
| (Loss)/profit for the period |
(897,273) |
|
1,537,119 |
|
(154,480) |
|
133,391 |
| Weighted average number of shares |
1,326,093,947 |
|
1,327,343,593 |
|
1,326,093,947 |
|
1,326,093,947 |
| Basic and diluted (loss)/earnings per share |
(0.67663) |
|
1.15804 |
|
(0.11649) |
|
0.10059 |
| 22. | COMPENSATION TO SHAREHOLDERS |
On May 17, 2023, the Company paid its shareholders
interest on equity in the amount of R$700,000, corresponding to a gross amount of R$0.52786606981 per share. Considering the incidence
of Withholding Income Tax at the rate of 15%, the net amount of Income Tax will be paid of R$595,000 equivalent to R$0.44868615934 per
share and dividends in the amount of R$1,614,000 equivalent to R$1.21710833810 per share.
| 23. | NET REVENUE FROM SALES |
Net sales revenue is comprised as follows:
Quarterly Financial Information – September 30, 2023 – Companhia Siderúrgica Nacional (CONVENIENCE TRANSLATION INTO ENGLISH FROM THE ORIGINAL PREVIOUSLY ISSUED IN PORTUGUESE) | |
| |
|
|
|
|
|
|
|
Consolidated |
| |
|
Nine months ended |
|
Three months ended |
| |
|
09/30/2023 |
|
09/30/2022 |
|
09/30/2023 |
|
09/30/2022 |
| Gross revenue |
|
|
|
|
|
|
|
|
| Domestic market |
|
21,323,643 |
|
22,801,754 |
|
7,247,887 |
|
8,231,980 |
| Foreign market |
|
17,032,354 |
|
15,417,709 |
|
5,557,506 |
|
4,406,455 |
| |
|
38,355,997 |
|
38,219,463 |
|
12,805,393 |
|
12,638,435 |
| Deductions |
|
|
|
|
|
|
|
|
| Sales returns, discounts and rebates |
|
(452,863) |
|
(207,894) |
|
(216,795) |
|
(86,469) |
| Taxes on sales |
|
(4,470,305) |
|
(4,778,732) |
|
(1,463,570) |
|
(1,654,917) |
| |
|
(4,923,168) |
|
(4,986,626) |
|
(1,680,365) |
|
(1,741,386) |
| Net revenue |
|
33,432,829 |
|
33,232,837 |
|
11,125,028 |
|
10,897,049 |
| |
|
|
|
|
|
|
|
Parent Company |
| |
|
Nine months ended |
|
Three months ended |
| |
|
09/30/2023 |
|
09/30/2022 |
|
09/30/2023 |
|
09/30/2022 |
| Gross revenue |
|
|
|
|
|
|
|
|
| Domestic market |
|
15,483,700 |
|
20,086,467 |
|
5,222,135 |
|
7,008,557 |
| Foreign market |
|
1,679,281 |
|
3,049,264 |
|
520,353 |
|
859,699 |
| |
|
17,162,981 |
|
23,135,731 |
|
5,742,488 |
|
7,868,256 |
| Deductions |
|
|
|
|
|
|
|
|
| Sales returns, discounts and rebates |
|
(323,906) |
|
(214,104) |
|
(171,609) |
|
(82,692) |
| Taxes on sales |
|
(2,877,269) |
|
(3,909,675) |
|
(957,216) |
|
(1,311,201) |
| |
|
(3,201,175) |
|
(4,123,779) |
|
(1,128,825) |
|
(1,393,893) |
| Net revenue |
|
13,961,806 |
|
19,011,952 |
|
4,613,663 |
|
6,474,363 |
| |
|
|
|
|
|
|
|
Consolidated |
| |
|
Nine months ended |
|
Three months ended |
| |
|
09/30/2023 |
|
09/30/2022 |
|
09/30/2023 |
|
09/30/2022 |
| Raw materials and inputs |
|
(9,279,330) |
|
(11,122,342) |
|
(3,119,846) |
|
(3,952,017) |
| Outsourcing material |
|
(3,895,247) |
|
(2,412,410) |
|
(1,223,886) |
|
(776,390) |
| Labor cost |
|
(3,081,949) |
|
(2,338,496) |
|
(1,098,453) |
|
(846,490) |
| Supplies |
|
(2,945,922) |
|
(2,513,231) |
|
(928,438) |
|
(1,003,132) |
| Maintenance cost (services and materials) |
|
(462,336) |
|
(835,269) |
|
(261,444) |
|
(258,475) |
| Outsourcing services |
|
(2,264,404) |
|
(1,497,304) |
|
(597,384) |
|
(522,485) |
| Freight |
|
(3,110,482) |
|
(1,770,492) |
|
(1,113,837) |
|
(769,423) |
| Depreciation, amortization and depletion |
|
(2,411,816) |
|
(1,967,394) |
|
(842,389) |
|
(689,033) |
| Others |
|
(964,737) |
|
(786,320) |
|
(309,285) |
|
(339,907) |
| |
|
(28,416,223) |
|
(25,243,258) |
|
(9,494,962) |
|
(9,157,352) |
| Classified as: |
|
|
|
|
|
|
|
|
| Cost of sales |
|
(25,138,859) |
|
(23,206,660) |
|
(8,319,723) |
|
(8,358,934) |
| Selling expenses |
|
(2,725,144) |
|
(1,595,871) |
|
(984,689) |
|
(647,943) |
| General and administrative expenses |
|
(552,220) |
|
(440,727) |
|
(190,550) |
|
(150,475) |
| |
|
(28,416,223) |
|
(25,243,258) |
|
(9,494,962) |
|
(9,157,352) |
Quarterly Financial Information – September 30, 2023 – Companhia Siderúrgica Nacional (CONVENIENCE TRANSLATION INTO ENGLISH FROM THE ORIGINAL PREVIOUSLY ISSUED IN PORTUGUESE) | |
| |
|
|
|
|
|
|
|
Parent Company |
| |
|
Nine months ended |
|
Three months ended |
| |
|
09/30/2023 |
|
09/30/2022 |
|
09/30/2023 |
|
09/30/2022 |
| Raw materials and inputs |
|
(7,943,210) |
|
(10,429,422) |
|
(2,673,097) |
|
(3,745,471) |
| Labor cost |
|
(1,229,846) |
|
(1,066,444) |
|
(430,445) |
|
(364,421) |
| Supplies |
|
(2,156,660) |
|
(1,767,188) |
|
(701,497) |
|
(706,007) |
| Maintenance cost (services and materials) |
|
(146,506) |
|
(326,588) |
|
(40,150) |
|
(73,592) |
| Outsourcing services |
|
(961,559) |
|
(864,895) |
|
(349,741) |
|
(297,196) |
| Freight |
|
(550,946) |
|
(651,030) |
|
(182,043) |
|
(254,972) |
| Depreciation, amortization and depletion |
|
(864,653) |
|
(784,510) |
|
(309,890) |
|
(271,431) |
| Others |
|
(176,651) |
|
(305,978) |
|
(108,093) |
|
(146,668) |
| |
|
(14,030,031) |
|
(16,196,055) |
|
(4,794,956) |
|
(5,859,758) |
| Classified as: |
|
|
|
|
|
|
|
|
| Cost of sales |
|
(13,218,969) |
|
(15,317,359) |
|
(4,516,482) |
|
(5,555,003) |
| Selling expenses |
|
(593,908) |
|
(708,561) |
|
(197,941) |
|
(244,946) |
| General and administrative expenses |
|
(217,154) |
|
(170,135) |
|
(80,533) |
|
(59,809) |
| |
|
(14,030,031) |
|
(16,196,055) |
|
(4,794,956) |
|
(5,859,758) |
The depreciation, amortization and depletion for
the period were distributed as follows.
| |
|
|
|
|
|
|
Consolidated |
| |
Nine months ended |
|
|
|
Three months ended |
|
| |
09/30/2023 |
|
09/30/2022 |
|
09/30/2023 |
|
09/30/2022 |
| Production costs (1) |
(2,374,561) |
|
(1,934,833) |
|
(827,094) |
|
(677,360) |
| Selling expenses |
(15,139) |
|
(10,121) |
|
(7,052) |
|
(3,681) |
| General and administrative expenses |
(22,116) |
|
(22,440) |
|
(8,243) |
|
(7,992) |
| |
(2,411,816) |
|
(1,967,394) |
|
(842,389) |
|
(689,033) |
| Other operational (2) |
(64,279) |
|
(57,571) |
|
(22,720) |
|
(19,335) |
| |
(2,476,095) |
|
(2,024,965) |
|
(865,109) |
|
(708,368) |
| |
|
|
|
|
|
|
|
| |
|
|
|
|
|
|
|
| |
|
|
|
|
|
|
Parent Company |
| |
Nine months ended |
|
|
|
Three months ended |
|
|
| |
09/30/2023 |
|
09/30/2022 |
|
09/30/2023 |
|
09/30/2022 |
| Production costs (1) |
(845,657) |
|
(768,100) |
|
(303,219) |
|
(265,913) |
| Selling expenses |
(7,248) |
|
(6,263) |
|
(2,556) |
|
(2,142) |
| General and administrative expenses |
(11,748) |
|
(10,147) |
|
(4,115) |
|
(3,376) |
| |
(864,653) |
|
(784,510) |
|
(309,890) |
|
(271,431) |
| Other operational (2) |
(6,104) |
|
(5,172) |
|
(2,498) |
|
(1,932) |
| |
(870,757) |
|
(789,682) |
|
(312,388) |
|
(273,363) |
(1) The cost of production includes
PIS and COFINS credits on lease agreements as of September 30, 2023, in the amount of R$5,782 in the consolidated (R$5,426 as of September
30, 2022) and R$620 in the parent company (R$458 as of September 30, 2022).
(2) They mainly refer to the depreciation of investment
properties, paralyzed equipment and amortization of the SWT customer portfolio, classified in other operating expenses, see note 25.
Quarterly Financial Information – September 30, 2023 – Companhia Siderúrgica Nacional (CONVENIENCE TRANSLATION INTO ENGLISH FROM THE ORIGINAL PREVIOUSLY ISSUED IN PORTUGUESE) | |
| 25. | OTHER OPERATING INCOME AND EXPENSES |
| |
|
|
|
|
|
|
|
Consolidated |
| |
|
Nine months ended |
|
Three months ended |
| |
|
09/30/2023 |
|
09/30/2022 |
|
09/30/2023 |
|
09/30/2022 |
| Other operating income |
|
|
|
|
|
|
|
|
| Receivables by indemnity |
|
6,422 |
|
152,437 |
|
956 |
|
143,406 |
| Rentals and leases |
|
15,765 |
|
8,826 |
|
4,416 |
|
4,304 |
| Contractual fines |
|
3,508 |
|
2,437 |
|
1,393 |
|
418 |
| Updated shares – Fair value through profit or loss (Note 13) |
|
(26,651) |
|
(27,977) |
|
(26,651) |
|
(25,623) |
| Gain on disposal of investments (1) |
|
114,763 |
|
|
|
114,763 |
|
|
| Other revenues |
|
28,904 |
|
87,178 |
|
6,662 |
|
50,780 |
| |
|
142,711 |
|
222,901 |
|
101,539 |
|
173,285 |
| |
|
- |
|
- |
|
- |
|
- |
| Other operating expenses |
|
|
|
|
|
|
|
|
| Taxes and fees |
|
(71,984) |
|
(115,514) |
|
(9,833) |
|
(56,358) |
| Expenses/reversal with environmental liabilities, net |
|
(6,665) |
|
(356) |
|
(2,299) |
|
(1,096) |
| Write-off/(Provision) of judicial lawsuits |
|
47,625 |
|
(61,962) |
|
43,114 |
|
(17,319) |
| Depreciation and amortization (note 24) |
|
(64,279) |
|
(57,571) |
|
(22,720) |
|
(19,335) |
| Reversal/(Write-offs) of estimated losses in fixed assets, intangible assets and Investment properties, net of reversal (notas 9.d, 10 e 11) (2) |
|
(27,365) |
|
(11,561) |
|
(26,640) |
|
(4,949) |
| Estimated (Loss)/reversal in inventories (3) |
|
(545,940) |
|
(179,169) |
|
(57,200) |
|
(60,947) |
| Idleness in stocks and paralyzed equipment (4) |
|
(287,344) |
|
(113,093) |
|
(20,330) |
|
(18,465) |
| Studies and project engineering expenses |
|
(39,199) |
|
(40,893) |
|
(14,090) |
|
(15,008) |
| Healthcare plan expenses |
|
(69,444) |
|
(63,918) |
|
(16,256) |
|
(12,759) |
| Cash flow hedge accounting realized (note 13) (5) |
|
(685,689) |
|
(815,269) |
|
28,562 |
|
(417,613) |
| Other expenses |
|
(299,612) |
|
(466,668) |
|
(117,166) |
|
(255,574) |
| |
|
(2,049,896) |
|
(1,925,974) |
|
(214,858) |
|
(879,423) |
| Other operating income (expenses), net |
|
(1,907,185) |
|
(1,703,073) |
|
(113,319) |
|
(706,138) |
| |
|
|
|
|
|
|
|
|
| |
|
|
|
|
|
|
|
Parent Company |
| |
|
Nine months ended |
|
Three months ended |
| |
|
09/30/2023 |
|
09/30/2022 |
|
09/30/2023 |
|
09/30/2022 |
| Other operating income |
|
|
|
|
|
|
|
|
| Receivables by indemnity |
|
5,932 |
|
150,777 |
|
1,228 |
|
143,398 |
| Rentals and leases |
|
10,424 |
|
6,907 |
|
3,783 |
|
2,731 |
| Contractual fines |
|
2,080 |
|
1,654 |
|
798 |
|
342 |
| Updated shares – Fair value through profit or loss (Note 13) |
|
(26,651) |
|
(27,977) |
|
(26,651) |
|
(25,623) |
| Other revenues |
|
467 |
|
70,858 |
|
554 |
|
43,779 |
| |
|
(7,748) |
|
202,219 |
|
(20,288) |
|
164,627 |
| |
|
|
|
|
|
|
|
|
| Other operating expenses |
|
|
|
|
|
|
|
|
| Taxes and fees |
|
(33,886) |
|
(81,542) |
|
662 |
|
(47,618) |
| Expenses with environmental liabilities, net |
|
(2,442) |
|
1,501 |
|
(769) |
|
(13) |
| Write-off/(Provision) of judicial lawsuits |
|
11,411 |
|
(26,236) |
|
58,131 |
|
478 |
| Depreciation of investment property, equipment paralyzed and amortization of intangible assets (note 24) |
(6,104) |
|
(5,172) |
|
(2,498) |
|
(1,932) |
| Write-offs and estimated losses of PPE, intangible assets and investment properties, net of reversal (notes 10 and 11) |
|
(659) |
|
(1,065) |
|
(1,973) |
|
(783) |
| Estimated (Loss)/reversal in inventories (3) |
|
(279,913) |
|
(128,673) |
|
(49,052) |
|
(51,218) |
| Idleness in stocks and paralyzed equipment (4) |
|
(279,663) |
|
(11,169) |
|
(17,923) |
|
(11,169) |
| Studies and project engineering expenses |
|
(11,831) |
|
(15,794) |
|
(3,533) |
|
(6,313) |
| Research and development expenses |
|
|
|
(296) |
|
|
|
(89) |
| Healthcare plan expenses |
|
(67,125) |
|
(63,355) |
|
(15,934) |
|
(12,702) |
| Cash flow hedge accounting realized (note 13) (5) |
|
(364,979) |
|
(830,132) |
|
(1,744) |
|
(409,102) |
| Other expenses |
|
(163,493) |
|
(362,692) |
|
(62,039) |
|
(232,335) |
| |
|
(1,198,684) |
|
(1,524,625) |
|
(96,672) |
|
(772,796) |
| Other operating income (expenses), net |
|
(1,206,432) |
|
(1,322,406) |
|
(116,960) |
|
(608,169) |
| (1) | Refers to the gain on the sale of Consórcio Machadinho (see note 9.e) |
| (2) | Mostly refers to the write-off on the sale of Consortium Machadinho (R$ 22,326
see note 9.e) |
| (3) | In the Parent Company, refers substantially to losses incurred in the production
process at the Presidente Vargas Plant ("UPV") and in Consolidated, losses in inventories in the amount of (R$213,490); |
| (4) | In 2023, unused capacity due to lower than normal production volume at Presidente
Vargas Plant ("UPV"); |
| (5) | In the Parent Company this is the realization of a Cash Flow Hedge in the
amount of (R$364,979) and in Consolidated the realization of a Cash Flow Hedge in the amount of (R$375,525) and a Hedge of Platts in the
amount of (R$310,164). |
Quarterly Financial Information – September 30, 2023 – Companhia Siderúrgica Nacional (CONVENIENCE TRANSLATION INTO ENGLISH FROM THE ORIGINAL PREVIOUSLY ISSUED IN PORTUGUESE) | |
| 26. | FINANCIAL INCOME (EXPENSES) |
| |
|
|
|
|
|
|
|
Consolidated |
| |
|
Nine months ended |
|
|
|
Three months ended |
|
|
| |
|
09/30/2023 |
|
09/30/2022 |
|
09/30/2023 |
|
09/30/2022 |
| Financial income |
|
|
|
|
|
|
|
|
| Related parties (Note 20 a) |
|
159,159 |
|
135,427 |
|
52,970 |
|
54,726 |
| Income from financial investments |
|
576,208 |
|
566,209 |
|
189,268 |
|
251,163 |
| Updated shares – Fair value through profit or loss (Note 13.d) |
|
(78,787) |
|
(1,094,081) |
|
(61,029) |
|
(63,379) |
| Interest and fines |
|
70,154 |
|
43,571 |
|
18,193 |
|
29,374 |
| Other income |
|
72,590 |
|
89,655 |
|
6,088 |
|
12,873 |
| |
|
799,324 |
|
(259,219) |
|
205,490 |
|
284,757 |
| Financial expenses |
|
|
|
|
|
|
|
|
| Borrowings and financing - foreign currency (note 12) |
|
(1,161,219) |
|
(935,326) |
|
(452,157) |
|
(335,108) |
| Borrowings and financing - local currency (note 12) |
|
(1,583,364) |
|
(948,725) |
|
(536,911) |
|
(362,934) |
| Capitalised interest (note 10) |
|
133,864 |
|
97,490 |
|
39,522 |
|
34,627 |
| Related parties |
|
(6,187) |
|
(7,545) |
|
(2,063) |
|
(2,669) |
| Lease liabilities |
|
(54,836) |
|
(48,535) |
|
(18,441) |
|
(16,951) |
| Interest and fines |
|
(135,711) |
|
(120,238) |
|
(17,917) |
|
(70,520) |
| Interest on drawn/forfaiting risk operations |
|
(355,329) |
|
(288,371) |
|
(97,464) |
|
(90,829) |
| (-) Adjustment present value of trade payables |
|
(253,571) |
|
(329,713) |
|
(86,058) |
|
(107,304) |
| Commission, bank fees, Guarantee and bank fees |
|
(148,620) |
|
(106,056) |
|
(49,567) |
|
(1,237) |
| PIS/COFINS over financial income |
|
(70,458) |
|
(103,979) |
|
(35,822) |
|
(47,007) |
| Other financial expenses |
|
(385,554) |
|
(270,972) |
|
(121,995) |
|
(83,181) |
| |
|
(4,020,985) |
|
(3,061,970) |
|
(1,378,873) |
|
(1,083,113) |
| Others financial items, net |
|
|
|
|
|
|
|
|
| Foreign exchange and monetary variation, net |
|
(380,880) |
|
899,295 |
|
130,870 |
|
467,697 |
| Gains and (losses) on exchange derivatives (*) |
|
3,530 |
|
88,151 |
|
(180,962) |
|
12,165 |
| |
|
(377,350) |
|
987,446 |
|
(50,092) |
|
479,862 |
| |
|
(4,398,335) |
|
(2,074,524) |
|
(1,428,965) |
|
(603,251) |
| |
|
|
|
|
|
|
|
|
| Financial income (expenses), net |
|
(3,599,011) |
|
(2,333,743) |
|
(1,223,475) |
|
(318,494) |
| |
|
|
|
|
|
|
|
|
| (*) Statement of gains and (losses) on derivative transactions (note 13.c) |
|
|
|
|
|
|
|
|
| Dollar - to - real NDF |
|
|
|
176,992 |
|
|
|
131,831 |
| Exchange rate swap Real x Dollar |
|
(64,497) |
|
(21,535) |
|
17,880 |
|
3,703 |
| Interest rate swap CDI x IPCA |
|
29,923 |
|
(99,734) |
|
(186,418) |
|
(109,353) |
| Exchange rate swap CDI x Dollar |
|
38,104 |
|
32,428 |
|
(12,424) |
|
(14,016) |
| |
|
3,530 |
|
88,151 |
|
(180,962) |
|
12,165 |
Quarterly Financial Information – September 30, 2023 – Companhia Siderúrgica Nacional (CONVENIENCE TRANSLATION INTO ENGLISH FROM THE ORIGINAL PREVIOUSLY ISSUED IN PORTUGUESE) | |
| |
|
|
|
|
|
|
|
Parent Company |
| |
|
Nine months ended |
|
Three months ended |
| |
|
09/30/2023 |
|
09/30/2022 |
|
09/30/2023 |
|
09/30/2022 |
| Financial income |
|
|
|
|
|
|
|
|
| Related parties (Note 20 a) |
|
212,571 |
|
146,767 |
|
71,270 |
|
47,965 |
| Income from financial investments |
|
82,358 |
|
173,264 |
|
38,908 |
|
75,955 |
| Interest and fines |
|
51,796 |
|
30,942 |
|
13,686 |
|
- |
| Updated shares – Fair value through profit or loss (Note 13.d) |
|
(78,787) |
|
(1,094,081) |
|
(61,029) |
|
(63,379) |
| Other income |
|
63,075 |
|
137,894 |
|
4,302 |
|
56,122 |
| |
|
331,013 |
|
(605,214) |
|
67,137 |
|
116,663 |
| Financial expenses |
|
|
|
|
|
|
|
|
| Borrowings and financing - foreign currency (note 12) |
|
(206,994) |
|
(108,292) |
|
(112,454) |
|
(39,393) |
| Borrowings and financing - local currency (note 12) |
|
(957,102) |
|
(735,128) |
|
(335,117) |
|
(261,197) |
| Related parties (note 12) |
|
(186,160) |
|
(81,901) |
|
(64,318) |
|
(40,021) |
| Lease liabilities |
|
(766) |
|
(1,115) |
|
(225) |
|
(347) |
| Capitalised interest (note 10) |
|
46,503 |
|
29,358 |
|
7,693 |
|
11,831 |
| Interest and fines |
|
(91,234) |
|
(57,989) |
|
(9,741) |
|
(55,253) |
| Interest on drawn/forfaiting risk operations |
|
(345,857) |
|
(288,371) |
|
(87,992) |
|
(90,829) |
| (-) Adjustment present value of trade payables |
|
(192,734) |
|
(283,040) |
|
(65,090) |
|
(91,299) |
| Commission, bank fees, Guarantee and bank fees |
|
(71,097) |
|
(71,106) |
|
(23,173) |
|
(20,996) |
| PIS/COFINS over financial income |
|
(14,301) |
|
(32,267) |
|
(7,332) |
|
(19,487) |
| Other financial expenses |
|
(62,510) |
|
(52,028) |
|
(23,527) |
|
(27,385) |
| |
|
(2,082,252) |
|
(1,681,879) |
|
(721,276) |
|
(634,376) |
| Others financial items, net |
|
|
|
|
|
|
|
|
| Foreign exchange and monetary variation, net |
|
(162,068) |
|
875,571 |
|
116,749 |
|
514,287 |
| Gains and (losses) on exchange derivatives (*) |
|
29,923 |
|
46,743 |
|
(12,424) |
|
299 |
| |
|
(132,145) |
|
922,314 |
|
104,325 |
|
514,586 |
| |
|
|
|
|
|
|
|
|
| Financial income (expenses), net |
|
(1,883,384) |
|
(1,364,779) |
|
(549,814) |
|
(3,127) |
| |
|
|
|
|
|
|
|
|
| (*) Statement of gains and (losses) on derivative transactions (note 13 c) |
|
|
|
|
|
|
|
|
| Dollar - to - real NDF |
|
- |
|
14,315 |
|
- |
|
14,315 |
| Exchange rate swap CDI x Dollar |
|
29,923 |
|
32,428 |
|
(12,424) |
|
(14,016) |
| |
|
29,923 |
|
46,743 |
|
(12,424) |
|
299 |
The financial information related to the business
segments is not changed from that disclosed in the Company's financial statements as of December 31, 2022. Accordingly, management has
decided not to repeat them in this condensed interim financial information.
Results by segment
For the purpose of preparing and presenting the
information by business segment, Management decided to maintain the proportional consolidation of the jointly controlled entities as historically
presented. For purposes of reconciliation of the consolidated result, the amounts recorded by these companies are not included in the
“Corporate expenses/elimination” column.
Quarterly Financial Information – September 30, 2023 – Companhia Siderúrgica Nacional (CONVENIENCE TRANSLATION INTO ENGLISH FROM THE ORIGINAL PREVIOUSLY ISSUED IN PORTUGUESE) | |
| |
|
|
|
|
|
|
|
|
|
|
|
|
|
|
|
Nine months ended |
| |
|
|
|
|
|
|
|
|
|
|
|
|
|
|
|
09/30/2023 |
| P&L |
|
Steel |
|
Mining |
|
Logistics |
|
|
|
Energy |
|
Cement |
|
Corporate expenses/elimination |
|
Consolidated |
| |
|
|
Port |
|
Railroads |
|
|
|
|
| Net revenues |
|
|
|
|
|
|
|
|
|
|
|
|
|
|
|
|
| Domestic market |
|
12,443,912 |
|
1,221,064 |
|
198,702 |
|
1,917,243 |
|
420,362 |
|
3,420,891 |
|
(3,028,318) |
|
16,593,856 |
| Foreign market |
|
4,619,407 |
|
10,886,945 |
|
|
|
|
|
|
|
|
|
1,332,619 |
|
16,838,971 |
| Cost of sales and services (note 24) |
|
(15,649,209) |
|
(7,439,776) |
|
(185,847) |
|
(1,059,221) |
|
(328,798) |
|
(2,826,543) |
|
2,350,536 |
|
(25,138,858) |
| Gross profit |
|
1,414,110 |
|
4,668,233 |
|
12,855 |
|
858,022 |
|
91,564 |
|
594,348 |
|
654,837 |
|
8,293,969 |
| General and administrative expenses (note 24) |
|
(899,301) |
|
(344,823) |
|
(7,840) |
|
(150,882) |
|
(43,702) |
|
(363,893) |
|
(1,466,922) |
|
(3,277,363) |
| Other operating (income) expenses, net (note 25) |
|
(1,063,238) |
|
(472,171) |
|
460 |
|
(5,173) |
|
200,024 |
|
(132,048) |
|
(435,037) |
|
(1,907,183) |
| Equity in results of affiliated companies (note 9) |
|
|
|
|
|
|
|
|
|
|
|
|
|
259,582 |
|
259,582 |
| Operating result before Financial Income and Taxes |
|
(548,429) |
|
3,851,239 |
|
5,475 |
|
701,967 |
|
247,886 |
|
98,407 |
|
(987,540) |
|
3,369,005 |
| |
|
|
|
|
|
|
|
|
|
|
|
|
|
|
|
|
| Sales by geographic area |
|
|
|
|
|
|
|
|
|
|
|
|
|
|
|
|
| Asia |
|
|
|
10,436,605 |
|
|
|
|
|
|
|
|
|
1,332,619 |
|
11,769,224 |
| North America |
|
1,217,242 |
|
|
|
|
|
|
|
|
|
|
|
|
|
1,217,242 |
| Latin America |
|
113,062 |
|
|
|
|
|
|
|
|
|
|
|
|
|
113,062 |
| Europe |
|
3,289,103 |
|
450,340 |
|
|
|
|
|
|
|
|
|
|
|
3,739,443 |
| Foreign market |
|
4,619,407 |
|
10,886,945 |
|
|
|
|
|
|
|
|
|
1,332,619 |
|
16,838,971 |
| Domestic market |
|
12,443,912 |
|
1,221,064 |
|
198,702 |
|
1,917,243 |
|
420,362 |
|
3,420,891 |
|
(3,028,318) |
|
16,593,856 |
| Total |
|
17,063,319 |
|
12,108,009 |
|
198,702 |
|
1,917,243 |
|
420,362 |
|
3,420,891 |
|
(1,695,699) |
|
33,432,827 |
| |
|
|
|
|
|
|
|
|
|
|
|
|
|
|
|
|
| |
|
|
|
|
|
|
|
|
|
|
|
|
|
|
|
|
| |
|
|
|
|
|
|
|
|
|
|
|
|
|
|
|
Three months ended |
| |
|
|
|
|
|
|
|
|
|
|
|
|
|
|
|
09/30/2023 |
| P&L |
|
Steel |
|
Mining |
|
Logistics |
|
|
|
Energy |
|
Cement |
|
Corporate expenses/elimination |
|
Consolidated |
| |
|
|
Port |
|
Railroads |
|
|
|
|
| Net revenues |
|
|
|
|
|
|
|
|
|
|
|
|
|
|
|
|
| Domestic market |
|
4,129,803 |
|
567,045 |
|
74,531 |
|
730,009 |
|
121,801 |
|
1,159,397 |
|
(1,169,672) |
|
5,612,914 |
| Foreign market |
|
1,213,964 |
|
3,768,219 |
|
|
|
|
|
|
|
|
|
529,928 |
|
5,512,111 |
| Cost of sales and services (note 24) |
|
(5,208,860) |
|
(2,567,265) |
|
(64,995) |
|
(367,196) |
|
(105,604) |
|
(915,106) |
|
909,303 |
|
(8,319,723) |
| Gross profit |
|
134,907 |
|
1,767,999 |
|
9,536 |
|
362,813 |
|
16,197 |
|
244,291 |
|
269,559 |
|
2,805,302 |
| General and administrative expenses (note 24) |
|
(298,523) |
|
(71,074) |
|
(2,937) |
|
(56,686) |
|
(16,300) |
|
(144,618) |
|
(585,100) |
|
(1,175,238) |
| Other operating (income) expenses, net (note 25) |
|
(128,142) |
|
(15,851) |
|
(1,388) |
|
(4,181) |
|
98,299 |
|
(55,616) |
|
(6,438) |
|
(113,317) |
| Equity in results of affiliated companies (note 9) |
|
|
|
|
|
|
|
|
|
|
|
|
|
130,771 |
|
130,771 |
| Operating result before Financial Income and Taxes |
|
(291,758) |
|
1,681,074 |
|
5,211 |
|
301,946 |
|
98,196 |
|
44,057 |
|
(191,208) |
|
1,647,518 |
| |
|
|
|
|
|
|
|
|
|
|
|
|
|
|
|
|
| Sales by geographic area |
|
|
|
|
|
|
|
|
|
|
|
|
|
|
|
|
| Asia |
|
|
|
3,664,918 |
|
|
|
|
|
|
|
|
|
529,928 |
|
4,194,846 |
| North America |
|
371,507 |
|
|
|
|
|
|
|
|
|
|
|
|
|
371,507 |
| Latin America |
|
29,000 |
|
|
|
|
|
|
|
|
|
|
|
|
|
29,000 |
| Europe |
|
813,458 |
|
103,301 |
|
|
|
|
|
|
|
|
|
|
|
916,759 |
| Others |
|
|
|
|
|
|
|
|
|
|
|
|
|
|
|
|
| Foreign market |
|
1,213,965 |
|
3,768,219 |
|
|
|
|
|
|
|
|
|
529,928 |
|
5,512,112 |
| Domestic market |
|
4,129,803 |
|
567,045 |
|
74,531 |
|
730,009 |
|
121,801 |
|
1,159,397 |
|
(1,169,672) |
|
5,612,914 |
| Total |
|
5,343,768 |
|
4,335,264 |
|
74,531 |
|
730,009 |
|
121,801 |
|
1,159,397 |
|
(639,744) |
|
11,125,026 |
Quarterly Financial Information – September 30, 2023 – Companhia Siderúrgica Nacional (CONVENIENCE TRANSLATION INTO ENGLISH FROM THE ORIGINAL PREVIOUSLY ISSUED IN PORTUGUESE) | |
| |
|
|
|
|
|
|
|
|
|
|
|
|
|
|
|
Nine months ended |
| |
|
|
|
|
|
|
|
|
|
|
|
|
|
|
|
09/30/2022 |
| P&L |
|
Steel |
|
Mining |
|
Logistics |
|
|
|
Energy |
|
Cement |
|
Corporate expenses/elimination |
|
Consolidated |
| |
|
|
Port |
|
Railroads |
|
|
|
|
| Net revenues |
|
|
|
|
|
|
|
|
|
|
|
|
|
|
|
|
| Domestic market |
|
16,087,365 |
|
1,364,074 |
|
221,754 |
|
1,703,843 |
|
139,310 |
|
1,638,512 |
|
(3,114,101) |
|
18,040,757 |
| Foreign market |
|
7,199,082 |
|
7,631,901 |
|
|
|
|
|
|
|
|
|
361,097 |
|
15,192,080 |
| Cost of sales and services (note 24) |
|
(18,041,998) |
|
(5,227,045) |
|
(162,504) |
|
(1,124,867) |
|
(148,765) |
|
(1,074,036) |
|
2,572,555 |
|
(23,206,660) |
| Gross profit |
|
5,244,449 |
|
3,768,930 |
|
59,250 |
|
578,976 |
|
(9,455) |
|
564,476 |
|
(180,449) |
|
10,026,177 |
| General and administrative expenses (note 24) |
|
(973,837) |
|
(212,919) |
|
(23,986) |
|
(101,708) |
|
(26,520) |
|
(237,802) |
|
(459,826) |
|
(2,036,598) |
| Other operating (income) expenses, net (note 25) |
|
(653,472) |
|
(247,544) |
|
(12,760) |
|
13,816 |
|
(1,346) |
|
(37,657) |
|
(764,110) |
|
(1,703,073) |
| Equity in results of affiliated companies (note 9) |
|
|
|
|
|
|
|
|
|
|
|
|
|
167,026 |
|
167,026 |
| Operating result before Financial Income and Taxes |
|
3,617,140 |
|
3,308,467 |
|
22,504 |
|
491,084 |
|
(37,321) |
|
289,017 |
|
(1,237,359) |
|
6,453,532 |
| |
|
|
|
|
|
|
|
|
|
|
|
|
|
|
|
|
| Sales by geographic area |
|
|
|
|
|
|
|
|
|
|
|
|
|
|
|
|
| Asia |
|
|
|
6,462,994 |
|
|
|
|
|
|
|
|
|
361,097 |
|
6,824,091 |
| North America |
|
1,757,243 |
|
|
|
|
|
|
|
|
|
|
|
|
|
1,757,243 |
| Latin America |
|
332,801 |
|
|
|
|
|
|
|
|
|
|
|
|
|
332,801 |
| Europe |
|
5,107,972 |
|
1,168,907 |
|
|
|
|
|
|
|
|
|
|
|
6,276,879 |
| Others |
|
1,066 |
|
|
|
|
|
|
|
|
|
|
|
|
|
1,066 |
| Foreign market |
|
7,199,082 |
|
7,631,901 |
|
|
|
|
|
|
|
|
|
361,097 |
|
15,192,080 |
| Domestic market |
|
16,087,365 |
|
1,364,074 |
|
221,754 |
|
1,703,843 |
|
139,310 |
|
1,638,512 |
|
(3,114,101) |
|
18,040,757 |
| Total |
|
23,286,447 |
|
8,995,975 |
|
221,754 |
|
1,703,843 |
|
139,310 |
|
1,638,512 |
|
(2,753,004) |
|
33,232,837 |
| |
|
|
|
|
|
|
|
|
|
|
|
|
|
|
|
|
| |
|
|
|
|
|
|
|
|
|
|
|
|
|
|
|
|
| |
|
|
|
|
|
|
|
|
|
|
|
|
|
|
|
Three months ended |
| |
|
|
|
|
|
|
|
|
|
|
|
|
|
|
|
09/30/2022 |
| |
|
Steel |
|
Mining |
|
Logistics |
|
|
|
Energy |
|
Cement |
|
Corporate expenses/elimination |
|
Consolidated |
| |
|
|
|
Port |
|
Railroads |
|
|
|
|
| Net revenues |
|
|
|
|
|
|
|
|
|
|
|
|
|
|
|
|
| Domestic market |
|
5,654,870 |
|
437,502 |
|
68,566 |
|
653,161 |
|
47,853 |
|
777,535 |
|
(1,090,586) |
|
6,548,901 |
| Foreign market |
|
2,043,519 |
|
2,089,469 |
|
|
|
|
|
|
|
|
|
215,160 |
|
4,348,148 |
| Cost of sales and services (note 24) |
|
(6,426,119) |
|
(1,800,015) |
|
(54,345) |
|
(397,365) |
|
(52,590) |
|
(501,272) |
|
872,772 |
|
(8,358,934) |
| Gross profit |
|
1,272,270 |
|
726,956 |
|
14,221 |
|
255,796 |
|
(4,737) |
|
276,263 |
|
(2,654) |
|
2,538,115 |
| General and administrative expenses (note 24) |
|
(333,724) |
|
(63,493) |
|
(6,693) |
|
(36,793) |
|
(9,613) |
|
(100,372) |
|
(247,730) |
|
(798,418) |
| Other operating (income) expenses, net (note 25) |
|
(321,627) |
|
(48,557) |
|
(2,833) |
|
(10,344) |
|
(442) |
|
(14,222) |
|
(308,113) |
|
(706,138) |
| Equity in results of affiliated companies (note 9) |
|
|
|
|
|
|
|
|
|
|
|
|
|
93,361 |
|
93,361 |
| Operating result before Financial Income and Taxes |
|
616,919 |
|
614,906 |
|
4,695 |
|
208,659 |
|
(14,792) |
|
161,669 |
|
(465,136) |
|
1,126,920 |
| |
|
|
|
|
|
|
|
|
|
|
|
|
|
|
|
|
| Sales by geographic area |
|
|
|
|
|
|
|
|
|
|
|
|
|
|
|
|
| Asia |
|
|
|
1,764,373 |
|
|
|
|
|
|
|
|
|
215,160 |
|
1,979,533 |
| North America |
|
565,374 |
|
|
|
|
|
|
|
|
|
|
|
|
|
565,374 |
| Latin America |
|
160,355 |
|
|
|
|
|
|
|
|
|
|
|
|
|
160,355 |
| Europe |
|
1,317,790 |
|
325,096 |
|
|
|
|
|
|
|
|
|
|
|
1,642,886 |
| Foreign market |
|
2,043,519 |
|
2,089,469 |
|
|
|
|
|
|
|
|
|
215,160 |
|
4,348,148 |
| Domestic market |
|
5,654,870 |
|
437,502 |
|
68,566 |
|
653,161 |
|
47,853 |
|
777,535 |
|
(1,090,586) |
|
6,548,901 |
| Total |
|
7,698,389 |
|
2,526,971 |
|
68,566 |
|
653,161 |
|
47,853 |
|
777,535 |
|
(875,426) |
|
10,897,049 |
| 28. | ADDITIONAL INFORMATION TO CASH FLOWS |
The following table provides additional information
about transactions related to the statement of cash flows:
| |
|
|
Consolidated |
|
|
|
Parent Company |
| |
09/30/2023 |
|
09/30/2022 |
|
09/30/2023 |
|
09/30/2022 |
| Income tax and social contribution paid |
676,226 |
|
3,028,030 |
|
6,665 |
|
278,919 |
| Addition to PP&E with interest capitalization (notes 10 and 26) |
133,864 |
|
97,490 |
|
46,503 |
|
29,358 |
| Remeasurement and addition – Right of use (note 10 i) |
150,878 |
|
94,257 |
|
3,990 |
|
2,501 |
| Addition to PP&E without adding cash |
81,860 |
|
19,970 |
|
|
|
|
| Capitalization in associate with no cash effect |
11,037 |
|
|
|
|
|
|
| |
1,053,865 |
|
3,239,747 |
|
57,158 |
|
310,778 |
Quarterly Financial Information – September 30, 2023 – Companhia Siderúrgica Nacional (CONVENIENCE TRANSLATION INTO ENGLISH FROM THE ORIGINAL PREVIOUSLY ISSUED IN PORTUGUESE) | |
| 29. | STATEMENT OF COMPREHENSIVE INCOME |
| |
|
|
|
|
|
|
|
Consolidated |
| |
|
Nine months ended |
|
Three months ended |
| |
|
09/30/2023 |
|
09/30/2022 |
|
09/30/2023 |
|
09/30/2022 |
| Profit for the period/(Loss) |
|
(448,456) |
|
1,970,906 |
|
90,794 |
|
237,632 |
| Other comprehensive income |
|
|
|
|
|
|
|
|
| Items that will not be subsequently reclassified to the statement of income |
|
|
|
|
|
|
|
|
| Actuarial gains/(losses) over pension plan of subsidiaries, net of taxes |
|
7,616 |
|
54 |
|
6,265 |
|
(2) |
| |
|
7,616 |
|
54 |
|
6,265 |
|
(2) |
| |
|
|
|
|
|
|
|
|
| Items that could be subsequently reclassified to the statement of income |
|
|
|
|
|
|
|
|
| Cumulative translation adjustments for the year |
|
(173,711) |
|
(714,813) |
|
24,382 |
|
(128,842) |
| (Loss)/gain cash flow hedge, net of taxes |
|
476,649 |
|
(94,155) |
|
(412,890) |
|
(354,777) |
| Cash flow hedge reclassified to income upon realization, net of taxes |
|
240,886 |
|
547,887 |
|
1,151 |
|
270,007 |
| (Loss)/gain cash flow hedge accounting, net taxes, from investments in subsidiaries |
|
310,321 |
|
(386,473) |
|
(212,259) |
|
(91,245) |
| |
|
854,145 |
|
(647,554) |
|
(599,616) |
|
(304,857) |
| |
|
|
|
|
|
|
|
|
| |
|
861,761 |
|
(647,500) |
|
(593,351) |
|
(304,859) |
| |
|
|
|
|
|
|
|
|
| Comprehensive income for the year |
|
413,305 |
|
1,323,406 |
|
(502,557) |
|
(67,227) |
| |
|
|
|
|
|
|
|
Parent Company |
| |
|
Nine months ended |
|
Three months ended |
| |
|
09/30/2023 |
|
09/30/2022 |
|
09/30/2023 |
|
09/30/2022 |
| Profit for the period/(Loss) |
|
(897,273) |
|
1,537,119 |
|
(154,480) |
|
133,391 |
|
|
|
|
|
|
|
|
|
| Other comprehensive income |
|
|
|
|
|
|
|
|
| |
|
|
|
|
|
|
|
- |
| Items that will not be subsequently reclassified to the statement of income |
|
|
|
|
|
|
|
|
| Actuarial gains/(losses) over pension plan of subsidiaries, net of taxes |
|
7,560 |
|
68 |
|
6,218 |
|
12 |
| |
|
7,560 |
|
68 |
|
6,218 |
|
12 |
| |
|
|
|
|
|
|
|
|
| Items that could be subsequently reclassified to the statement of income |
|
|
|
|
|
|
|
|
| Cumulative translation adjustments for the year |
|
(173,711) |
|
(714,813) |
|
24,382 |
|
(128,842) |
| (Loss)/gain cash flow hedge, net of taxes |
|
476,649 |
|
(94,155) |
|
(412,890) |
|
(354,777) |
| Cash flow hedge reclassified to income upon realization, net of taxes |
|
240,886 |
|
547,887 |
|
1,151 |
|
270,007 |
| (Loss)/gain cash flow hedge accounting – “Platts” in subsidiaries, net of taxes |
|
247,494 |
|
(308,335) |
|
(169,285) |
|
(72,879) |
| |
|
791,318 |
|
(569,416) |
|
(556,642) |
|
(286,491) |
| |
|
|
|
|
|
|
|
|
| |
|
798,878 |
|
(569,348) |
|
(550,424) |
|
(286,479) |
| |
|
|
|
|
|
|
|
|
| Comprehensive income for the year |
|
(98,395) |
|
967,771 |
|
(704,904) |
|
(153,088) |
Export Credit Note (NCE)
On October 4, 2023, the Company formalized the
raising of an Export Credit Note with Banco Bradesco, in the amount of R$680 million, with due dates in 2026, 2027 and 2028.
Acquisition of equity interest
On October 27, 2023, the Company entered into a
Stock Purchase and Sale Agreement and Other Covenants (“Purchase and Sale Agreement”) for the acquisition of 18.61% of Panatlântica S.A.'s share capital, at the price of R$150 million, to be paid in 6 annual installments, With the first payment on the transaction
closing date and the remaining payments on the subsequent five anniversaries. With this, the Company will, under the
terms of the Purchase and Sale Agreement, hold shares representing 29.91% of Panatlântica's share capital. The closing of this transaction
is subject to approval by competition authorities.
Quarterly Financial Information – September 30, 2023 – Companhia Siderúrgica Nacional (CONVENIENCE TRANSLATION INTO ENGLISH FROM THE ORIGINAL PREVIOUSLY ISSUED IN PORTUGUESE) | |
News published in the media
On November 7, 2023, the Company issued a material
fact in response to Official Letter 1.252/2023- SLS da Bolsa, Brasil, Balcão – B3, dated November 6, 2023, whose content
of the consultation deals with a possible interest in the assets of the company Intercement Participações. The Company clarifies
that it always evaluates investment opportunities in line with its business and growth strategy in the cement sector. In this sense, it
confirms the hiring of the bank Morgan Stanley to analyze the assets of Intercement Participações but reinforces that the
process is still in a preliminary phase, and there is no binding fact or document that deserves disclosure to the market under the terms
of the legislation in force, not It is even possible to determine the potential object of the transaction.
Dividend distribution
On November 13, 2023, the Company approved, at
a Board of Directors Meeting, the distribution of interim dividends in the amount of R$985 million, to the profit reserve account, corresponding
to the value of R$0.74 per share of capital stock. Dividends will be paid from November 29, 2023, as an advance of the mandatory minimum
dividend and without monetary correction.
Quarterly Financial Information – September 30, 2023 – Companhia Siderúrgica Nacional (CONVENIENCE TRANSLATION INTO ENGLISH FROM THE ORIGINAL PREVIOUSLY ISSUED IN PORTUGUESE) | |
3.1 Projections
The Company clarifies that the information disclosed
in this item represents a mere estimation, with hypothetical data and in no way constitute a promise of performance on behalf of the Company
and/or its managers. The projections presented below involve market factors beyond the Company's control and, therefore, may change.
The Company estimates the following variables below:
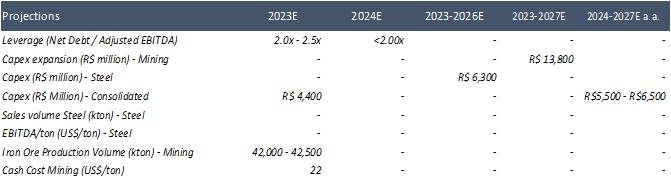
| b) | Projected period and the validity
period of the projection. |
The projected periods and validity periods can be seen
in the table above in item 3.1 a), and the numbers are always presented at the end of the fiscal year and duly published in the Standardized
Financial Statements (DFP) of each fiscal year.
| c) | Assumptions of the projection,
with the indication of which ones can be influenced by the administration of the issuer and which escape its control. |
All the premises of the projections mentioned above
are subject to external influence factors, which are outside the control of the Company's management. Therefore, in the event of any material
change in these assumptions, the Company may revise its estimates, changing them compared to those originally presented.
The main premise that can be influenced by the Company's
management would be its production and sales volumes, along with the associated costs.
The volume of ore production always considers our 2023
mining plan, with increased pellet feed production. However, key factors such as sales prices and raw material inputs are outside the
Company's control.
| d) | Values of the indicators that
are the subject of the forecast. |
The values can be found above in item 3.1 a).
3.2 In the event that the issuer has disclosed, during
the last 3 fiscal years, projections on the evolution of its indicators:
a) inform which ones are being replaced by new projections
included and which of them are being repeated.
Estimates maintained:

Estimates replaced in the last 3 financial years:
In Dec/21, the Company replaced its estimate of iron
ore production volume in 2021 to 36-37 Mton, against a previous expectation of 38-40 Mton.
Quarterly Financial Information – September 30, 2023 – Companhia Siderúrgica Nacional (CONVENIENCE TRANSLATION INTO ENGLISH FROM THE ORIGINAL PREVIOUSLY ISSUED IN PORTUGUESE) | |
In Dec/21, the Company replaced its estimate of Cash
Cost Mining in 2021 to US$19.00, against a previous expectation of US$16.00.
In Dec/21, the Company replaced its 2021 Expansion Mining
CAPEX estimate to R$560 million, against a previous expectation of R$1,000 million.
In Dec/21, the Company replaced its estimate of CAPEX
for Mining Expansion between 2022-2026 to R$12,000 million, against a previous expectation of R$14,000 million between 2021-2025.
In Dec/21, the Company replaced the estimate of Steel
CAPEX between 2022-2026 to R$6,300 million, against a previous expectation of R$6,100 million between 2021-2025.
In August/ 22, the Company replaced its estimate of
Cash Cost Mining in 2022 to the range of US$20.00 - US$22.00, against the previous expectation of US$18.00.
In August/22, the Company replaced its estimate of iron
ore production volume in 2022 to 36-38 Mton, against a previous expectation of 39-41 Mton.
In October/22, the Company replaced its estimate of
Consolidated CAPEX in 2022 to R$3,000 million, against a previous expectation of R$4,100 million.
In October/22, the Company replaced the leverage projection,
measured by the Net Debt/Adjusted EBITDA ratio, from 1.0x in 2022 to a level between 1.75x and 1.95x between the closing of the 2022 and
2023 annual balance sheets.
In October/22, the Company replaced its estimate of
iron ore production volume in 2022 to 34Mton, against a previous expectation of 36-38Mton.
In December/22, the Company replaced the steel sales
volume projection of 4,480 Kton in 2022 and added the projection of 4,670 Kton in 2023.
In December/22, the Company replaced the CAPEX projection
for expansion in Mining of approximately R$ 13.8 billion in the 2023-2027 period, related to phase 1 of the capacity addition project.
In December/22, the Company added the mining cash cost
projection to a level between US$19/ton and US$21/ton in 2023.
In December/22, the Company added the projection of
production volume and purchases of third-party ores between 39-41 Mton in 2023.
In December/22, the Company added its EBITDA projection
in the Energy segment of R$ 23 million in 2022.
In December/22, the Company replaced the Consolidated
CAPEX projection in the range of R$ 5.5 – R$ 6.5 billion in the period 2024-2027, and added the projection of R$ 4.4 billion in
2023.
In November/23, the Company replaced the projection
for iron ore production plus third-party purchases from a level between 39,000 kton and 41,000 kton to 42,000 kton and 42,500 kton at
the end of 2023;
In November/23, the Company replaced the C1 cash cost
in mining from a level between US$19/ton and US$21/ton to US$22/ton in 2023;
In November/23, the Company replaced the leverage projection,
measured by the Net Debt/Adjusted EBITDA ratio, from a level between 1.75x and 1.95x to a level between 2.00x and 2.50x at the close of
the 2023 annual balance sheet and below 2.0x at the close of the 2024 annual balance sheet;
In November/23, the Company removed its steel sales
volume projection of 4,670kton in 2023;
In November/23, the Company removed its projection of
achieving an EBITDA per ton in the steel industry of US$165/ton in 2023.
Quarterly Financial Information – September 30, 2023 – Companhia Siderúrgica Nacional (CONVENIENCE TRANSLATION INTO ENGLISH FROM THE ORIGINAL PREVIOUSLY ISSUED IN PORTUGUESE) | |
b) regarding the projections related to periods already
elapsed, compare the projected data with the effective performance of the indicators, clearly indicating the reasons that led to deviations
in the projections.
2021

Regarding the major deviations above and below the expectation,
our evaluations are as follows:
The increase in net debt, in millions of reais, compared
to the guidance was mainly tied by the share repurchase programs, in addition to the exchange variation observed in the period. However,
even with the increase in net debt, the company's leverage was still below the 1.0x Net Debt/EBITDA level.
The steel Sales Volume was impacted by the lower sales
volume during the third quarter, which was marked by the commercial strategy of prioritizing price, without the application of discounts,
to the detriment of the sold volume. This strategy proved to be assertive for the Company's financial results.
The company's dollarized Cash Cost annual average was
$2.6/t, worse than the guidance presented due to a one-off pressure in November, impacted by the scheduled halts and heavy rainfall in
the period, causing a lower dilution of the mine’s and port’s fixed cost. If we discount the month of November from the calculation
of the average of the year, the average cash cost would be $19.00, which is in line with what was expected by The Company.
2022
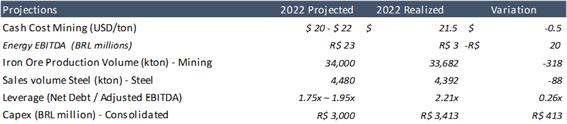
Regarding the major deviations above and below the expectation,
our evaluations are as follows:
The volume of ore production was impacted by above-normal
rainfall in the Company's operations, which affected the mining and transportation capacity of the ore, and the ramp-up of projects connected
to the Central Plant (CMAI 3, spirals, and regrinding).
The increase in Capex expenditures, which were above
expectations, mainly occurred in the fourth quarter with the integration of Cimentos Brasil's operations.
The increase in net debt, in millions of reais, compared
to the guidance, was mainly caused by large cash expenditures related to the Company's acquisitions, with the aim of diversifying its
business portfolio.
Quarterly Financial Information – September 30, 2023 – Companhia Siderúrgica Nacional (CONVENIENCE TRANSLATION INTO ENGLISH FROM THE ORIGINAL PREVIOUSLY ISSUED IN PORTUGUESE) | |
c) as of projections for periods still in progress,
inform whether the projections remain valid on the date of submission of the form and, if so, explain why they were abandoned or replaced.
Current and valid estimates:
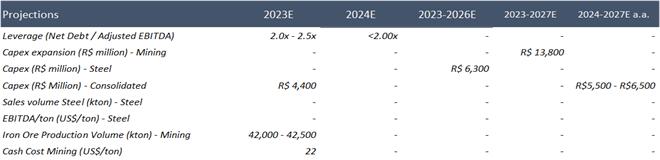
Monitoring and changes in projections disclosed
Superseded estimates:
In August/22, the Company replaced its estimate of Cash
Cost Mining in 2022 to the range of US$20.00 - US$22.00, against the previous expectation of US$18.00.
In August/22, the Company replaced its estimate of iron
ore production volume in 2022 to 36-38 Mton, against a previous expectation of 39-41 Mton.
In October/22, the Company replaced its estimate of
Consolidated CAPEX in 2022 to R$3,000 million, against a previous expectation of R$4,100 million.
In October/22, the Company replaced the leverage projection,
measured by the Net Debt/Adjusted EBITDA ratio, from 1.0x in 2022 to a level between 1.75x and 1.95x between the closing of the 2022 and
2023 annual balance sheets.
In October/22, the Company replaced its estimate of
iron ore production volume in 2022 to 34Mton, against a previous expectation of 36-38Mton.
In December/22, the Company replaced the steel sales
volume projection of 4,480 Kton in 2022 and added the projection of 4,670 Kton in 2023.
In December/22, the Company replaced the CAPEX projection
for expansion in Mining of approximately R$ 13.8 billion in the 2023-2027 period, related to phase 1 of the capacity addition project.
In December/22, the Company added the mining cash cost
projection to a level between US$19/ton and US$21/ton in 2023.
In December/22, the Company added the projection of
production volume and purchases of third-party ores between 39-41 Mton in 2023.
In December/22, the Company added its EBITDA projection
in the Energy segment of R$ 23 million in 2022.
In December/22, the Company replaced the Consolidated
CAPEX projection in the range of R$ 5.5 – R$ 6.5 billion in the period 2024-2027 and added th e projection of R$ 4.4 billion
in 2023.
In November/23, the Company replaced the projection
for iron ore production plus third-party purchases from a level between 39,000 kton and 41,000 kton to 42,000 kton and 42,500 kton at
the end of 2023;
In November/23, the Company replaced the C1 cash cost
in mining from a level between US$19/ton and US$21/ton to US$22/ton in 2023;
In November/23, the Company replaced the leverage projection,
measured by the Net Debt/Adjusted EBITDA ratio, from a level between 1.75x and 1.95x to a level between 2.00x and 2.50x at the close of
the 2023 annual balance sheet and below 2.0x at the close of the 2024 annual balance sheet;
In November/23, the Company removed its steel sales
volume projection of 4,670kton in 2023;
In November/23, the Company removed its projection of
achieving an EBITDA per ton in the steel industry of US$165/ton in 2023.
Quarterly Financial Information – September 30, 2023 – Companhia Siderúrgica Nacional (CONVENIENCE TRANSLATION INTO ENGLISH FROM THE ORIGINAL PREVIOUSLY ISSUED IN PORTUGUESE) | |
To the Shareholders, Directors and Managers of
Companhia Siderúrgica Nacional
Sao Paulo-SP
Introduction
We have reviewed the parent company and consolidated interim financial
information of Companhia Siderúrgica Nacional ("Company"), contained in the Quarterly Information Form - ITR for the quarter ended
September 30, 2023, which comprise the balance sheet as of September 30, 2023 and the related statements of income, comprehensive income,
for three and nine-month period then ended and changes in shareholder’s equity and cash flows for the nine-month period then ended,
including a summary of significant accounting policies and notes.
The Company's management is responsible for preparing and presenting the
parent company and consolidated interim financial information, in accordance with technical pronouncement NBC TG 21 - Interim Financial Statements
and with the international accounting standard IAS 34 - Interim Financial Reporting, issued by the International Accounting Standards
Board (IASB), as well as the presentation of this information in accordance with the standards issued by the Brazilian Securities Commission,
applicable to the preparation of the Quarterly Information - ITR. Our responsibility is to express a conclusion on this interim financial
information based on our review.
Scope of review
We conducted our review in accordance with Brazilian and International Standards for Reviews of Interim Financial information (NBC TR 2410 - Review of Interim Financial Information Performed by the Entity Auditor and
ISRE 2410 - Review of Interim Financial Information Performed by the Independent Auditor of the Entity, respectively). A review of interim
information consists of making inquiries, primarily of persons responsible for financial and accounting matters, and applying analytical
and other review procedures. The scope of a review is significantly less than that of an audit conducted in accordance with auditing standards
and, consequently, did not enable us to obtain assurance that we became aware of all significant matters that might be identified
in an audit. Therefore, we do not express an audit opinion.
Conclusion on the individual and consolidated interim financial information
Based on our review, we are not aware of any fact which leads us to believe
that the individual and consolidated interim financial information included in the aforementioned quarterly information was not prepared,
in all material respects, in accordance with NBC TG 21 and IAS 34, applicable to the preparation of the Quarterly Information - ITR, and
presented in accordance with the rules issued by the Brazilian Securities and Exchange Commission.
Other matters
Statement of Value Added
The aforementioned quarterly information includes the individual and consolidated
Statements of Value Added (DVA), referring to the nine-month period ended September 30, 2023, prepared under the responsibility of the
Company's management and presented as supplementary information for IAS purposes 34. These statements were submitted to review procedures
performed in conjunction with the review of the Company's quarterly information - ITR -, in order to conclude whether they are reconciled
with the interim financial information and accounting records, as applicable, and if their form and content are in accordance with the
criteria defined in NBC TG 09 - "Demonstration of Added Value". Based on our review, we are not aware of any facts that lead
us to believe that these statements of value added were not prepared, in all material respects, in accordance with the criteria defined
in this standard and in a manner consistent with the interim financial information, individual and consolidated, taken together.
Barueri, November 13, 2023.
Mazars Auditores Independentes – Sociedade Simples Ltda.
CRC 2 SP023701/O-8
Danhiel Augusto Reis
Contador CRC 1SP254522/O-0
Quarterly Financial Information – September 30, 2023 – Companhia Siderúrgica Nacional (CONVENIENCE TRANSLATION INTO ENGLISH FROM THE ORIGINAL PREVIOUSLY ISSUED IN PORTUGUESE) | |
Opinions and Statements / Officers Statement
on the Financial Statement
As Executive Officers of Companhia Siderúrgica Nacional, we declare
pursuant to Article 27, paragraph 1º, item VI, and Article 31, paragraph 1º, item II of CVM Instruction 80, of March 29, 2022,
that we reviewed, discussed and agreed with the Company’s Financial Statements for the quarter ended September 30,2023.
São Paulo, November 13, 2023.
Benjamin Steinbruch
CEO
Marcelo Cunha Ribeiro
Executive Officer – CFO and Investors Relations
David Moise Salama
Executive Officer
Luis Fernando Barbosa Martinez
Executive Officer
Stephan Heinz Josef Victor Weber
Executive Officer
Alexandre de Campos Lyra
Executive Officer
Quarterly Financial Information – September 30, 2023 – Companhia Siderúrgica Nacional (CONVENIENCE TRANSLATION INTO ENGLISH FROM THE ORIGINAL PREVIOUSLY ISSUED IN PORTUGUESE) | |
Opinions and Statements / Officers Statement
on Auditor’s Report
As Executive Officers of Companhia Siderúrgica Nacional, we declare
pursuant to Article 27, paragraph 1º, item V and Article 31, paragraph 1º, item II of CVM Instruction 80, of March 29,2022,
that we reviewed, discussed and agreed with the opinion expressed on the Independent Auditors’ Report related to the Company’s
Financial Statements for the quarter ended September 30,2023.
São Paulo, November 13, 2023.
Benjamin Steinbruch
CEO
Marcelo Cunha Ribeiro
Executive Officer – CFO and Investors Relations
David Moise Salama
Executive Officer
Luis Fernando Barbosa Martinez
Executive Officer
Stephan Heinz Josef Victor Weber
Executive Officer
Alexandre de Campos Lyra
Executive Officer
Quarterly Financial Information – September 30, 2023 – Companhia Siderúrgica Nacional (CONVENIENCE TRANSLATION INTO ENGLISH FROM THE ORIGINAL PREVIOUSLY ISSUED IN PORTUGUESE) | |
SIGNATURE
Pursuant to the requirements of the Securities Exchange Act of 1934, the registrant has duly caused this report to be signed on its behalf by the undersigned, thereunto duly authorized.
Date: December 26, 2023
|
COMPANHIA SIDERÚRGICA NACIONAL |
|
|
|
By: |
/S/ Benjamin Steinbruch
|
| |
Benjamin Steinbruch
Chief Executive Officer
|
|
|
|
|
|
By: |
/S/ Marcelo Cunha Ribeiro
|
| |
Marcelo Cunha Ribeiro
Chief Financial and Investor Relations Officer
|
FORWARD-LOOKING STATEMENTS
This press release may contain forward-looking statements. These statements are statements that are not historical facts, and are based on management's current view and estimates of future economic circumstances, industry conditions, company performance and financial results. The words "anticipates", "believes", "estimates", "expects", "plans" and similar expressions, as they relate to the company, are intended to identify forward-looking statements. Statements regarding the declaration or payment of dividends, the implementation of principal operating and financing strategies and capital expenditure plans, the direction of future operations and the factors or trends affecting financial condition, liquidity or results of operations are examples of forward-looking statements. Such statements reflect the current views of management and are subject to a number of risks and uncertainties. There is no guarantee that the expected events, trends or results will actually occur. The statements are based on many assumptions and factors, including general economic and market conditions, industry conditions, and operating factors. Any changes in such assumptions or factors could cause actual results to differ materially from current expectations.
Companhia Siderurgica Na... (NYSE:SID)
Historical Stock Chart
From Mar 2024 to Apr 2024

Companhia Siderurgica Na... (NYSE:SID)
Historical Stock Chart
From Apr 2023 to Apr 2024
