UNITED
STATES
SECURITIES
AND EXCHANGE COMMISSION
Washington,
D.C. 20549
FORM
6-K
REPORT
OF FOREIGN PRIVATE ISSUER
PURSUANT
TO RULE 13a-16 OR 15d-16 UNDER
THE
SECURITIES EXCHANGE ACT OF 1934
For
the month of February 2024
Commission File Number 1-12260
COCA-COLA FEMSA, S.A.B.
de C.V.
(Translation
of registrant’s name into English)
United Mexican States
(Jurisdiction
of incorporation or organization)
Calle Mario Pani No. 100,
Santa Fe Cuajimalpa,
Cuajimalpa de Morelos,
05348, Ciudad de México,
México
(Address
of principal executive offices)
Indicate
by check mark whether the registrant files or will file annual reports under cover of Form 20-F or Form 40-F.
Form
20-F X Form 40-F
Indicate
by check mark if the registrant is submitting the Form 6-K in paper as permitted by Regulation S-T Rule 101(b)(1)
Yes No
X
Indicate
by check mark if the registrant is submitting the Form 6-K in paper as permitted by Regulation S-T Rule 101(b)(7)
Yes No
X
Indicate
by check mark whether the registrant by furnishing the information contained in this Form is also thereby furnishing the information
to the Commission pursuant to Rule 12g3-2(b) under the Securities Exchange Act of 1934.
Yes No
X
If
"Yes" is marked, indicate below the file number assigned to the registrant in connection with
Rule
12g3-2(b): 82-__.

|
FOURTH QUARTER HIGHLIGHTS |
Mexico City, February 22, 2024, Coca-Cola FEMSA, S.A.B. de C.V. (BMV: KOFUBL, NYSE:
KOF) (“Coca-Cola FEMSA”, “KOF” or the “Company”), the largest Coca-Cola franchise bottler in the world
by sales volume, announces results for the fourth quarter of 2023.
| · | Operating income growth 7.3% |
| · | Majority net income decreased 24.5% |
| · | Earnings per share1 were Ps. 0.32. (Earnings per unit were Ps.
2.57 and per ADS were Ps. 25.67.) |
| · | Achieved more than 1.1 million monthly active buyers on Juntos+, our omnichannel
B2B platform |
| · | Volume growth 7.8% —surpassing 4 billion unit cases for the first
time in Coca-Cola FEMSA’s history |
| · | Operating income growth 10.8% |
| · | Majority net income growth 2.6% |
| · | Earnings per share1 were Ps. 1.16. (Earnings per unit were Ps.
9.30 and per ADS were Ps. 92.99.) |
| · | Achieved more than US$2.5 billion in digital revenues through Juntos+ |
| FINANCIAL SUMMARY FOR THE FOURTH QUARTER RESULTS |
| Change vs. same period of last year |
| |
|
Total Revenues |
|
Gross Profit |
|
Operating Income |
|
Majority Net Income |
| |
|
4Q23 |
FY 2023 |
|
4Q23 |
FY 2023 |
|
4Q23 |
FY 2023 |
|
4Q23 |
FY 2023 |
| As Reported |
Consolidated |
8.0% |
8.1% |
|
12.6% |
10.5% |
|
7.3% |
10.8% |
|
(24.5%) |
2.6% |
| Mexico & Central America |
11.3% |
14.0% |
|
17.5% |
15.5% |
|
7.8% |
10.6% |
|
|
|
| South America |
3.8% |
(0.0%) |
|
5.8% |
2.4% |
|
6.7% |
11.3% |
|
|
|
| |
|
|
|
|
|
|
|
|
|
|
|
|
| Comparable (2) |
Consolidated |
15.7% |
18.0% |
|
21.3% |
20.5% |
|
15.3% |
19.4% |
|
|
|
| Mexico & Central America |
13.1% |
16.0% |
|
19.4% |
17.5% |
|
10.0% |
12.6% |
|
|
|
| South America |
19.5% |
21.3% |
|
24.3% |
26.5% |
|
23.6% |
36.7% |
|
|
|
Ian Craig,
Coca-Cola FEMSA’s CEO, commented:
"We are pleased to report another
quarter of solid growth. Within our key markets, we achieved outstanding results, particularly in Mexico, Brazil, Colombia, and Guatemala.
These results enabled us to surpass 4 billion unit cases of NARTD volume for the year, underscoring our strategic focus on a sustainable
growth model across our markets.
This year also marked another milestone
in our digital transformation journey. We successfully accelerated the development and adoption of our digital platform Juntos +, achieving
more than 1.1 million monthly active users and digital sales of more than US$ 2.5 billion during the year. The integration of advanced
analytics and user experience improvements in version 4.0, is enabling us to serve our customers more effectively, driving both loyalty
and growth. Looking ahead, we are committed to further leveraging digital innovation and advanced analytics to stay ahead of consumer
trends, enhance our value proposition, and drive sustainable growth.
Finally, we continue to focus on
developing a consumer-centric culture, with psychological safety across all levels of our organization. This approach will continue to
shape our growth mindset as we aim to continue creating value for all of our customers, consumers, and stakeholders."
| (1) | Quarterly earnings / outstanding shares. Earnings per share (EPS) were calculated using 16,806.7 million
shares outstanding. For the convenience of the reader, as a KOFUBL Unit is comprised of 8 shares (3 Series B shares and 5 Series L shares),
earnings per unit are equal to EPS multiplied by 8. Each ADS represents 10 KOFUBL Units. |
| (2) | Please refer to page 10 for our definition of “comparable” and a description of the factors
affecting the comparability of our financial and operating performance.
|
| | |
Coca-Cola FEMSA Reports 4Q23 Results February 22, 2024 | Page 2 of 17 |
RECENT
DEVELOPMENTS
| · | On November 3, 2023, Coca-Cola FEMSA paid the second installment of the
ordinary dividend approved for Ps. 0.3625 per share, for a total cash distribution of Ps. 6,092 million. |
| · | On November 27, 2023, Coca-Cola FEMSA announced an investment of Ps. 575
million to support economic recovery and rehabilitate its operational units in the state of Guerrero affected by Hurricane Otis. As part
of its efforts to proactively address the needs of the affected population and contribute to the swift recovery of communities, the Company
has prioritized humanitarian aid to its employees and the community, through in-kind donations addressing the needs of the most affected
population. |
| · | On February 13, 2024, FEMSA and Coca-Cola FEMSA announced their inclusion
in S&P Global’s Sustainability Yearbook. This represented the fourth consecutive year and the sixth time in the last decade
that Coca-Cola FEMSA was included. In this edition, the Company achieved high scores in Health and Nutrition, Water, Circularity and Resource
Efficiency, Emissions, and Transparency and Reporting. |
| · | On February 15, 2024, Coca-Cola FEMSA announced that it will hold its Annual
Shareholders' Meeting on March 19, 2024. |
CONFERENCE
CALL INFORMATION

| | |
Coca-Cola FEMSA Reports 4Q23 Results February 22, 2024 | Page 3 of 17 |
CONSOLIDATED
FOURTH QUARTER RESULTS

| CONSOLIDATED FOURTH QUARTER RESULTS |
| |
|
|
|
|
|
|
| |
|
As Reported |
|
Comparable (1) |
| Expressed in millions of Mexican pesos |
|
4Q 2023 |
4Q 2022 |
Δ% |
|
Δ% |
| Total revenues |
|
66,078 |
61,209 |
8.0% |
|
15.7% |
| Gross profit |
|
30,475 |
27,068 |
12.6% |
|
21.3% |
| Operating income |
|
9,674 |
9,013 |
7.3% |
|
15.3% |
| Adj. EBITDA (2) |
|
13,149 |
11,954 |
10.0% |
|
19.3% |
Volume
increased 6.1% to 1,056.2 million unit cases, driven by volume growth in most of our territories, including a solid performance in Mexico,
Brazil, Guatemala, and Colombia, partially offset by a slight decrease in Argentina and Uruguay. Excluding the acquisition of the Cristal
bulk water business in Mexico, total volume would have increased 5.1%.
Total
revenues increased 8.0% to Ps. 66,078 million. This increase was driven mainly by volume growth, partially offset by unfavorable
currency translation effects from most of our operating currencies into Mexican Pesos. Excluding currency translation effects, total revenues
increased 15.7%.
Gross
profit increased 12.6% to Ps. 30,475 million, and gross margin increased 190 basis points to 46.1%. This expansion was driven
mainly by our top-line growth, easing packaging costs, and the appreciation of most of our operating currencies as applied to our U.S.
dollar-denominated raw material costs. These effects were partially offset by higher sweetener costs across our territories. Excluding
currency translation effects, gross profit increased 21.3%.
Operating
income increased 7.3% to Ps. 9,674 million, and operating margin decreased 10 basis points to 14.6%. This margin decrease was
driven mainly by an increase in expenses such as labor, marketing, and maintenance. In addition, the Company incurred temporary expenses
mostly related to the shipment of finished product to Acapulco as a result of hurricane Otis. These effects were partially offset by a
solid top-line performance, easing packaging costs, and the appreciation of most of our operating currencies as applied to our U.S. dollar-
denominated raw material costs. Excluding currency translation effects, operating income increased 15.3%
| (1) | Please refer to page 10 for our definition of “comparable” and a description of the factors
affecting the comparability of our financial and operating performance. |
| (2) | Adjusted EBITDA = operating income + depreciation + amortization & other operating non-cash charges. |
| | |
Coca-Cola FEMSA Reports 4Q23 Results February 22, 2024 | Page 4 of 17 |
Comprehensive
financing result recorded an expense of Ps. 1,285 million, compared to an expense of Ps. 1,092 million in the previous year.
This increase was driven mainly by a lower gain in monetary positions in inflationary subsidiaries of Ps. 4 million, as compared to a
gain of Ps. 128 million during the same period of the previous year.
Additionally, we recorded an increase
in our interest expense, net, driven mainly by a decrease of Ps. 92 million in our interest income mainly related to the depreciation
of the Argentine Peso. Finally, we registered a foreign exchange loss of Ps. 317 million as compared to Ps. 281 million during the same
period of the previous year as our net cash exposure in U.S. dollars was negatively impacted by the appreciation of the Mexican Peso and
other operating currencies as compared to the previous quarter.
These effects were partially offset
by a (i) higher gain in financial instruments of Ps. 90 million as compared to a gain of Ps. 72 million during the previous year, driven
mainly by a decrease in interest rates in Brazil; and (ii) a lower interest expense related to the maturity of a Mexican Peso denominated
bond.
Income
tax as a percentage of income before taxes was 33.8% as compared to 7.7%. This increase was driven mainly by deferred taxes
recognized during the same period of the previous year that resulted in a lower effective tax rate in the fourth quarter of 2022.
Net
income attributable to equity holders of the company was Ps. 5,392 million as compared to Ps. 7,144 million during the same
period of the previous year. This decrease was driven mainly by the normalization of our effective tax rate as compared to the same period
of the previous year, coupled with an increase in our comprehensive financing result. Earnings per share1 were Ps. 0.32 (Earnings
per unit were Ps. 2.57 and per ADS were Ps. 25.67.). Normalizing the base effect of a lower effective tax rate during the same period
of the previous year, net income attributable to equity holders of the company increased 8.6%.
| (1) | Quarterly earnings / outstanding shares. Earnings per share (EPS) were calculated using 16,806.7 million
shares outstanding. For the convenience of the reader, as a KOFUBL Unit is comprised of 8 shares (3 Series B shares and 5 Series L shares),
earnings per unit are equal to EPS multiplied by 8. Each ADS represents 10 KOFUBL Units. |
| | |
Coca-Cola FEMSA Reports 4Q23 Results February 22, 2024 | Page 5 of 17 |
CONSOLIDATED
FULL YEAR RESULTS

| CONSOLIDATED FULL YEAR RESULTS |
| |
|
|
|
|
|
|
| |
|
As Reported |
|
Comparable (1) |
| Expressed in millions of Mexican pesos |
|
FY 2023 |
FY 2022 |
Δ% |
|
Δ% |
| Total revenues |
|
245,088 |
226,740 |
8.1% |
|
18.0% |
| Gross profit |
|
110,860 |
100,300 |
10.5% |
|
20.5% |
| Operating income |
|
34,180 |
30,838 |
10.8% |
|
19.4% |
| Adj. EBITDA (2) |
|
46,418 |
43,001 |
7.9% |
|
17.6% |
Volume
increased 7.8% to 4,047.8 million unit cases, driven by volume growth in all of our territories, including a strong performance in Mexico,
Brazil, Colombia and Guatemala. Excluding the acquisition of the Cristal bulk water business in Mexico, total volume would have increased
6.1%.
Total revenues
increased 8.1% to Ps. 245,088 million driven by volume growth, revenue management initiatives, and favorable mix effects. These
factors were partially offset by unfavorable currency translation effects from most of our operating currencies into Mexican Pesos. Excluding
currency translation effects, total revenues increased 18.0%.
Gross profit
increased 10.5% to Ps. 110,860 million, and gross margin increased 100 basis points to 45.2%. This gross profit increase was
driven mainly by our top-line growth, easing packaging costs, and favorable raw material hedging initiatives. These effects were partially
offset by higher sweetener costs across our territories. Excluding currency translation effects, gross profit increased 20.5%.
Operating
income increased 10.8% to Ps. 34,180 million, and operating margin increased 30 basis points to 13.9%. This growth was driven
mainly by a solid top-line performance and an operating foreign exchange gain in Mexico as a result of the appreciation of the Mexican
Peso. These effects were partially offset by an increase in raw material costs, mainly sweeteners, coupled with an increase in operating
expenses such as labor, marketing, and maintenance. Excluding currency translation effects, operating income increased 19.4%.
| (1) | Please refer to page 10 for our definition of “comparable” and a description of the factors
affecting the comparability of our financial and operating performance. |
| (2) | Adjusted EBITDA = operating income + depreciation + amortization & other operating non-cash charges.
|
| | |
Coca-Cola FEMSA Reports 4Q23 Results February 22, 2024 | Page 6 of 17 |
Comprehensive
financing result recorded an expense of Ps. 4,697 million, compared to an expense of Ps. 4,549 million in the previous year.
This increase was driven mainly by a higher foreign exchange loss of Ps. 1,046 million as compared to a loss of Ps. 324 million during
the same period of the previous year, as our net cash exposure in U.S. dollars was negatively impacted by the appreciation of the Mexican
Peso. In addition, we recorded a gain in monetary position in inflationary subsidiaries of Ps. 93 million as compared to a gain of Ps.
536 million during the same period of the previous year.
These effects were partially offset
by a gain in financial instruments of Ps. 169 million as compared to a loss of Ps. 672 million during the same period of the previous
year. This was driven mainly by a market value loss recorded during the first quarter of 2022, partially offset by a market value gain
recognized during the second quarter of 2022. In accordance with IFRS 9, as of the second quarter of 2022, we are recognizing the hedging
gain or loss on the debt instrument that is being hedged using interest rate derivatives.
In addition, we recorded a decrease
in our interest expense, net of 4.3% mainly as a result of a gain in our interest income that was driven by an increase in interest rates.
Income
tax as a percentage of income before taxes was 30.5% as compared to 25.4%. This increase was driven mainly by deferred taxes
recognized during the same period of the previous year that resulted in a lower effective tax rate.
Net
income attributable to equity holders of the company increased 2.6% to reach Ps. 19,536 million as compared to Ps. 19,034 million
during the same period of the previous year. This increase was driven mainly by operating income growth, partially offset by an increase
in income tax. Earnings per share1 were Ps. 1.16 (Earnings per unit were Ps. 9.30 and per ADS were Ps. 92.99.).
| (1) | Quarterly earnings / outstanding shares. Earnings per share (EPS) were calculated using 16,806.7 million
shares outstanding. For the convenience of the reader, as a KOFUBL Unit is comprised of 8 shares (3 Series B shares and 5 Series L shares),
earnings per unit are equal to EPS multiplied by 8. Each ADS represents 10 KOFUBL Units. |
| | |
Coca-Cola FEMSA Reports 4Q23 Results February 22, 2024 | Page 7 of 17 |
MEXICO
& CENTRAL AMERICA DIVISION fourth QUARTER RESULTS
(Mexico, Guatemala, Costa Rica, Panama,
and Nicaragua)

| MEXICO & CENTRAL AMERICA DIVISION RESULTS |
| |
|
|
|
|
|
|
| |
|
As Reported |
|
Comparable (1) |
| Expressed in millions of Mexican pesos |
|
4Q 2023 |
4Q 2022 |
Δ% |
|
Δ% |
| Total revenues |
|
37,622 |
33,792 |
11.3% |
|
13.1% |
| Gross profit |
|
18,422 |
15,678 |
17.5% |
|
19.4% |
| Operating income |
|
5,618 |
5,212 |
7.8% |
|
10.0% |
| Adj. EBITDA (2) |
|
7,704 |
6,902 |
11.6% |
|
13.7% |
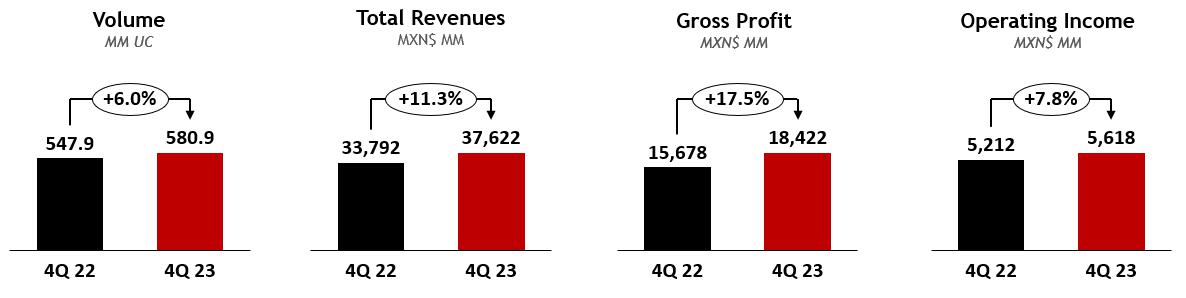
Volume
increased 6.0% driven mainly by solid growth in Mexico and Guatemala. These volumes include the integration of the Cristal bulk water
business; excluding this effect, volume would have increased 4.2% in the division and 3.1% in Mexico.
Total
revenues increased 11.3% to Ps. 37,622 million, driven mainly by volume growth and revenue management initiatives, partially
offset by unfavorable currency translation effects from most of our operating currencies in Central America. Excluding currency translation
effects, total revenues increased 13.1%.
Gross
profit increased 17.5% to Ps. 18,422 million, and gross margin expanded 260 basis points to 49.0%. This margin expansion was
driven mainly by our top-line growth, easing packaging costs, and the appreciation of the Mexican Peso as applied to our U.S. dollar-denominated
raw material costs. These effects were partially offset by an increase in sweeteners costs. Excluding currency translation effects, gross
profit increased 19.4%.
Operating
income increased 7.8% to Ps. 5,618 million, and operating margin contracted 50 basis points to 14.9%, driven mainly by an increase
in operating expenses such as labor, maintenance, and marketing. In addition, the Company incurred temporary expenses mostly related to
the shipment of finished product to Acapulco as a result of hurricane Otis. This impact was mostly limited to the fourth quarter, as our
production facility in Guerrero is now operating normally. These effects were partially offset by our top-line and gross profit growth.
Excluding currency translation effects, operating income increased 10.0%.
| (1) | Please refer to page 10 for our definition of “comparable” and a description of the factors
affecting the comparability of our financial and operating performance. |
| (2) | Adjusted EBITDA
= operating income + depreciation + amortization & other operating non-cash charges. |
| | |
Coca-Cola FEMSA Reports 4Q23 Results February 22, 2024 | Page 9 of 17 |
SOUTH
AMERICA DIVISION FOURTH QUARTER RESULTS
(Brazil, Argentina, Colombia, and
Uruguay)


| SOUTH AMERICA DIVISION RESULTS |
| |
|
|
|
|
|
|
| |
|
As Reported |
|
Comparable (1) |
| Expressed in millions of Mexican pesos |
|
4Q 2023 |
4Q 2022 |
Δ% |
|
Δ% |
| Total revenues |
|
28,456 |
27,417 |
3.8% |
|
19.5% |
| Gross profit |
|
12,054 |
11,390 |
5.8% |
|
24.3% |
| Operating income |
|
4,056 |
3,801 |
6.7% |
|
23.6% |
| Adj. EBITDA (2) |
|
5,444 |
5,052 |
7.8% |
|
28.3% |
Volume
increased 6.2%, driven by growth in Brazil and Colombia, partially offset by a slight decrease in Argentina and Uruguay.
Total
revenues increased 3.8% to Ps. 28,456 million. This increase was driven mainly by volume growth, offset by unfavorable currency
translation effects of most of our operating currencies in the division into Mexican Pesos. Excluding currency translation effects, total
revenues increased 19.5%.
Gross
profit increased 5.8% to Ps. 12,054 million, and gross margin expanded 90 basis points to 42.4%. This increase was driven mainly
by our top-line growth, easing packaging costs, and the appreciation of most of our operating currencies as compared to the U.S. dollar.
These effects were partially offset by increases in sweeteners and the depreciation of the Argentine Peso as applied to our U.S. dollar-denominated
raw material costs. Excluding currency translation effects, gross profit increased 24.3%.
Operating
income increased 6.7% to Ps. 4,056 million, resulting in an operating margin expansion of 40 basis points to 14.3%. This increase
was driven mainly by operating expense efficiencies. This effect was partially offset by higher labor and freight expenses. Excluding
currency translation effects, operating income increased 23.6%.
| (1) | Please refer to page 10 for our definition of “comparable” and a description of the factors
affecting the comparability of our financial and operating performance. |
| (2) | Adjusted EBITDA = operating income + depreciation + amortization & other operating non-cash charges. |
| | |
Coca-Cola FEMSA Reports 4Q23 Results February 22, 2024 | Page 10 of 17 |
DEFINITIONS
Volume
is expressed in unit cases. Unit case refers to 192 ounces of finished beverage product (24 eight-ounce servings) and, when applied to
soda fountains, refers to the volume of syrup, powders, and concentrate that is required to produce 192 ounces of finished beverage product.
Transactions
refers to the number of single units (e.g., a can or a bottle) sold, regardless of their size or volume or whether they are sold individually
or in multipacks, except for soda fountains, which represent multiple transactions based on a standard 12 oz. serving.
Operating
income is a non-GAAP financial measure computed as “gross profit – operating expenses – other operating expenses,
net + operative equity method (gain) loss in associates.”
Adjusted
EBITDA is a non-GAAP financial measure computed as “operating income + depreciation + amortization & other operating
non-cash charges.”
Earnings
per share are equal to “quarterly earnings / outstanding shares.” Earnings per share (EPS) for all periods are
adjusted to give effect to the stock split resulting in 16,806,658,096 shares outstanding. For the convenience of the reader, as a KOFUBL
Unit is comprised of 8 shares (3 Series B shares and 5 Series L shares), earnings per unit are equal to EPS multiplied by 8. Each ADS
represents 10 KOFUBL Units.
COMPARABILITY
Our “comparable” term
means, with respect to a year-over-year comparison, the change of a given measure excluding the effects of: (i) mergers, acquisitions,
and divestitures, in this case the acquisition of CVI in Brazil, integrated as of February 2022; and (ii) translation effects resulting
from exchange rate movements. In preparing this measure, management has used its best judgment, estimates, and assumptions in order to
maintain comparability.
| | |
Coca-Cola FEMSA Reports 4Q23 Results February 22, 2024 | Page 11 of 17 |
ABOUT
THE COMPANY
Stock listing information: Mexican
Stock Exchange, Ticker: KOFUBL | NYSE (ADS), Ticker: KOF | Ratio of KOFUBL to KOF = 10:1
Coca-Cola
FEMSA files reports, including annual reports and other information, with the U.S. Securities and Exchange Commission, or the “SEC,”
and the Mexican Stock Exchange (Bolsa Mexicana de Valores, or the “BMV”) pursuant to the rules and regulations of the SEC
(that apply to foreign private issuers) and of the BMV. Filings we make electronically with the SEC and the BMV are available to the public
on the Internet at the SEC’s website at www.sec.gov, the BMV’s website at www.bmv.com.mx, and
our website at www.coca-colafemsa.com.
Coca-Cola
FEMSA, S.A.B. de C.V. is the largest Coca-Cola franchise bottler in the world by sales volume. The Company produces and distributes trademark
beverages of The Coca-Cola Company, offering a wide portfolio of 131 brands to a population of more than 266 million. With over 80 thousand
employees, the Company markets and sells approximately 3.5 billion unit cases through 2 million points of sale a year. Operating 49 manufacturing
plants and 260 distribution centers, Coca-Cola FEMSA is committed to generating economic, social, and environmental value for all of its
stakeholders across the value chain. The Company is a member of the Dow Jones Sustainability Emerging Markets Index, Dow Jones Sustainability
MILA Pacific Alliance Index, FTSE4Good Emerging Index, and the Mexican Stock Exchange’s IPC and Social Responsibility and Sustainability
Indices, among others. Its operations encompass franchise territories in Mexico, Brazil, Guatemala, Colombia, and Argentina, and, nationwide,
in Costa Rica, Nicaragua, Panama, Uruguay, and Venezuela through its investment in KOF Venezuela. For further information, please visit
www.coca-colafemsa.com.

ADDITIONAL
INFORMATION
All of the financial information
presented in this report was prepared under International Financial Reporting Standards (IFRS).
This news release may contain
forward-looking statements concerning Coca-Cola FEMSA’s future performance, which should be considered as good faith estimates by
Coca-Cola FEMSA. These forward-looking statements reflect management’s expectations and are based upon currently available data.
Actual results are subject to future events and uncertainties, many of which are outside Coca-Cola FEMSA’s control, which could
materially impact the Company’s actual performance. References herein to “US$” are to United States dollars. This news
release contains translations of certain Mexican peso amounts into U.S. dollars for the convenience of the reader. These translations
should not be construed as representations that Mexican peso amounts actually represent such U.S. dollar amounts or could be converted
into U.S. dollars at the rate indicated.
(6 pages of tables to follow)
| | |
Coca-Cola FEMSA Reports 4Q23 Results February 22, 2024 | Page 12 of 17 |
| COCA-COLA FEMSA |
| CONSOLIDATED INCOME STATEMENT |
| Millions of Pesos (1) |
| |
|
|
|
|
|
|
|
|
|
|
|
|
|
|
| |
|
For the Fourth Quarter of: |
|
For Full Year: |
| |
|
2023 |
% of Rev. |
2022 |
% of Rev. |
Δ% Reported |
Δ% Comparable (7) |
|
2023 |
% of Rev. |
2022 |
% of Rev. |
Δ% Reported |
Δ% Comparable (7) |
| Transactions (million transactions) |
|
6,194.6 |
|
5,987.7 |
|
3.5% |
3.5% |
|
23,743.2 |
|
22,315.1 |
|
6.4% |
6.3% |
| Volume (million unit cases) |
|
1,056.2 |
|
995.3 |
|
6.1% |
6.1% |
|
4,047.8 |
|
3,755.2 |
|
7.8% |
7.7% |
| Average price per unit case |
|
60.24 |
|
59.54 |
|
1.2% |
|
|
58.54 |
|
58.75 |
|
-0.4% |
|
| Net revenues |
|
65,830 |
|
61,005 |
|
7.9% |
|
|
244,264 |
|
226,222 |
|
8.0% |
|
| Other operating revenues |
|
248 |
|
204 |
|
21.7% |
|
|
824 |
|
518 |
|
59.0% |
|
| Total revenues (2) |
|
66,078 |
100.0% |
61,209 |
100.0% |
8.0% |
15.7% |
|
245,088 |
100.0% |
226,740 |
100.0% |
8.1% |
18.0% |
| Cost of goods sold |
|
35,603 |
53.9% |
34,142 |
55.8% |
4.3% |
|
|
134,228 |
54.8% |
126,441 |
55.8% |
6.2% |
|
| Gross profit |
|
30,475 |
46.1% |
27,068 |
44.2% |
12.6% |
21.3% |
|
110,860 |
45.2% |
100,300 |
44.2% |
10.5% |
20.5% |
| Operating expenses |
|
20,413 |
30.9% |
17,868 |
29.2% |
14.2% |
|
|
76,098 |
31.0% |
68,981 |
30.4% |
10.3% |
|
| Other operative expenses, net |
|
433 |
0.7% |
226 |
0.4% |
91.6% |
|
|
813 |
0.3% |
673 |
0.3% |
20.8% |
|
| Operative equity method (gain) loss in associates(3) |
|
(45) |
-0.1% |
(40) |
-0.1% |
13.8% |
|
|
(232) |
-0.1% |
(192) |
-0.1% |
20.7% |
|
| Operating income (5) |
|
9,674 |
14.6% |
9,013 |
14.7% |
7.3% |
15.3% |
|
34,180 |
13.9% |
30,838 |
13.6% |
10.8% |
19.4% |
| Other non operative expenses, net |
|
50 |
0.1% |
(34) |
-0.1% |
NA |
|
|
459 |
0.2% |
310 |
0.1% |
48.2% |
|
| Non Operative equity method (gain) loss in associates (4) |
|
(132) |
-0.2% |
(52) |
-0.1% |
151.8% |
|
|
17 |
0.0% |
(194) |
-0.1% |
NA |
|
| Interest expense |
|
1,791 |
|
1,833 |
|
-2.3% |
|
|
7,102 |
|
6,500 |
|
9.3% |
|
| Interest income |
|
730 |
|
821 |
|
-11.2% |
|
|
3,188 |
|
2,411 |
|
32.2% |
|
| Interest expense, net |
|
1,062 |
|
1,012 |
|
4.9% |
|
|
3,914 |
|
4,089 |
|
-4.3% |
|
| Foreign exchange loss (gain) |
|
317 |
|
281 |
|
13.0% |
|
|
1,046 |
|
324 |
|
222.9% |
|
| Loss (gain) on monetary position in inflationary subsidiaries |
|
(4) |
|
(128) |
|
-97.1% |
|
|
(93) |
|
(536) |
|
-82.6% |
|
| Market value (gain) loss on financial instruments |
|
(90) |
|
(72) |
|
24.5% |
|
|
(169) |
|
672 |
|
NA |
|
| Comprehensive financing result |
|
1,285 |
|
1,092 |
|
17.7% |
|
|
4,697 |
|
4,549 |
|
3.3% |
|
| Income before taxes |
|
8,470 |
|
8,008 |
|
5.8% |
|
|
29,007 |
|
26,173 |
|
10.8% |
|
| Income taxes |
|
2,802 |
|
611 |
|
358.3% |
|
|
8,781 |
|
6,547 |
|
34.1% |
|
| Result of discontinued operations |
|
- |
|
- |
|
NA |
|
|
- |
|
- |
|
NA |
|
| Consolidated net income |
|
5,669 |
|
7,396 |
|
-23.4% |
|
|
20,226 |
|
19,626 |
|
3.1% |
|
| Net income attributable to equity holders of the company |
|
5,392 |
8.2% |
7,144 |
11.7% |
-24.5% |
-18.7% |
|
19,536 |
8.0% |
19,034 |
8.4% |
2.6% |
12.2% |
| Non-controlling interest |
|
277 |
0.4% |
253 |
0.4% |
9.5% |
|
|
690 |
0.3% |
592 |
0.3% |
16.7% |
|
| |
|
|
|
|
|
|
|
|
|
|
|
|
|
|
| Adj. EBITDA & CAPEX |
|
2023 |
% of Rev. |
2022 |
% of Rev. |
Δ% Reported |
Δ% Comparable (7) |
|
2023 |
% of Rev. |
2022 |
% of Rev. |
Δ% Reported |
Δ% Comparable (7) |
| Operating income (5) |
|
9,674 |
14.6% |
9,013 |
14.7% |
7.3% |
15.3% |
|
34,180 |
13.9% |
30,838 |
13.6% |
10.8% |
19.4% |
| Depreciation |
|
2,632 |
|
2,397 |
|
9.8% |
|
|
9,695 |
|
9,657 |
|
0.4% |
|
| Amortization and other operative non-cash charges |
|
843 |
|
544 |
|
54.8% |
|
|
2,542 |
|
2,506 |
|
1.5% |
|
| Adj. EBITDA (5)(6) |
|
13,149 |
19.9% |
11,954 |
19.5% |
10.0% |
19.3% |
|
46,418 |
18.9% |
43,001 |
19.0% |
7.9% |
17.6% |
| CAPEX(8) |
|
9,837 |
|
8,489 |
|
15.9% |
|
|
21,396 |
|
19,665 |
|
8.8% |
|
(1)
Except volume and average price per unit case figures.
(2)
Please refer to page 15 for revenue breakdown.
(3)
Includes equity method in Jugos del Valle, among others.
(4)
Includes equity method in PIASA, IEQSA, Beta San Miguel, IMER, and KSP Participacoes, among others.
(5)
The operating income and Adjusted EBITDA lines are presented as non-GAAP measures for the convenience of the reader.
(6)
Adjusted EBITDA = operating income + depreciation, amortization & other operating non-cash charges.
(7)
Please refer to page 10 for our definition of “comparable” and a description of the factors affecting the comparability
of our financial and operating performance.
(8)
As of December 31, 2023, the investment in fixed assets effectively paid is equivalent to Ps. 20,453 million.
| | |
Coca-Cola FEMSA Reports 4Q23 Results February 22, 2024 | Page 13 of 17 |
| MEXICO & CENTRAL AMERICA DIVISION |
| RESULTS OF OPERATIONS |
| Millions of Pesos (1) |
| |
|
|
|
|
|
|
|
|
|
|
|
|
|
|
| |
|
For the Fourth Quarter of: |
|
For Full Year: |
| |
|
2023 |
% of Rev. |
2022 |
% of Rev. |
Δ% Reported |
Δ% Comparable (6) |
|
2023 |
% of Rev. |
2022 |
% of Rev. |
Δ% Reported |
Δ% Comparable (6) |
| Transactions (million transactions) |
|
2,981.7 |
|
2,921.2 |
|
2.1% |
2.1% |
|
12,344.9 |
|
11,633.2 |
|
6.1% |
6.1% |
| Volume (million unit cases) |
|
580.9 |
|
547.9 |
|
6.0% |
6.0% |
|
2,394.8 |
|
2,188.4 |
|
9.4% |
9.4% |
| Average price per unit case |
|
64.28 |
|
61.69 |
|
4.2% |
|
|
62.07 |
|
59.85 |
|
3.7% |
|
| Net revenues |
|
37,603 |
|
33,797 |
|
|
|
|
149,320 |
|
130,981 |
|
|
|
| Other operating revenues |
|
19 |
|
(5) |
|
|
|
|
42 |
|
21 |
|
|
|
| Total Revenues (2) |
|
37,622 |
100.0% |
33,792 |
100.0% |
11.3% |
13.1% |
|
149,362 |
100.0% |
131,002 |
100.0% |
14.0% |
16.0% |
| Cost of goods sold |
|
19,200 |
51.0% |
18,114 |
53.6% |
|
|
|
77,698 |
52.0% |
68,967 |
52.6% |
|
|
| Gross profit |
|
18,422 |
49.0% |
15,678 |
46.4% |
17.5% |
19.4% |
|
71,665 |
48.0% |
62,035 |
47.4% |
15.5% |
17.5% |
| Operating expenses |
|
12,663 |
33.7% |
10,451 |
30.9% |
|
|
|
48,343 |
0.3 |
40,829 |
0.3 |
|
|
| Other operative expenses, net |
|
150 |
0.4% |
39 |
0.1% |
|
|
|
281 |
0.2% |
394 |
0.3% |
|
|
| Operative equity method (gain) loss in associates (3) |
|
(9) |
0.0% |
(25) |
-0.1% |
|
|
|
(130) |
-0.1% |
(136) |
-0.1% |
|
|
| Operating income (4) |
|
5,618 |
14.9% |
5,212 |
15.4% |
7.8% |
10.0% |
|
23,170 |
15.5% |
20,948 |
16.0% |
10.6% |
12.6% |
| Depreciation, amortization & other operating non-cash charges |
|
2,086 |
5.5% |
1,690 |
5.0% |
|
|
|
7,652 |
5.1% |
7,380 |
5.6% |
|
|
| Adj. EBITDA (4)(5) |
|
7,704 |
20.5% |
6,902 |
20.4% |
11.6% |
13.7% |
|
30,822 |
20.6% |
28,329 |
21.6% |
8.8% |
10.7% |
| (1) | | Except volume and average price per unit case figures. |
| (2) | | Please refer to page 15 & 16 for revenue breakdown. |
| (3) | | Includes equity method in Jugos del Valle, among others. |
| (4) | | The operating income and Adjusted EBITDA lines are presented as non-GAAP measures for
the convenience of the reader. |
| (5) | | Adjusted EBITDA = operating income + depreciation, amortization & other operating
non-cash charges. |
| (6) | | Please refer to page 10 for our definition of “comparable” and a description
of the factors affecting the comparability of our financial and operating performance. |
| SOUTH AMERICA DIVISION |
| RESULTS OF OPERATIONS |
| Millions of Pesos (1) |
| |
|
|
|
|
|
|
|
|
|
|
|
|
|
|
| |
|
For the Fourth Quarter of: |
|
For Full Year: |
| |
|
2023 |
% of Rev. |
2022 |
% of Rev. |
Δ% Reported |
Δ% Comparable (6) |
|
2023 |
% of Rev. |
2022 |
% of Rev. |
Δ% Reported |
Δ% Comparable (6) |
| Transactions (million transactions) |
|
3,212.9 |
|
3,066.5 |
|
4.8% |
4.8% |
|
11,398.3 |
|
10,681.9 |
|
6.7% |
6.5% |
| Volume (million unit cases) |
|
475.3 |
|
447.4 |
|
6.2% |
6.2% |
|
1,653.1 |
|
1,566.8 |
|
5.5% |
5.3% |
| Average price per unit case |
|
55.32 |
|
56.91 |
|
-2.8% |
|
|
53.43 |
|
57.21 |
|
-6.6% |
|
| Net revenues |
|
28,227 |
|
27,208 |
|
|
|
|
94,944 |
|
95,241 |
|
|
|
| Other operating revenues |
|
229 |
|
209 |
|
|
|
|
782 |
|
497 |
|
|
|
| Total Revenues (2) |
|
28,456 |
100.0% |
27,417 |
100.0% |
3.8% |
19.5% |
|
95,726 |
100.0% |
95,738 |
100.0% |
0.0% |
21.3% |
| Cost of goods sold |
|
16,403 |
57.6% |
16,027 |
58.5% |
|
|
|
56,531 |
59.1% |
57,473 |
60.0% |
|
|
| Gross profit |
|
12,054 |
42.4% |
11,390 |
41.5% |
5.8% |
24.3% |
|
39,195 |
40.9% |
38,265 |
40.0% |
2.4% |
26.5% |
| Operating expenses |
|
7,750 |
27.2% |
7,417 |
27.1% |
|
|
|
27,755 |
29.0% |
28,152 |
29.4% |
|
|
| Other operative expenses, net |
|
284 |
1.0% |
187 |
0.7% |
|
|
|
531 |
0.6% |
279 |
0.3% |
|
|
| Operative equity method (gain) loss in associates (3) |
|
(36) |
-0.1% |
(15) |
-0.1% |
|
|
|
(102) |
-0.1% |
(55) |
-0.1% |
|
|
| Operating income (4) |
|
4,056 |
14.3% |
3,801 |
13.9% |
6.7% |
23.6% |
|
11,011 |
11.5% |
9,890 |
10.3% |
11.3% |
36.7% |
| Depreciation, amortization & other operating non-cash charges |
|
1,389 |
4.9% |
1,251 |
4.6% |
|
|
|
4,585 |
4.8% |
4,782 |
5.0% |
|
|
| Adj. EBITDA (4)(5) |
|
5,444 |
19.1% |
5,052 |
18.4% |
7.8% |
28.3% |
|
15,596 |
16.3% |
14,672 |
15.3% |
6.3% |
34.2% |
| (1) | Except volume and average price per unit case figures. |
| (2) | Please refer to page 15 & 16 for revenue breakdown. |
| (3) | Includes equity method in Leão Alimentos, among others. |
| (4) | The operating income and Adjusted EBITDA lines are presented as non-GAAP
measures for the convenience of the reader. |
| (5) | Adjusted EBITDA = operating income + depreciation, amortization &
other operating non-cash charges. |
| (6) | Please refer to page 10 for our definition of “comparable”
and a description of the factors affecting the comparability of our financial and operating performance. |
| | |
Coca-Cola FEMSA Reports 4Q23 Results February 22, 2024 | Page 14 of 17 |
| COCA-COLA FEMSA |
| CONSOLIDATED BALANCE SHEET |
| Millions of Pesos |
| |
|
|
|
|
|
|
|
|
|
|
| Assets |
|
Dec-23 |
Dec-22 |
% Var. |
|
Liabilities & Equity |
|
Dec-23 |
Dec-22 |
% Var. |
| Current Assets |
|
|
|
|
|
Current Liabilities |
|
|
|
|
| Cash, cash equivalents and marketable securities |
|
|
|
|
|
Short-term bank loans and notes payable |
|
140 |
8,524 |
-98% |
| |
31,060 |
40,277 |
-23% |
|
Suppliers |
|
27,352 |
26,834 |
2% |
| Total accounts receivable |
|
17,750 |
16,318 |
9% |
|
Short-term leasing Liabilities |
|
752 |
472 |
59% |
| Inventories |
|
11,880 |
11,888 |
0% |
|
Other current liabilities |
|
26,623 |
22,129 |
20% |
| Other current assets |
|
7,105 |
10,729 |
-34% |
|
Total current liabilities |
|
54,867 |
57,959 |
-5% |
| Total current assets |
|
67,794 |
79,211 |
-14% |
|
Non-Current Liabilities |
|
|
|
|
| Non-Current Assets |
|
|
|
|
|
Long-term bank loans and notes payable |
|
65,074 |
70,146 |
-7% |
| Property, plant and equipment |
|
133,406 |
125,293 |
6% |
|
Long Term Leasing Liabilities |
|
1,769 |
1,663 |
6% |
| Accumulated depreciation |
|
(54,676) |
(54,088) |
1% |
|
Other long-term liabilities |
|
18,056 |
16,351 |
10% |
| Total property, plant and equipment, net |
|
78,730 |
71,205 |
11% |
|
Total liabilities |
|
139,766 |
146,119 |
-4% |
| Right of use assets |
|
2,387 |
2,069 |
15% |
|
Equity |
|
|
|
|
| Investment in shares |
|
9,246 |
8,452 |
9% |
|
Non-controlling interest |
|
6,680 |
6,491 |
3% |
| Intangible assets and other assets |
|
101,162 |
103,122 |
-2% |
|
Total controlling interest |
|
127,025 |
125,384 |
1% |
| Other non-current assets |
|
14,150 |
13,936 |
2% |
|
Total equity |
|
133,705 |
131,876 |
1% |
| Total Assets |
|
273,471 |
277,995 |
-2% |
|
Total Liabilities and Equity |
|
273,471 |
277,995 |
-2% |
| |
|
|
|
|
|
|
|
|
|
|
| |
|
|
|
|
|
|
|
|
|
|
| |
|
December 31, 2023 |
|
|
|
|
|
|
| Debt Mix |
|
% Total Debt (1) |
% Interest Rate Floating (1) (2) |
Average Rate |
|
Debt Maturity Profile |
| Currency |
|
|
|
|
|
 |
| Mexican Pesos |
|
61.4% |
6.9% |
8.8% |
|
| U.S. Dollars |
|
15.9% |
37.4% |
4.6% |
|
| Colombian Pesos |
|
1.3% |
0.0% |
6.3% |
|
| Brazilian Reals |
|
21.3% |
24.8% |
9.6% |
|
| Argentine Pesos |
|
0.1% |
0.0% |
130.0% |
|
| Total Debt |
|
100% |
21.9% |
8.4% |
|
| |
|
|
|
|
|
|
|
|
|
|
| (1) After giving effect to cross- currency swaps. |
| (2) Calculated by weighting each year´s outstanding debt balance mix. |
| |
|
|
|
|
|
|
|
|
|
|
| |
|
|
|
|
|
|
|
|
|
|
| Financial Ratios |
|
FY 2023 |
FY 2022 |
Δ% |
|
|
|
|
|
|
| Net debt including effect of hedges (1)(3) |
|
37,794 |
38,104 |
-0.8% |
|
|
|
|
|
|
| Net debt including effect of hedges / Adj.EBITDA (1)(3) |
|
0.81 |
0.89 |
|
|
|
|
|
|
|
| Adj. EBITDA/ Interest expense, net (1) |
|
11.86 |
10.34 |
|
|
|
|
|
|
|
| Capitalization (2) |
|
32.8% |
38.9% |
|
|
|
|
|
|
|
| (1) Net debt = total debt - cash |
| (2) Total debt / (total debt + shareholders' equity) |
| (3) After giving effect to cross-currency swaps. |
| | |
Coca-Cola FEMSA Reports 4Q23 Results February 22, 2024 | Page 15 of 17 |
| COCA-COLA FEMSA |
| QUARTERLY- VOLUME, TRANSACTIONS & REVENUES |
| |
|
|
|
|
|
|
|
|
|
|
|
|
|
|
| Volume |
| |
|
4Q 2023 |
|
4Q 2022 |
|
YoY |
| |
|
Sparkling |
Water (1) |
Bulk (2) |
Stills |
Total |
|
Sparkling |
Water (1) |
Bulk (2) |
Stills |
Total |
|
Δ % |
| Mexico (3) |
|
346.1 |
26.4 |
85.8 |
35.1 |
493.4 |
|
335.3 |
25.0 |
74.8 |
33.6 |
468.7 |
|
5.3% |
| Guatemala |
|
40.5 |
2.0 |
- |
2.0 |
44.4 |
|
36.0 |
1.1 |
- |
2.1 |
39.2 |
|
13.2% |
| CAM South |
|
35.5 |
1.3 |
0.9 |
5.4 |
43.1 |
|
32.6 |
1.7 |
0.1 |
5.4 |
39.9 |
|
7.9% |
| Mexico and Central America |
|
422.1 |
29.7 |
86.7 |
42.5 |
580.9 |
|
404.0 |
27.8 |
75.0 |
41.1 |
547.9 |
|
6.0% |
| Colombia |
|
70.9 |
10.2 |
3.5 |
7.4 |
91.9 |
|
66.0 |
9.0 |
3.4 |
6.9 |
85.4 |
|
7.6% |
| Brazil (4) |
|
266.4 |
22.4 |
3.2 |
26.0 |
318.0 |
|
250.0 |
20.3 |
2.8 |
22.7 |
295.8 |
|
7.5% |
| Argentina |
|
37.8 |
6.6 |
1.9 |
4.8 |
51.1 |
|
41.1 |
5.0 |
1.1 |
4.3 |
51.6 |
|
-1.0% |
| Uruguay |
|
12.0 |
1.7 |
- |
0.8 |
14.4 |
|
12.4 |
1.8 |
- |
0.6 |
14.7 |
|
-2.1% |
| South America |
|
387.0 |
40.8 |
8.5 |
39.0 |
475.3 |
|
369.5 |
36.1 |
7.4 |
34.5 |
447.4 |
|
6.2% |
| TOTAL |
|
809.1 |
70.5 |
95.2 |
81.5 |
1,056.2 |
|
773.5 |
63.9 |
82.3 |
75.6 |
995.3 |
|
6.1% |
| |
|
|
|
|
|
|
|
|
|
|
|
|
|
|
| (1) Excludes water presentations larger than 5.0 Lt ; includes flavored water. |
| (2) Bulk Water = Still bottled water in 5.0, 19.0 and 20.0 - liter packaging presentations; includes flavored water |
| (3) Includes 10.1 million unit cases corresponding to the acquisition of Cristal from Embotelladoras Bepensa |
| |
|
|
|
|
|
|
|
|
|
|
|
|
|
|
| Transactions |
|
|
|
|
|
|
|
|
|
|
|
|
|
|
| |
|
4Q 2023 |
|
4Q 2022 |
|
YoY |
| |
|
Sparkling |
Water |
Stills |
Total |
|
Sparkling |
Water |
Stills |
Total |
|
Δ % |
| Mexico (3) |
|
1,900.7 |
190.7 |
243.8 |
2,335.2 |
|
1,888.8 |
179.8 |
239.3 |
2,307.8 |
|
1.2% |
| Guatemala |
|
293.4 |
13.1 |
21.7 |
328.2 |
|
271.2 |
10.9 |
20.6 |
302.7 |
|
8.4% |
| CAM South |
|
251.1 |
13.0 |
54.2 |
318.3 |
|
237.6 |
11.6 |
61.4 |
310.6 |
|
2.5% |
| Mexico and Central America |
|
2,445.2 |
216.9 |
319.7 |
2,981.7 |
|
2,397.6 |
202.3 |
321.3 |
2,921.2 |
|
2.1% |
| Colombia |
|
513.5 |
106.6 |
68.2 |
688.2 |
|
481.4 |
94.2 |
70.4 |
645.9 |
|
6.5% |
| Brazil (4) |
|
1,705.0 |
191.3 |
292.1 |
2,188.3 |
|
1,579.3 |
177.6 |
324.5 |
2,081.5 |
|
5.1% |
| Argentina |
|
182.6 |
41.0 |
44.5 |
268.1 |
|
201.9 |
32.0 |
37.0 |
270.8 |
|
-1.0% |
| Uruguay |
|
55.0 |
6.6 |
6.5 |
68.2 |
|
56.0 |
7.0 |
5.2 |
68.2 |
|
-0.1% |
| South America |
|
2,456.1 |
345.5 |
411.2 |
3,212.9 |
|
2,318.6 |
310.8 |
437.1 |
3,066.5 |
|
4.8% |
| TOTAL |
|
4,901.3 |
562.4 |
730.9 |
6,194.6 |
|
4,716.2 |
513.1 |
758.4 |
5,987.7 |
|
3.5% |
| |
|
|
|
|
|
|
|
|
|
|
|
|
|
| Revenues |
|
|
|
|
|
|
|
|
|
|
|
|
|
|
| Expressed in million Mexican Pesos |
|
4Q 2023 |
4Q 2022 |
Δ % |
|
|
|
|
|
|
|
|
|
|
| Mexico |
|
30,709 |
27,388 |
12.1% |
|
|
|
|
|
|
|
|
|
|
| Guatemala |
|
3,353 |
3,130 |
7.1% |
|
|
|
|
|
|
|
|
|
|
| CAM South |
|
3,560 |
3,275 |
8.7% |
|
|
|
|
|
|
|
|
|
|
| Mexico and Central America |
|
37,622 |
33,792 |
11.3% |
|
|
|
|
|
|
|
|
|
|
| Colombia |
|
5,094 |
3,567 |
42.8% |
|
|
|
|
|
|
|
|
|
|
| Brazil (5) |
|
20,125 |
19,293 |
4.3% |
|
|
|
|
|
|
|
|
|
|
| Argentina |
|
1,932 |
3,273 |
-41.0% |
|
|
|
|
|
|
|
|
|
|
| Uruguay |
|
1,305 |
1,283 |
1.7% |
|
|
|
|
|
|
|
|
|
|
| South America |
|
28,456 |
27,417 |
3.8% |
|
|
|
|
|
|
|
|
|
|
| TOTAL |
|
66,078 |
61,209 |
8.0% |
|
|
|
|
|
|
|
|
|
|
| |
|
|
|
|
|
|
|
|
|
|
|
|
|
|
| (4) Volume and transactions in Brazil do not include beer |
| (5) Brazil includes beer revenues of Ps. 1,734.2 million for the fourth quarter of 2023 and Ps.1,742.4 million for the same period of the previous year. |
| (1) | Volume is expressed in unit cases. Unit case refers to 192 ounces of finished
beverage product (24 eight-ounce servings) and, when applied to soda fountains, refers to the volume of syrup, powders, and concentrate
that is required to produce 192 ounces of finished beverage product. |
| (2) | Transactions refers to the number of single units (e.g., a can or a bottle)
sold, regardless of their size or volume or whether they are sold individually or in multipacks, except for soda fountains, which represent
multiple transactions based on a standard 12 oz. serving. |
| | |
Coca-Cola FEMSA Reports 4Q23 Results February 22, 2024 | Page 16 of 17 |
| COCA-COLA FEMSA |
| FY- VOLUME, TRANSACTIONS & REVENUES |
| |
|
|
|
|
|
|
|
|
|
|
|
|
|
|
| Volume |
| |
|
FY 2023 |
|
FY 2022 |
|
YoY |
| |
|
Sparkling |
Water (1) |
Bulk (2) |
Stills |
Total |
|
Sparkling |
Water (1) |
Bulk (2) |
Stills |
Total |
|
Δ % |
| Mexico (3) |
|
1,408.7 |
121.7 |
376.6 |
145.9 |
2,052.9 |
|
1,348.8 |
104.4 |
300.6 |
135.1 |
1,888.9 |
|
8.7% |
| Guatemala |
|
157.6 |
7.7 |
- |
8.9 |
174.2 |
|
133.7 |
4.8 |
- |
8.7 |
147.2 |
|
18.4% |
| CAM South |
|
136.4 |
6.1 |
2.7 |
22.5 |
167.7 |
|
124.2 |
6.5 |
0.7 |
20.9 |
152.3 |
|
10.1% |
| Mexico and Central America |
|
1,702.7 |
135.4 |
379.3 |
177.3 |
2,394.8 |
|
1,606.7 |
115.6 |
301.3 |
164.7 |
2,188.4 |
|
9.4% |
| Colombia |
|
264.7 |
39.2 |
14.0 |
29.6 |
347.6 |
|
254.6 |
34.0 |
12.5 |
29.0 |
330.1 |
|
5.3% |
| Brazil (4) |
|
902.4 |
75.2 |
10.2 |
87.4 |
1,075.1 |
|
854.6 |
66.5 |
10.7 |
84.5 |
1,016.2 |
|
5.8% |
| Argentina |
|
135.1 |
21.0 |
5.8 |
16.8 |
178.7 |
|
139.4 |
16.0 |
3.8 |
14.6 |
173.9 |
|
2.7% |
| Uruguay |
|
40.6 |
8.7 |
- |
2.4 |
51.7 |
|
39.2 |
5.7 |
- |
1.6 |
46.6 |
|
10.9% |
| South America |
|
1,342.7 |
144.2 |
30.0 |
136.1 |
1,653.1 |
|
1,287.8 |
122.2 |
27.1 |
129.7 |
1,566.8 |
|
5.5% |
| TOTAL |
|
3,045.4 |
279.7 |
409.3 |
313.5 |
4,047.8 |
|
2,894.5 |
237.8 |
328.4 |
294.4 |
3,755.2 |
|
7.8% |
| |
|
|
|
|
|
|
|
|
|
|
|
|
|
|
| (1) Excludes water presentations larger than 5.0 Lt ; includes flavored water. |
| (2) Bulk Water = Still bottled water in 5.0, 19.0 and 20.0 - liter packaging presentations; includes flavored water |
| (3) Includes 59.2 million unit cases corresponding to the acquisition of Cristal from Embotelladoras Bepensa |
| |
|
|
|
|
|
|
|
|
|
|
|
|
|
|
| Transactions |
|
|
|
|
|
|
|
|
|
|
|
|
|
|
| |
|
FY 2023 |
|
FY 2022 |
|
YoY |
| |
|
Sparkling |
Water |
Stills |
Total |
|
Sparkling |
Water |
Stills |
Total |
|
Δ % |
| Mexico (3) |
|
7,835.7 |
866.4 |
1,026.9 |
9,729.0 |
|
7,569.8 |
739.5 |
967.1 |
9,276.4 |
|
4.9% |
| Guatemala |
|
1,179.8 |
56.9 |
91.9 |
1,328.5 |
|
1,027.3 |
48.0 |
85.5 |
1,160.8 |
|
14.4% |
| CAM South |
|
996.4 |
53.6 |
237.3 |
1,287.4 |
|
920.5 |
38.8 |
236.7 |
1,196.0 |
|
7.6% |
| Mexico and Central America |
|
10,011.8 |
976.9 |
1,356.2 |
12,344.9 |
|
9,517.6 |
826.3 |
1,289.3 |
11,633.2 |
|
6.1% |
| Colombia |
|
1,942.5 |
411.8 |
302.2 |
2,656.5 |
|
1,834.4 |
361.5 |
307.8 |
2,503.7 |
|
6.1% |
| Brazil (4) |
|
5,887.7 |
655.1 |
981.1 |
7,523.9 |
|
5,478.5 |
581.6 |
954.3 |
7,014.5 |
|
7.3% |
| Argentina |
|
689.8 |
135.2 |
149.3 |
974.4 |
|
713.6 |
103.8 |
122.0 |
939.5 |
|
3.7% |
| Uruguay |
|
190.7 |
32.6 |
20.3 |
243.6 |
|
187.3 |
22.4 |
14.6 |
224.2 |
|
8.6% |
| South America |
|
8,710.7 |
1,234.7 |
1,452.9 |
11,398.3 |
|
8,213.8 |
1,069.3 |
1,398.8 |
10,681.9 |
|
6.7% |
| TOTAL |
|
18,722.5 |
2,211.6 |
2,809.1 |
23,743.2 |
|
17,731.4 |
1,895.6 |
2,688.1 |
22,315.1 |
|
6.4% |
| |
|
|
|
|
|
|
|
|
|
|
|
|
|
| Revenues |
|
|
|
|
|
|
|
|
|
|
|
|
|
|
| Expressed in million Mexican Pesos |
|
FY 2023 |
FY 2022 |
Δ % |
|
|
|
|
|
|
|
|
|
|
| Mexico |
|
122,615 |
106,911 |
14.7% |
|
|
|
|
|
|
|
|
|
|
| Guatemala |
|
13,016 |
12,059 |
7.9% |
|
|
|
|
|
|
|
|
|
|
| CAM South |
|
13,731 |
12,031 |
14.1% |
|
|
|
|
|
|
|
|
|
|
| Mexico and Central America |
|
149,362 |
131,002 |
14.0% |
|
|
|
|
|
|
|
|
|
|
| Colombia |
|
17,680 |
16,800 |
5.2% |
|
|
|
|
|
|
|
|
|
|
| Brazil (5) |
|
66,963 |
63,944 |
4.7% |
|
|
|
|
|
|
|
|
|
|
| Argentina |
|
6,668 |
10,917 |
-38.9% |
|
|
|
|
|
|
|
|
|
|
| Uruguay |
|
4,415 |
4,078 |
8.3% |
|
|
|
|
|
|
|
|
|
|
| South America |
|
95,726 |
95,738 |
0.0% |
|
|
|
|
|
|
|
|
|
|
| TOTAL |
|
245,088 |
226,740 |
8.1% |
|
|
|
|
|
|
|
|
|
|
| |
|
|
|
|
|
|
|
|
|
|
|
|
|
|
| (4) Volume and transactions in Brazil do not include beer |
| (5) Brazil includes beer revenues of Ps. 6,116.7million for the full year of 2023 and Ps. 5,599.9 million for the same period of the previous year. |

| (1) | Volume is expressed in unit cases. Unit case refers to 192 ounces of finished
beverage product (24 eight-ounce servings) and, when applied to soda fountains, refers to the volume of syrup, powders, and concentrate
that is required to produce 192 ounces of finished beverage product. |
| (2) | Transactions refers to the number of single units (e.g., a can or a bottle)
sold, regardless of their size or volume or whether they are sold individually or in multipacks, except for soda fountains, which represent
multiple transactions based on a standard 12 oz. serving. |
| | |
Coca-Cola FEMSA Reports 4Q23 Results February 22, 2024 | Page 17 of 17 |
| COCA-COLA FEMSA |
| MACROECONOMIC INFORMATION |
| |
|
|
|
|
|
|
|
|
| Inflation (1) |
|
|
|
|
|
| |
|
4Q23 |
FY23 |
|
|
|
|
|
| Mexico |
|
1.75% |
4.66% |
|
|
|
|
|
| Colombia |
|
1.36% |
9.28% |
|
|
|
|
|
| Brasil |
|
0.94% |
4.62% |
|
|
|
|
|
| Argentina |
|
60.86% |
211.41% |
|
|
|
|
|
| Costa Rica |
|
0.26% |
-1.77% |
|
|
|
|
|
| Panama |
|
0.00% |
1.92% |
|
|
|
|
|
| Guatemala |
|
1.07% |
4.18% |
|
|
|
|
|
| Nicaragua |
|
1.00% |
5.60% |
|
|
|
|
|
| Uruguay |
|
1.12% |
5.11% |
|
|
|
|
|
| |
|
|
|
|
|
|
|
|
| (1) Source: inflation estimated by the company based on historic publications from the Central Bank of each country. |
| |
|
|
|
|
|
|
|
|
| |
|
|
|
|
|
|
|
|
| Average Exchange Rates for each period (2) |
|
|
|
|
| |
|
Quarterly Exchange Rate (Local Currency per USD) |
|
Year to Date Exchange Rate (Local Currency per USD) |
| |
|
4Q23 |
4Q22 |
Δ % |
|
FY 23 |
FY 22 |
Δ % |
| México |
|
17.58 |
19.70 |
-10.7% |
|
17.77 |
20.13 |
-11.7% |
| Colombia |
|
4,071.19 |
4,808.38 |
-15.3% |
|
4,325.96 |
4,256.19 |
1.6% |
| Brasil |
|
4.95 |
5.26 |
-5.8% |
|
4.99 |
5.16 |
-3.3% |
| Argentina |
|
448.97 |
162.54 |
176.2% |
|
296.61 |
130.72 |
126.9% |
| Costa Rica |
|
534.44 |
614.10 |
-13.0% |
|
547.36 |
650.75 |
-15.9% |
| Panama |
|
1.00 |
1.00 |
-81.0% |
|
1.00 |
1.00 |
-80.6% |
| Guatemala |
|
7.83 |
7.85 |
-0.2% |
|
7.83 |
7.75 |
1.1% |
| Nicaragua |
|
36.58 |
36.14 |
1.2% |
|
36.44 |
35.87 |
1.6% |
| Uruguay |
|
39.53 |
39.97 |
-1.1% |
|
38.82 |
41.17 |
-5.7% |
| |
|
|
|
|
|
|
|
|
| |
|
|
|
|
|
|
|
|
| End-of-period Exchange Rates |
| |
|
Closing Exchange Rate (Local Currency per USD) |
|
Closing Exchange Rate (Local Currency per USD) |
| |
|
Dec-23 |
Dec-22 |
Δ % |
|
Sep-23 |
Sep-22 |
Δ % |
| México |
|
16.89 |
19.36 |
-12.7% |
|
17.62 |
20.31 |
-13.2% |
| Colombia |
|
3,822.05 |
4,810.20 |
-20.5% |
|
4,053.76 |
4,532.07 |
-10.6% |
| Brasil |
|
4.84 |
5.22 |
-7.2% |
|
5.01 |
5.41 |
-7.4% |
| Argentina |
|
808.45 |
177.16 |
356.3% |
|
349.95 |
147.32 |
137.5% |
| Costa Rica |
|
526.88 |
601.99 |
-12.5% |
|
542.35 |
632.72 |
-14.3% |
| Panama |
|
1.00 |
1.00 |
0.0% |
|
1.00 |
1.00 |
0.0% |
| Guatemala |
|
7.83 |
7.85 |
-0.3% |
|
7.86 |
7.88 |
-0.3% |
| Nicaragua |
|
36.62 |
36.23 |
1.1% |
|
36.53 |
36.05 |
1.3% |
| Uruguay |
|
39.02 |
40.07 |
-2.6% |
|
38.56 |
41.74 |
-7.6% |
| |
|
|
|
|
|
|
|
|
| (2) Average exchange rate for each period computed with the average exchange rate of each month. |
| | |
Coca-Cola FEMSA Reports 4Q23 Results February 22, 2024 | Page 18 of 17 |
SIGNATURES
Pursuant to
the requirements of the Securities Exchange Act of 1934, the registrant has duly caused this report to be signed on its behalf
by the undersigned, thereunto duly authorized.
| |
|
| |
COCA-COLA FEMSA, S.A.B. DE C.V. |
| |
By: /s/ Gerardo Cruz Celaya |
| |
Gerardo Cruz Celaya
Chief Financial Officer |
| |
|
| Date: February 22, 2024 |
|
Coca Cola FEMSA SAB De CV (NYSE:KOF)
Historical Stock Chart
From Mar 2024 to Apr 2024

Coca Cola FEMSA SAB De CV (NYSE:KOF)
Historical Stock Chart
From Apr 2023 to Apr 2024
