Ford Down Nearly 7% After 2Q Results -- Data Talk
July 25 2019 - 11:25AM
Dow Jones News
Ford Motor Co. (F) is currently at $9.61, down $0.72 or
6.97%
-- Would be lowest close since June 3, 2019, when it closed at
$9.61
-- On pace for largest percent decrease since Jan. 17, 2018,
when it fell 7.02%
-- On Wednesday, Ford reported second-quarter earnings per
share, adjusted for one-time items, was 28 cents, lower than the
31-cent average forecast from Wall Street analysts. Ford said
earnings per share for 2019 would be $1.20 to $1.35, lower than the
$1.40 analysts' average estimate
-- Ford said unexpectedly high costs associated with new vehicle
launches, including a redesigned Explorer SUV, hurt results
-- J.P. Morgan analyst Ryan Brinkman, who currently has no
rating on Ford shares, said Ford's guidance provided late Wednesday
implies "materially lower" second-half automotive profits than he,
or his peers, had forecast, cited MarketWatch
-- Snaps a two day winning streak
-- Down 6.06% month-to-date; on pace for worst month since May
2019, when it fell 8.9%
-- Up 25.62% year-to-date
-- Down 73.69% from its all-time closing high of $36.53 on May
3, 1999
-- Traded as low as $9.59; lowest intraday level since June 3,
2019, when it hit $9.46
-- Down 7.16% at today's intraday low; largest intraday percent
decrease since Jan. 17, 2018, when it fell as much as 7.63%
-- Third worst performer in the S&P 500 today
-- Most active stock in the S&P 500 today
All data as of 10:44:47 AM
Source: Dow Jones Market Data, FactSet
(END) Dow Jones Newswires
July 25, 2019 11:10 ET (15:10 GMT)
Copyright (c) 2019 Dow Jones & Company, Inc.
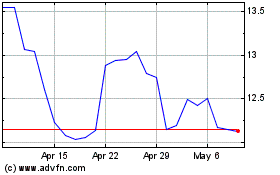
Ford Motor (NYSE:F)
Historical Stock Chart
From Mar 2024 to Apr 2024

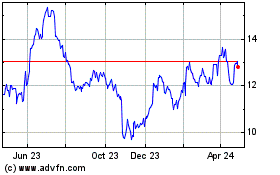
Ford Motor (NYSE:F)
Historical Stock Chart
From Apr 2023 to Apr 2024
