false 0001302028 0001302028 2024-02-29 2024-02-29
UNITED STATES
SECURITIES AND EXCHANGE COMMISSION
WASHINGTON, D.C. 20549
FORM 8-K
CURRENT REPORT
Pursuant to Section 13 or 15(d)
of the Securities Exchange Act of 1934
Date of report (Date of the earliest event reported) February 29, 2024
MANITEX INTERNATIONAL, INC.
(Exact Name of Registrant as Specified in Its Charter)
|
|
|
|
|
| Michigan |
|
001-32401 |
|
42-1628978 |
| (State or Other Jurisdiction of Incorporation) |
|
(Commission File Number) |
|
(IRS Employer Identification No.) |
9725 Industrial Drive, Bridgeview, Illinois 60455
(Address of Principal Executive Offices) (Zip Code)
(708) 430-7500
(Registrant’s Telephone Number, Including Area Code)
Check the appropriate box below if the Form 8-K filing is intended to simultaneously satisfy the filing obligation of the registrant under any of the following provisions:
| ☐ |
Written communications pursuant to Rule 425 under the Securities Act (17 CFR 230.425) |
| ☐ |
Soliciting material pursuant to Rule 14a-12 under the Exchange Act (17 CFR 240.14a-12) |
| ☐ |
Pre-commencement communications pursuant to Rule 14d-2(b) under the Exchange Act (17 CFR 240.14d-2(b)) |
| ☐ |
Pre-commencement communications pursuant to Rule 13e-4(c) under the Exchange Act (17 CFR 240.13e-4(c)) |
Indicate by check mark whether the registrant is an emerging growth company as defined in Rule 405 of the Securities Act of 1933 (§230.405 of this chapter) or Rule 12b-2 of the Securities Exchange Act of 1934 (§240.12b-2 of this chapter).
Emerging growth company ☐
If an emerging growth company, indicate by check mark if the registrant has elected not to use the extended transition period for complying with any new or revised financial accounting standards provided pursuant to Section 13(a) of the Exchange Act. ☐
Securities registered pursuant to Section 12(b) of the Act:
|
|
|
|
|
| Title of each class |
|
Trading
Symbol(s) |
|
Name of each exchange
on which registered |
| Common Stock, no par value |
|
MNTX |
|
The NASDAQ Stock Market LLC |
Item 2.02 Results of Operations and Financial Condition.
On February 29, 2024 , Manitex International, Inc. (the “Company”) issued a press release announcing its unaudited financial results for the third quarter ended December 31, 2023 (the “Press Release”). The full text of the Press Release is being furnished as Exhibit 99.1 to this Current Report. The Company’s conference call and webcast will take place today February 29, 2024 at 9:00 am eastern time to discuss the fourth quarter 2023 results. The exhibit can be accessed from the Investor Relations section of the Company’s website at www.ManitexInternational.com.
The information in this Current Report (including Exhibit 99.1) is being furnished and shall not be deemed “filed” for the purposes of Section 18 of the Securities Exchange Act of 1934, as amended (the “Exchange Act”), or otherwise subject to the liabilities of that Section. The information in this Current Report shall not be incorporated by reference into any registration statement or other document pursuant to the Securities Act of 1933, as amended or the Exchange Act, except as shall be expressly set forth by specific reference in such filing.
The Company references certain non-GAAP financial measures. A reconciliation of these non-GAAP financial measures to the comparable GAAP financial measures is contained in the attached Press Release. Disclosures regarding definitions of these financial measures used by the Company and why the Company’s management believes these financial measures provide useful information to investors is also included in the Press Release.
Item 9.01 Financial Statements and Exhibits.
(a) Financial Statements of Businesses Acquired.
Not applicable.
(b) Pro Forma Financial Information.
Not applicable.
(c) Shell Company Transactions.
Not applicable.
(d) Exhibits.
See the Exhibit Index set forth below for a list of exhibits included with this Current Report on Form 8-K.
SIGNATURE
Pursuant to the requirements of the Securities Exchange Act of 1934, the Company has duly caused this report to be signed on its behalf by the undersigned thereunder duly authorized.
|
|
|
| MANITEX INTERNATIONAL, INC. |
|
|
| By: |
|
/s/ Joseph Doolan |
| Name: |
|
Joseph Doolan |
| Title: |
|
Chief Financial Officer |
Date: February 29, 2024
Exhibit 99.1

MANITEX INTERNATIONAL REPORTS
FOURTH QUARTER AND FULL-YEAR 2023 RESULTS
Bridgeview, IL, February 29, 2024 – Manitex International, Inc. (Nasdaq: MNTX) (“Manitex” or the
“Company”), a leading international provider of truck cranes, specialized industrial equipment, and construction equipment rental solutions to infrastructure and construction markets, today reported financial results for the three
months and twelve months ended December 31, 2023.
FOURTH QUARTER 2023 RESULTS
(all comparisons versus the prior year period unless otherwise noted)
| • |
|
Net revenue of $78.7 million |
| • |
|
Gross profit of $16.4 million, +8.2%; gross margin of 20.9%, +162 basis points |
| • |
|
GAAP Net Income of $5.2 million; Adjusted Net Income of $6.3 million, or $0.31 per diluted share
|
| • |
|
Adjusted EBITDA of $8.0 million; Adjusted EBITDA margin of 10.2% |
| • |
|
Net leverage of 2.9x as of Dec. 31, 2023 |
FULL-YEAR 2023 RESULTS
(all comparisons versus the prior year period unless otherwise noted)
| • |
|
Net revenue of $291.4 million, +6.4% |
| • |
|
Gross profit of $62.4 million, +24.7%; gross margin of 21.4%, +313 basis points |
| • |
|
GAAP Net Income of $7.4 million; Adjusted Net Income of $12.4 million, or $0.61 per diluted share
|
| • |
|
Adjusted EBITDA of $29.6 million, +39.1%; Adjusted EBITDA margin of 10.1%, +239 basis points
|
MANAGEMENT COMMENTARY
“Our fourth quarter results were a solid finish to a record year at Manitex,” stated Michael Coffey, Chief Executive Officer of
Manitex. “In early 2023, we introduced Elevating Excellence, a multi-year business transformation strategy created to accelerate our commercial growth, improve our operational efficiency, and drive a returns-focused, disciplined approach
to capital allocation. Our team executed to plan, resulting in nearly 40% full year growth in Adjusted EBITDA, and nearly 240 basis point in improvement to Adjusted EBITDA margin. This resulted in a significant reduction in our net leverage
profile.”
“We executed on our commercial growth priorities, resulting in share gains within our North and South American
markets, together with continued growth in our dealer network,” continued Coffey. “At an operational level, we materially improved our manufacturing velocity, allowing for meaningful improvement in unit production levels. These
improvements are the result of newly implemented systems and processes, designed to benefit our scale. We also continued to develop a performance-driven, data-centric organization with the implementation of advanced technologies that equip us to
reduce cost and standardize business processes. The combined benefit of these actions provide us a strong base for profitable expansion and growth, moving forward.”
“Entering 2024, we will seek to prioritize new product development, together with further
expansion of our dealer network, particularly as it relates to our PM Crane product sales in North America,” continued Coffey. “We will further improve our sourcing capabilities to deliver a more robust, efficient and cost-effective supply
chain. We are also poised to continue to improve our production output, enabling needed growth and improving our fixed cost absorption. These objectives are key parts of our Elevating Excellence strategy and we remain on track to achieve our
operational goals.”
“Our decision to prioritize higher-value business is a central tenet of our value creation strategy,”
continued Coffey. “We are committed to improving margins, necessitating more focus on the value of certain products over others. Under-performing products have been scaled back or discontinued and we are more focused on the delivered value to
our product offering, not just the size of the backlog. Our backlog remains very healthy with the added benefit of increased value embedded in new orders taken during the past year. At year-end 2023, our total
backlog stood at $170 million, representing nearly nine months of lifting equipment revenue, which affords us excellent visibility as we look to 2024. Given our strong performance in 2023, together with another year of expected growth in 2024,
we remain on pace to achieve our 2025 financial targets, as outlined within our Elevating Excellence strategy.”
“Our
fourth quarter performance reflects the second highest quarterly revenue run-rate in the last five years,” noted Coffey. “Gross margin increased more than 160 basis points to 20.9% in the fourth
quarter, despite continued headwinds from rising steel prices in North America. We have implemented programmatic price increases and commodity surcharges to offset these higher materials costs and expect to realize the benefits of these actions as
we move through 2024.”
“We remain focused on reducing our net leverage profile,” stated Joseph Doolan, Chief Financial
Officer of Manitex. “Last year, we reduced our net leverage ratio nearly a full-turn from 3.9x at year-end 2022, to 2.9x at year-end 2023, beating our stated
target. Working capital remained above normal levels through 2023 owing to short-term measures to counteract supply chain performance as well as the introduction of new ERP systems. We expect to unlock much of this surplus working capital in the
coming quarters, which will drive continued debt reduction in 2024. Our total liquidity of approximately $31 million, which includes total cash and availability under our credit facilities, provides us with ample financial flexibility to
support our organic growth initiatives into 2024.”
“I am proud of our management and team. We are ahead of schedule and well
positioned thanks to their dedication and efforts,” stated Coffey. “We are entering the new year with great momentum and a track-record of results. We expect another year of solid revenue growth and margin expansion in 2024. Elevating
Excellence is a 3-year strategy, by design. Business transformations, such as ours take time. We are ahead of schedule, however, and confident in our future.”
FOURTH QUARTER 2023 PERFORMANCE
Manitex reported net revenue of $78.7 million in the fourth quarter 2023, essentially flat from the same period last year owing to a
difficult comparison as revenues increased nearly 50% in last year’s fourth quarter. Revenue growth was negatively impacted by $1.6 million, or approximately 2%, due to lower truck chassis sales, which are largely pass-through revenue
items.
Lifting Equipment Segment revenue was $70.8 million in the fourth quarter 2023, a decline of 1.0%, versus the prior-year
period, or an increase of 1.5% when excluding the impact of truck chassis sales in the
quarter. The sales performance is a direct result of improvements in manufacturing throughput, as
well as continued favorable demand trends in both domestic and international markets, partially offset by the strong fourth quarter results reported last year.
Rental Equipment Segment revenue was $7.9 million in the fourth quarter 2023, an increase of 7.3% versus the prior year, supported by
strong end-market demand in key North Texas markets, including contribution from the Lubbock, Texas location that opened in March 2023. The Rabern business benefitted from the deployment of new rental fleet
acquired in 2022, pricing gains, and our expansion into the Lubbock market.
Total gross profit was $16.4 million in the fourth
quarter, an increase from $15.2 million in the prior-year period due to increased manufacturing throughput, improved pricing realization, and sales mix. As a result of these factors, gross profit margin increased 162 basis points to 20.9%
during the fourth quarter 2023. Higher US-based steel prices were once again a headwind to gross profits during the fourth quarter, as steel prices surged late in the third quarter and into the fourth quarter.
The Company continues to implement price increases and commodity surcharges to offset rising steel prices and expects to see some relief in the coming quarters.
SG&A expense was $10.8 million for the fourth quarter, compared to $10.1 million for the comparable period last year. R&D
costs of $0.9 million were flat from last year.
Operating income was $4.8 million for the fourth quarter 2023, compared to
$4.2 million for the same period last year. Fourth quarter operating margin was 6.1%, an improvement from 5.3% in the prior year period. The year-over-year improvement in operating income was driven by the solid gross margin performance
combined with disciplined cost control.
The Company delivered GAAP Net Income of $5.2 million, or $0.26 per diluted share, for the
fourth quarter 2023, compared to net income of $0.5 million, or $0.02 per diluted share, for the same period last year. The increase is driven mainly from a tax benefit recorded in the fourth quarter of 2023.
Adjusted EBITDA was $8.0 million for the fourth quarter 2023, or 10.2% of sales, consistent with the $8.1 million, or 10.3% of
sales, for the same period last year. See Non-GAAP reconciliations in the appendix of this release.
As of December 31, 2023, total backlog was $170.3 million, down from $196.9 million at the end of the third quarter 2023.
BALANCE SHEET AND LIQUIDITY
As of December 31, 2023, total debt was $94.9 million. Cash and cash equivalents as of December 31, 2023, were
$9.5 million, resulting in net debt of $85.5 million, an improvement of $0.9 million from the prior quarter. Net leverage was 2.9x at the end of fourth quarter 2023, down from 3.9x at the end of fourth quarter 2022. As of
December 31, 2023, Manitex had total cash and availability of approximately $31 million.
STRATEGIC UPDATE - ELEVATING EXCELLENCE INITIATIVE
In early 2023, Manitex formally launched its multi-year business transformation strategy, Elevating Excellence, which aims to drive
long-term value creation for shareholders through generation of commercial growth, enhanced operating performance, and disciplined capital allocation.
With the significant progress achieved during 2023, the key priorities for 2024 are as follows:
| |
• |
|
Commercial Growth. An important component of Manitex’s targeted commercial growth strategy is
increasing the market share of key product platforms in North America and, specifically, enhancing the penetration of its PM Group products domestically. A key driver of this initiative involves expansion of the dealer network in the U.S., which is
a significant priority in 2024. This year, the Company is targeting the addition of 2 to 3 new dealer agreements in the U.S. that will be focused primarily on the PM product portfolio. In addition, Manitex expects to introduce innovative new product
platforms during the year, including offerings focused on high-lift aerial work platforms, electric cranes, and articulated cranes. |
| |
• |
|
Enhanced Operating Performance. Consistent with a focus on ratable margin expansion, Manitex remains
focused on driving further supply chain efficiencies, additional improvements to manufacturing velocity, and targeted cost reduction measures. Between 2024 and 2025, Manitex expects to realize improved supply chain savings which will contribute to
improve gross margin expansion. |
| |
• |
|
Disciplined Capital Allocation. Manitex has adopted a returns-focused approach to capital allocation,
while seeking to optimize its balance sheet and liquidity profile. At year-end 2023, Manitex has approximately $31 million of cash and availability under its existing credit facilities. Further,
consistent with a focus on working capital efficiency, the Company will reduce total working capital, driving an improvement in free cash flow. These reductions will come from production level inventory reductions, leveraging new processes and
better supply-chain relationships going forward. At year-end 2023, Manitex had reduced net leverage to 2.9x, below its long-term target of 3.0x. In 2024, management is increasingly focusing on opportunities
for capital deployment beyond debt reduction, consistent with a focus on long-term shareholder value creation. |
2024 FINANCIAL GUIDANCE
The following forward-looking guidance reflects the management’s current expectations and beliefs as of February 29, 2024, and is
subject to change.
|
|
|
|
|
|
|
|
|
| |
|
Full-Year
2023 Actual |
|
|
Full-Year
2024 |
|
| Total Revenue ($MM) |
|
$ |
291.4 |
|
|
$ |
300 to $310 |
|
| Total Adjusted EBITDA ($MM) |
|
$ |
29.6 |
|
|
$ |
30 to $34 |
|
| Total Adjusted EBITDA Margin |
|
|
10.1 |
% |
|
|
10.5 |
%* |
| * |
Assumes mid-point of the guidance range. |
FOURTH QUARTER 2023 RESULTS CONFERENCE CALL
Manitex will host a conference call today at 9:00 AM ET to discuss the Company’s fourth quarter 2023 results and updated corporate
strategy.
A webcast of the conference call and accompanying presentation materials will be available in the Investor Relations section of
the Manitex website at https://www.manitexinternational.com/eventspresentations.aspx, and a replay of the webcast will be available at the same time shortly after the webcast is complete.
To participate in the live teleconference:
|
|
|
| Domestic Live: |
|
(877) 407-0792 |
| International Live: |
|
(201) 689-8263 |
To listen to a replay of the teleconference, which will be available through March 14, 2024:
|
|
|
| Domestic Replay: |
|
(844) 512-2921 |
| International Replay: |
|
(412) 317-6671 |
| Passcode: |
|
13743781 |
NON-GAAP FINANCIAL MEASURES AND OTHER ITEMS
In this press release, we refer to various non-GAAP (U.S. generally accepted accounting principles)
financial measures which management uses to evaluate operating performance, to establish internal budgets and targets, and to compare the Company’s financial performance against such budgets and targets. These
non-GAAP measures, as defined by the Company, may not be comparable to similarly titled measures being disclosed by other companies. While adjusted financial measures are not intended to replace any
presentation included in our consolidated financial statements under generally accepted accounting principles (GAAP) and should not be considered an alternative to operating performance or an alternative to cash flow as a measure of liquidity, we
believe these measures are useful to investors in assessing our operating results, capital expenditures and working capital requirements and the ongoing performance of its underlying businesses. A reconciliation of Adjusted GAAP financial measures
is included with this press release. All per share amounts are on a fully diluted basis. The quarterly amounts described below are unaudited, are reported in thousands of U.S. dollars, and are as of the dates indicated.
ABOUT MANITEX INTERNATIONAL
Manitex International is a leading provider of mobile truck cranes, industrial lifting solutions, aerial work platforms, construction equipment
and rental solutions that serve general construction, crane companies, and heavy industry. The company engineers and manufactures its products in North America and Europe, distributing through independent dealers worldwide. Our brands include
Manitex, PM, Oil & Steel, Valla, and Rabern Rentals.
FORWARD-LOOKING STATEMENTS
Safe Harbor Statement under the U.S. Private Securities Litigation Reform Act of 1995: This release contains statements that are
forward-looking in nature which express the beliefs and expectations of management including statements regarding the Company’s expected results of operations or liquidity; statements concerning projections, predictions, expectations, estimates
or forecasts as to our business, financial and operational results and future economic performance; and statements of management’s goals and objectives and other similar expressions concerning matters that are not historical facts. In some
cases, you can identify forward-looking statements by terminology such as “anticipate,” “estimate,” “plan,” “project,” “continuing,” “ongoing,” “expect,” “we believe,”
“we intend,” “may,” “will,” “should,” “could,” and similar expressions. Such statements are based on current plans, estimates and expectations and involve a number of known and unknown risks,
uncertainties and other factors that could cause the Company’s future results, performance or achievements to differ significantly from the results, performance or achievements expressed or implied by such forward-looking statements. These
factors and additional information are discussed in the Company’s filings with the Securities and Exchange Commission and statements in this release should be evaluated in light of these important factors. Although we believe that these
statements are based upon reasonable assumptions, we cannot guarantee future results. Forward-looking statements speak only as of the date on which they are made, and the Company undertakes no obligation to update publicly or revise any
forward-looking statement, whether as a result of new information, future developments or otherwise.
IR CONTACT
Paul Bartolai or Noel Ryan
MNTX@val-adv.com
MANITEX INTERNATIONAL, INC. AND SUBSIDIARIES
CONDENSED CONSOLIDATED BALANCE SHEETS
(In thousands,
except share and per share data)
|
|
|
|
|
|
|
|
|
| |
|
December 31, 2023 |
|
|
December 31, 2022 |
|
| ASSETS |
|
|
|
|
|
|
|
|
| Current assets |
|
|
|
|
|
|
|
|
| Cash |
|
$ |
9,269 |
|
|
$ |
7,973 |
|
| Cash – restricted |
|
|
212 |
|
|
|
217 |
|
| Trade receivables (net) |
|
|
49,118 |
|
|
|
43,856 |
|
| Other receivables |
|
|
553 |
|
|
|
1,750 |
|
| Inventory (net) |
|
|
82,337 |
|
|
|
69,801 |
|
| Prepaid expense and other current assets |
|
|
4,084 |
|
|
|
3,907 |
|
|
|
|
|
|
|
|
|
|
| Total current assets |
|
|
145,573 |
|
|
|
127,504 |
|
|
|
|
|
|
|
|
|
|
| Total fixed assets, net of accumulated depreciation of $29,751 and $22,441
at
December 31, 2023 and December 31, 2022, respectively |
|
|
49,560 |
|
|
|
51,697 |
|
| Operating lease assets |
|
|
7,416 |
|
|
|
5,667 |
|
| Intangible assets (net) |
|
|
12,225 |
|
|
|
14,367 |
|
| Goodwill |
|
|
37,354 |
|
|
|
36,916 |
|
| Deferred tax assets |
|
|
3,603 |
|
|
|
452 |
|
|
|
|
|
|
|
|
|
|
| Total assets |
|
$ |
255,731 |
|
|
$ |
236,603 |
|
|
|
|
|
|
|
|
|
|
| LIABILITIES AND EQUITY |
|
|
|
|
|
|
|
|
| Current liabilities |
|
|
|
|
|
|
|
|
| Accounts payable |
|
$ |
47,645 |
|
|
$ |
45,682 |
|
| Accrued expenses |
|
|
14,503 |
|
|
|
12,379 |
|
| Related party payables (net) |
|
|
27 |
|
|
|
60 |
|
| Notes payable (net) |
|
|
25,528 |
|
|
|
22,666 |
|
| Current portion of finance lease obligations |
|
|
605 |
|
|
|
509 |
|
| Current portion of operating lease obligations |
|
|
2,100 |
|
|
|
1,758 |
|
| Customer deposits |
|
|
2,384 |
|
|
|
3,407 |
|
|
|
|
|
|
|
|
|
|
| Total current liabilities |
|
|
92,792 |
|
|
|
86,461 |
|
|
|
|
|
|
|
|
|
|
| Long-term liabilities |
|
|
|
|
|
|
|
|
| Revolving term credit facilities (net) |
|
|
47,629 |
|
|
|
41,479 |
|
| Notes payable (net) |
|
|
18,401 |
|
|
|
22,261 |
|
| Finance lease obligations (net of current portion) |
|
|
2,777 |
|
|
|
3,382 |
|
| Operating lease obligations (net of current portion) |
|
|
5,315 |
|
|
|
3,909 |
|
| Deferred gain on sale of property |
|
|
347 |
|
|
|
427 |
|
| Deferred tax liability |
|
|
4,145 |
|
|
|
5,151 |
|
| Other long-term liabilities |
|
|
4,642 |
|
|
|
5,572 |
|
|
|
|
|
|
|
|
|
|
| Total long-term liabilities |
|
|
83,256 |
|
|
|
82,181 |
|
|
|
|
|
|
|
|
|
|
| Total liabilities |
|
|
176,048 |
|
|
|
168,642 |
|
|
|
|
|
|
|
|
|
|
| Commitments and contingencies |
|
|
|
|
|
|
|
|
| Equity |
|
|
|
|
|
|
|
|
| Preferred Stock—Authorized 150,000 shares, no shares issued or outstanding at
December 31, 2023 and December 31, 2022 |
|
|
— |
|
|
|
— |
|
| Common Stock—no par value 25,000,000 shares authorized, 20,254,894 and 20,107,014 shares
issued and outstanding at December 31, 2023 and December 31, 2022, respectively |
|
|
134,328 |
|
|
|
133,289 |
|
| Paid-in capital |
|
|
5,440 |
|
|
|
4,266 |
|
| Retained deficit |
|
|
(65,982 |
) |
|
|
(73,338 |
) |
| Accumulated other comprehensive loss |
|
|
(4,169 |
) |
|
|
(5,822 |
) |
|
|
|
|
|
|
|
|
|
| Equity attributable to shareholders of Manitex International |
|
|
69,617 |
|
|
|
58,395 |
|
| Equity attributed to noncontrolling interest |
|
|
10,066 |
|
|
|
9,566 |
|
|
|
|
|
|
|
|
|
|
| Total equity |
|
|
79,683 |
|
|
|
67,961 |
|
|
|
|
|
|
|
|
|
|
| Total liabilities and equity |
|
$ |
255,731 |
|
|
$ |
236,603 |
|
|
|
|
|
|
|
|
|
|
MANITEX INTERNATIONAL, INC.
CONSOLIDATED STATEMENTS OF OPERATIONS
(In thousands,
except for share and per share amounts)
(Unaudited)
|
|
|
|
|
|
|
|
|
|
|
|
|
|
|
|
|
| |
|
Three Months Ended
December 31, |
|
|
Year Ended
December 31, |
|
| |
|
2023 |
|
|
2022 |
|
|
2023 |
|
|
2022 |
|
| Net revenues |
|
$ |
78,653 |
|
|
$ |
78,820 |
|
|
$ |
291,389 |
|
|
$ |
273,854 |
|
| Cost of sales |
|
|
62,231 |
|
|
|
63,637 |
|
|
|
229,037 |
|
|
|
223,835 |
|
|
|
|
|
|
|
|
|
|
|
|
|
|
|
|
|
|
| Gross profit |
|
|
16,422 |
|
|
|
15,183 |
|
|
|
62,352 |
|
|
|
50,019 |
|
| Operating expenses |
|
|
|
|
|
|
|
|
|
|
|
|
|
|
|
|
| Research and development costs |
|
$ |
876 |
|
|
$ |
894 |
|
|
|
3,388 |
|
|
|
2,989 |
|
| Selling, general and administrative expenses |
|
|
10,780 |
|
|
|
10,100 |
|
|
|
43,122 |
|
|
|
40,417 |
|
| Transaction costs |
|
|
— |
|
|
|
— |
|
|
|
— |
|
|
|
2,236 |
|
|
|
|
|
|
|
|
|
|
|
|
|
|
|
|
|
|
| Total operating expenses |
|
|
11,656 |
|
|
|
10,994 |
|
|
|
46,510 |
|
|
|
45,642 |
|
|
|
|
|
|
|
|
|
|
|
|
|
|
|
|
|
|
| Operating income (loss) |
|
|
4,766 |
|
|
|
4,189 |
|
|
|
15,842 |
|
|
|
4,377 |
|
| Other income (expense) |
|
|
|
|
|
|
|
|
|
|
|
|
|
|
|
|
| Interest expense |
|
|
(2,116 |
) |
|
|
(1,655 |
) |
|
|
(7,774 |
) |
|
|
(4,637 |
) |
| Interest income |
|
|
70 |
|
|
|
(1 |
) |
|
|
211 |
|
|
|
2 |
|
| Foreign currency transaction gain (loss) |
|
|
(883 |
) |
|
|
(376 |
) |
|
|
(2,539 |
) |
|
|
(108 |
) |
| Other income (expense) |
|
|
263 |
|
|
|
46 |
|
|
|
(278 |
) |
|
|
(1,818 |
) |
|
|
|
|
|
|
|
|
|
|
|
|
|
|
|
|
|
| Total other expense |
|
|
(2,666 |
) |
|
|
(1,986 |
) |
|
|
(10,380 |
) |
|
|
(6,561 |
) |
|
|
|
|
|
|
|
|
|
|
|
|
|
|
|
|
|
| Income (loss) before income taxes |
|
|
2,100 |
|
|
|
2,203 |
|
|
|
5,462 |
|
|
|
(2,184 |
) |
| Income tax expense (benefit) |
|
|
(3,357 |
) |
|
|
1,544 |
|
|
|
(2,395 |
) |
|
|
2,114 |
|
|
|
|
|
|
|
|
|
|
|
|
|
|
|
|
|
|
| Net income (loss) |
|
|
5,457 |
|
|
|
659 |
|
|
|
7,857 |
|
|
|
(4,298 |
) |
|
|
|
|
|
|
|
|
|
|
|
|
|
|
|
|
|
| Net income attributable to noncontrolling interest |
|
|
258 |
|
|
|
161 |
|
|
|
501 |
|
|
|
603 |
|
|
|
|
|
|
|
|
|
|
|
|
|
|
|
|
|
|
| Net income (loss) attributable to shareholders of Manitex International, Inc. |
|
$ |
5,199 |
|
|
$ |
498 |
|
|
$ |
7,356 |
|
|
$ |
(4,901 |
) |
|
|
|
|
|
|
|
|
|
|
|
|
|
|
|
|
|
| Income (loss) per share |
|
|
|
|
|
|
|
|
|
|
|
|
|
|
|
|
| Basic |
|
$ |
0.26 |
|
|
$ |
0.02 |
|
|
$ |
0.36 |
|
|
$ |
(0.24 |
) |
| Diluted |
|
$ |
0.26 |
|
|
$ |
0.02 |
|
|
$ |
0.36 |
|
|
$ |
(0.24 |
) |
| Weighted average common shares outstanding |
|
|
|
|
|
|
|
|
|
|
|
|
|
|
|
|
| Basic |
|
|
20,255,443 |
|
|
|
20,103,398 |
|
|
|
20,209,132 |
|
|
|
20,055,836 |
|
| Diluted |
|
|
20,306,534 |
|
|
|
20,103,398 |
|
|
|
20,223,825 |
|
|
|
20,055,836 |
|
Net Sales and Gross Margin
|
|
|
|
|
|
|
|
|
|
|
|
|
|
|
|
|
|
|
|
|
|
|
|
|
| |
|
Three Months Ended |
|
| |
|
December 31, 2023 |
|
|
September 30, 2023 |
|
|
December 31, 2022 |
|
| |
|
As Reported |
|
|
As Adjusted |
|
|
As Reported |
|
|
As Adjusted |
|
|
As Reported |
|
|
As Adjusted |
|
| Net sales |
|
$ |
78,653 |
|
|
$ |
78,653 |
|
|
$ |
71,331 |
|
|
$ |
71,331 |
|
|
$ |
78,820 |
|
|
$ |
78,820 |
|
| % change Vs Q3 2023 |
|
|
10.3 |
% |
|
|
10.3 |
% |
|
|
|
|
|
|
|
|
|
|
|
|
|
|
|
|
| % change Vs Q4 2022 |
|
|
(0.2 |
%) |
|
|
(0.2 |
%) |
|
|
|
|
|
|
|
|
|
|
|
|
|
|
|
|
|
|
|
|
|
|
|
| Gross margin |
|
|
16,422 |
|
|
|
16,422 |
|
|
|
16,585 |
|
|
|
16,585 |
|
|
|
15,183 |
|
|
|
15,355 |
|
| Gross margin % of net sales |
|
|
20.9 |
% |
|
|
20.9 |
% |
|
|
23.3 |
% |
|
|
23.3 |
% |
|
|
19.3 |
% |
|
|
19.5 |
% |
Backlog
|
|
|
|
|
|
|
|
|
|
|
|
|
|
|
|
|
|
|
|
|
| |
|
Dec 31, 2023 |
|
|
Sept 30, 2023 |
|
|
June 30, 2023 |
|
|
Mar 31, 2023 |
|
|
Dec 31, 2022 |
|
| Backlog from continuing operations |
|
|
170,286 |
|
|
|
196,872 |
|
|
|
223,236 |
|
|
|
238,096 |
|
|
|
230,206 |
|
| Change Versus Current Period |
|
|
|
|
|
|
(13.5 |
%) |
|
|
(23.7 |
%) |
|
|
(28.5 |
%) |
|
|
(26.0 |
%) |
Backlog is defined as orders for equipment which have not yet shipped as well as orders by foreign
subsidiaries for international deliveries. The disclosure of backlog aids in the analysis the Company’s customers’ demand for product, as well as the ability of the Company to meet that demand.
Backlog is not necessarily indicative of sales to be recognized in a specified future period.
Reconciliation of Net Income Attributable to Shareholders of Manitex International, Inc. to Adjusted Net Income
|
|
|
|
|
|
|
|
|
|
|
|
|
| |
|
Three Months Ended |
|
| |
|
December 31, 2023 |
|
|
September 30, 2023 |
|
|
December 31, 2022 |
|
| Net income attributable to shareholders of Manitex International, Inc. |
|
$ |
5,199 |
|
|
$ |
1,700 |
|
|
$ |
498 |
|
| Adjustments, including net tax impact |
|
|
1,116 |
|
|
|
1,222 |
|
|
|
1,332 |
|
| Adjusted net income attributable to shareholders of Manitex International, Inc. |
|
$ |
6,315 |
|
|
$ |
2,922 |
|
|
$ |
1,830 |
|
|
|
|
|
| Weighted diluted shares outstanding |
|
|
20,306,534 |
|
|
|
20,254,830 |
|
|
|
20,103,398 |
|
|
|
|
|
| Diluted earnings per share as reported |
|
$ |
0.26 |
|
|
$ |
0.08 |
|
|
$ |
0.02 |
|
| Total EPS effect |
|
$ |
0.05 |
|
|
$ |
0.06 |
|
|
$ |
0.07 |
|
| Adjusted diluted earnings per share |
|
$ |
0.31 |
|
|
$ |
0.14 |
|
|
$ |
0.09 |
|
Reconciliation of GAAP Net Income to Adjusted EBITDA
|
|
|
|
|
|
|
|
|
|
|
|
|
| |
|
Three Months Ended |
|
| |
|
December 31, 2023 |
|
|
September 30, 2023 |
|
|
December 31, 2022 |
|
| Net Income |
|
$ |
5,457 |
|
|
$ |
1,894 |
|
|
$ |
659 |
|
| Interest expense |
|
|
2,046 |
|
|
|
1,856 |
|
|
|
1,655 |
|
| Tax expense |
|
|
(3,357 |
) |
|
|
742 |
|
|
|
1,544 |
|
| Depreciation and amortization expense |
|
|
2,760 |
|
|
|
2,739 |
|
|
|
2,885 |
|
|
|
|
|
|
|
|
|
|
|
|
|
|
| EBITDA |
|
$ |
6,906 |
|
|
$ |
7,231 |
|
|
$ |
6,743 |
|
|
|
|
|
| Adjustments: |
|
|
|
|
|
|
|
|
|
|
|
|
| Stock compensation |
|
$ |
463 |
|
|
$ |
457 |
|
|
$ |
633 |
|
| FX |
|
|
883 |
|
|
|
883 |
|
|
|
376 |
|
| Pension settlement |
|
|
(230 |
) |
|
|
(118 |
) |
|
|
— |
|
| Litigation / legal settlement |
|
|
— |
|
|
|
— |
|
|
|
178 |
|
| Severance / restructuring costs |
|
|
— |
|
|
|
— |
|
|
|
108 |
|
| Other |
|
|
— |
|
|
|
— |
|
|
|
91 |
|
|
|
|
|
|
|
|
|
|
|
|
|
|
| Total Adjustments |
|
$ |
1,116 |
|
|
$ |
1,222 |
|
|
$ |
1,386 |
|
|
|
|
|
|
|
|
|
|
|
|
|
|
| Adjusted EBITDA |
|
$ |
8,022 |
|
|
$ |
8,453 |
|
|
$ |
8,129 |
|
|
|
|
|
|
|
|
|
|
|
|
|
|
| Adjusted EBITDA as % of sales |
|
|
10.2 |
% |
|
|
11.9 |
% |
|
|
10.3 |
% |
Net Debt
|
|
|
|
|
|
|
|
|
|
|
|
|
| |
|
December 31, 2023 |
|
|
September 30, 2023 |
|
|
December 31, 2022 |
|
| Total cash & cash equivalents |
|
$ |
9,481 |
|
|
$ |
4,876 |
|
|
$ |
8,190 |
|
|
|
|
|
| Notes payable - short term |
|
$ |
25,528 |
|
|
$ |
18,640 |
|
|
$ |
22,666 |
|
| Current portion of finance leases |
|
|
605 |
|
|
|
579 |
|
|
|
509 |
|
| Notes payable - long term |
|
|
18,401 |
|
|
|
20,857 |
|
|
|
22,261 |
|
| Finance lease obligations - LT |
|
|
2,777 |
|
|
|
2,940 |
|
|
|
3,382 |
|
| Revolver, net |
|
|
47,629 |
|
|
|
48,259 |
|
|
|
41,479 |
|
|
|
|
|
|
|
|
|
|
|
|
|
|
| Total debt |
|
$ |
94,940 |
|
|
$ |
91,275 |
|
|
$ |
90,297 |
|
|
|
|
|
|
|
|
|
|
|
|
|
|
| Net debt |
|
$ |
85,459 |
|
|
$ |
86,399 |
|
|
$ |
82,107 |
|
|
|
|
|
|
|
|
|
|
|
|
|
|
Net debt is calculated using the Consolidated Balance Sheet amounts for current and long-term portion of
long-term debt, capital lease obligations, notes payable, and revolving credit facilities minus cash and cash equivalents.
Exhibit 99.2 Fourth Quarter 2023 Results Conference Call February 29,
2023
Safe Harbor Statement Safe Harbor Statement under the U.S. Private
Securities Litigation Reform Act of 1995: This presentation contains statements that are forward-looking in nature which express the beliefs and expectations of management including statements regarding the Company’s expected results of
operations or liquidity; statements concerning projections, predictions, expectations, estimates or forecasts as to our business, financial and operational results and future economic performance; and statements of management’s goals and
objectives and other similar expressions concerning matters that are not historical facts. In some cases, you can identify forward-looking statements by terminology such as “anticipate,” “estimate,” “plan,”
“project,” “continuing,” “ongoing,” “expect,” “we believe,” “we intend,” “may,” “will,” “should,” “could,” and similar
expressions. Such statements are based on current plans, estimates and expectations and involve a number of known and unknown risks, uncertainties and other factors that could cause the Company's future results, performance or achievements to differ
significantly from the results, performance or achievements expressed or implied by such forward-looking statements. These factors and additional information are discussed in the Company's filings with the Securities and Exchange Commission and
statements in this presentation should be evaluated in light of these important factors. Although we believe that these statements are based upon reasonable assumptions, we cannot guarantee future results. Forward-looking statements speak only as of
the date on which they are made, and the Company undertakes no obligation to update publicly or revise any forward-looking statement, whether as a result of new information, future developments or otherwise. 2 2

Key Messages Fourth Quarter and Full-Year 2023 Highlights ❖
Healthy Backlog Levels ❖ Solid Revenue Growth Performance Lifting Equipment revenue increased Backlog decreased versus last year owing to increased throughput and 1.5% during 4Q (excl chassis sales) driven highlighted by solid by increased
throughput and strong portfolio rationalization, backlog remains at elevated levels at roughly 9 organic growth, demand trends months of sales continued operating ❖ Rental Momentum Rental revenue increased 7% due to execution, strong ❖
Elevating Excellence strong demand drivers, pricing benefits Continued progress on strategic initiatives margin expansion and ramp-up of Lubbock branch including growing momentum in new product introductions, ramp of new Rental ❖ Operating
Execution branch in Lubbock, and strong execution • 1.5% Lifting Equipment revenue 4Q23 gross margin increased 162 bps, on manufacturing throughput growth during 4Q (excl chassis driven by pricing benefits, improved productivity, and increased
fixed cost sales) despite difficult compare absorption; full-year gross margin ❖ 2024 Outlook expansion of 313 bps • Strong execution drove 162 bps 2024 EBITDA forecast assumes 8% growth at the mid-point of the guidance of y/y 4Q23
gross margin ❖ EBITDA Margin Expansion range driven by end market strength, expansion 4Q23 adjusted EBITDA margin of 10.2%, combined with continued operational flat y/y; full-year adjusted EBITDA improvements • Full-year adjusted EBITDA
of margin up 239 bps to 10.1% $29.6 million, up 39%; adjusted EBITDA margin expansion of 239 bps 3

Value Creation Roadmap We introduced Elevating Excellence Initiative in
First Quarter 2023 Manitex introduced its Elevating Excellence initiative in the first Manitex is addressing quarter 2023 representing a new long-term value creation strategy historical challenges to profitable growth • Too many go-to-market
Disciplined Targeted Sustained Operational brands - diluted brand Capital identity Commercial Excellence Allocation • Unrealized synergies of Expansion scale • Lack of production velocity High-return organic growth Organic share
expansion Optimize operating structure; product • Ineffective structure investments; invest from in favorable markets mix optimization; increased facility cash flow; opportunistic, • Lack of data-centric (North America / Western
utilization; supply chain optimization; accretive bolt-on Europe); Share expansion improved fixed cost absorption reporting (KPI, balanced acquisitions in of PM | Oil & Steel and scorecard) complementary adjacent Valla in the USA markets Our
Past Our Path Forward 4

Targeted Commercial Expansion Drive above-market organic growth,
leveraging incumbent position Retain leadership position within Straight Mast market, while investing Manitex will leverage in higher-growth, underpenetrated adjacent markets its incumbent, Delivering “One Driving balanced growth across
Relative growth leadership position in new and existing markets Manitex” to the market contribution by product Straight Mast Cranes Market Share Expansion to expand across Market Share | Growth Leverage strong market share in Valla PM straight
mast cranes to grow Articulated, Industrial articulated cranes, Industrial Cranes Straight Mast Manitex Lifting, and AWP share in N.A. Lift / AWP and Rental Simplify Brand Identity Markets Simplify our go-to-market branding, supporting our dealers
with segmented brands serving • Manitex has 35% market share specific applications within the domestic Straight Enhanced Product Distribution Mast market O&S Consolidate distribution across AWP Articulated Rental targeted geographies
• Brand consolidation, Industrial Lift & market positioning will help to Product Innovation AWPs drive organic share gains in Rentals Invest in new, adjacent markets customer-led innovation and Growth product development 5 Share

Sustained Operational Excellence Building a durable, more efficient
business to drive profitable growth Key drivers of multi-year margin improvement, Manitex intends weighted by potential anticipated margin uplift to drive productivity and efficiency improvements in Product Mix support of profitable Process growth
through Parts Sales the cycle Supply Chain • Implement a lean, more efficient organizational structure, increase 2023 Accomplishments 2024 Priorities 2025 Priorities production velocity, expand sourcing and procurement • Upgraded (2)
aged systems to • Drive growth of PM | Oil & Steel • Product rationalization capabilities, improve modern ERP operating systems Valla in NA • Strategic, bolt-on acquisitions inventory management, • Began rationalizing and
improving • Rental growth and margin leverage data and analytics supply chain expansion • Implemented processes and systems • Continued supply chain in support of cultural to increase capacity improvements to efficiency and
accountability cost • Eliminated unprofitable brands and certain products 6

Disciplined Capital Allocation Prioritize reduction in net leverage,
targeted organic growth investments Manitex intends to reduce net leverage, while continuing to optimize liquidity with which to support organic growth across the business 2023-2024 Acquisition Criteria Capital allocation priorities 1. Reduce net
leverage further below target of 3.0x or less 2. Selectively invest in organic growth opportunities Revenue and Product line | Technical accretive 3. Opportunistic, shareholder-friendly return of capital Aftermarket end-market capabilities margin
appeal expansion expansion synergies 2025+ Capital allocation priorities 1. Strategic, bolt-on acquisitions 2. Selectively invest in new organic growth opportunities 3. Opportunistic, shareholder-friendly return of capital Building a more efficient,
lean organization before we begin to pursue strategic acquisitions 7

2025 Financial Targets Positioned to drive significant organic growth
and margin expansion 2022A-2025E Between YE 2022 and Revenue Bridge ($MM) EBITDA Bridge ($MM) EBITDA Margin (%) YE 2025, Manitex ~25% ~65-110% +300-500 bps intends to deliver revenue growth at EBITDA growth of margin expansion incremental growth
mid-point of range 11% to 13% in revenue, EBITDA and EBITDA margin $325 to $360 $35 to $45 8% $274 realization through a $21 combination of commercial 2022 2025E 2022 2025E 2022 2025E expansion, sustained operational Revenue Drivers Margin Drivers
(2024 and 2025 Focus on Growth) (2023 is a foundational year with focus on margins / process and systems) excellence and disciplined • End-market growth• Improved fixed-cost absorption through improved operating leverage • Improved
capacity utilization• Reweight product mix toward higher-margin offering capital allocation • Product innovation / NPD• Centralization of procurement and supply chain • Market share gains 8

Progress on Elevating Excellence Initiatives On track to achieve 2025
financial targets 25% Revenue Growth FY22 Revenue FY23 Revenue 2025 Target Key Accomplishments: Key Priorities: $274MM $291MM $325-360MM • Structural Organization Changes• PM Crane Expansion • New products (ECSY, TC850)•
Increased Dealer Count • Increased Share• New products (AWPs, elec cranes) 65-110% EBITDA Growth FY22 EBITDA FY23 EBITDA 2025 Target Key Accomplishments: Key Priorities: $21MM $30MM $35-45MM • 39% full-year EBITDA growth•
Cost reductions • Improved mfg velocity• Reduced supply chain costs • Strong organic growth• Increase unit production 300-500 bps of EBITDA Margin Expansion FY23 Margin FY22 Margin 2025 Target Key Accomplishments: Key
Priorities: 7.8% 10.1% 11-13% • 240bps full-year margin expansion• Supply chain efficiencies • Improved scale benefits• Operating leverage • Operating efficiencies• Improved mix 9
Fourth Quarter and Full-Year 2023 Results

4Q23 and Full-Year 2023 Financial Performance Strong operational and
commercial execution, Elevating Excellence gaining momentum 4Q23 and full-year 2023 results highlighted by strong demand trends in Lifting Equipment, gross margin expansion, and progress on Elevating Excellence initiatives Fourth Quarter and
Full-Year 2023 Elevating Excellence Key Highlights Key Highlights Strong customer response for new product 4Q revenue grew 2% excl chassis sales driven by introductions growth in Rental and Lifting Equipment Increased market share in targeted
markets Backlog decreased due to increased manufacturing velocity, portfolio optimization; Ramp of new Rental location in Lubbock, TX backlog healthy at 9 months of sales Ongoing resource optimization initiatives driving 4Q gross margin of 20.9% up
162 bps due to improvement in manufacturing throughput higher pricing, better manufacturing throughput, and efficiency gains New sourcing initiatives provide opportunity for incremental cost savings 4Q adjusted EBITDA margin of 10.2% Net leverage of
2.9x, down from 3.9x at year-end 2023 adjusted EBITDA of $29.6MM, up 39% y/y; 2022, achieved goal of 3.0x ahead of plan margin of 10.1%, up 239 bps 11 11

4Q23 Performance Summary Strong growth, meaningful margin improvement
2% y/y Revenue Growth (ex chassis) Backlog Healthy at 9-Months of Sales Favorable end ($MM) ($MM) market trends and $78.8 $78.7 $238.1 $230.2 strong execution $223.2 $73.5 $196.9 $170.3 $71.3 $67.9 • Revenue growth due to favorable market
trends benefitting Lifting Equipment, rental growth 4Q22 1Q23 2Q23 3Q23 4Q23 4Q22 1Q23 2Q23 3Q23 4Q23 • Backlog down at year-end owing to increased throughput, remains healthy at 9-months of sales 162 bps y/y Gross Margin Expansion 39% y/y TTM
Adjusted EBITDA Growth (%) ($MM) • Gross margin improved 162 bps 23.3% 21.2% 20.9% y/y due to operational $8.5 20.3% $8.1 $8.0 19.3% improvement, improved mix, and $6.8 $6.3 more favorable pricing • Trailing twelve-month EBITDA of $29.6
million, up 39% from last year, 10.1% TTM EBITDA margin 4Q22 1Q23 2Q23 3Q23 4Q23 4Q22 1Q23 2Q23 3Q23 4Q23 12

Disciplined Balance Sheet Management Focus on debt reduction and
investment in organic growth initiatives Net Leverage Ratio Cash and Availability Capital allocation ($MM) (Net debt to Adjusted EBITDA) focused on debt $37.6 $36.6 $35.9 $31.2 $31.3 $28.7 reduction and organic 3.9x growth initiatives 3.5x 3.3x 3.0x
2.9x 2.9x • Stable liquidity profile, modest decline due to normal seasonal 2021 2022 1Q23 2Q23 3Q23 4Q23 working capital requirements • Debt levels increased following Net Debt the acquisition of Rabern ($MM) completed in Apr-22 $87.8
$86.0 $86.4 $85.5 $82.1 • Net leverage of 2.9x, down from 3.9x at YE22 driven by strong EBITDA growth. Achieved long- $23.8 term target of 3.0x or less ahead of plan 2021 2022 1Q23 2Q23 3Q23 4Q23 2021 2022 1Q23 2Q23 3Q23 4Q23 13

Full-Year 2024 Financial Guidance Outlook reflects 8% Adjusted EBITDA
growth* and continued margin expansion Initial 2024 guidance reflects favorable end market trends and progress on Elevating Excellence initiatives $ in millions Fiscal Full-Year 2023 Fiscal Full-Year 2024 Revenue $291.4 $300 to $310 •
Continued end market momentum and contribution Adjusted EBITDA $29.6 $30 to $34 from new products driving solid Adjusted EBITDA Margin 10.1% 10.5%* revenue growth • Improved production velocity and operating efficiencies resulting in margin
expansion and strong Adjusted EBITDA growth • Expect continued balance sheet de-leveraging * At mid-point of guidance range 14

Appendix

Statement on Non-GAAP Financial Measures NON-GAAP FINANCIAL MEASURES
AND OTHER ITEMS In this presentation, we refer to various non-GAAP (U.S. generally accepted accounting principles) financial measures which management uses to evaluate operating performance, to establish internal budgets and targets, and to compare
the Company's financial performance against such budgets and targets. These non-GAAP measures, as defined by the Company, may not be comparable to similarly titled measures being disclosed by other companies. While adjusted financial measures are
not intended to replace any presentation included in our consolidated financial statements under generally accepted accounting principles (GAAP) and should not be considered an alternative to operating performance or an alternative to cash flow as a
measure of liquidity, we believe these measures are useful to investors in assessing our operating results, capital expenditure and working capital requirements and the ongoing performance of its underlying businesses. A reconciliation of Adjusted
GAAP financial measures is included with this presentation. All per share amounts are on a fully diluted basis. The quarterly amounts described below are unaudited, are reported in thousands of U.S. dollars, and are as of the dates indicated.
16

Appendix - Reconciliations Reconciliation of GAAP Net Income to
Adjusted Net Income Reconciliation of Net Income Attributable to Shareholders of Manitex International, Inc. to Adjusted Net Income Three Months Ended December 31, 2023 September 30, 2023 Decmber 31, 2022 Net income attributable to shareholders of
Manitex $ 5,199 $ 1,700 $ 498 International, Inc. Adjustments, including net tax impact 1,116 1,222 1,332 Adjusted net income attributable to shareholders of $ 6 ,315 $ 2,922 $ 1 ,830 Manitex International, Inc. Weighted diluted shares outstanding
20,306,534 20,254,830 20,103,398 Diluted earnings per share as reported $ 0 .26 $ 0 .08 $ 0.02 Total EPS effect $ 0.05 $ 0 .06 $ 0 .07 Adjusted diluted earnings per share $ 0.31 $ 0 .14 $ 0 .09 17
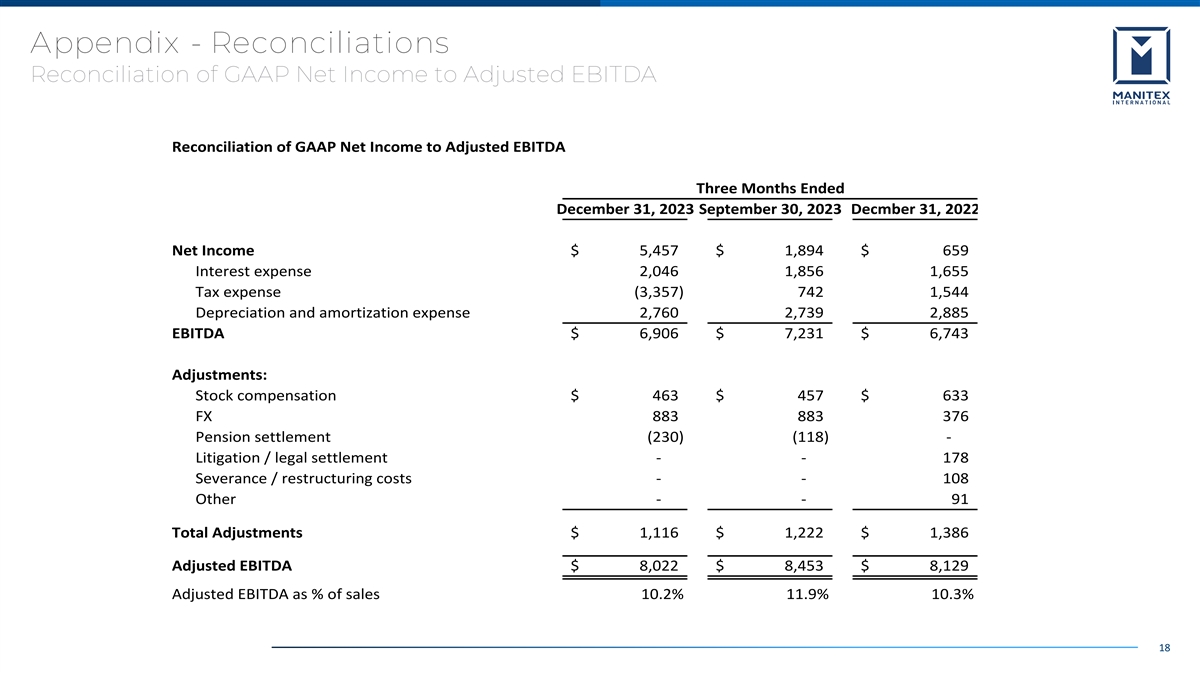
Appendix - Reconciliations Reconciliation of GAAP Net Income to
Adjusted EBITDA Reconciliation of GAAP Net Income to Adjusted EBITDA Three Months Ended December 31, 2023 September 30, 2023 Decmber 31, 2022 Net Income $ 5,457 $ 1,894 $ 659 Interest expense 2,046 1,856 1,655 Tax expense (3,357) 742 1,544
Depreciation and amortization expense 2,760 2,739 2,885 EBITDA $ 6,906 $ 7,231 $ 6,743 Adjustments: Stock compensation $ 463 $ 457 $ 633 FX 883 883 376 Pension settlement (230) (118) - Litigation / legal settlement - - 178 Severance / restructuring
costs - - 108 Other - - 91 Total Adjustments $ 1,116 $ 1,222 $ 1,386 Adjusted EBITDA $ 8,022 $ 8,453 $ 8,129 Adjusted EBITDA as % of sales 10.2% 11.9% 10.3% 18
v3.24.0.1
| X |
- DefinitionBoolean flag that is true when the XBRL content amends previously-filed or accepted submission.
| Name: |
dei_AmendmentFlag |
| Namespace Prefix: |
dei_ |
| Data Type: |
xbrli:booleanItemType |
| Balance Type: |
na |
| Period Type: |
duration |
|
| X |
- DefinitionFor the EDGAR submission types of Form 8-K: the date of the report, the date of the earliest event reported; for the EDGAR submission types of Form N-1A: the filing date; for all other submission types: the end of the reporting or transition period. The format of the date is YYYY-MM-DD.
| Name: |
dei_DocumentPeriodEndDate |
| Namespace Prefix: |
dei_ |
| Data Type: |
xbrli:dateItemType |
| Balance Type: |
na |
| Period Type: |
duration |
|
| X |
- DefinitionThe type of document being provided (such as 10-K, 10-Q, 485BPOS, etc). The document type is limited to the same value as the supporting SEC submission type, or the word 'Other'.
| Name: |
dei_DocumentType |
| Namespace Prefix: |
dei_ |
| Data Type: |
dei:submissionTypeItemType |
| Balance Type: |
na |
| Period Type: |
duration |
|
| X |
- DefinitionAddress Line 1 such as Attn, Building Name, Street Name
| Name: |
dei_EntityAddressAddressLine1 |
| Namespace Prefix: |
dei_ |
| Data Type: |
xbrli:normalizedStringItemType |
| Balance Type: |
na |
| Period Type: |
duration |
|
| X |
- Definition
+ References
+ Details
| Name: |
dei_EntityAddressCityOrTown |
| Namespace Prefix: |
dei_ |
| Data Type: |
xbrli:normalizedStringItemType |
| Balance Type: |
na |
| Period Type: |
duration |
|
| X |
- DefinitionCode for the postal or zip code
| Name: |
dei_EntityAddressPostalZipCode |
| Namespace Prefix: |
dei_ |
| Data Type: |
xbrli:normalizedStringItemType |
| Balance Type: |
na |
| Period Type: |
duration |
|
| X |
- DefinitionName of the state or province.
| Name: |
dei_EntityAddressStateOrProvince |
| Namespace Prefix: |
dei_ |
| Data Type: |
dei:stateOrProvinceItemType |
| Balance Type: |
na |
| Period Type: |
duration |
|
| X |
- DefinitionA unique 10-digit SEC-issued value to identify entities that have filed disclosures with the SEC. It is commonly abbreviated as CIK. Reference 1: http://www.xbrl.org/2003/role/presentationRef
-Publisher SEC
-Name Exchange Act
-Number 240
-Section 12
-Subsection b-2
| Name: |
dei_EntityCentralIndexKey |
| Namespace Prefix: |
dei_ |
| Data Type: |
dei:centralIndexKeyItemType |
| Balance Type: |
na |
| Period Type: |
duration |
|
| X |
- DefinitionIndicate if registrant meets the emerging growth company criteria. Reference 1: http://www.xbrl.org/2003/role/presentationRef
-Publisher SEC
-Name Exchange Act
-Number 240
-Section 12
-Subsection b-2
| Name: |
dei_EntityEmergingGrowthCompany |
| Namespace Prefix: |
dei_ |
| Data Type: |
xbrli:booleanItemType |
| Balance Type: |
na |
| Period Type: |
duration |
|
| X |
- DefinitionCommission file number. The field allows up to 17 characters. The prefix may contain 1-3 digits, the sequence number may contain 1-8 digits, the optional suffix may contain 1-4 characters, and the fields are separated with a hyphen.
| Name: |
dei_EntityFileNumber |
| Namespace Prefix: |
dei_ |
| Data Type: |
dei:fileNumberItemType |
| Balance Type: |
na |
| Period Type: |
duration |
|
| X |
- DefinitionTwo-character EDGAR code representing the state or country of incorporation.
| Name: |
dei_EntityIncorporationStateCountryCode |
| Namespace Prefix: |
dei_ |
| Data Type: |
dei:edgarStateCountryItemType |
| Balance Type: |
na |
| Period Type: |
duration |
|
| X |
- DefinitionThe exact name of the entity filing the report as specified in its charter, which is required by forms filed with the SEC. Reference 1: http://www.xbrl.org/2003/role/presentationRef
-Publisher SEC
-Name Exchange Act
-Number 240
-Section 12
-Subsection b-2
| Name: |
dei_EntityRegistrantName |
| Namespace Prefix: |
dei_ |
| Data Type: |
xbrli:normalizedStringItemType |
| Balance Type: |
na |
| Period Type: |
duration |
|
| X |
- DefinitionThe Tax Identification Number (TIN), also known as an Employer Identification Number (EIN), is a unique 9-digit value assigned by the IRS. Reference 1: http://www.xbrl.org/2003/role/presentationRef
-Publisher SEC
-Name Exchange Act
-Number 240
-Section 12
-Subsection b-2
| Name: |
dei_EntityTaxIdentificationNumber |
| Namespace Prefix: |
dei_ |
| Data Type: |
dei:employerIdItemType |
| Balance Type: |
na |
| Period Type: |
duration |
|
| X |
- DefinitionLocal phone number for entity.
| Name: |
dei_LocalPhoneNumber |
| Namespace Prefix: |
dei_ |
| Data Type: |
xbrli:normalizedStringItemType |
| Balance Type: |
na |
| Period Type: |
duration |
|
| X |
- DefinitionBoolean flag that is true when the Form 8-K filing is intended to satisfy the filing obligation of the registrant as pre-commencement communications pursuant to Rule 13e-4(c) under the Exchange Act. Reference 1: http://www.xbrl.org/2003/role/presentationRef
-Publisher SEC
-Name Exchange Act
-Number 240
-Section 13e
-Subsection 4c
| Name: |
dei_PreCommencementIssuerTenderOffer |
| Namespace Prefix: |
dei_ |
| Data Type: |
xbrli:booleanItemType |
| Balance Type: |
na |
| Period Type: |
duration |
|
| X |
- DefinitionBoolean flag that is true when the Form 8-K filing is intended to satisfy the filing obligation of the registrant as pre-commencement communications pursuant to Rule 14d-2(b) under the Exchange Act. Reference 1: http://www.xbrl.org/2003/role/presentationRef
-Publisher SEC
-Name Exchange Act
-Number 240
-Section 14d
-Subsection 2b
| Name: |
dei_PreCommencementTenderOffer |
| Namespace Prefix: |
dei_ |
| Data Type: |
xbrli:booleanItemType |
| Balance Type: |
na |
| Period Type: |
duration |
|
| X |
- DefinitionTitle of a 12(b) registered security. Reference 1: http://www.xbrl.org/2003/role/presentationRef
-Publisher SEC
-Name Exchange Act
-Number 240
-Section 12
-Subsection b
| Name: |
dei_Security12bTitle |
| Namespace Prefix: |
dei_ |
| Data Type: |
dei:securityTitleItemType |
| Balance Type: |
na |
| Period Type: |
duration |
|
| X |
- DefinitionName of the Exchange on which a security is registered. Reference 1: http://www.xbrl.org/2003/role/presentationRef
-Publisher SEC
-Name Exchange Act
-Number 240
-Section 12
-Subsection d1-1
| Name: |
dei_SecurityExchangeName |
| Namespace Prefix: |
dei_ |
| Data Type: |
dei:edgarExchangeCodeItemType |
| Balance Type: |
na |
| Period Type: |
duration |
|
| X |
- DefinitionBoolean flag that is true when the Form 8-K filing is intended to satisfy the filing obligation of the registrant as soliciting material pursuant to Rule 14a-12 under the Exchange Act. Reference 1: http://www.xbrl.org/2003/role/presentationRef
-Publisher SEC
-Name Exchange Act
-Section 14a
-Number 240
-Subsection 12
| Name: |
dei_SolicitingMaterial |
| Namespace Prefix: |
dei_ |
| Data Type: |
xbrli:booleanItemType |
| Balance Type: |
na |
| Period Type: |
duration |
|
| X |
- DefinitionTrading symbol of an instrument as listed on an exchange.
| Name: |
dei_TradingSymbol |
| Namespace Prefix: |
dei_ |
| Data Type: |
dei:tradingSymbolItemType |
| Balance Type: |
na |
| Period Type: |
duration |
|
| X |
- DefinitionBoolean flag that is true when the Form 8-K filing is intended to satisfy the filing obligation of the registrant as written communications pursuant to Rule 425 under the Securities Act. Reference 1: http://www.xbrl.org/2003/role/presentationRef
-Publisher SEC
-Name Securities Act
-Number 230
-Section 425
| Name: |
dei_WrittenCommunications |
| Namespace Prefix: |
dei_ |
| Data Type: |
xbrli:booleanItemType |
| Balance Type: |
na |
| Period Type: |
duration |
|
Manitex (NASDAQ:MNTX)
Historical Stock Chart
From Mar 2024 to Apr 2024

Manitex (NASDAQ:MNTX)
Historical Stock Chart
From Apr 2023 to Apr 2024
