Bitcoin Back Above $70,000 Despite Negative Taker Volume
April 11 2024 - 6:00PM
NEWSBTC
Bitcoin has surged back above the $70,000 level during the past day
despite the negative Net Taker Volume for the asset. Bitcoin Net
Taker Volume Has Seen Some Large Negative Spikes Recently As
explained by CryptoQuant Netherlands community manager Maartunn in
a post on X, selling spikes of a significantly heavier scale than
before have recently appeared in the Bitcoin Net Taker Volume.
Related Reading: Bitcoin 2 Months Through “Euphoria Wave,” How Long
Was The Last One? The “Net Taker Volume” is an indicator that keeps
track of the difference between the Bitcoin taker buy and taker
sell volumes in perpetual swaps. How can the sell and buy volumes
be different? As CryptoQuant explains in its data guide: This
concept is often confusing because every trade requires both a
buyer and a seller of the given underlying asset. However,
depending on whether the order taker is a buyer or seller (whether
a transaction occurs at the ask price or the bid price), you can
distinguish between long volume from taker seller volume. When the
value of this metric is positive, it means that the taker buy
volume is overwhelming the taker sell volume right now. Such a
trend implies a bullish sentiment is shared by the majority. On the
other hand, the negative indicator suggests that more sellers are
willing to sell the coin at a lower price, a sign that a bearish
mentality is the dominant one. Now, here is a chart that shows the
trend in the Bitcoin Net Taker Volume over the past year: The value
of the metric seems to have been quite red in recent days | Source:
@JA_Maartun on X As the above graph shows, the Bitcoin Net Taker
Volume has recently registered a sharp negative spike, implying
that the taker sell volume has been higher than the taker buy
volume. The Net Taker Volume has been seeing some large red spikes
for a while, as the analyst highlighted in the chart. “Bitcoin is
being hammered down massively, with selling spikes on the Net Taker
Volume significantly heavier than before,” says Maartunn.
Interestingly, despite this bearish sentiment in the market, the
Bitcoin price has managed to hold up relatively well. Obviously,
the coin’s bullish momentum has gone while these negative Net Taker
Volume spikes have taken hold, but the fact that BTC has shown
strength against any sustained drawdowns is still impressive.
Related Reading: Dogecoin Slows Down: What Needs To Happen For New
DOGE Highs? A pattern that’s perhaps visible in the chart is that
although the Net Taker Volume has continued to see red spikes
recently, their scale has gradually decreased. Thus, if this trend
continues, it’s possible that the bearish mentality will eventually
run out, and buying pressure will take over Bitcoin. It now remains
to be seen how the indicator develops shortly. BTC Price Bitcoin
declined below $68,000 just yesterday, but today, the asset has
already bounced back and is now trading around $70,800. Looks like
the price of the coin has made some recovery over the past 24 hours
| Source: BTCUSD on TradingView Featured image from Jievani
Weerasinghe on Unsplash.com, CryptoQuant.com, chart from
TradingView.com
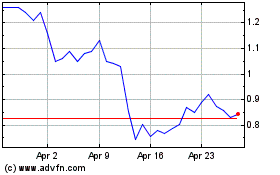
Mina (COIN:MINAUSD)
Historical Stock Chart
From Mar 2024 to Apr 2024

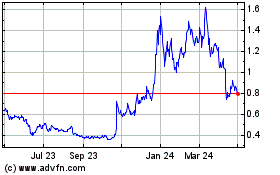
Mina (COIN:MINAUSD)
Historical Stock Chart
From Apr 2023 to Apr 2024
