Bitcoin Below $70,000: Is $80K Still Possible, Or Is The Rally Over?
April 10 2024 - 7:02AM
NEWSBTC
Bitcoin, the undisputed king of cryptocurrencies, is once again on
a wild ride. After a surge over the weekend that brought it close
to shattering its all-time high, the digital asset has dipped back
below the crucial $70,000 mark in the last 24 hours. This sudden
correction has left investors wondering if the predicted surge to
$80,000 is still on the table. Source: Coingecko Related Reading:
Polkadot Shines – Is Now The Time To Buy DOT Before $10? Bitcoin
Erases Weekend Gains Just days ago, Bitcoin bulls were celebrating
as the price climbed to near record highs exceeding $70,000. This
bullish momentum fueled optimism, with analysts like Markus Thielen
predicting a swift climb towards $80,000. However, that optimism
has been tempered by the recent price drop. Bitcoin has plummeted
roughly 6% from its peak, effectively erasing the gains made
earlier this week. While the price has recovered slightly to hover
around $69,200, it remains below the psychological barrier of
$70,000. Is The $80,000 Dream Dead? The recent correction has
undoubtedly dampened spirits, but some analysts are still confident
that Bitcoin’s journey to $80,000 is far from over. Proponents of
this view point to a few key factors that continue to fuel their
bullish sentiment. Stablecoin Inflows: A Beacon Of Hope? One factor
cited by Thielen is the continued strength of stablecoin inflows.
Stablecoins, cryptocurrencies pegged to traditional assets like the
US dollar, are often used as an entry point for investors into the
crypto market. Total crypto market cap is currently at $2.5
trillion. Chart: TradingView According to Thielen, these robust
inflows suggest sustained investor interest despite the short-term
price fluctuations. Additionally, he highlights a recent technical
chart pattern breakout, specifically a symmetrical triangle, as
another bullish indicator. Technical analysts believe such
breakouts often signal a continuation of the prior trend, which in
this case would be positive for Bitcoin. On-Chain Data Bolsters
Bullish Case Some analysts point to on-chain data from
IntoTheBlock, which reveals significant buying support at current
price levels. This data suggests that a large number of addresses
(essentially unique identifiers for cryptocurrency wallets)
purchased Bitcoin within the range of $68,200 and $70,325. This
buying activity indicates potential resistance against further
price dips, as these addresses would likely be hesitant to sell at
a loss. Bitcoin price action in the last week. Source: Coingecko
Bullish And Bearish Forces The current situation presents a classic
tug-of-war between Bitcoin bulls and bears. While the recent price
correction has shaken some confidence, strong stablecoin inflows
and on-chain buying activity suggest underlying bullish pressure.
However, they remain cautious, pointing to the slowdown in
investments specifically targeted at spot Bitcoin ETFs (Exchange
Traded Funds) as a potential concern. These ETFs allow investors to
gain exposure to Bitcoin’s price movements without directly owning
the cryptocurrency. Source: CoinShares Meanwhile, a report by
CoinShares, a digital asset manager, highlights a significant
decrease in inflows to such ETFs in recent weeks, suggesting that
some institutional investors might be adopting a wait-and-see
approach. Related Reading: Don’t Miss The Boat! Ethereum Whales
Signal Bullish Run With $40 Million Bet The future trajectory of
Bitcoin remains uncertain. The coming days and weeks will be
crucial in determining whether the bulls can overcome the current
resistance and propel the price towards $80,000. Featured image
from Pexels, chart from TradingView
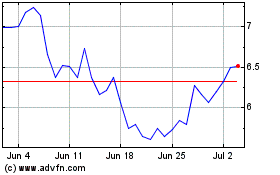
Polkadot (COIN:DOTUSD)
Historical Stock Chart
From Mar 2024 to Apr 2024

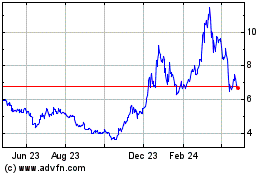
Polkadot (COIN:DOTUSD)
Historical Stock Chart
From Apr 2023 to Apr 2024
