Seneca Growth Capital VCT plc B Share Net Asset Value
March 10 2020 - 3:00AM
UK Regulatory
TIDMHYG TIDMSVCT


   Seneca Growth Capital VCT Plc (the "Company")

   10 March 2020

   B Share Net Asset Value

   The Directors and the investment manager of the Company, Seneca Partners
Limited, have reviewed the valuation of the Company's B share portfolio
as at 6 March 2020.

   The unaudited NAV of a B share as at 6 March 2020 was 88.7p per B share.
This is a decrease of 4.4p from the previously published audited NAV as
at 31 December 2019 due to changes in the value of a quoted investment
and running costs incurred in Q1 2020. The decrease is limited by the
impact of the cost cap which restricts the burden of ordinary running
costs on the B share class to 3% of the NAV of the B shares.

   For further information, please contact:

   John Hustler, Seneca Growth Capital VCT Plc at
https://www.globenewswire.com/Tracker?data=LPaxNwSQ8j9jNwVixIcpABwshk3OLtQ39iDMk5ugNSLlo6EBGRjUPf350KFw2r-k30JXuMrop8hJ9OAlT2wi5LO2428ywvyW3bAAyeO9lHDXxKkFSTXILP7DkgQxgDH9
john.hustler@btconnect.com

   Richard Manley, Seneca Growth Capital VCT Plc at
https://www.globenewswire.com/Tracker?data=EhHCgJWLI6f8glfPMmwPoT1nZWqeGjFmA7movQJ63hG6XBTtOmNjD0lddeSq7HhuTfrdySqfs3kZAD7VOEoRPAUrQvE0YtH1KrFE3SH4xRSd5celS4AdwqRGaCq4XrN-xKd-cL7vwN_dQQ6mOOTcZw==
Richard.Manley@senecapartners.co.uk
(END) Dow Jones Newswires
March 10, 2020 03:00 ET (07:00 GMT)
Copyright (c) 2020 Dow Jones & Company, Inc.
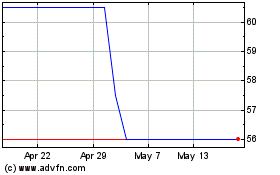
Seneca Growth Capital Vct (LSE:SVCT)
Historical Stock Chart
From Apr 2024 to May 2024

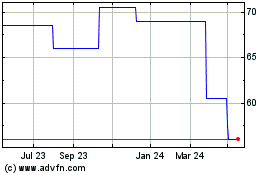
Seneca Growth Capital Vct (LSE:SVCT)
Historical Stock Chart
From May 2023 to May 2024
