Form 6-K - Report of foreign issuer [Rules 13a-16 and 15d-16]
February 29 2024 - 7:38AM
Edgar (US Regulatory)
UNITED STATES
SECURITIES AND EXCHANGE COMMISSION
Washington, DC 20549
FORM 6-K
REPORT OF FOREIGN PRIVATE ISSUER
PURSUANT TO RULE 13a-16 OR 15d-16
UNDER THE SECURITIES EXCHANGE ACT OF 1934
For the month of February, 2024.
Commission File Number 001-38755
Suzano S.A.
(Exact name of registrant as specified in its charter)
SUZANO INC.
(Translation of Registrant’s Name into English)
Av. Professor Magalhaes Neto, 1,752
10th Floor, Rooms 1010 and 1011
Salvador, Brazil 41 810-012
(Address of principal executive office)
Indicate by check mark whether the registrant files or will file annual reports under cover of Form 20-F or Form 40-F.
Form 20-F ⌧ Form 40-F ◻
Indicate by check mark if the registrant is submitting the Form 6-K in paper as permitted by Regulation S-T Rule 101(b)(1): ◻
Indicate by check mark if the registrant is submitting the Form 6-K in paper as permitted by Regulation S-T Rule 101(b)(7): ◻
SIGNATURE
Pursuant to the requirements of the Securities Exchange Act of 1934, the registrant has duly caused this report to be signed on its behalf by the undersigned, thereunto duly authorized.
Date: February 29, 2024
| | |
| | SUZANO S.A. |
| | |
| By: | /s/ Marcelo Feriozzi Bacci |
| Name: | Marcelo Feriozzi Bacci |
| Title: | Chief Financial and Investor Relations Officer |
3
Exhibit 99.1

| Earnings
Conference
Call 4Q23 |
| Disclaimer
2
This presentation contains what are considered “forward-looking statements,” as defined in Section 27A of the 1933
Securities Act and Section 21E of the 1934 Securities Exchange Act, as amended. Some of these forward-looking
statements are identified with words such as “believe,” “may,” “could,” “would,” “possible,” “will,” “should,” “expect,”
“intend,” “plan,” “anticipate,” “estimate,” “potential,” “outlook” or “continue,” as well as the negative forms of these words,
other terms of similar meaning or the use of future dates.
The forward-looking statements include, without limitation, statements related to the declaration or payment of
dividends, implementation of the key operational and financial strategies and investment plans, guidance about future
operations and factors or trends that influence the financial situation, liquidity or operational results. Such statements
reflect the current view of the management and are subject to diverse risks and uncertainties. These are qualified in
accordance with the inherent risks and uncertainties involving future expectations in general, and actual results could
differ materially from those currently anticipated due to various risks and uncertainties. There is no guarantee that the
expected events, trends or results will actually occur. The statements are based on diverse assumptions and factors,
including general economic and market conditions, industry conditions and operating factors. Any changes in such
assumptions or factors could cause actual results to differ materially from current expectations. Suzano does not
undertake any obligation to update any such forward-looking statements as a result of new information, future events or
otherwise, except as expressly required by law. All forward-looking statements in this presentation are covered in their
entirety by this disclaimer.
In addition, this presentation contains some financial indicators that are not recognized by the BR GAAP or IFRS. These
indicators do not have a standard meaning and may not be comparable to indicators with a similar description used by
other companies. We provide these indicators because we use them as measurements of Suzano's performance; they
should not be considered separately or as a replacement for other financial metrics that have been disclosed in accordance
with BR GAAP or IFRS. |
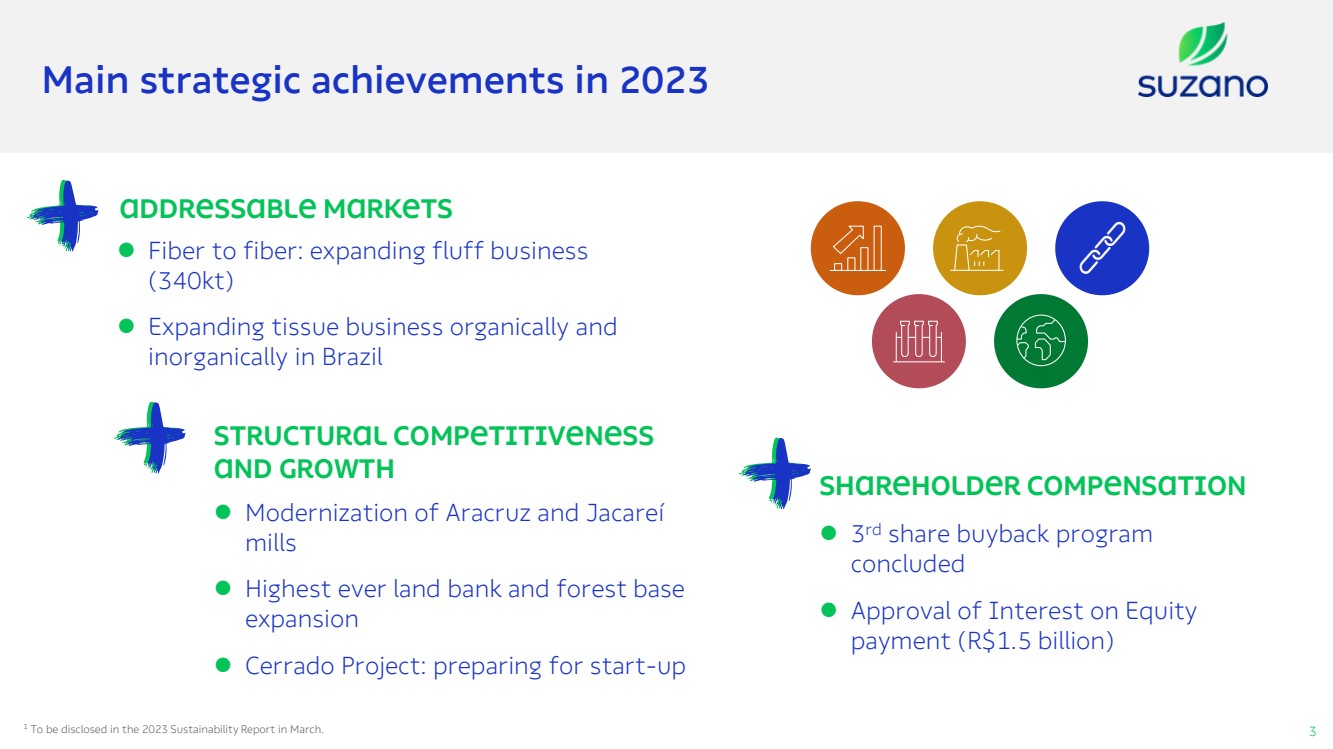
| Main strategic achievements in 2023
3
Addressable markets
⚫ Fiber to fiber: expanding fluff business
(340kt)
⚫ Expanding tissue business organically and
inorganically in Brazil
Structural competitiveness
and growth
⚫ Modernization of Aracruz and Jacareí
mills
⚫ Highest ever land bank and forest base
expansion
⚫ Cerrado Project: preparing for start-up
Shareholder compensation
⚫ 3
rd share buyback program
concluded
⚫ Approval of Interest on Equity
payment (R$1.5 billion)
1 To be disclosed in the 2023 Sustainability Report in March. |
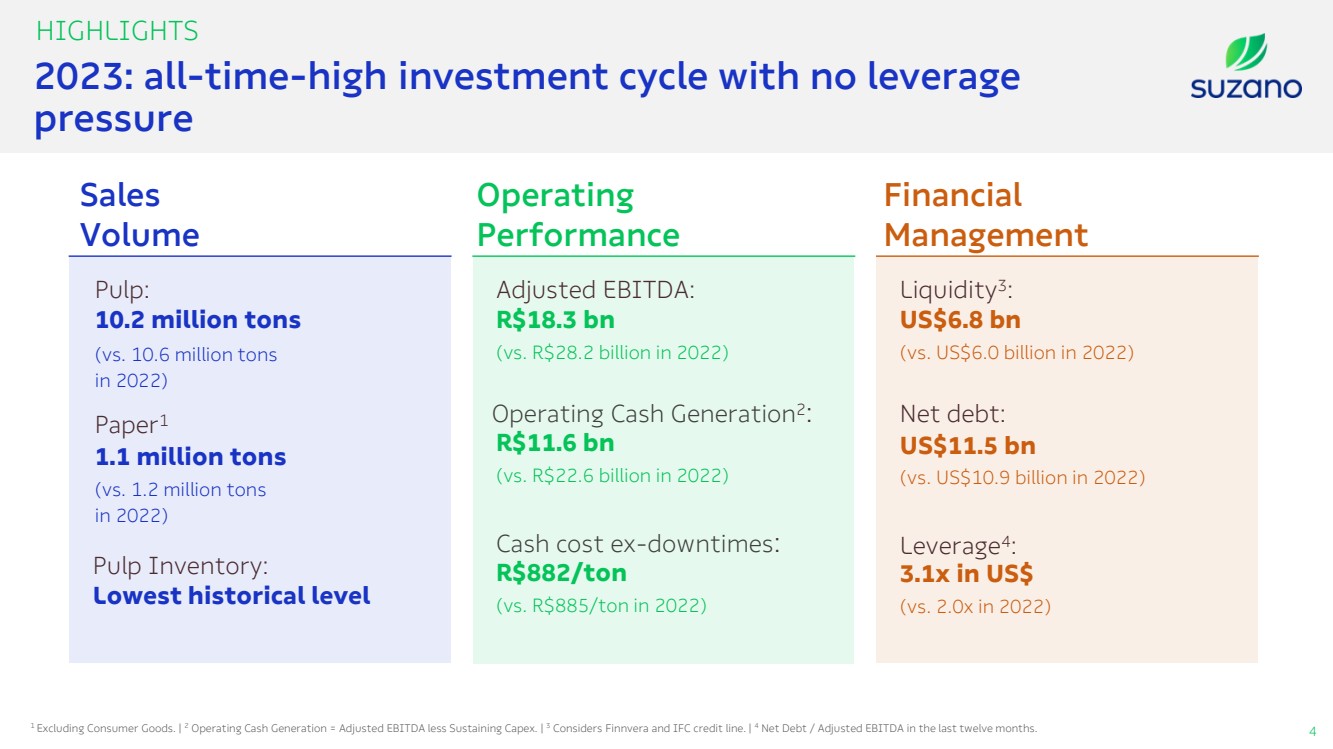
| 2023: all-time-high investment cycle with no leverage
pressure
4
HIGHLIGHTS
1 Excluding Consumer Goods. | 2 Operating Cash Generation = Adjusted EBITDA less Sustaining Capex. | 3 Considers Finnvera and IFC credit line. | 4 Net Debt / Adjusted EBITDA in the last twelve months.
Adjusted EBITDA: Liquidity3
:
Sales
Volume
Financial
Management
Operating
Performance
10.2 million tons
(vs. 10.6 million tons
in 2022)
Pulp:
1.1 million tons
(vs. 1.2 million tons
in 2022)
Paper1
Pulp Inventory:
Lowest historical level
Operating Cash Generation2
:
Cash cost ex-downtimes:
R$18.3 bn
(vs. R$28.2 billion in 2022)
R$11.6 bn
(vs. R$22.6 billion in 2022)
R$882/ton
(vs. R$885/ton in 2022)
US$11.5 bn
(vs. US$10.9 billion in 2022)
Leverage4
:
US$6.8 bn
(vs. US$6.0 billion in 2022)
Net debt:
3.1x in US$
(vs. 2.0x in 2022) |
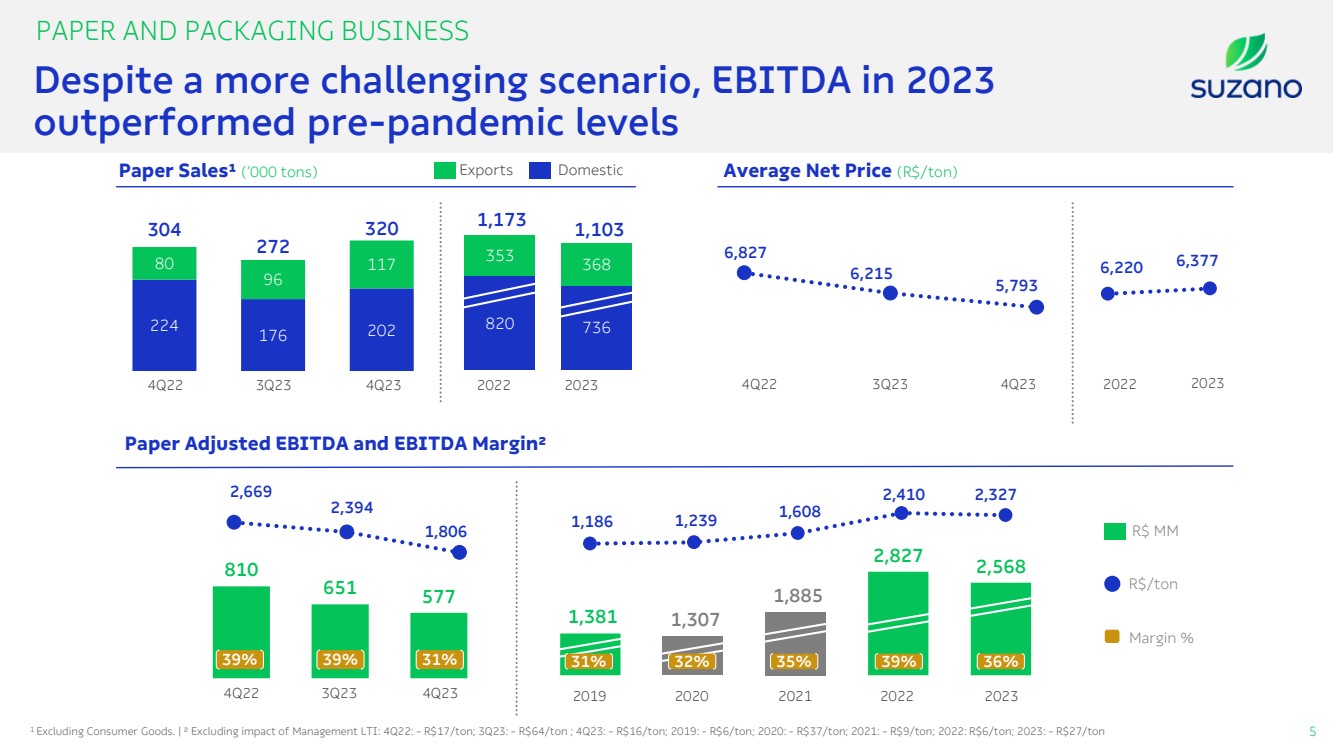
| 1,186 1,239 1,608
2,410 2,327
6,220 6,377 6,827
6,215
5,793
820 736
353 368
1,173 1,103
2,669
2,394
1,806
Paper Sales¹ (‘000 tons) Average Net Price (R$/ton)
5
4Q22 3Q23 4Q23 2022
224 176 202
80
96
117
304
272
320
810
651 577
4Q22 3Q23
4Q22 3Q23 4Q23 2023
Paper Adjusted EBITDA and EBITDA Margin²
R$ MM
R$/ton
Margin %
PAPER AND PACKAGING BUSINESS
Despite a more challenging scenario, EBITDA in 2023
outperformed pre-pandemic levels
1 Excluding Consumer Goods. | ² Excluding impact of Management LTI: 4Q22: - R$17/ton; 3Q23: - R$64/ton ; 4Q23: - R$16/ton; 2019: - R$6/ton; 2020: - R$37/ton; 2021: - R$9/ton; 2022: R$6/ton; 2023: - R$27/ton
2022 2023
1,381 1,307
1,885
2,827 2,568
39% 39% 31%
4Q23 2022 2023
39% 36%
2019 2020 2021
31% 32% 35%
Exports Domestic |
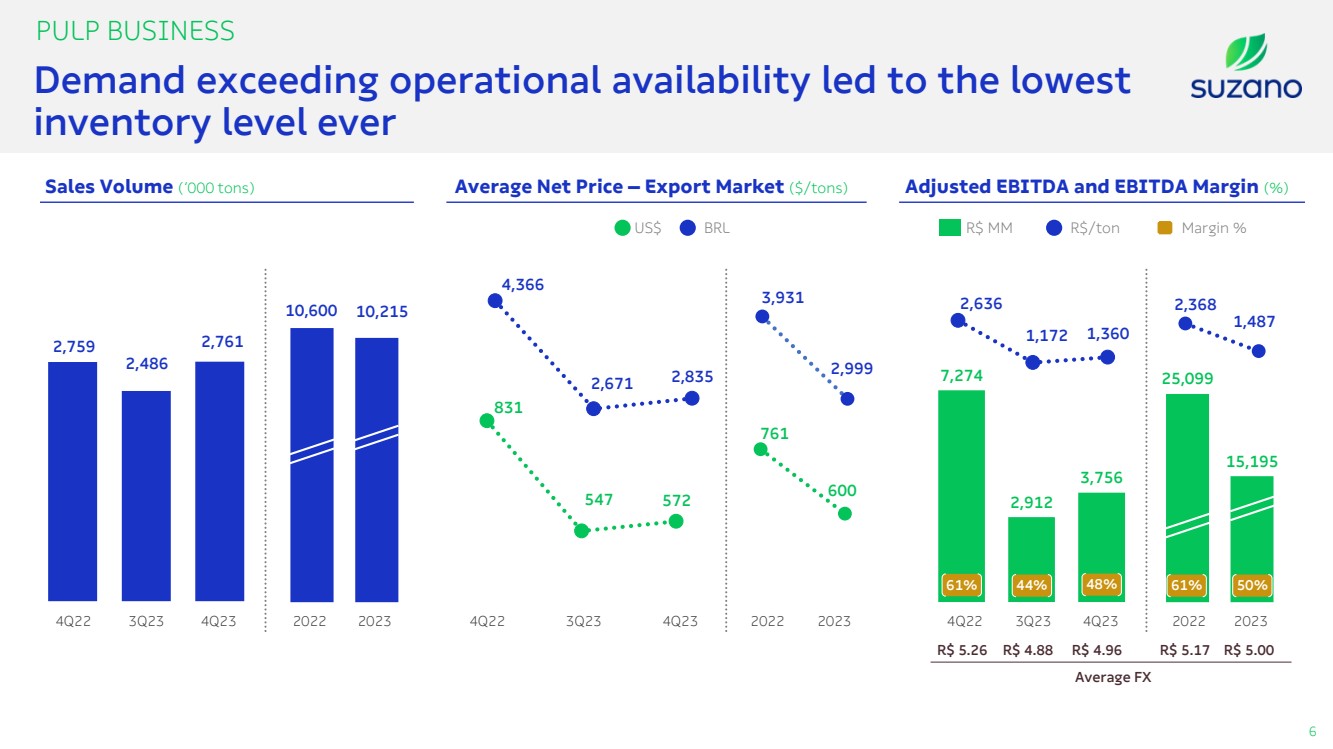
| 831
547 572
3,931
2,999
Average FX
7,274
2,912
3,756
761
600
2,759
2,486
2,761
PULP BUSINESS
Sales Volume (‘000 tons)
4Q22 3Q23 4Q23
10,600 10,215
2022
Average Net Price – Export Market ($/tons) Adjusted EBITDA and EBITDA Margin (%)
25,099
15,195
4Q22 3Q23 4Q23 2022
R$ 5.26 R$ 4.88 R$ 4.96 R$ 5.17
Demand exceeding operational availability led to the lowest
inventory level ever
6
2,636
1,172 1,360
R$ MM R$/ton Margin %
4Q22 3Q23 4Q23 2023
4,366
2,671 2,835
US$ BRL
61% 44% 48% 61%
2023 2022 2023
R$ 5.00
50%
2,368
1,487 |
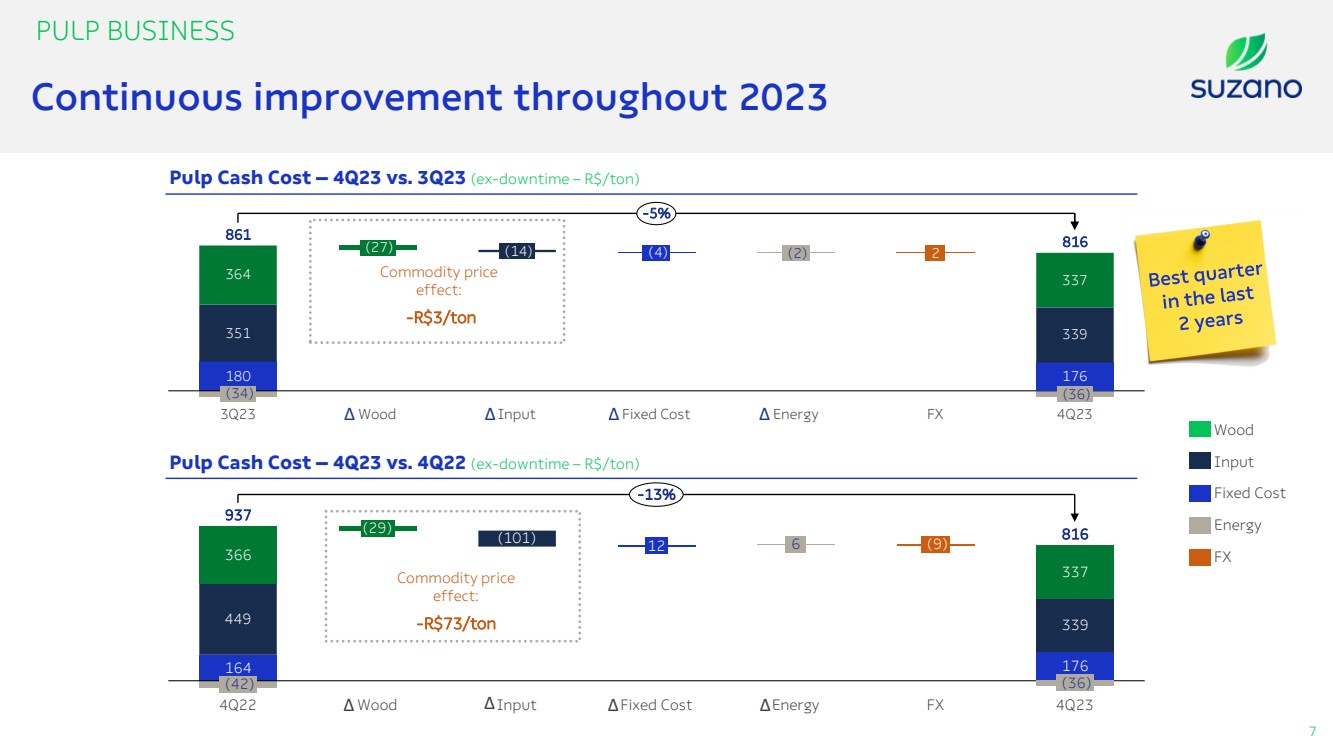
| 164 176
366
339
337
449
(42)
4Q22
(29)
Wood
(101)
Input
12
Fixed Cost
6
Energy
(9)
FX
(36)
4Q23
937
816
-13%
180
351 339
364 337
(34)
3Q23
(27)
Wood
(14)
Input
(4)
Fixed Cost
(2)
Energy
2
FX
176
(36)
4Q23
861 816
-5%
PULP BUSINESS
Pulp Cash Cost – 4Q23 vs. 3Q23 (ex-downtime – R$/ton)
Pulp Cash Cost – 4Q23 vs. 4Q22 (ex-downtime – R$/ton)
7
Continuous improvement throughout 2023
Commodity price
effect:
-R$3/ton
Commodity price
effect:
-R$73/ton
Δ Δ Δ Δ
Δ Δ Δ Δ
Wood
Input
Fixed Cost
Energy
FX |
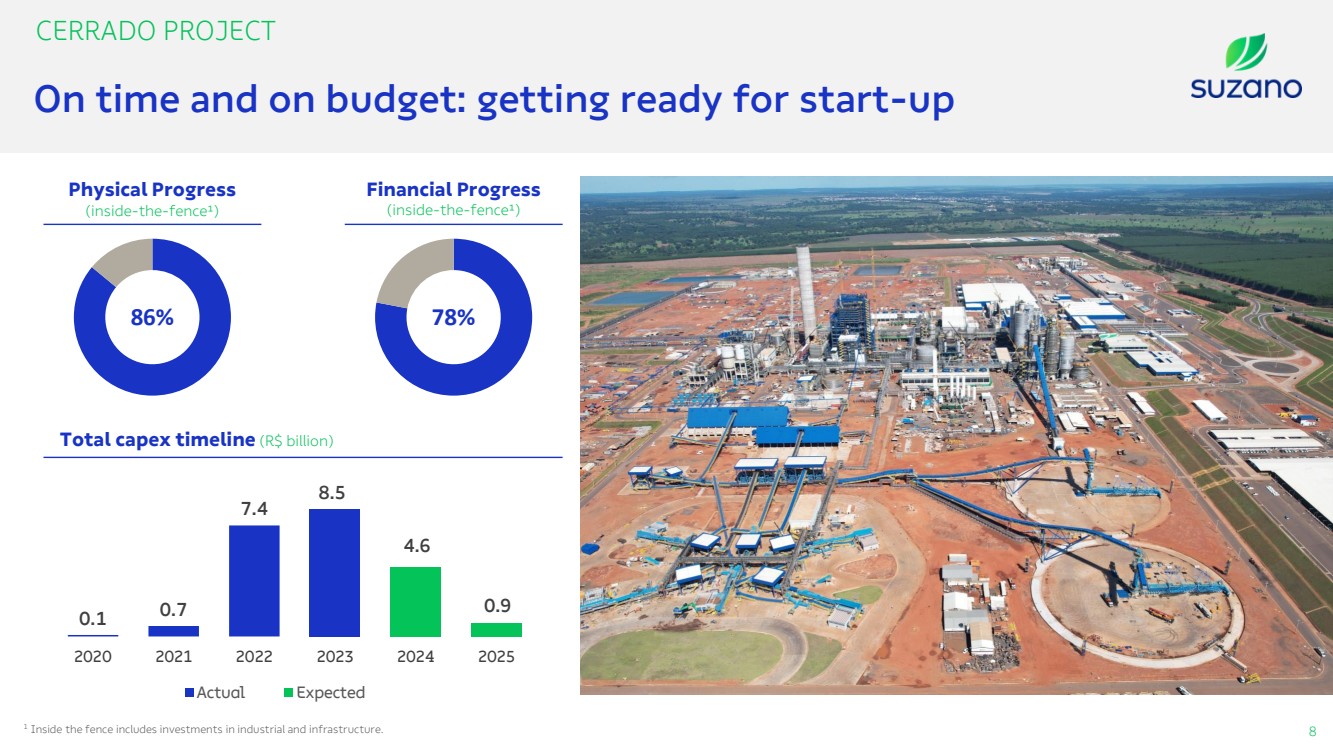
| Total capex timeline (R$ billion)
CERRADO PROJECT
On time and on budget: getting ready for start-up
8
1 Inside the fence includes investments in industrial and infrastructure.
Physical Progress
(inside-the-fence¹)
78%
Financial Progress
(inside-the-fence¹)
86%
8.5
4.6
0.1 0.7
7.4
0.9
2020 2021 2022 2023 2024 2025
Actual Expected |
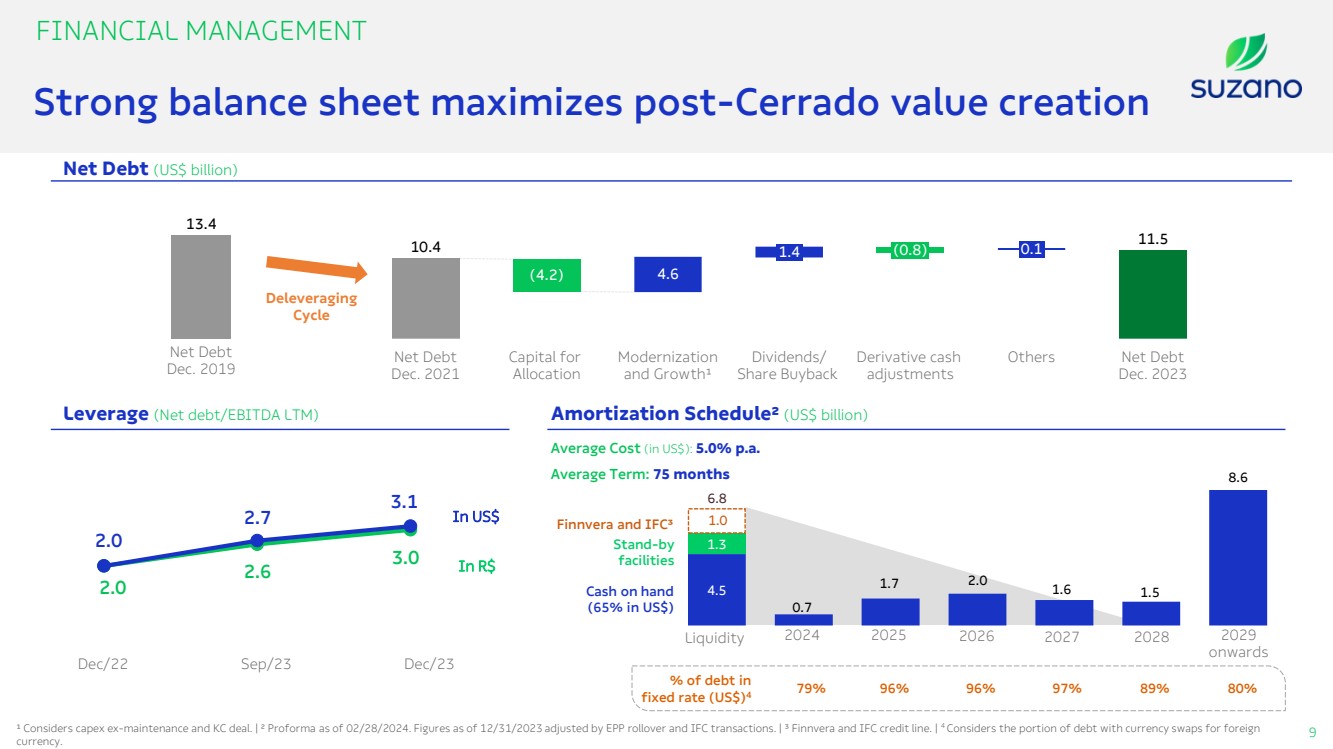
| 4.5
0.7
1.7 2.0 1.6 1.5
8.6
1.3
Net Debt (US$ billion)
9
2.0
2.6
3.0
2.0
2.7
3.1
Dec/22 Sep/23 Dec/23
In R$
In US$
¹ Considers capex ex-maintenance and KC deal. | ² Proforma as of 02/28/2024. Figures as of 12/31/2023 adjusted by EPP rollover and IFC transactions. | ³ Finnvera and IFC credit line. | 4 Considers the portion of debt with currency swaps for foreign
currency.
Amortization Schedule² (US$ billion)
Cash on hand
(65% in US$)
Stand-by
facilities
Leverage (Net debt/EBITDA LTM)
Average Cost (in US$): 5.0% p.a.
Average Term: 75 months
Liquidity 2024 2025 2026 2027 2029
onwards
2028
6.8
% of debt in
fixed rate (US$)4
79% 96% 96% 97% 89% 80%
Finnvera and IFC³ 1.0
FINANCIAL MANAGEMENT
Strong balance sheet maximizes post-Cerrado value creation
10.4 11.5
4.6
Net Debt
Dec. 2021
(4.2)
Capital for
Allocation
Modernization
and Growth¹
1.4
Dividends/
Share Buyback
(0.8)
Derivative cash
adjustments
0.1
Others Net Debt
Dec. 2023
13.4
Net Debt
Dec. 2019
Deleveraging
Cycle |
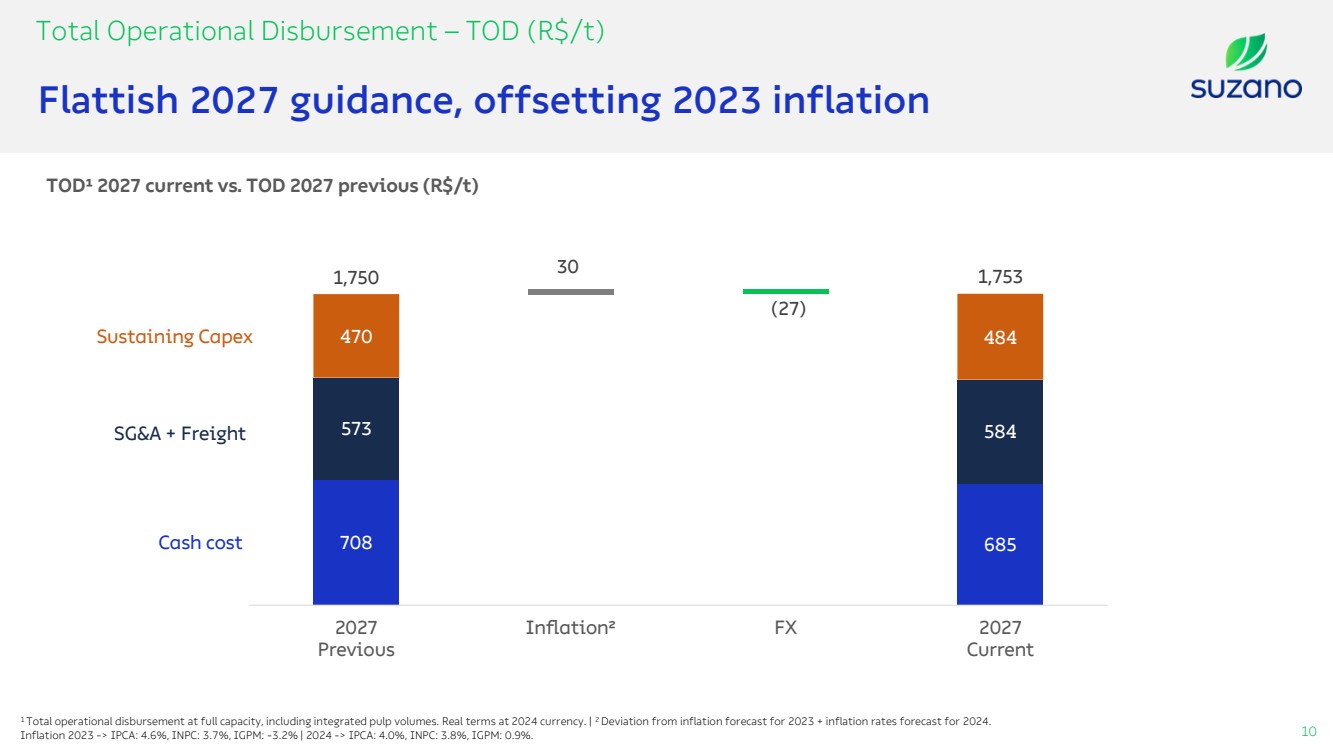
| Flattish 2027 guidance, offsetting 2023 inflation
10
708 685
573
30
(27)
584
470 484
1,750 1,753
2027
Previous
Inflation² FX 2027
Current
Cash cost
SG&A + Freight
Sustaining Capex
TOD¹ 2027 current vs. TOD 2027 previous (R$/t)
1 Total operational disbursement at full capacity, including integrated pulp volumes. Real terms at 2024 currency. | 2 Deviation from inflation forecast for 2023 + inflation rates forecast for 2024.
Inflation 2023 -> IPCA: 4.6%, INPC: 3.7%, IGPM: -3.2% | 2024 -> IPCA: 4.0%, INPC: 3.8%, IGPM: 0.9%.
Total Operational Disbursement – TOD (R$/t) |
| A 100 years startup |
| Q&A
4Q23
Investor Relations
www.suzano.com.br/ir
ri@suzano.com.br |
Suzano (NYSE:SUZ)
Historical Stock Chart
From Apr 2024 to May 2024

Suzano (NYSE:SUZ)
Historical Stock Chart
From May 2023 to May 2024
