Macy's Down Over 15% After 2Q Earnings Report -- Data Talk
August 14 2019 - 12:47PM
Dow Jones News
Macy's Inc. (M) is currently at $16.43, down $2.93 or 15.11%
-- Would be lowest close since Feb. 8, 2010, when it closed at
$16.27
-- On pace for largest percent decrease since Jan. 10, 2019,
when it fell 17.69%
-- Earlier Wednesday, Macy's posted a second-quarter profit of
$86 million, or 28 cents a share, down from $166 million, or 53
cents a share, a year earlier. Excluding impairment and other
costs, adjusted earnings were also 28 cents a share, below the 46
cents a share analysts polled by FactSet were looking for
-- For the current fiscal year, the company lowered its earnings
guidance by 20 cents. Excluding settlement charges, impairment and
other costs, the company now forecasts adjusted earnings per share
of $2.85 to $3.05 for the year, compared with its previous estimate
of $3.05 to $3.25
-- Currently down five of the past six days
-- Down 27.69% month-to-date
-- Down 44.81% year-to-date
-- Down 53.24% from 52 weeks ago (Aug. 15, 2018), when it closed
at $35.15
-- Would be a new 52-week closing low
-- Worst performer in the S&P 500 today
-- Fourth-most-active stock in the S&P 500 today
All data as of 12:07:08 PM
Source: Dow Jones Market Data, FactSet
(END) Dow Jones Newswires
August 14, 2019 12:32 ET (16:32 GMT)
Copyright (c) 2019 Dow Jones & Company, Inc.
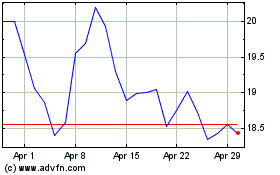
Macys (NYSE:M)
Historical Stock Chart
From Aug 2024 to Sep 2024

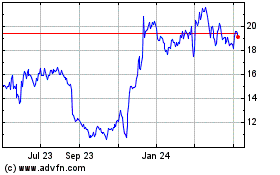
Macys (NYSE:M)
Historical Stock Chart
From Sep 2023 to Sep 2024
