FORM
6-K
SECURITIES AND EXCHANGE COMMISSION
Washington, D.C. 20549
Report
of Foreign Private Issuer
Pursuant
to Rule 13a-16 or 15d-16
of the Securities Exchange Act of 1934
For
the month of January, 2024
Commission
File Number 001-15266
BANK
OF CHILE
(Translation of registrant’s name into English)
Ahumada
251
Santiago, Chile
(Address of principal executive offices)
Indicate
by check mark whether the registrant files or will file annual reports under cover Form 20-F or Form 40-F.
Form
20-F ☒ Form 40-F ☐
BANCO
DE CHILE
REPORT ON FORM 6-K
Attached
is a Press Release issued by Banco de Chile (“the Bank”) on January 29, 2024, regarding its financial results for the Fourth
Quarter 2023 and as of December 31, 2023.
SIGNATURE
Pursuant
to the requirements of the Securities Exchange Act of 1934, the registrant has duly caused this report to be signed on its behalf by
the undersigned, thereunto duly authorized.
Date:
January 29, 2024
| |
|
Banco de Chile |
| |
|
|
| |
|
/s/ Eduardo Ebensperger O. |
| |
By: |
Eduardo Ebensperger O. |
| |
|
CEO |
2
Exhibit
99.1
| 1 Financial Management Review 4Q23 | January 2024 130 years contributing to the development of the country and its people. Quarterly & YTD Report
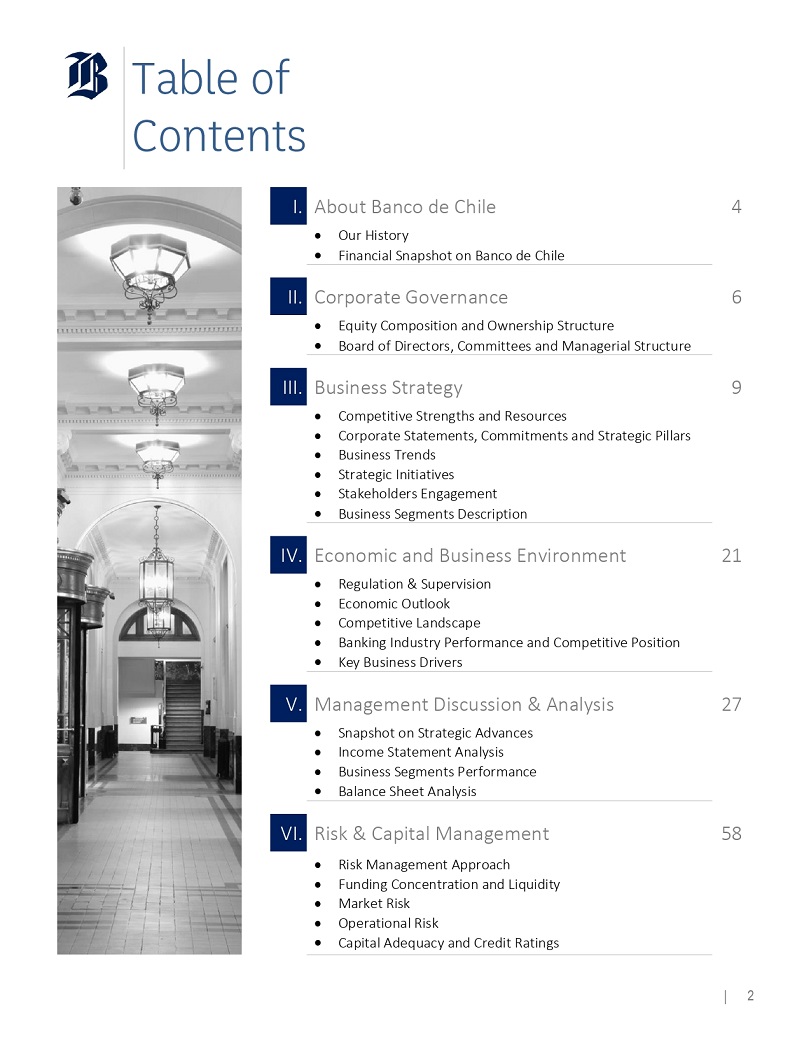
Table of Contents I. About Banco de Chile ● Our History 6 ● Financial Snapshot on Banco de Chile II. Corporate Governance ● Equity Composition and Ownership Structure 8 ● Board of Directors, Committees and Managerial Structure III. Business Strategy 11 ● Competitive Strengths and Resources ● Corporate Statements, Commitments and Strategic Pillars ● Business Trends ● Strategic Initiatives ● Stakeholders Engagement ● Business Segments Description IV. Economic and Business Environment 23 ● Regulation & Supervision ● Economic Outlook ● Competitive Landscape ● Banking Industry Performance and Competitive Position ● Key Business Drivers V. Management Discussion & Analysis 29 ● Snapshot on Strategic Advances ● Income Statement Analysis ● Business Segments Performance ● Balance Sheet Analysis VI. Risk & Capital Management 57 ● Risk Management Approach ● Funding Concentration and Liquidity ● Market Risk ● Operational Risk ● Capital Adequacy and Credit Ratings | 2
About this Report Basis for Presentation This financial report, which accompanies our quarterly financial statements, has been prepared as requested by the Chilean Financial Market Commission (CMF) in the Compendium of Accounting Standards for Banks while being elaborated in accordance with the IFRS Practice Statement 1 – Management Commentary as issued by the International Accounting Standards Board (IASB) . Figures included in this report “ Financial Management Review ” , for purposes of analysis, are based on both the financial statements and management information systems of Banco de Chile . Forward - Looking Information The information contained herein incorporates by reference statements which constitute “ forward - looking statements ” that include statements regarding the intent, belief or current expectations of our directors and officers with respect to our future operating performance . Such statements include any forecasts, projections and descriptions of anticipated cost savings or oth er synergies . You should be aware that any such forward - looking statements are not guarantees of future performance and may involve risks and uncertainties, and that actual results may differ from those set forth in the forward - looking statements as a result of various factors (including, without limitations, the actions of competitors, future global economic conditions, market conditions, foreign exchange rates, and operating and financial risks related to managing growth and integrating acquired businesses), many of which are beyond our control . The occurrence of any such factors not currently expected by us would significantly alter the results set forth in these statements . Factors that could cause actual results to differ materially and adversely include, but are not limited to : ⭬ changes in general economic, business or political or other conditions in Chile or changes in general economic or business conditions in Latin America; ⭬ changes in capital markets in general that may affect policies or attitudes toward lending to Chile or Chilean companies; ⭬ unexpected developments in certain existing litigation; ⭬ increased costs; ⭬ unanticipated increases in financing and other costs or the inability to obtain additional debt or equity financing on attractive terms; ⭬ natural disasters or pandemics; ⭬ the effect of tax laws or other kind of regulation on our business; ⭬ other risk factors as reported in our form 20F filed with the U.S. SEC. Undue reliance should not be placed on such statements, which speak only as of the date that they were made . Our independent public accountants have not examined or compiled the forward - looking statements and, accordingly, do not provide any assurance with respect to such statements . These cautionary statements should be considered in connection with any written or oral forward - looking statements that we may issue in the future . We do not undertake any obligation to release publicly any revisions to such forward - looking statements to reflect later events or circumstances or to reflect the occurrence of unanticipated events . | 3 Contacts Pablo Mejia Head of Investor Relations Investor Relations | Banco de Chile pmejiar@bancochile.cl Daniel Galarce Head of Financial Control & Capital Financial Control & Capital Area | Banco de Chile dgalarce@bancochile.cl
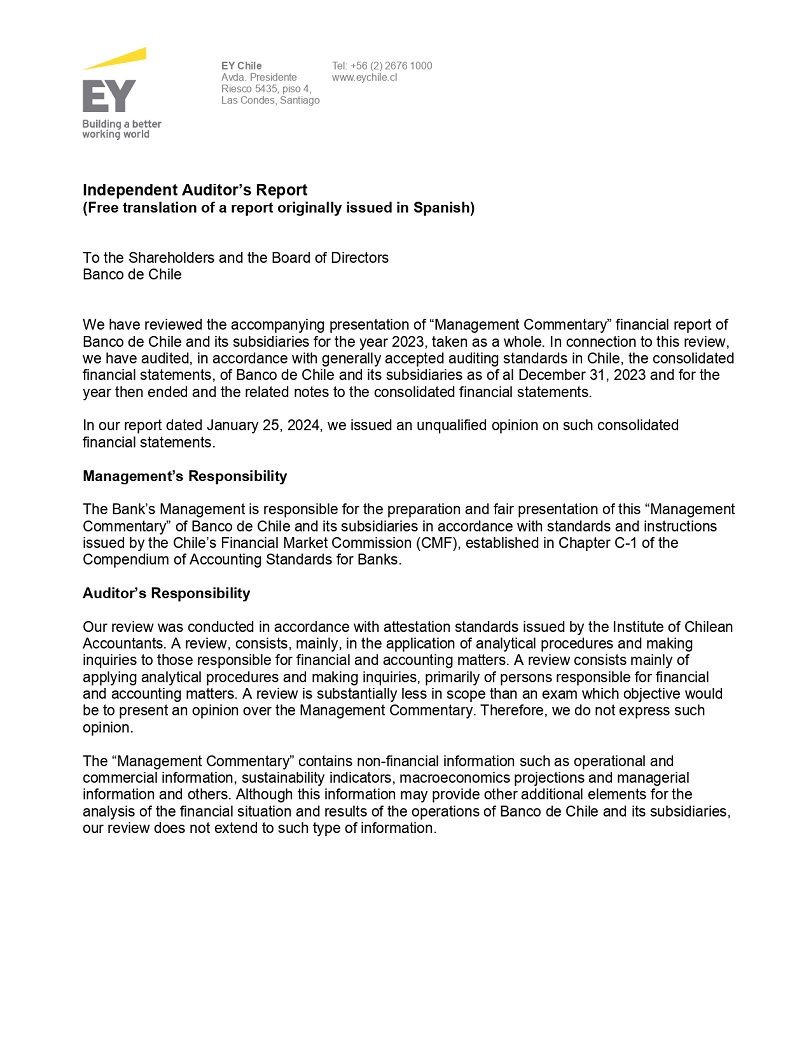
EY Chile Avda. Presidente
Riesco 5435, piso 4, Las Condes, Santiago Tel: +56 (2) 2676 1000 www.eychile.cl Independent Auditor’s Report (Free translation
of a report originally issued in Spanish) To the Shareholders and the Board of Directors Banco de Chile We have reviewed the accompanying
presentation of “Management Commentary” financial report of Banco de Chile and its subsidiaries for the year 2023, taken
as a whole. In connection to this review, we have audited, in accordance with generally accepted auditing standards in Chile, the consolidated
financial statements, of Banco de Chile and its subsidiaries as of al December 31, 2023 and for the year then ended and the related notes
to the consolidated financial statements. In our report dated January 25, 2024, we issued an unqualified opinion on such consolidated
financial statements. Management’s Responsibility The Bank’s Management is responsible for the preparation and fair presentation
of this “Management Commentary” of Banco de Chile and its subsidiaries in accordance with standards and instructions issued
by the Chile’s Financial Market Commission (CMF), established in Chapter C-1 of the Compendium of Accounting Standards for Banks.
Auditor’s Responsibility Our review was conducted in accordance with attestation standards issued by the Institute of Chilean Accountants.
A review, consists, mainly, in the application of analytical procedures and making inquiries to those responsible for financial and accounting
matters. A review consists mainly of applying analytical procedures and making inquiries, primarily of persons responsible for financial
and accounting matters. A review is substantially less in scope than an exam which objective would be to present an opinion over the
Management Commentary. Therefore, we do not express such opinion. The “Management Commentary” contains non-financial information
such as operational and commercial information, sustainability indicators, macroeconomics projections and managerial information and
others. Although this information may provide other additional elements for the analysis of the financial situation and results of the
operations of Banco de Chile and its subsidiaries, our review does not extend to such type of information.
The preparation and presentation
of the “Management Commentary” of Banco de Chile and its subsidiaries as of December 31, 2023 requires management to interpret
certain criteria, make determinations regarding the relevance of the information to be included and make estimates and assumptions that
affects the information presented. The “Management Commentary” of Banco de Chile and its subsidiaries as of December 31,
2023 includes current and prospective information that estimates the future impact of transactions and events that have occurred or are
expected to occur, estimates future expected sources of liquidity and financial resources, and also estimates operational and macroeconomic
trends and commitments and uncertainties. The results obtained in the future may differ significantly from the current evaluation of
this information presented by the management of Banco de Chile and its subsidiaries due the facts and circumstances frequently do not
occur as expected. Our review has considered such information only to the extent that it has been used in the preparation and presentation
of the financial information contained in the “Management Commentary” and not to express a conclusion on such information
itself. Conclusion Based in our review, we are not aware of any significant changes that should be made to the presentation of the “Management
Commentary” of Banco de Chile and its subsidiaries so that such presentation: i) Is in accordance with the elements required by
the standards and instructions from the Chile’s Financial Market Commission (CMF); ii) the historical financial amounts included
in the presentation have been correctly extracted from the consolidated financial statements of Banco de Chile and its subsidiaries and
iii) the information, determinations, estimates and underlying assumptions of Banco de Chile and its subsidiaries are consistent with
the bases used for the preparation of the financial information contained in such presentation. Eduardo Rodríguez B. EY Audit
Ltda. Santiago, Chile January 25, 2024
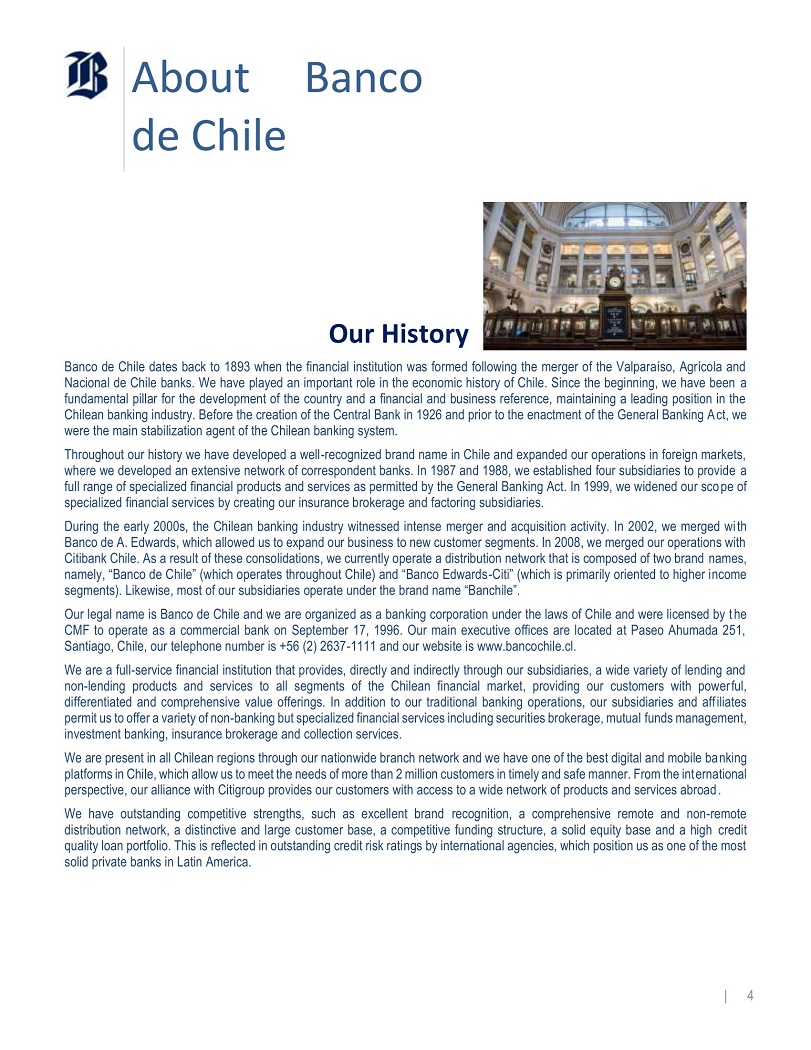
About de Chile Banco Our History Banco de Chile dates back to 1893 when the financial institution was formed following the merger of the Valparaíso, Agrícola and Nacional de Chile banks . We have played an important role in the economic history of Chile . Since the beginning, we have been a fundamental pillar for the development of the country and a financial and business reference, maintaining a leading position in the Chilean banking industry . Before the creation of the Central Bank in 1926 and prior to the enactment of the General Banking Act, we were the main stabilization agent of the Chilean banking system . Throughout our history we have developed a well - recognized brand name in Chile and expanded our operations in foreign markets, where we developed an extensive network of correspondent banks . In 1987 and 1988 , we established four subsidiaries to provide a full range of specialized financial products and services as permitted by the General Banking Act . In 1999 , we widened our sco pe of specialized financial services by creating our insurance brokerage and factoring subsidiaries . During the early 2000 s, the Chilean banking industry witnessed intense merger and acquisition activity . In 2002 , we merged wi th Banco de A . Edwards, which allowed us to expand our business to new customer segments . In 2008 , we merged our operations with Citibank Chile . As a result of these consolidations, we currently operate a distribution network that is composed of two brand names, namely, “Banco de Chile” (which operates throughout Chile) and “Banco Edwards - Citi” (which is primarily oriented to higher income segments) . Likewise, most of our subsidiaries operate under the brand name “Banchile” . Our legal name is Banco de Chile and we are organized as a banking corporation under the laws of Chile and were licensed by t he CMF to operate as a commercial bank on September 17 , 1996 . Our main executive offices are located at Paseo Ahumada 251 , Santiago, Chile, our telephone number is + 56 ( 2 ) 2637 - 1111 and our website is www . bancochile . cl . We are a full - service financial institution that provides, directly and indirectly through our subsidiaries, a wide variety of lending and non - lending products and services to all segments of the Chilean financial market, providing our customers with power ful, differentiated and comprehensive value offerings . In addition to our traditional banking operations, our subsidiaries and aff iliates permit us to offer a variety of non - banking but specialized financial services including securities brokerage, mutual funds management, investment banking, insurance brokerage and collection services . We are present in all Chilean regions through our nationwide branch network and we have one of the best digital and mobile ba nking platforms in Chile, which allow us to meet the needs of more than 2 million customers in timely and safe manner . From the international perspective, our alliance with Citigroup provides our customers with access to a wide network of products and services abroad . We have outstanding competitive strengths, such as excellent brand recognition, a comprehensive remote and non - remote distribution network, a distinctive and large customer base, a competitive funding structure, a solid equity base and a high credit quality loan portfolio . This is reflected in outstanding credit risk ratings by international agencies, which position us as one of the most solid private banks in Latin America . | 4
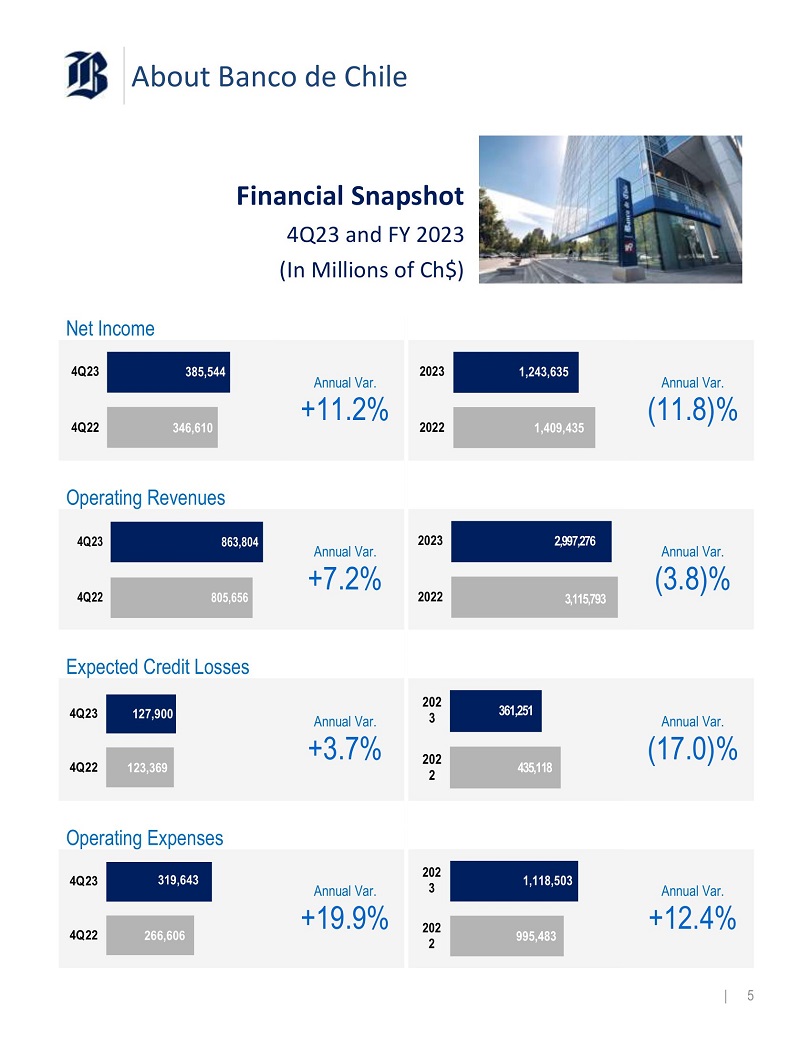
About Banco de Chile Financial Snapshot 4Q23 and FY 2023 (In Millions of Ch$) Net Income 346,610 385,544 4Q22 4Q23 Annual Var. +11.2% 1,409,435 1,243,635 2022 2023 Annual Var. (11.8)% Operating Revenues 805,656 863,804 4Q22 4Q23 Annual Var. +7.2% 3,115,793 2,997,276 2022 2023 Annual Var. (3.8)% Expected Credit Losses 123,369 127,900 4Q22 4Q23 Annual Var. +3.7% 435,118 361,251 202 2 202 3 Annual Var. (17.0)% Operating Expenses 266,606 319,643 4Q22 4Q23 Annual Var. +19.9% 995,483 1,118,503 202 2 202 3 Annual Var. +12.4% | 5
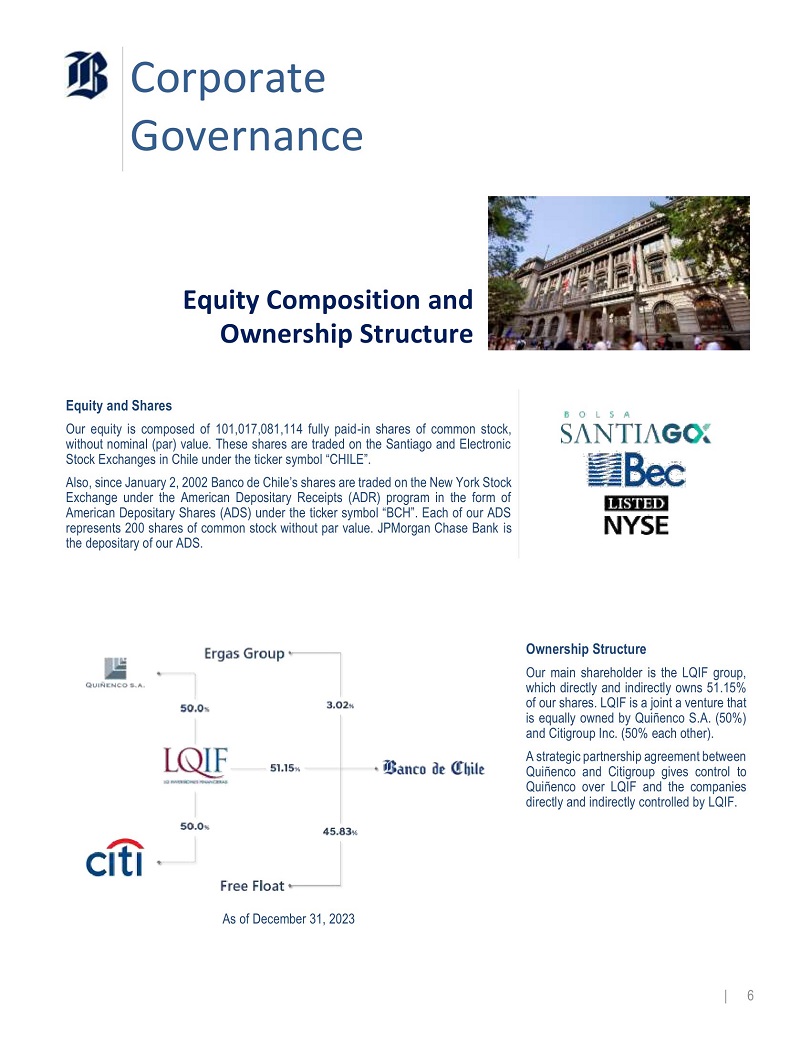
Corporate Governance Equity Composition and Ownership Structure Equity and Shares Our equity is composed of 101 , 017 , 081 , 114 fully paid - in shares of common stock, without nominal (par) value . These shares are traded on the Santiago and Electronic Stock Exchanges in Chile under the ticker symbol “CHILE” . Also, since January 2 , 2002 Banco de Chile’s shares are traded on the New York Stock Exchange under the American Depositary Receipts (ADR) program in the form of American Depositary Shares (ADS) under the ticker symbol “BCH” . Each of our ADS represents 200 shares of common stock without par value . JPMorgan Chase Bank is the depositary of our ADS . As of December 31, 2023 Ownership Structure Our main shareholder is the LQIF group, which directly and indirectly owns 51 . 15 % of our shares . LQIF is a joint a venture that is equally owned by Quiñenco S . A . ( 50 % ) and Citigroup Inc . ( 50 % each other) . A strategic partnership agreement between Quiñenco and Citigroup gives control to Quiñenco over LQIF and the companies directly and indirectly controlled by LQIF . | 6
Corporate Governance Board of Directors, Committees and Managerial Structure Board of Directors Our Board of Directors (Board) is the main corporate governance body and its most important duties include establishing strategic guidelines ; approving policies, procedures and mechanisms designed to meet the objectives of the corporate governance system ; and appointing a Chief Executive Officer . The Board is composed of eleven directors and two alternate directors, in accordance with our bylaws . The board is voted every three years . In March 2023 , the most recent election date, our shareholders elected new directors, of which eleven were proposed by LQIF (nine directors and two alternate directors) and other two members were proposed by shareholders other than LQIF, including an independent director . Currently, our Board is composed of three women and ten men . Our Board meets twice a month, except in February, when it meets once . Extraordinary sessions may be convened by the Chairman or by request of one or more regular directors . In the Board of Directors’ meeting carried out on September 28 , 2023 the Director and Vice Chairman Mr . Andrónico Luksic Craig submitted his resignation to these positions, which became effective on December 29 , 2023 . As agreed by our Board, both Director Mr . Francisco Pérez Mackenna and Mr . Patricio Jottar Nasrallah were appointed as Vice Chairman and Director, respectively . Board Committees Our Board delegates certain functions and activities to our committees to control, evaluate and report to the board of directors regarding specific matters which may affect our businesses. | 7
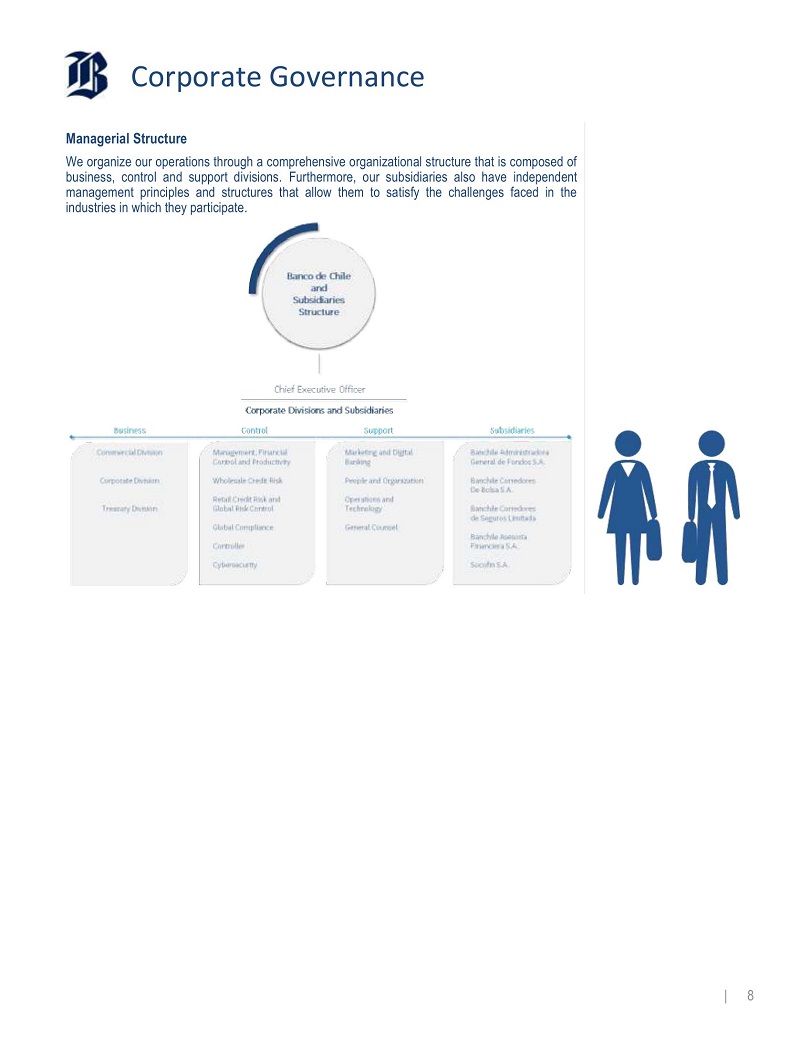
Corporate Governance Managerial Structure We organize our operations through a comprehensive organizational structure that is composed of business, control and support divisions . Furthermore, our subsidiaries also have independent management principles and structures that allow them to satisfy the challenges faced in the industries in which they participate . | 8
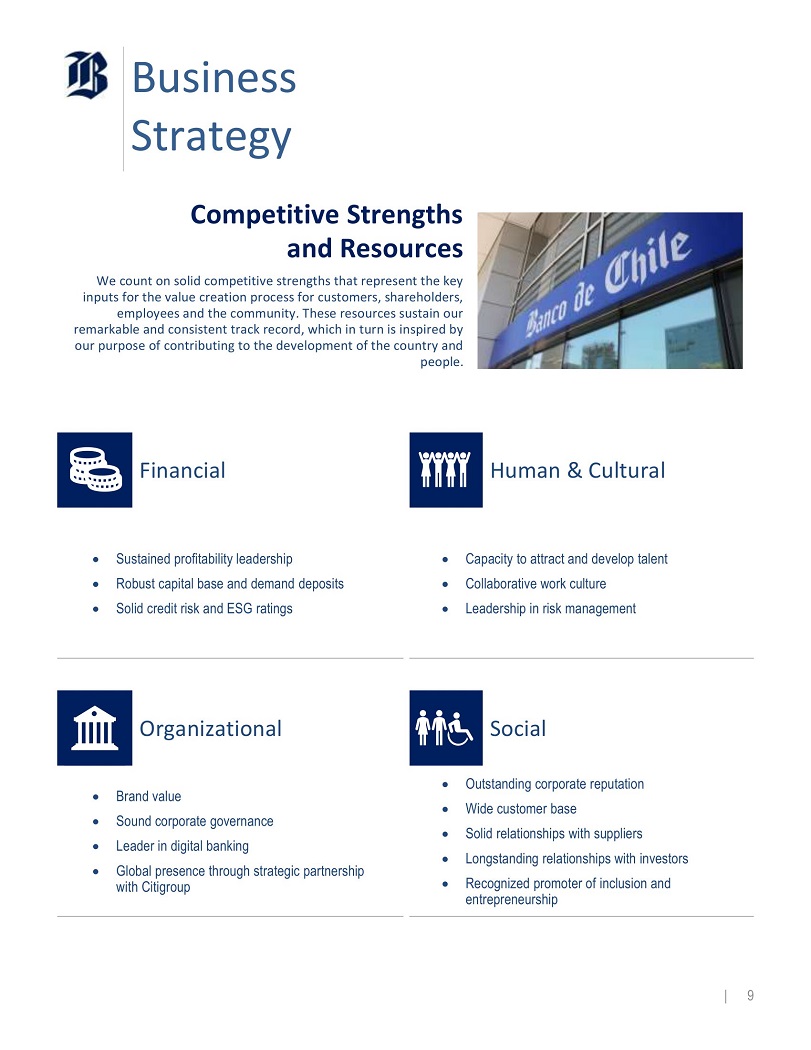
Business Strategy Competitive Strengths and Resources We count on solid competitive strengths that represent the key inputs for the value creation process for customers, shareholders, employees and the community. These resources sustain our remarkable and consistent track record, which in turn is inspired by our purpose of contributing to the development of the country and people. Financial Human & Cultural ● Sustained profitability leadership ● Robust capital base and demand deposits ● Solid credit risk and ESG ratings ● Capacity to attract and develop talent ● Collaborative work culture ● Leadership in risk management Organizational Social ● Brand value ● Sound corporate governance ● Leader in digital banking ● Global presence through strategic partnership with Citigroup ● Outstanding corporate reputation ● Wide customer base ● Solid relationships with suppliers ● Longstanding relationships with investors ● Recognized promoter of inclusion and entrepreneurship | 9

Business Strategy Corporate Statements, Commitments and Strategic Pillars Purpose Mission To contribute to the development of the country and its people. We are a leading, globally - connected financial corporation with a prestigious business tradition. We provide financial services of excellence to each customer segment, offering creative, agile and effective solutions and thus ensuring value creation for our shareholders, our employees and the community at large. Vision Corporate Values In everything we do, we constantly strive to be the best bank for our customers, the best place to work, and the best investment for our shareholders. We do so in a way that demonstrates our commitment to the people in our organization and the community in general. | 10

Business Strategy Commitment Our Customers We pursue to be the bank with the best service quality, offering innovative, simple and secure products and services designed to meet the needs and aspirations of each segment, with timely, agile and proactive service in order to build trusted and long - term relationships . To achieve this we strive to continuously develop always - available service channels that allow fluid and timely communication, while counting on employees devoted to customer service that also have digital knowledge . Our Staff We are certain that our team is a distinctive asset and a solid competitive advantage in the industry . This is based on their commitment, dedication and excellence . For this reason, we offer development and growth opportunities based on merit, providing competitive compensation and economic and welfare benefits . At the same time, we seek to promote a respectful, friendly and collaborative work environment in a place that has suitable technological tools and infrastructure . We build a homogeneous and distinctive culture, based on corporate commitments and values through the involvement in social activities, in order to become a Corporation distinguished as the best place to work and the best team in Chilean banking industry . Our Shareholders We honor our shareholders' confidence by maximizing the company's value, with responsibility, prudence and a long - term business vision . We deploy our business strategy based on appropriate risk management and a culture of operational excellence that allows us to project the sustainable leadership of the corporation . Our Community We are convinced that our success is linked to the sustainable development of our country and the community . That is why in our daily actions we reflect our commitment to community by supporting diverse initiatives to overcome adversity, through the development of internal policies and being present in emblematic solidarity crusades . We are committed to respecting diversity and inclusion, entrepreneurship, environmental care and equality and governance dimensions . | 11
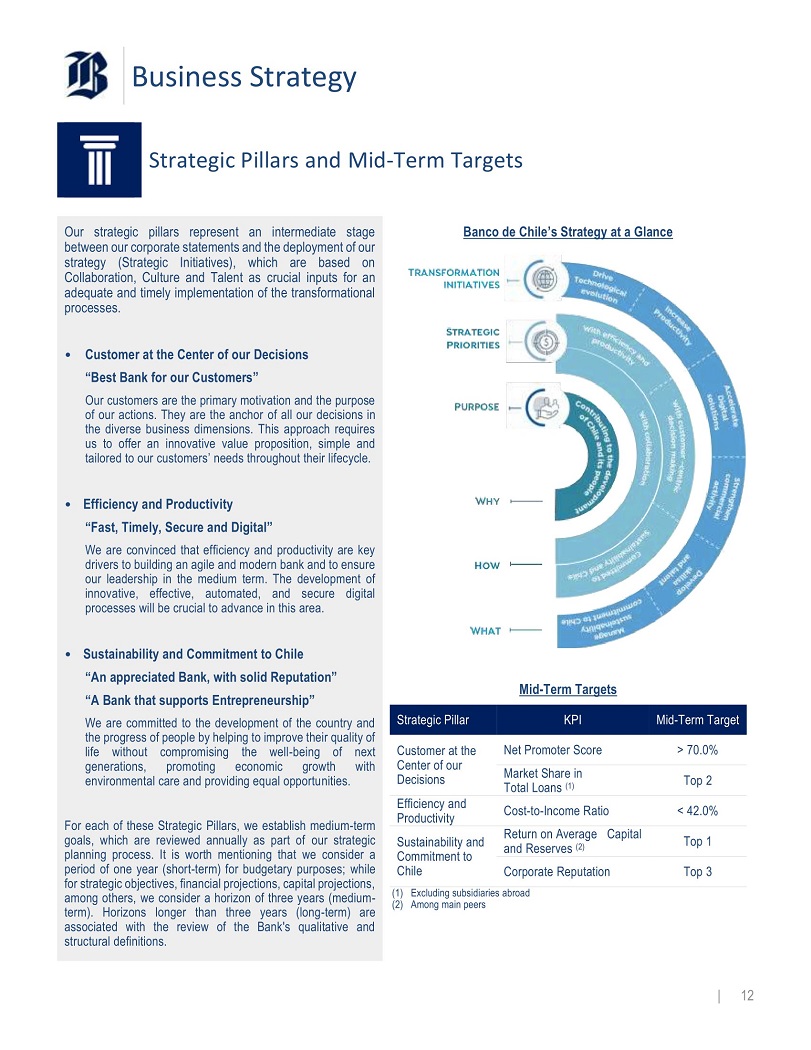
Business Strategy Strategic Pillars and Mid - Term Targets Our strategic pillars represent an intermediate stage between our corporate statements and the deployment of our strategy (Strategic Initiatives), which are based on Collaboration, Culture and Talent as crucial inputs for an adequate and timely implementation of the transformational processes . • Customer at the Center of our Decisions “Best Bank for our Customers” Our customers are the primary motivation and the purpose of our actions . They are the anchor of all our decisions in the diverse business dimensions . This approach requires us to offer an innovative value proposition, simple and tailored to our customers’ needs throughout their lifecycle . • Efficiency and Productivity “Fast, Timely, Secure and Digital” We are convinced that efficiency and productivity are key drivers to building an agile and modern bank and to ensure our leadership in the medium term . The development of innovative, effective, automated, and secure digital processes will be crucial to advance in this area . • Sustainability and Commitment to Chile “An appreciated Bank, with solid Reputation” “A Bank that supports Entrepreneurship” We are committed to the development of the country and the progress of people by helping to improve their quality of life without compromising the well - being of next generations, promoting economic growth with environmental care and providing equal opportunities . For each of these Strategic Pillars, we establish medium - term goals, which are reviewed annually as part of our strategic planning process . It is worth mentioning that we consider a period of one year (short - term) for budgetary purposes ; while for strategic objectives, financial projections, capital projections, among others, we consider a horizon of three years (medium - term) . Horizons longer than three years (long - term) are associated with the review of the Bank's qualitative and structural definitions . Banco de Chile’s Strategy at a Glance Mid - Term Targets Strategic Pillar KPI Mid - Term Target Customer at the Center of our Decisions Net Promoter Score > 70.0% Market Share in Total Loans (1) Top 2 Efficiency and Cost - to - Income Ratio < 42.0% Sustainability and Commitment to Chile Productivity Return on Average Capital and Reserves (2) Top 1 Corporate Reputation Top 3 (1) Excluding subsidiaries abroad (2) Among main peers | 12
Business Strategy Business Trends To achieve our strategic goals is crucial to know and understand the factors that could affect our performance in order to adapt our business strategy to face what we are not capable of controlling. The following factors represent main trends and changes affecting the banking business, which we address through our strategic initiatives: Social and Cultural Trends ⭬ New political and social cycle. ⭬ Diverse reforms promoted by the government with potential impact on the economic and business environment. ⭬ Global and local economic uncertainty. ⭬ Increased competition and regulatory requirements. ⭬ Generational and behavioral shifts: customer | worker. ⭬ Digital transformation and adaptation to new technologies. ⭬ Change in the company – customer relationship. ⭬ Climate change. ⭬ Consolidation of digital channels as the main means of interaction with customers and non - customers. ⭬ Business model modernization: Talent management and IT strategy to adapt to the new environment. ⭬ Sustainability requirements. ⭬ Cost base optimization to mitigate competition and regulatory changes. ⭬ Innovation in banking solutions. ⭬ Arising of non - traditional competitors. Trends in Banking Business | 13

Business Strategy Transformation Initiatives Our Directive Plan describes the roadmap of initiatives and projects we have defined to achieve our medium and long - term objectives . This roadmap is flexible by adapting to the changes in the business environment and trends while permitting us to prioritize and focus financial and human resources. The six dimensions that comprise our Directive Plan are described below: Accelerating Digital Solutions Recent Achievements This dimension crosses at dimensions related to commercial activities, efficiency and technological evolution by defining our strategic ambition on this matter : "being the digital benchmark in the Chilean banking industry by generating the best customer experience and pursuing sustained growth in the future" . Based on this strategy, we have strengthened and enhanced our offer of digital products and services while optimizing our processes and undertaking technological renovation for full accessibility of remote our channels . ⭬ Implementation of digital onboarding current account in USD for individuals and companies. ⭬ New functionalities enabled in websites and mobile apps for individuals and companies. ⭬ Integration of investment functionalities into corporate websites. ⭬ 100% digital adoption of CRM tools. ⭬ Smart technologies to improve phone - banking customer experience. ⭬ Significant advances in information management and data governance. ⭬ New contactless payment functionalities enabled through Apple Pay wallet. ⭬ Reduction in product onboarding time for individuals and companies through deepened digitization of both processes and value offerings. ⭬ First steps in the metaverse that pursue to enhance customer engagement and experience. Strengthen Commercial Activity Recent Achievements This aspect aims to improve our value propositions to match new trends and customer expectations, in order to sustain profitable business growth . Its projects and initiatives encompass channels, platforms, service centers and commercial dynamics, and it incorporates greater technology, efficiency, automation and simplicity into our processes . ⭬ Checking accounts sales increase above 10 % per year . ⭬ Investment products strenghtening through new sales - force management model, process digitalization and segmentation, which has allowed us to enhance value offerings through new mutual funds . ⭬ 1 st private bank in credit origination of state - guaranteed Fogape Chile Apoya loan program . ⭬ Strengthened brand positioning through improved loyalty programs and new digital marketing channels . ⭬ Successful commercial campaigns focused on residential mortgage loans, boosting annual origination above 60 % . ⭬ New developments in advanced analytics and AI that enabled us to enhance value offerings for individuals and companies, while increasing market share in consumer loans by 76 bp . ⭬ Implementation of new predictive models that allowed us to improve customer attrition rates . ⭬ Best investment bank by Euromoney and Global Finance . ⭬ Service quality : “Customers Satisfaction National Award” and “The best of the best Award” by Procalidad and 1 st place in Xperience Index by Praxis . | 14
Business Strategy Increasing Productivity Levels This aspect adds to our strategic plan and is driven by identifying opportunities based on gap analysis compared to best practice, in order to demonstrate that excellence in efficiency and productivity is an indispensable requirement for leadership . Recent Achievements ⭬ Optimization of cash management processes for SMEs. ⭬ New digital platform for collection services through self - service and online renegotiation. ⭬ Reengineering of branch service processes that improved service time. ⭬ Continued improvements in commercial productivity and business systematics. ⭬ Consolidation of digital sales on non - credit related insurance. ⭬ Decrease in custody and vault transportation costs by improving related processes and locations. ⭬ Change in the internal management processes by means of the adoption of a new corporate purchase model. ⭬ Time deposits profitability improvement through enhanced pricing management. ⭬ Adoption of a new process to prioritize annual Capex. Boosting Technological Evolution This aspect encourages the bank's technological architecture to progressively evolve, to keep it modern, flexible, scalable and in line with leading market practices, and establish highly automated and integrated software development processes that accelerate our ability to implement digital transformation . Recent Achievements ⭬ New technologies and self - service infrastructure in branches to improve customer experience. ⭬ Progress in the implementation of our multicloud strategy to prompting innovation, time - to - market of value offerings and productivity levels. ⭬ First stage in the modernization of our core banking platform and upgrade of our core derivatives management system, both in cloud infrastructure. ⭬ New CRM for individuals and SMEs segments, with a 360 ƒ vision and simplified processes. ⭬ Implementation of experimental generative AI initiatives to increase productivity in software development and provide support to the sales force. | 15
Business Strategy Developing Talent and Capabilities This workstream addresses the evolution and handling of cultural and behavioral changes within the organization with the aim of approaching new realities and relationship dynamics between us and our employees and among employees by means of promoting culture transformation, collective practices and individual behaviors based on the values, attributes of coexistence and intangible attributes of the corporation . This cultural transformation seeks to build a more agile, diverse, flexible and collaborative Bank ; with new boundaries in terms of diversity, inclusion, environmental care and relationships with the society ; as well as new ways of working, based on participation, experimentation, co - construction and cross collaboration . Recent Achievements ⭬ New training programs for the development of adaptive, managerial and leadership skills, labor ethics and collaboration . ⭬ Strengthened narrative and managerial responsibility with the cultural and strategic corporate pillars . ⭬ Development of distinctive skills, related to our identity and strategy, and technical skills, through the School of Leadership, the Commercial Academy and the Technology Academy . ⭬ New practices of integration and bonding, reinforcing our good interpersonal relationships, mutual respect and collaboration . ⭬ Implementation of "+Conectados" platform, with solutions for workers that had a positive impact on satisfaction, productivity and bonding . ⭬ Implementation of workday reduction to 39 hours per week and flexibility by means of teleworking, with a positive impact on quality of life . ⭬ Merco Talento Award : First place among Chilean Banks for tenth year in a row in talent attraction and retention . Strengthening ESG and Commitment to Chile This is a cross initiative that involves all the other five dimensions of our Directive Plan . This initiative is composed of the following pillars, that are also part of our sustainability strategy : ● diversity and inclusion, ● education and entrepreneurship, ● emergency response, ● contribution to the environment, and ● governance of sustainable management. The deployment of this initiative considers communication activities aimed at reinforcing corporate values and culture, stakeholder management, and building alliances with expert foundations and public and private organizations . Recent Achievements ⭬ Support actions to assist customers and communities affected by forest fires, rains and floods . ⭬ Deployment of supporting actions for women and SMEs through the 3 rd call for "Mujeres que Inspiran" program and the 8 th edition of "Desafío Emprendedor" national contest . ⭬ Implementation of corporate volunteering activities aimed at supporting social and educational organizations and senior citizen communities . ⭬ Strenghtened labor relationships on the grounds of five successfully negotiated collective bargaining agreements in advance . ⭬ Progress in incorporating ESG methodologies and criteria for the categorization and taxonomy of the credit portfolio . ⭬ Training in sustainable finance and climate change impacts on the banking industry for management levels . ⭬ Issuance of ESG bonds by ~USD 80 million under the Sustainability Financing Framework to finance enterprises led by women . ⭬ " 100 % digital insurance for greener squares" campaign . Planting of native trees and bushes in squares and parks throughout the country . ⭬ Continuation of our strategy to promote inclusion : (i) 45 years accompanying Teletón, (ii) Contribution to the Chilean Special Olympics Foundation, (iii) launching of the VI version of Expo Inclusión, and (iv) organization of the Chilean Open Copa Banco de Chile . ⭬ Strengthening of information and awareness campaigns for customers and the community on new cybersecurity threats and digital fraud . ⭬ Alliance between Banchile and Políglota to teach how to invest responsibly and learn English in a different way . ⭬ Improvement in the Sustainalytics ESG Risk Rating, achieving the best score within the local industry (as of May 2023 ) . ⭬ Ranked in fourth place, out of 100 companies in ESG, based on our commitment to the development of a sustainable country . | 16
Business Strategy Stakeholder Engagement Banco de Chile keeps several communication channels open with our stakeholders in order to gather information to answer questions and manage concerns regarding different issues. We also actively participate in social media and count on specific channels dedicated to managing inquiries and requirements. Stakeholders Engagement Objectives Mechanisms and/or Channels of Communication Frequency Customers ● Offer excellent service characterized by integrity, personalization, agility and proactivity in order to build long - term, trust - based relationships . ● Use permanently available service channels to keep customers informed in a timely and appropriate manner . ● Provide differentiated financial solutions featuring quality, innovative products and services for each customer segment . ● www.bancochile.c l ● Branches and ATMs ● Telephone banking service 600 637 37 37 ● Mobile applications ● https://cl.linkedin.com/company/banco - de - chile ● Twitter and Instagram:@bancodechile | @bancoedwards |@ayudaBancoChile ● Facebook: bancodechile | bancoedwards Ongoing Shareholders and Regulators ● Be the best investment option, maintaining a leading position by value of shares traded ● Promote operational efficiency and productivity in order to encourage prudent risk management based on integrity and transparency . ● Comply with the regulatory requirements defined by the correspondent authority . ● Keep a corporate governance and internal control environment that allow to manage risk and capital adequately . ● Shareholders’ meeting ● Annual Report & Form 20 - F ● Financial reporting ● Investor Relations: ir@bancochile.c l ● Webcasts ● Website ● CMF Reports belonging to both the Information System and the Risk System Frameworks. Annual Quarterly Monthly Ongoing Employees ● Offer merit - based development opportunities with competitive compensation and economic benefits. ● Promote a respectful, polite work environment in a location equipped with the appropriate technology and infrastructure. ● Intranet / Emails / SOY_DELCHILE App ● Competency Assessment ● Counseling Program (Programa Orienta) ● My Health Program (Programa Mi Salud) ● Quality of Life Program / Active Chile Program ● Point Bank / Team meetings ● Contact: comitedeetica@bancochile.c l apoyolaboral@bancochile.c l centroatencionpersonas@bancochile.c l Annual Ongoing Community ● Promote financial education. ● Facilitate a more equitable society that offers greater opportunities through inclusion of persons with disabilities. ● Manage the business in an environmentally respectful manner. ● Support SMEs and entrepreneurs in developing their businesses. ● Annual Report ● Contact: sostenibilidad@bancochile.c l ● www.bancochile.c l Ongoing Suppliers ● Build long - term collaborative supplier relationships based on transparency, competition, efficiency, respect and objectivity. ● Streamline and increase the effectiveness of processes for supplying goods and services. ● Ensure that services are hired and goods are acquired under market conditions. ● Ensure that the bank's obligations are paid in accordance with the terms and conditions agreed. ● proveedores@bancochile.c l Ongoing | 17
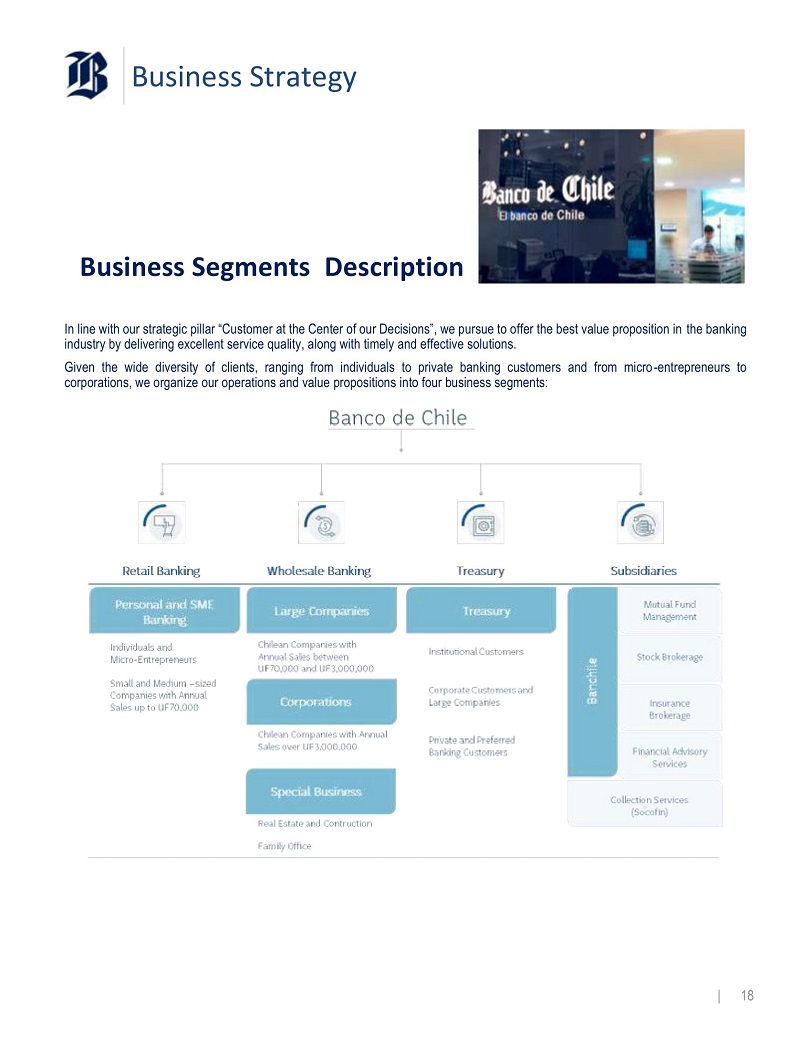
Business Strategy Business Segments Description In line with our strategic pillar “Customer at the Center of our Decisions”, we pursue to offer the best value proposition in the banking industry by delivering excellent service quality, along with timely and effective solutions. Given the wide diversity of clients, ranging from individuals to private banking customers and from micro - entrepreneurs to corporations, we organize our operations and value propositions into four business segments: | 18
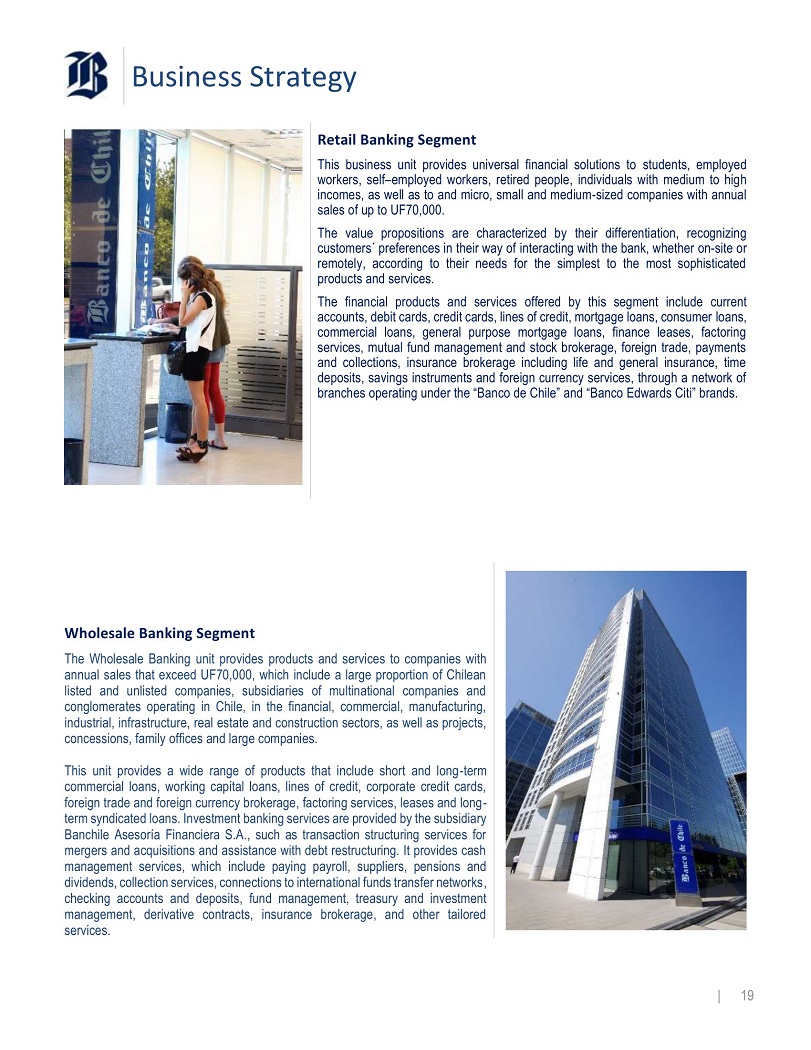
Business Strategy Retail Banking Segment This business unit provides universal financial solutions to students, employed workers, self – employed workers, retired people, individuals with medium to high incomes, as well as to and micro, small and medium - sized companies with annual sales of up to UF 70 , 000 . The value propositions are characterized by their differentiation, recognizing customers preferences in their way of interacting with the bank, whether on - site or remotely, according to their needs for the simplest to the most sophisticated products and services . The financial products and services offered by this segment include current accounts, debit cards, credit cards, lines of credit, mortgage loans, consumer loans, commercial loans, general purpose mortgage loans, finance leases, factoring services, mutual fund management and stock brokerage, foreign trade, payments and collections, insurance brokerage including life and general insurance, time deposits, savings instruments and foreign currency services, through a network of branches operating under the “Banco de Chile” and “Banco Edwards Citi” brands . Wholesale Banking Segment The Wholesale Banking unit provides products and services to companies with annual sales that exceed UF 70 , 000 , which include a large proportion of Chilean listed and unlisted companies, subsidiaries of multinational companies and conglomerates operating in Chile, in the financial, commercial, manufacturing, industrial, infrastructure, real estate and construction sectors, as well as projects, concessions, family offices and large companies . This unit provides a wide range of products that include short and long - term commercial loans, working capital loans, lines of credit, corporate credit cards, foreign trade and foreign currency brokerage, factoring services, leases and long - term syndicated loans . Investment banking services are provided by the subsidiary Banchile Asesoría Financiera S . A . , such as transaction structuring services for mergers and acquisitions and assistance with debt restructuring . It provides cash management services, which include paying payroll, suppliers, pensions and dividends, collection services, connections to international funds transfer networks, checking accounts and deposits, fund management, treasury and investment management, derivative contracts, insurance brokerage, and other tailored services . | 19
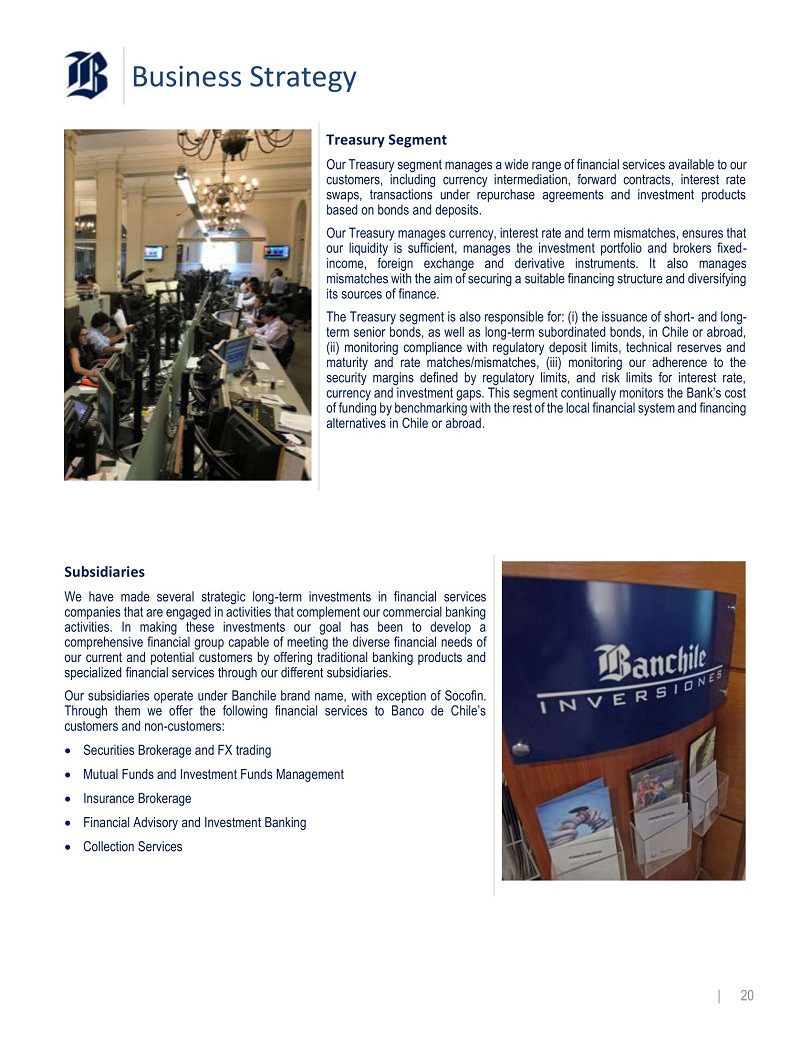
Business Strategy Treasury Segment Our Treasury segment manages a wide range of financial services available to our customers, including currency intermediation, forward contracts, interest rate swaps, transactions under repurchase agreements and investment products based on bonds and deposits . Our Treasury manages currency, interest rate and term mismatches, ensures that our liquidity is sufficient, manages the investment portfolio and brokers fixed - income, foreign exchange and derivative instruments . It also manages mismatches with the aim of securing a suitable financing structure and diversifying its sources of finance . The Treasury segment is also responsible for : (i) the issuance of short - and long - term senior bonds, as well as long - term subordinated bonds, in Chile or abroad, (ii) monitoring compliance with regulatory deposit limits, technical reserves and maturity and rate matches/mismatches, (iii) monitoring our adherence to the security margins defined by regulatory limits, and risk limits for interest rate, currency and investment gaps . This segment continually monitors the Bank’s cost of funding by benchmarking with the rest of the local financial system and financing alternatives in Chile or abroad . Subsidiaries We have made several strategic long - term investments in financial services companies that are engaged in activities that complement our commercial banking activities . In making these investments our goal has been to develop a comprehensive financial group capable of meeting the diverse financial needs of our current and potential customers by offering traditional banking products and specialized financial services through our different subsidiaries . Our subsidiaries operate under Banchile brand name, with exception of Socofin . Through them we offer the following financial services to Banco de Chile’s customers and non - customers : ● Securities Brokerage and FX trading ● Mutual Funds and Investment Funds Management ● Insurance Brokerage ● Financial Advisory and Investment Banking ● Collection Services | 20
Economic & Business Environment Regulation & Supervision Chilean banks are primarily subject to the General Banking Act and secondarily, to the extent not inconsistent with that law, the provisions of the Chilean Corporations Law governing publicly listed corporations, except for certain provisions that are expressly excluded. The main authorities regulating financial institutions in Chile are the Financial Market Commission ( “ CMF ” ) and the Chilean Central Bank. The CMF The CMF must regulate, oversee, sanction and manage the operation, stability and development of the Chilean financial market by easing the participation of market agents while keeping public trust . In order to do so, the CMF must have an overall and systemic vision by protecting interests of investors and insured agents . The CMF also can impose sanctions on the supervised entities . The CMF currently oversees the Chilean Financial Market (comprised of publicly traded companies, banks and financial institutions, insurance companies, insurance brokers, mutual funds and investment funds) . Regarding the specific powers of the CMF related to banking regulation, this entity authorizes the creation of new banks and has broad powers to interpret and enforce legal and regulatory requirements applicable to banks and financial institutions . Furthermore, in cases of noncompliance with its legal and regulatory requirements, the CMF has the ability to impose sanctions . In extreme cases, it can appoint, with the prior approval of the board of directors of the Central Bank, a provisional administrator to manage a bank . It also has the mandate to approve any amendment to a bank’s bylaws or any increase in its capital . The CMF examines all banks, usually at least once a year or more often, if necessary, under certain circumstances . Banks are required to submit unaudited financial statements to the CMF, on a monthly basis, and to publish their financial statements at least four times a year in their website or in a newspaper of national circulation . A bank’s financial statements as of December 31 of each year must be audited and submitted to the CMF together with the opinion of its independent auditors . Also, banks are required by the CMF to include in mid - year financial statements (as of June 30 of every fiscal year) an auditor’s limited review statement in accordance with Chilean GAAP . In addition, banks are required to provide extensive information regarding their operations at various periodic intervals to the CMF by means of specialized reports associated with business - related risk, products, debtors, transactions, distribution channels, among others . The Central Bank The Central Bank is an autonomous legal entity created under the framework of the Chilean Constitution . It is subject to its Ley Orgánica Constitucional (the “Organic Constitutional Law”) and the current Chilean Constitution . To the extent not inconsistent with its Organic Constitutional Law or the current Chilean Constitution, the Central Bank is also subject to general laws applicable to the private sector, but is not subject to the laws applicable to the public sector . The Central Bank is directed and administered by a board of directors composed of five members appointed by the President of Chile, subject to Senate approval . The legal purpose of the Central Bank is to maintain the stability of the Chilean peso, control inflation and the orderly functioning of Chile’s internal and external payment systems . The Central Bank’s powers include setting reserve requirements, regulating the amount of money and credit in circulation, and establishing regulations and guidelines regarding financial companies, foreign exchange (including the Formal Exchange Market) and bank deposit - taking activities . The SEC As we are listed on the New York Stock Exchange since January 1 st , 2002 through our ADR program, we are also subject to regulation and supervision of the Securities and Exchange Commission . We are required to file with SEC the form 20 F, including audited financial statements, as of December of each year in accordance with IFRS as issued by the International Accounting Standards Board . | 21
Economic & Business Environment Economic Outlook Since the second half of 2023 , the Chilean Economy has shown diverse signs of recovery . In the 3 Q 23 , the GDP grew 0 . 6 % on an annual basis, posting the first positive figure after three contractions in a row . Available information from Monthly Economic Activity Index (IMACEC) suggests the activity continued improving, as the economy expanded by 0 . 3 % and 1 . 2 % on an annual basis in October and November, respectively . The greater dynamism has been supported by advances in Manufacturing and Services, while the Commerce sector has reduced its pace of decline . This slight recovery came to offset the recession occurred between the 4 Q 22 and the 2 Q 23 . As such, the economy is likely to have not grown in 2023 . In fact, according to the Monetary Policy Report released in December, the Central Bank expects null GDP expansion in 2023 , based on the sharp decline of 4 . 6 % expected for in domestic demand and the positive contribution from net exports . This adjustment, however, has permitted to reduce the external imbalance of the economy, as reflected by an annual decline in the current account deficit from 10 % of GDP a year ago to 3 . 5 % in the 3 Q 23 . GDP Growth (Annual growth, %) - 0.7 - 0.8 0.6 - 2.3 4Q22 1Q23 2Q23 3Q23 4Q23f On a sequential basis, the economy has followed a trend of improvement in both 3 Q 23 and probably in 4 Q 23 (final data to be released in March 2024 ) . The slight recovery in activity has been due to : (i) lowered inflation, which has contributed to an increase in both real wages and disposable income ; (ii) the normalization in the fiscal policy stance, as fiscal spending has grown this year (from the 23 % real decline in 2022 ) ; and (iii) the absence of further political and institutional shocks in the local economy . Nevertheless, it is important to mention that the activity remains below the level reached in 2021 . 0.9 In this environment, the unemployment has remained relatively stable since mid - 2023 . In the quarter ended in November, the rate was 8 . 7 % , which was 80 bp . above the figure posted a year ago . This was explained by a 3 . 9 % annual expansion in the labor force and lower dynamism in total employment, which increased 2 . 9 % in the same period . Due to the acceleration in the labor force, the participation rate rose to 61 . 5 % while continuing to converge towards pre - pandemic levels . Several indicators, such as the Internet Job Ad index that posted the lowest level since mid - 2020 , allow us to predict further weakening in the labor market in coming quarters . CPI & Unemployment Rate (1) (In Percentage) 12.8 11.1 7.6 5.1 3.9 7.9 8.8 8.5 9.0 8.7 4Q22 1Q23 2Q23 3Q23 4Q23f CPI Unemployment (1) End of period CPI 12m variation and average unemployment rate for the quarter. On prices, headline inflation has continued falling . In December 2023 , the CPI posted an unexpected monthly drop of 0 . 5 % , led by lower prices of food and services . All core measures followed this trend, as the index that excludes food and energy prices that declined 0 . 4 % and tradable prices falling 1 . 1 % , all reflecting the existence of disinflationary forces . As a result, 12 - month inflation dropped reached the Central Bank’s target range of 2 . 0 % to 4 . 0 % for first time since June 2021 by posting 3 . 9 % in December 2023 . The core measure also showed a similar pattern by falling to 4 . 1 % , the lowest since August 2021 . Based on the above, the Central Bank’s Board continued to deploy the easing monetary cycle that began in July 2023 by taking the monetary policy interest rate to 8 . 25 % in December 2023 from the 11 . 25 % set in December 2022 . More importantly, the forward guidance foresees further rate cuts in 2024 . | 22
Economic & Business Environment Competitive Landscape The Chilean market for banking and other financial services is highly and increasingly competitive and consists of various market sectors . The most important sector is commercial banking with total loans (excluding operations of subsidiaries abroad) representing 86 % of the Chilean GDP as of December 31 , 2022 . The Chilean banking industry consisted of 17 banks, 16 of which were private sector banks and one state - owned bank, namely, Banco Estado . We face significant and increasing competition in all market segments in which we operate . As a comprehensive commercial bank that offers a wide range of services to all types of enterprises and individual customers, we deal with a variety of competitors, ranging from large private sector commercial banks to more specialized entities, such as “niche” banks . In addition, we face competition from other types of lenders, such as non - banking leasing, crowdfunding, factoring and automobile financing companies, especially in credit products, mutual funds, pension funds and insurance companies within the market for savings products, as well as insurance companies in the market for mortgage loans . Likewise, other non - traditional providers of financial services have emerged over the last years, such as e - commerce, local and foreign fintech companies, Telecom companies, like internet and mobile phone providers, and more recently some marketplaces that may set and provide offerings, in the form of temporary financing, directly to their customers or providers . These new ways of doing business are based on the disintermediation of traditional banking service providers while not being subject to the same capital requirements that banks are . Therefore, these providers represent a challenge for the traditional banking industry . Within the local banking industry, our primary competitors are the main private sector commercial banks in Chile, namely, Banco Santander - Chile, BCI, Scotiabank Chile, and Itaú . Nevertheless, we also face competition from Banco Estado . In the retail market, we compete with other private sector Chilean banks, as well as with Banco del Estado . Among private sector banks, we believe our strongest competitors in this market are Banco Santander — Chile, Scotiabank Chile and BCI, as these banks have developed diversified business strategies focused on both small and medium sized companies and lower to middle income segments of the Chilean population . In addition, we believe our strongest competitors in the high - income individual segment are Banco Santander — Chile, and Banco Bice, as these banks rely on specialized business models that provide wealth management and traditional banking services, as we do . In the wholesale market, we believe our strongest competitors are also Banco Santander - Chile, BCI, Itaú and Scotiabank Chile . Similarly, we believe these banks are our most significant competitors in the small and medium sized companies’ business segment . We also compete, mainly through our subsidiaries, with companies that offer non - banking specialized financial services in the higher - income individuals segment and the middle market and corporate segment such as Larrain Vial, BTG Pactual, Moneda Asset and CrediCorp, whose core businesses are stock brokerage, financial advisory and wealth management services . Other Chilean commercial banks also compete in these markets of specialized financial services, but they are less focused on such businesses . The Chilean banking industry has experienced increased levels of competition in recent years from domestic as well as foreign banks . This phenomenon has triggered a consolidation wave within the industry and the creation of more comprehensive banking entities that participate in most of our markets . Consequently, banks’ strategies have increasingly been focused on reducing costs and improving efficiency standards in order to compete effectively with the larger banks . | 23
Economic & Business Environment Banking Industry Performance and Competitive Position During 2023 , the performance of the local banking industry was characterized by 12 - month real contraction in total loans, particularly driven by the track followed by both commercial and consumer loans . Instead, decoupled from the economic slowdown, residential mortgage loans continued to grow steadily but at slower pace than those seen in previous years . Loan Growth (1) (12m % change, in real terms) - 2.8% - 4.7% - 2.7% - 5.7% - 5.8% 1.3% 1.7% 2.1% 2.4% 0.9% 0.4% - 2.4% - 2.5% - 4.5% - 3.8% - 1.6% - 2.0% - 2.1% - 4.7% - 8.5% Jun - 23 Dec - 22 Mar - 23 Total Loans Residential Loans Sep - 23 Nov - 23 Commercial Loans Consumer Loans (1) Figures do not include operations of subsidiaries abroad. Commercial loans were struck by the economic landscape, marked by both the uncertainty surrounding two consecutive constitutional process – finished in December 2023 – and a wide array of reforms sponsored by the government aimed at introducing significant changes to key economic fields . These factors would have discouraged companies from undertaking long - term investment projects that have also to deal with awkward approval processes, all of which explains the expected annual decline of 1 . 9 % in private investment for 2023 . In addition, consumer loans were hit by a contractionary monetary cycle that lasted longer than expected, which resulted in increased costs of borrowing and second - round effects on private consumption that is expected to contract 4 . 6 % in 2023 . In this environment, the Central Bank’s quarterly credit surveys have revealed a weakened demand for commercial loans from large companies and SMEs throughout 2023 , while offer conditions have remained restrictive, particularly for specific industries battered by the economic downturn (real estate & construction) . As for individuals, demand for consumer loans recovered moderately since the 2 Q 23 onwards while offer conditions do not appear to become stricter during the year . Based on these factors, the local banking industry reached total loans by Ch $ 231 , 214 , 750 million in the latest CMF report as of November 30 , 2023 (excluding subsidiaries abroad), indicating a 2 . 9 % nominal 12 - month growth and a real contraction of 2 . 0 % when adjusting by inflation . This evolution was supported by : (i) an annual real reduction of 4 . 7 % in commercial loans due to the drivers mentioned above for corporations and SMEs, and (ii) a real 12 - month decline of 2 . 1 % in consumer loans, driven by subdued demand for goods and services, on the grounds of the prevailing scenario of interest rates and increased unemployment, effects that were to some extent offset by the consolidation of automobile loans by a local bank in the 3 Q 23 . These trends were partly offset by an annual real expansion of 2 . 4 % in residential mortgage loans . Regarding liabilities, Demand Deposits continued the adjustment process by reaching Ch $ 63 , 875 , 541 million as of November 30 , 2023 , which denotes a 3 . 1 % nominal drop when compared to a year earlier . The negative growth, however, has slowed down in 2023 , indicating the current level of Demand Deposits is approaching the historical average of ~ 26 % , as depicted by a 27 . 6 % reciprocity ratio in relation to Total Loans as of November 30 , 2023 . As of the same date, Time Deposits amounted to Ch $ 107 , 250 , 726 million, which represented a 4 . 6 % annual nominal growth, which also appears to be a significant deceleration when compared to the expansion rates seen in 2022 and part of 2023 . On the other hand, Debt Issued evolved slightly above inflation, since notional amounts are mostly denominated in UF and banks have begun to issue long - term funding to replace schedule maturities . As for results, the industry achieved a net income of Ch $ 4 , 122 , 809 million as of November 30 , 2023 , denoting a annual decrease of Ch $ 1 , 043 , 823 million or 20 . 2 % . This change had primarily to do with : (i) Income Tax rising of Ch $ 430 , 366 million on an annual basis due to lower inflation (tax deductible), (ii) Operating Expenses growing Ch $ 404 , 094 million, mainly focused on administration and personnel, (iii) a tempered rise in Expected Credit Losses by Ch $ 26 , 576 million, given less favorable payment behavior that was to some extent compensated by lower additional provisions, and (iv) Operating Revenues declining Ch $ 182 , 786 million, due to lower inflation . | 24
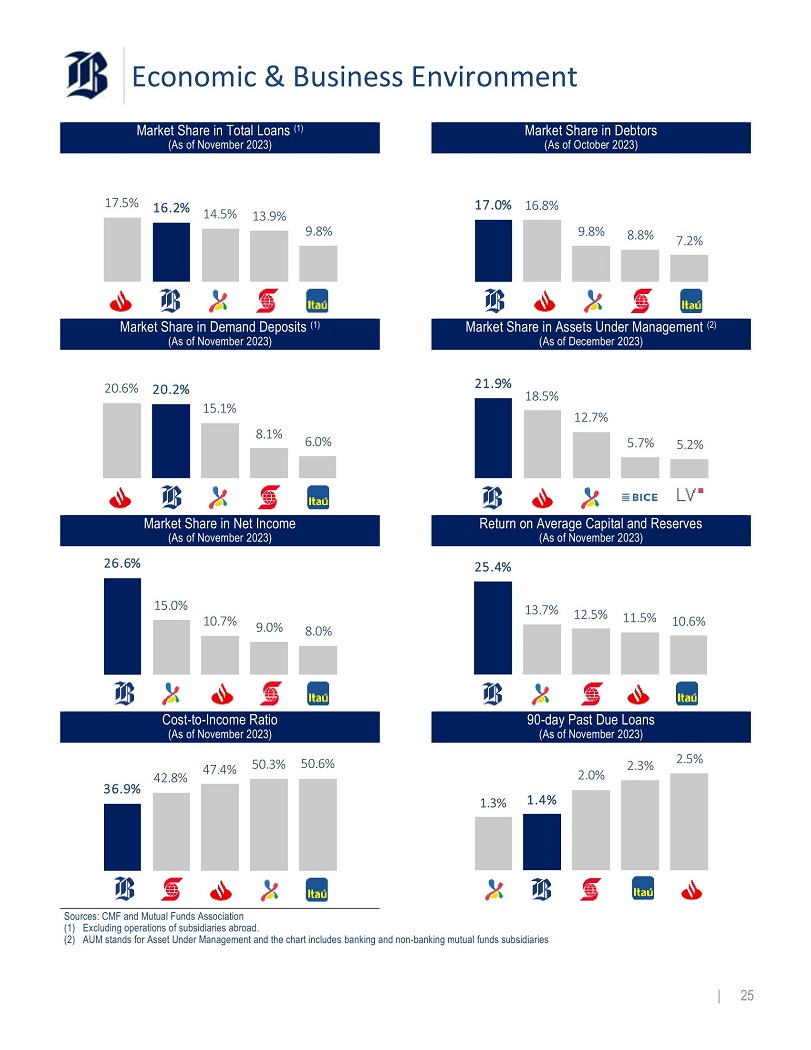
Economic & Business Environment Market Share in Total Loans (1) (As of November 2023) Market Share in Debtors (As of October 2023) 17.5% 16.2% 14.5% 13.9% 9.8% 17.0% 16.8% 9.8% 8.8% 7.2% Market Share in Demand Deposits (1) (As of November 2023) Market Share in Assets Under Management (2) (As of December 2023) 20.6% 20.2% 15.1% 8.1% 6.0% 21.9% 18.5% 12.7% 5.7% 5.2% Market Share in Net Income (As of November 2023) Return on Average Capital and Reserves (As of November 2023) 26.6% 15.0% 10.7% 9.0% 8.0% 25.4% 13.7% 12.5% 11.5% 10.6% Cost - to - Income Ratio (As of November 2023) 90 - day Past Due Loans (As of November 2023) 36.9% 42.8% 47.4% 50.3% 50.6% 1.3% 1.4% 2.0% 2.3% 2.5% Sources: CMF and Mutual Funds Association (1) Excluding operations of subsidiaries abroad. (2) AUM stands for Asset Under Management and the chart includes banking and non - banking mutual funds subsidiaries | 25
Economic & Business Environment Key Business Drivers Local Economy After the recession that affected the local economy between 2022 and mid - 2023 , we expect a positive cycle in the short - term, with positive annual growth rates for the foreseeable horizon . Particularly, the forecasted dynamics for some key drivers, such as a more expansionary monetary policy, lower inflation and still favourable scenarios for both the terms of trade and the external sector, should support growth in the near term . Specifically, we expect GDP to grow 1 . 5 % in 2024 , following the null expansion in 2023 . On prices, headline inflation should continue to normalize towards the Central Bank’s target range . This trend should result from different drivers, including : (i) the lagged effects of the tighter monetary policy implemented between 2021 and 2023 , (ii) lower tradable pressures resulting from the stability of the Chilean peso and the normalization of CPI for several trade partners, and (iii) the normalization of supply disruptions that occurred as a consequence of the pandemic . Given these factors – and our GDP expectations – we foresee inflation to be around 3 . 0 % by the end of 2024 . In line with this, we expect the Central Bank to continue the easing cycle by setting further cuts to the overnight rate to nearly 4 . 5 % in December of 2024 . These estimates are subject to risks that should be taken into consideration . From the external front : (i) GDP growth of the most relevant partners, such as China and the U . S, and (ii) armed conflicts in Eastern Europe and the Middle East, since they could affect the evolution of some critical factors for an open economy like Chile . On the local front, the evolution and the final outcome of economic and political reforms, including tax, pension and healthcare systems are points to keep in mind . Chilean Economy (1) 2024(e) ~1.5% GDP Growth ~3.0% CPI Variation (EoP) ~4.5% Monetary Policy Interest Rate (EoP) (1) Based on Banco de Chile’s own estimates and forecasts provided by the Chilean Central Bank in the last Monetary Policy Report as of December 2023. Local Banking Industry For 2024 our expectations on the evolution of the local banking industry are, as follows: ⭬ In terms of loan growth, we foresee a rebound on the grounds of better economic, particularly driven by growing consumption that would offset a slight contraction in private investment . Therefore, we expect a real growth in the range of 2 . 0 % - 2 . 5 % for the industry’s portfolio, which would be steered by both consumer and residential mortgage loans growing at the upper bound of this range and commercial loans rising slightly below the lower bound, all excluding operations of subsidiaries abroad . ⭬ From the funding perspective, as demand deposits would have already converged to normalized levels in 2023 , we expect a real annual expansion aligned with GDP growth by gradually approaching a reciprocity ratio in the range of 25 % - 26 % over total loans . Instead, given both decreasing interest rates and lower inflation compensation for customers, as well as looming pressures on liquidity and capital matters for some players, banks are expected to increase long - term funding rather than time deposits . Thus, we see time deposits to decline in the margin while debt issued should rise in line with loan growth . ⭬ Regarding net income, the industry’s NIM will be affected by mixed factors, such as : (i) the negative impact of the end of the FCIC, (ii) a positive effect of lower short - term interest rates on funding, and (iii) inflation returning to ~ 3 . 0 % . As such, we expect NIM standing at the range of 3 . 2 % - 3 . 5 % in 2024 . As for credit risk, past due loans and expected credit losses should reflect the effect of both an improved – but still constrained – economic outlook and the adoption of the standardized provisioning methodology for consumer loans . As such, we foresee ECLs in levels of ~ 1 . 4 % and Past - Due loans at ~ 2 . 2 % . Banking System (1) 2024(e) 5.0% - 5.5% Nominal Loan Growth ~26% DDA / Total Loans 3.2% - 3.5% Net Interest Margin 1.3% – 1.5% ECL / Avg. Loans 2.0% - 2.2% Past - Due Loans (>90d) (1) Based on Banco de Chile’s own estimates. | 26
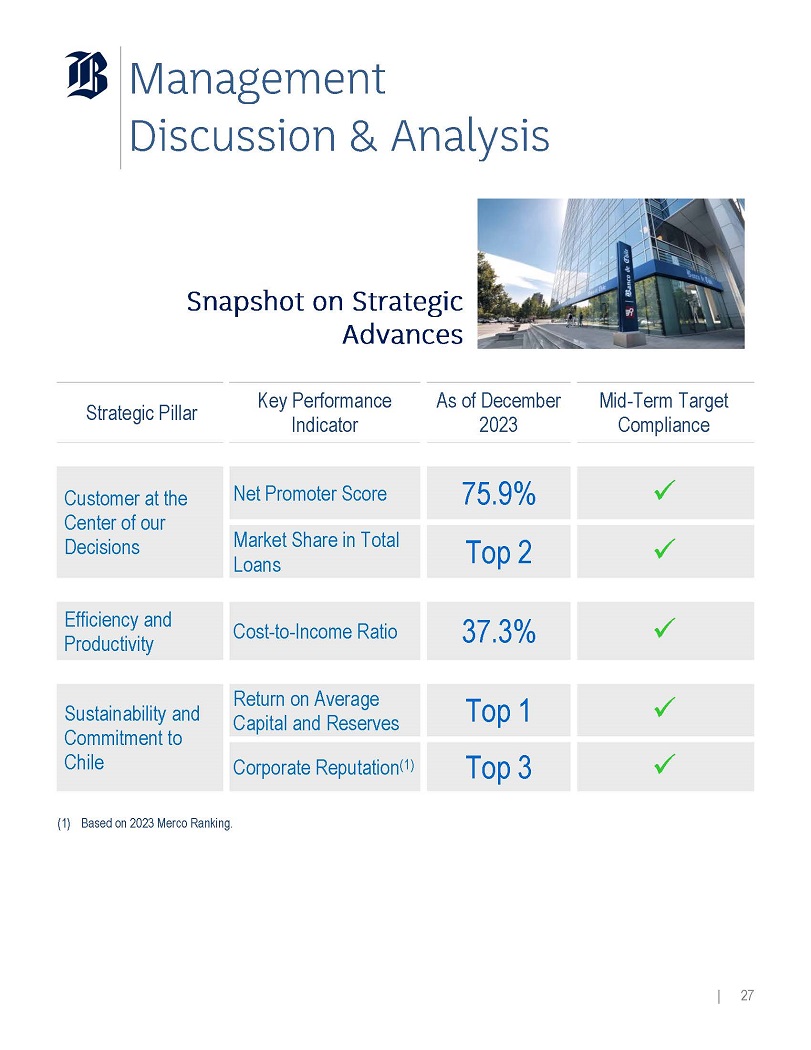
Management Discussion & Analysis Snapshot on Strategic Advances Strategic Pillar Key Performance Indicator As of December 2023 Mid - Term Target Compliance x 75.5% Net Promoter Score Customer at the Center of our Decisions x Top 2 Market Share in Total Loans x 37.3% Cost - to - Income Ratio Efficiency and Productivity x Top 1 Return on Average Capital and Reserves Sustainability and Commitment to Chile x Top 3 Corporate Reputation (1) (1) Based on 2023 Merco Ranking. | 27
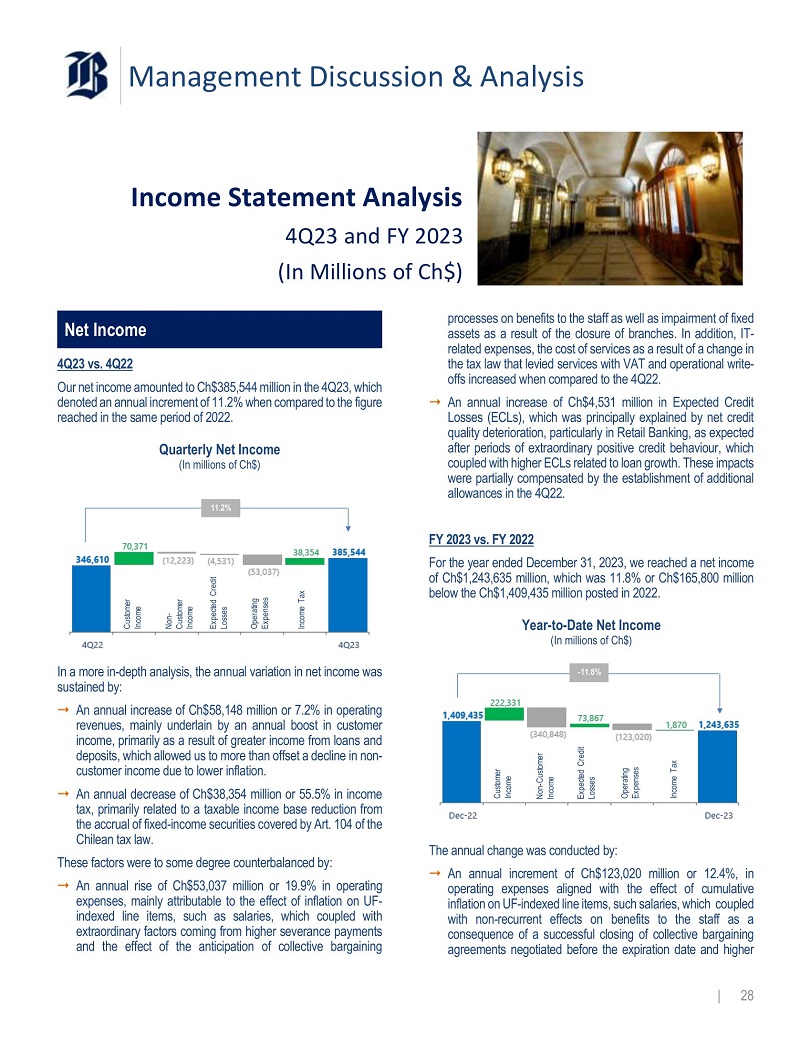
Management Discussion & Analysis Income Statement Analysis 4Q23 and FY 2023 (In Millions of Ch$) Net Income 4 Q 23 vs . 4 Q 22 Our net income amounted to Ch $ 385 , 544 million in the 4 Q 23 , which denoted an annual increment of 11 . 2 % when compared to the figure reached in the same period of 2022 . Quarterly Net Income (In millions of Ch$) Non - Customer Income Income Tax Customer Income Expected Credit Losses Operating Expenses 11.2% In a more in - depth analysis, the annual variation in net income was sustained by : ⭬ An annual increase of Ch $ 58 , 148 million or 7 . 2 % in operating revenues, mainly underlain by an annual boost in customer income, primarily as a result of greater income from loans and deposits, which allowed us to more than offset a decline in non - customer income due to lower inflation . ⭬ An annual decrease of Ch $ 38 , 354 million or 55 . 5 % in income tax, primarily related to a taxable income base reduction from the accrual of fixed - income securities covered by Art . 104 of the Chilean tax law . These factors were to some degree counterbalanced by : ⭬ An annual rise of Ch $ 53 , 037 million or 19 . 9 % in operating expenses, mainly attributable to the effect of inflation on UF - indexed line items, such as salaries, which coupled with extraordinary factors coming from higher severance payments and the effect of the anticipation of collective bargaining processes on benefits to the staff as well as impairment of fixed assets as a result of the closure of branches . In addition, IT - related expenses, the cost of services as a result of a change in the tax law that levied services with VAT and operational write - offs increased when compared to the 4 Q 22 . ⭬ An annual increase of Ch $ 4 , 531 million in Expected Credit Losses (ECLs), which was principally explained by net credit quality deterioration, particularly in Retail Banking, as expected after periods of extraordinary positive credit behaviour, which coupled with higher ECLs related to loan growth . These impacts were partially compensated by the establishment of additional allowances in the 4 Q 22 . FY 2023 vs . FY 2022 For the year ended December 31 , 2023 , we reached a net income of Ch $ 1 , 243 , 635 million, which was 11 . 8 % or Ch $ 165 , 800 million below the Ch $ 1 , 409 , 435 million posted in 2022 . Year - to - Date Net Income (In millions of Ch$) Non - Customer Income Income Tax Customer Income Expected Credit Losses Operating Expenses - 11.8% The annual change was conducted by : ⭬ An annual increment of Ch $ 123 , 020 million or 12 . 4 % , in operating expenses aligned with the effect of cumulative inflation on UF - indexed line items, such salaries, which coupled with non - recurrent effects on benefits to the staff as a consequence of a successful closing of collective bargaining agreements negotiated before the expiration date and higher | 28
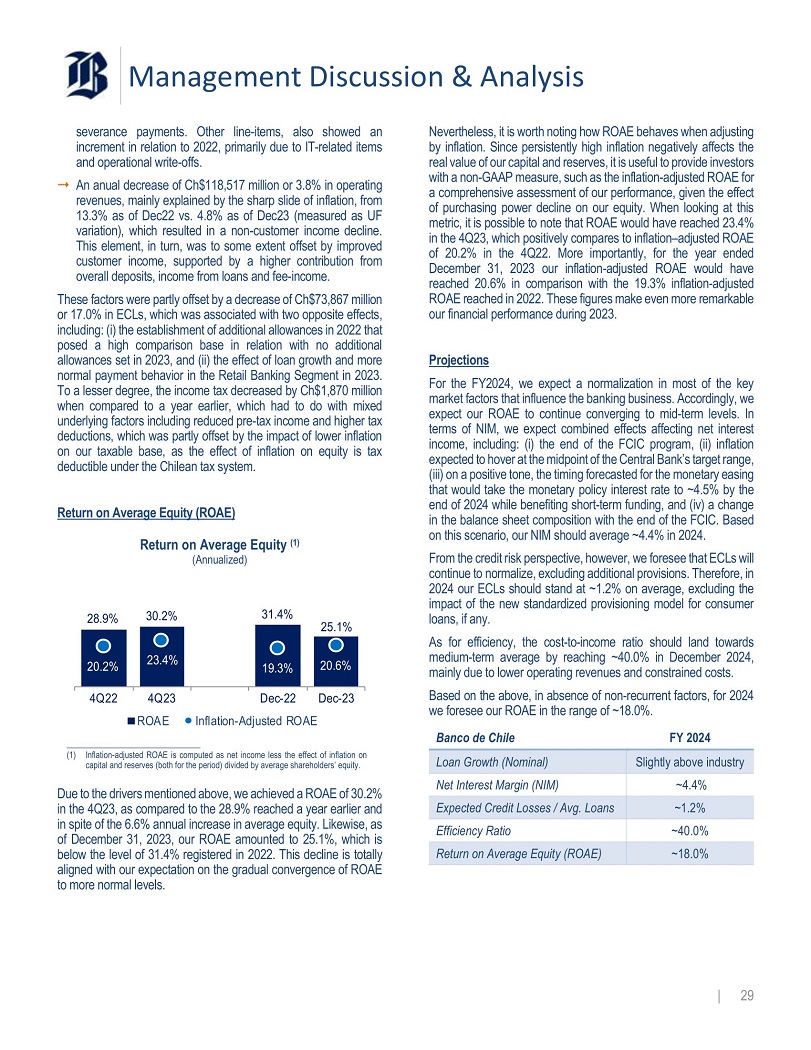
Management Discussion & Analysis severance payments . Other line - items, also showed an increment in relation to 2022 , primarily due to IT - related items and operational write - offs . ⭬ An anual decrease of Ch $ 118 , 517 million or 3 . 8 % in operating revenues, mainly explained by the sharp slide of inflation, from 13 . 3 % as of Dec 22 vs . 4 . 8 % as of Dec 23 (measured as UF variation), which resulted in a non - customer income decline . This element, in turn, was to some extent offset by improved customer income, supported by a higher contribution from overall deposits, income from loans and fee - income . These factors were partly offset by a decrease of Ch $ 73 , 867 million or 17 . 0 % in ECLs, which was associated with two opposite effects, including : (i) the establishment of additional allowances in 2022 that posed a high comparison base in relation with no additional allowances set in 2023 , and (ii) the effect of loan growth and more normal payment behavior in the Retail Banking Segment in 2023 . To a lesser degree, the income tax decreased by Ch $ 1 , 870 million when compared to a year earlier, which had to do with mixed underlying factors including reduced pre - tax income and higher tax deductions, which was partly offset by the impact of lower inflation on our taxable base, as the effect of inflation on equity is tax deductible under the Chilean tax system . Return on Average Equity (ROAE) Return on Average Equity (1) (Annualized) 28.9% 30.2% 31.4% 25.1% 20.2% 23.4% 19.3% 20.6% 4Q22 Dec - 23 4Q23 ROAE Dec - 22 Inflation - Adjusted ROAE (1) Inflation - adjusted ROAE is computed as net income less the effect of inflation on capital and reserves (both for the period) divided by average shareholders’ equity. | 29 Due to the drivers mentioned above, we achieved a ROAE of 30 . 2 % in the 4 Q 23 , as compared to the 28 . 9 % reached a year earlier and in spite of the 6 . 6 % annual increase in average equity . Likewise, as of December 31 , 2023 , our ROAE amounted to 25 . 1 % , which is below the level of 31 . 4 % registered in 2022 . This decline is totally aligned with our expectation on the gradual convergence of ROAE to more normal levels . Nevertheless, it is worth noting how ROAE behaves when adjusting by inflation . Since persistently high inflation negatively affects the real value of our capital and reserves, it is useful to provide investors with a non - GAAP measure, such as the inflation - adjusted ROAE for a comprehensive assessment of our performance, given the effect of purchasing power decline on our equity . When looking at this metric, it is possible to note that ROAE would have reached 23 . 4 % in the 4 Q 23 , which positively compares to inflation – adjusted ROAE of 20 . 2 % in the 4 Q 22 . More importantly, for the year ended December 31 , 2023 our inflation - adjusted ROAE would have reached 20 . 6 % in comparison with the 19 . 3 % inflation - adjusted ROAE reached in 2022 . These figures make even more remarkable our financial performance during 2023 . Projections For the FY 2024 , we expect a normalization in most of the key market factors that influence the banking business . Accordingly, we expect our ROAE to continue converging to mid - term levels . In terms of NIM, we expect combined effects affecting net interest income, including : (i) the end of the FCIC program, (ii) inflation expected to hover at the midpoint of the Central Bank’s target range, (iii) on a positive tone, the timing forecasted for the monetary easing that would take the monetary policy interest rate to ~ 4 . 5 % by the end of 2024 while benefiting short - term funding, and (iv) a change in the balance sheet composition with the end of the FCIC . Based on this scenario, our NIM should average ~ 4 . 4 % in 2024 . From the credit risk perspective, however, we foresee that ECLs will continue to normalize, excluding additional provisions . Therefore, in 2024 our ECLs should stand at ~ 1 . 2 % on average, excluding the impact of the new standardized provisioning model for consumer loans, if any . As for efficiency, the cost - to - income ratio should land towards medium - term average by reaching ~ 40 . 0 % in December 2024 , mainly due to lower operating revenues and constrained costs . Based on the above, in absence of non - recurrent factors, for 2024 we foresee our ROAE in the range of ~18.0%. Banco de Chile FY 2024 Slightly above industry Loan Growth (Nominal) ~4.4% Net Interest Margin (NIM) ~1.2% Expected Credit Losses / Avg. Loans ~40.0% Efficiency Ratio ~18.0% Return on Average Equity (ROAE)
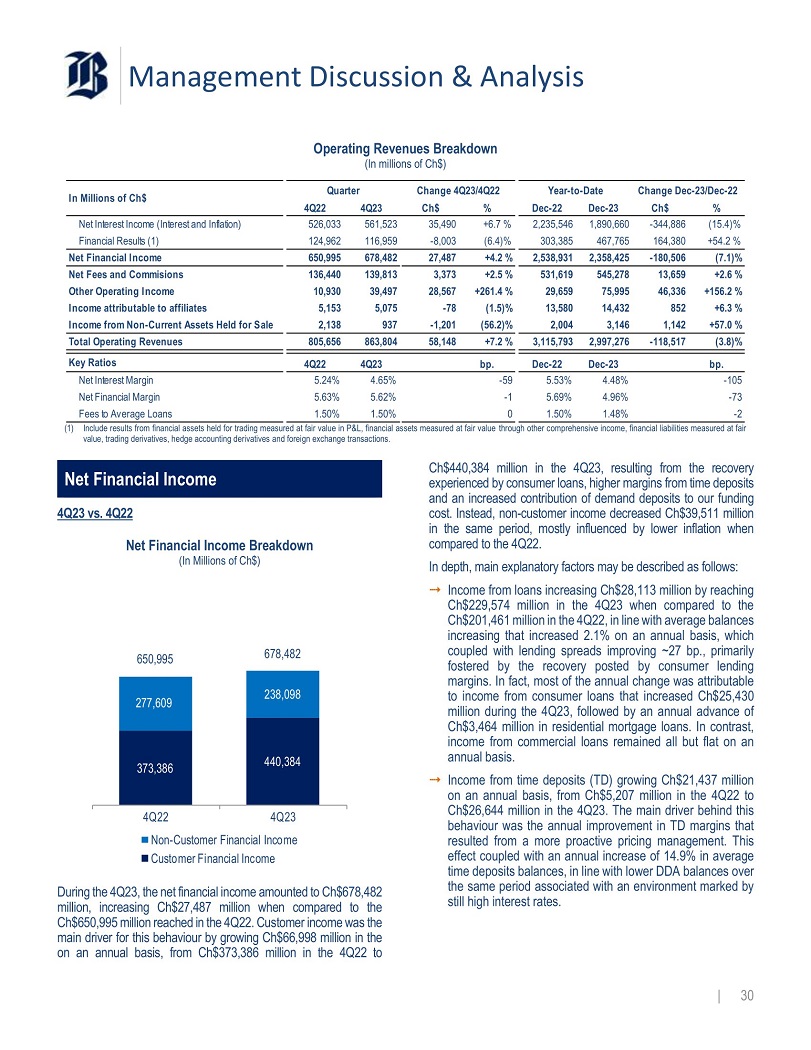
Management Discussion & Analysis Operating Revenues Breakdown (In millions of Ch$) Quarter Change 4Q23/4Q22 % Ch$ Dec - 23 Dec - 22 % Ch$ 4Q23 4Q22 (15.4)% - 344,886 1,890,660 2,235,546 +6.7 % 35,490 561,523 526,033 Net Interest Income (Interest and Inflation) +54.2 % 164,380 467,765 303,385 (6.4)% - 8,003 116,959 124,962 Financial Results (1) (7.1)% - 180,506 2,358,425 2,538,931 +4.2 % 27,487 678,482 650,995 Net Financial Income +2.6 % 13,659 545,278 531,619 +2.5 % 3,373 139,813 136,440 Net Fees and Commisions +156.2 % 46,336 75,995 29,659 +261.4 % 28,567 39,497 10,930 Other Operating Income +6.3 % 852 14,432 13,580 (1.5)% - 78 5,075 5,153 Income attributable to affiliates +57.0 % 1,142 3,146 2,004 (56.2)% - 1,201 937 2,138 Income from Non - Current Assets Held for Sale (3.8)% - 118,517 2,997,276 3,115,793 +7.2 % 58,148 863,804 805,656 Total Operating Revenues bp. Dec - 23 Dec - 22 bp. 4Q23 4Q22 Key Ratios - 105 4.48% 5.53% - 59 4.65% 5.24% Net Interest Margin - 73 4.96% 5.69% - 1 5.62% 5.63% Net Financial Margin - 2 1.48% 1.50% 0 1.50% 1.50% Fees to Average Loans Change Dec - 23/Dec - 22 In Millions of Ch$ Year - to - Date (1) Include results from financial assets held for trading measured at fair value in P&L, financial assets measured at fair value through other comprehensive income, financial liabilities measured at fair value, trading derivatives, hedge accounting derivatives and foreign exchange transactions. Net Financial Income 4Q23 vs. 4Q22 Net Financial Income Breakdown (In Millions of Ch$) 373,386 440,384 277,609 238,098 650,995 678,482 4Q22 4Q23 Non - Customer Financial Income Customer Financial Income | 30 During the 4 Q 23 , the net financial income amounted to Ch $ 678 , 482 million, increasing Ch $ 27 , 487 million when compared to the Ch $ 650 , 995 million reached in the 4 Q 22 . Customer income was the main driver for this behaviour by growing Ch $ 66 , 998 million in the on an annual basis, from Ch $ 373 , 386 million in the 4 Q 22 to Ch $ 440 , 384 million in the 4 Q 23 , resulting from the recovery experienced by consumer loans, higher margins from time deposits and an increased contribution of demand deposits to our funding cost . Instead, non - customer income decreased Ch $ 39 , 511 million in the same period, mostly influenced by lower inflation when compared to the 4 Q 22 . In depth, main explanatory factors may be described as follows : ⭬ Income from loans increasing Ch $ 28 , 113 million by reaching Ch $ 229 , 574 million in the 4 Q 23 when compared to the Ch $ 201 , 461 million in the 4 Q 22 , in line with average balances increasing that increased 2 . 1 % on an annual basis, which coupled with lending spreads improving ~ 27 bp . , primarily fostered by the recovery posted by consumer lending margins . In fact, most of the annual change was attributable to income from consumer loans that increased Ch $ 25 , 430 million during the 4 Q 23 , followed by an annual advance of Ch $ 3 , 464 million in residential mortgage loans . In contrast, income from commercial loans remained all but flat on an annual basis . ⭬ Income from time deposits (TD) growing Ch $ 21 , 437 million on an annual basis, from Ch $ 5 , 207 million in the 4 Q 22 to Ch $ 26 , 644 million in the 4 Q 23 . The main driver behind this behaviour was the annual improvement in TD margins that resulted from a more proactive pricing management . This effect coupled with an annual increase of 14 . 9 % in average time deposits balances, in line with lower DDA balances over the same period associated with an environment marked by still high interest rates .
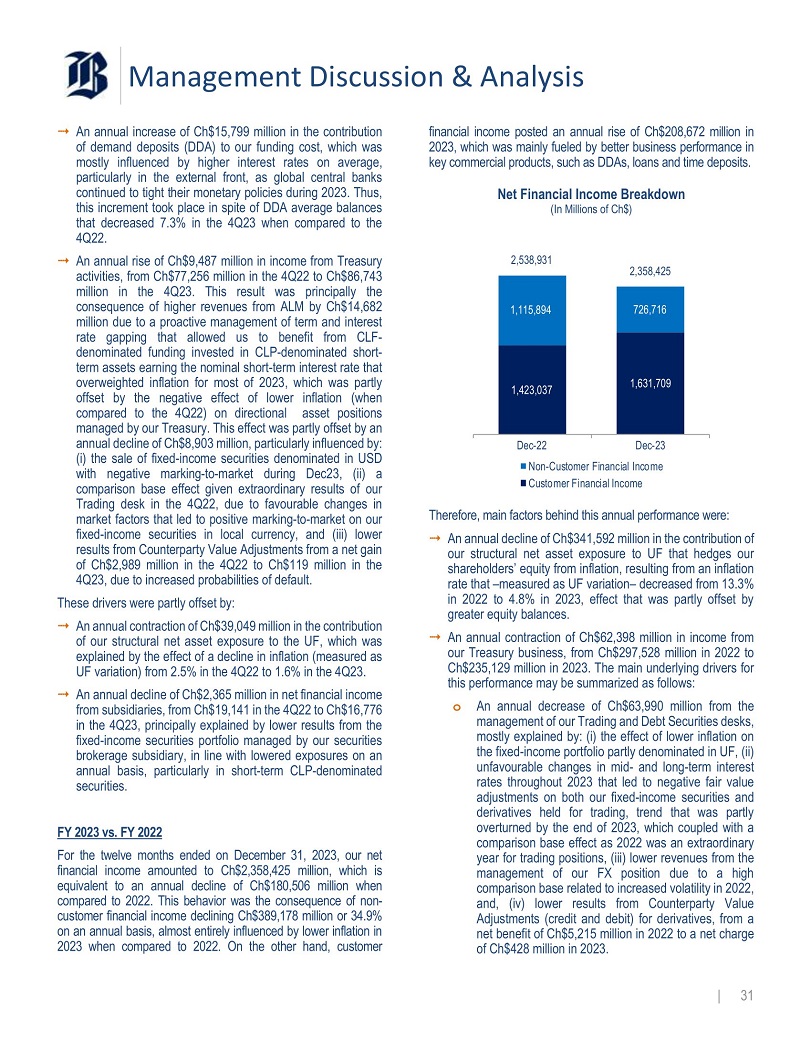
Management Discussion & Analysis ⭬ An annual increase of Ch $ 15 , 799 million in the contribution of demand deposits (DDA) to our funding cost, which was mostly influenced by higher interest rates on average, particularly in the external front, as global central banks continued to tight their monetary policies during 2023 . Thus, this increment took place in spite of DDA average balances that decreased 7 . 3 % in the 4 Q 23 when compared to the 4 Q 22 . ⭬ An annual rise of Ch $ 9 , 487 million in income from Treasury activities, from Ch $ 77 , 256 million in the 4 Q 22 to Ch $ 86 , 743 million in the 4 Q 23 . This result was principally the consequence of higher revenues from ALM by Ch $ 14 , 682 million due to a proactive management of term and interest rate gapping that allowed us to benefit from CLF - denominated funding invested in CLP - denominated short - term assets earning the nominal short - term interest rate that overweighted inflation for most of 2023 , which was partly offset by the negative effect of lower inflation (when compared to the 4 Q 22 ) on directional asset positions managed by our Treasury . This effect was partly offset by an annual decline of Ch $ 8 , 903 million, particularly influenced by : (i) the sale of fixed - income securities denominated in USD with negative marking - to - market during Dec 23 , (ii) a comparison base effect given extraordinary results of our Trading desk in the 4 Q 22 , due to favourable changes in market factors that led to positive marking - to - market on our fixed - income securities in local currency, and (iii) lower results from Counterparty Value Adjustments from a net gain of Ch $ 2 , 989 million in the 4 Q 22 to Ch $ 119 million in the 4 Q 23 , due to increased probabilities of default . These drivers were partly offset by : ⭬ An annual contraction of Ch $ 39 , 049 million in the contribution of our structural net asset exposure to the UF, which was explained by the effect of a decline in inflation (measured as UF variation) from 2 . 5 % in the 4 Q 22 to 1 . 6 % in the 4 Q 23 . ⭬ An annual decline of Ch $ 2 , 365 million in net financial income from subsidiaries, from Ch $ 19 , 141 in the 4 Q 22 to Ch $ 16 , 776 in the 4 Q 23 , principally explained by lower results from the fixed - income securities portfolio managed by our securities brokerage subsidiary, in line with lowered exposures on an annual basis, particularly in short - term CLP - denominated securities . FY 2023 vs . FY 2022 For the twelve months ended on December 31 , 2023 , our net financial income amounted to Ch $ 2 , 358 , 425 million, which is equivalent to an annual decline of Ch $ 180 , 506 million when compared to 2022 . This behavior was the consequence of non - customer financial income declining Ch $ 389 , 178 million or 34 . 9 % on an annual basis, almost entirely influenced by lower inflation in 2023 when compared to 2022 . On the other hand, customer financial income posted an annual rise of Ch $ 208 , 672 million in 2023 , which was mainly fueled by better business performance in key commercial products, such as DDAs, loans and time deposits . Net Financial Income Breakdown (In Millions of Ch$) 1,423,037 1,631,709 1,115,894 726,716 2,538,931 2,358,425 Dec - 22 Dec - 23 Non - Customer Financial Income Customer Financial Income Therefore, main factors behind this annual performance were : ⭬ An annual decline of Ch $ 341 , 592 million in the contribution of our structural net asset exposure to UF that hedges our shareholders’ equity from inflation, resulting from an inflation rate that – measured as UF variation – decreased from 13 . 3 % in 2022 to 4 . 8 % in 2023 , effect that was partly offset by greater equity balances . ⭬ An annual contraction of Ch $ 62 , 398 million in income from our Treasury business, from Ch $ 297 , 528 million in 2022 to Ch $ 235 , 129 million in 2023 . The main underlying drivers for this performance may be summarized as follows : o An annual decrease of Ch $ 63 , 990 million from the management of our Trading and Debt Securities desks, mostly explained by : (i) the effect of lower inflation on the fixed - income portfolio partly denominated in UF, (ii) unfavourable changes in mid - and long - term interest rates throughout 2023 that led to negative fair value adjustments on both our fixed - income securities and derivatives held for trading, trend that was partly overturned by the end of 2023 , which coupled with a comparison base effect as 2022 was an extraordinary year for trading positions, (iii) lower revenues from the management of our FX position due to a high comparison base related to increased volatility in 2022 , and, (iv) lower results from Counterparty Value Adjustments (credit and debit) for derivatives, from a net benefit of Ch $ 5 , 215 million in 2022 to a net charge of Ch $ 428 million in 2023 . | 31
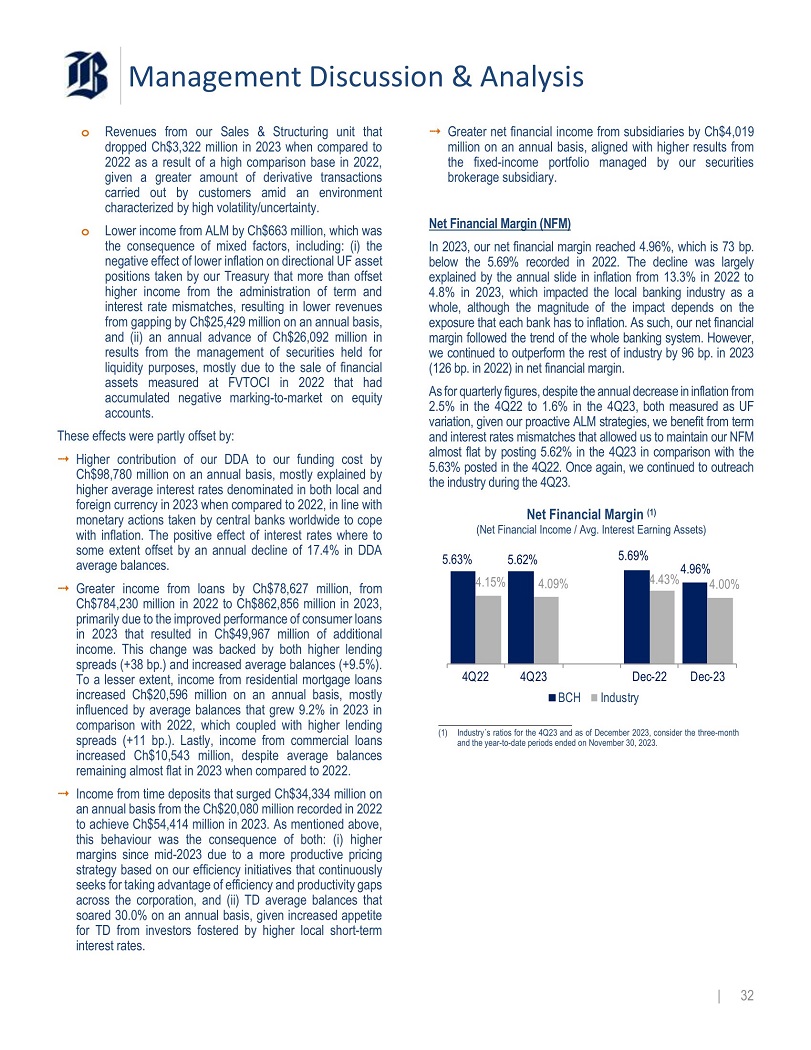
Management Discussion & Analysis o Revenues from our Sales & Structuring unit that dropped Ch $ 3 , 322 million in 2023 when compared to 2022 as a result of a high comparison base in 2022 , given a greater amount of derivative transactions carried out by customers amid an environment characterized by high volatility/uncertainty . o Lower income from ALM by Ch $ 663 million, which was the consequence of mixed factors, including : (i) the negative effect of lower inflation on directional UF asset positions taken by our Treasury that more than offset higher income from the administration of term and interest rate mismatches, resulting in lower revenues from gapping by Ch $ 25 , 429 million on an annual basis, and (ii) an annual advance of Ch $ 26 , 092 million in results from the management of securities held for liquidity purposes, mostly due to the sale of financial assets measured at FVTOCI in 2022 that had accumulated negative marking - to - market on equity accounts . These effects were partly offset by : ⭬ Higher contribution of our DDA to our funding cost by Ch $ 98 , 780 million on an annual basis, mostly explained by higher average interest rates denominated in both local and foreign currency in 2023 when compared to 2022 , in line with monetary actions taken by central banks worldwide to cope with inflation . The positive effect of interest rates where to some extent offset by an annual decline of 17 . 4 % in DDA average balances . ⭬ Greater income from loans by Ch $ 78 , 627 million, from Ch $ 784 , 230 million in 2022 to Ch $ 862 , 856 million in 2023 , primarily due to the improved performance of consumer loans in 2023 that resulted in Ch $ 49 , 967 million of additional income . This change was backed by both higher lending spreads (+ 38 bp . ) and increased average balances (+ 9 . 5 % ) . To a lesser extent, income from residential mortgage loans increased Ch $ 20 , 596 million on an annual basis, mostly influenced by average balances that grew 9 . 2 % in 2023 in comparison with 2022 , which coupled with higher lending spreads (+ 11 bp . ) . Lastly, income from commercial loans increased Ch $ 10 , 543 million, despite average balances remaining almost flat in 2023 when compared to 2022 . ⭬ Income from time deposits that surged Ch $ 34 , 334 million on an annual basis from the Ch $ 20 , 080 million recorded in 2022 to achieve Ch $ 54 , 414 million in 2023 . As mentioned above, this behaviour was the consequence of both : (i) higher margins since mid - 2023 due to a more productive pricing strategy based on our efficiency initiatives that continuously seeks for taking advantage of efficiency and productivity gaps across the corporation, and (ii) TD average balances that soared 30 . 0 % on an annual basis, given increased appetite for TD from investors fostered by higher local short - term interest rates . 5.63% 5.62% ⭬ Greater net financial income from subsidiaries by Ch $ 4 , 019 million on an annual basis, aligned with higher results from the fixed - income portfolio managed by our securities brokerage subsidiary . Net Financial Margin (NFM) In 2023 , our net financial margin reached 4 . 96 % , which is 73 bp . below the 5 . 69 % recorded in 2022 . The decline was largely explained by the annual slide in inflation from 13 . 3 % in 2022 to 4 . 8 % in 2023 , which impacted the local banking industry as a whole, although the magnitude of the impact depends on the exposure that each bank has to inflation . As such, our net financial margin followed the trend of the whole banking system . However, we continued to outperform the rest of industry by 96 bp . in 2023 ( 126 bp . in 2022 ) in net financial margin . As for quarterly figures, despite the annual decrease in inflation from 2 . 5 % in the 4 Q 22 to 1 . 6 % in the 4 Q 23 , both measured as UF variation, given our proactive ALM strategies, we benefit from term and interest rates mismatches that allowed us to maintain our NFM almost flat by posting 5 . 62 % in the 4 Q 23 in comparison with the 5 . 63 % posted in the 4 Q 22 . Once again, we continued to outreach the industry during the 4 Q 23 . Net Financial Margin (1) (Net Financial Income / Avg. Interest Earning Assets) 5.69% 4.96% 4.15% 4.09% 4.43% 4.00% 4Q22 4Q23 Dec - 23 Dec - 22 BCH Industry (1) Industry s ratios for the 4Q23 and as of December 2023, consider the three - month and the year - to - date periods ended on November 30, 2023. | 32
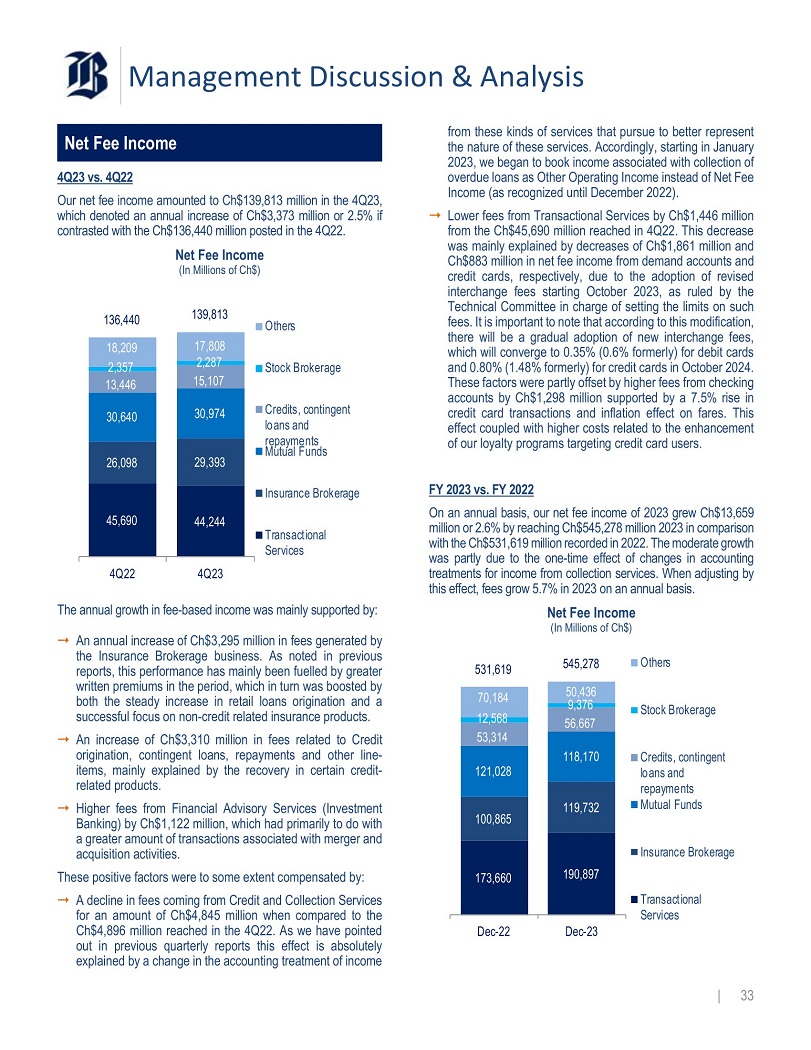
Management Discussion & Analysis Net Fee Income 4 Q 23 vs . 4 Q 22 Our net fee income amounted to Ch $ 139 , 813 million in the 4 Q 23 , which denoted an annual increase of Ch $ 3 , 373 million or 2 . 5 % if contrasted with the Ch $ 136 , 440 million posted in the 4 Q 22 . Net Fee Income (In Millions of Ch $ ) 17,808 2,287 18,209 2,357 15,107 13,446 30,974 30,640 29,393 26,098 44,244 45,690 136,440 139,813 Others Stock Brokerage Credits, contingent loans and repayments Mutual Funds Insurance Brokerage Transactional Services 4Q22 4Q23 The annual growth in fee - based income was mainly supported by : ⭬ An annual increase of Ch $ 3 , 295 million in fees generated by the Insurance Brokerage business . As noted in previous reports, this performance has mainly been fuelled by greater written premiums in the period, which in turn was boosted by both the steady increase in retail loans origination and a successful focus on non - credit related insurance products . ⭬ An increase of Ch $ 3 , 310 million in fees related to Credit origination, contingent loans, repayments and other line - items, mainly explained by the recovery in certain credit - related products . ⭬ Higher fees from Financial Advisory Services (Investment Banking) by Ch $ 1 , 122 million, which had primarily to do with a greater amount of transactions associated with merger and acquisition activities . These positive factors were to some extent compensated by : ⭬ A decline in fees coming from Credit and Collection Services for an amount of Ch $ 4 , 845 million when compared to the Ch $ 4 , 896 million reached in the 4 Q 22 . As we have pointed out in previous quarterly reports this effect is absolutely explained by a change in the accounting treatment of income 173,660 190,897 100,865 119,732 121,028 118,170 53,314 56,667 70,184 12,568 50,436 9,376 531,619 Dec - 22 Dec - 23 from these kinds of services that pursue to better represent the nature of these services . Accordingly, starting in January 2023 , we began to book income associated with collection of overdue loans as Other Operating Income instead of Net Fee Income (as recognized until December 2022 ) . ⭬ Lower fees from Transactional Services by Ch $ 1 , 446 million from the Ch $ 45 , 690 million reached in 4 Q 22 . This decrease was mainly explained by decreases of Ch $ 1 , 861 million and Ch $ 883 million in net fee income from demand accounts and credit cards, respectively, due to the adoption of revised interchange fees starting October 2023 , as ruled by the Technical Committee in charge of setting the limits on such fees . It is important to note that according to this modification, there will be a gradual adoption of new interchange fees, which will converge to 0 . 35 % ( 0 . 6 % formerly) for debit cards and 0 . 80 % ( 1 . 48 % formerly) for credit cards in October 2024 . These factors were partly offset by higher fees from checking accounts by Ch $ 1 , 298 million supported by a 7 . 5 % rise in credit card transactions and inflation effect on fares . This effect coupled with higher costs related to the enhancement of our loyalty programs targeting credit card users . FY 2023 vs . FY 2022 On an annual basis, our net fee income of 2023 grew Ch $ 13 , 659 million or 2 . 6 % by reaching Ch $ 545 , 278 million 2023 in comparison with the Ch $ 531 , 619 million recorded in 2022 . The moderate growth was partly due to the one - time effect of changes in accounting treatments for income from collection services . When adjusting by this effect, fees grow 5 . 7 % in 2023 on an annual basis . Net Fee Income (In Millions of Ch $ ) 545,278 Others Stock Brokerage Credits, contingent loans and repayments Mutual Funds Insurance Brokerage Transactional Services | 33
Management Discussion & Analysis The main underlying drivers of this growth may be summarized, as follows : ⭬ Fees from Insurance Brokerage services that grew Ch $ 18 , 867 million or 18 . 7 % from Ch $ 100 , 865 million achieved in 2022 . Once again, this upward trend was primarily caused by an annual expansion of 14 . 2 % in written premiums, which in turn has largely been fostered by the positive evolution of insurance sales in the retail banking segment . ⭬ Greater fee income from Transactional Services by Ch $ 17 , 237 million or 9 . 9 % , from Ch $ 173 , 660 million reached in 2022 . This change had mainly to do with fees from credit cards that surged Ch $ 10 , 017 million during the year, which in turn was primarily backed by a 14 . 3 % rise in credit card transactions turnover . ⭬ An annual increment of Ch $ 3 , 353 million in fees from Credit origination, contingent loans and credit prepayment that was principally fostered by reactivation in loan origination, especially in Retail Banking . These factors were partly offset by : ⭬ An annual reduction of Ch $ 16 , 883 million in fee income from Collection Services from the level of Ch $ 17 , 049 reached in 2022 . This effect was the consequence of the change in the accounting treatment of fees coming from these kinds of services that started to be booked under Other Operating Income in 2023 . ⭬ Fees from Financial Advisory services that went down from Ch $ 8 , 935 million in 2022 to Ch $ 5 , 142 million in 2023 , which indicates an annual decline of Ch $ 3 , 793 million . During 2023 , the activity in Financial Advisory services was battered by the prevailing economic outlook, characterized by weakened business sentiment and high interest rates, which resulted in lower M&A and bond placements in the local market . ⭬ An annual decrease of Ch $ 3 , 192 million in fee - based income coming from the stock brokerage business, from Ch $ 12 , 568 million in 2022 to Ch $ 9 , 376 million in 2023 . This trend was primarily fuelled by an annual decline of 5 . 0 % in the stock trading turnover, which is in lined with investors’ preferences that moved to fixed - income waiting for the expected downward correction in interest rates . ⭬ Lowered fee - income from mutual fund management that declined from Ch $ 121 , 028 million in 2022 to Ch $ 118 , 170 million in 2023 , which poses an annual drop of Ch $ 2 , 858 million . This change has largely been associated with revised preferences among investors in 2023 , which moved to lower - margin funds, such as those invested in fixed - income securities, given their expectations on the downward correction for local interest rates . | 34 Other Operating Income 4 Q 23 vs . 4 Q 22 The Other Operating Income (which includes income from investments in affiliates, income from non - current assets held for sale and other operating income) rose Ch $ 27 , 288 million or 149 . 8 % on a yearly basis . This increment has primarily been supported by greater other operating income that in turn went up by Ch $ 28 , 567 million, due to : (i) a one - time effect of approximately Ch $ 23 , 355 million associated with the release of non - credit related provisions, and (ii) to a lesser degree, the change in the accounting treatment of collection services that resulted in greater other income by nearly Ch $ 6 , 088 million in the 4 Q 23 when compared to the 4 Q 22 . These factors were partly offset by a decrease of Ch $ 961 million in the recognition of the impact of inflation on provisional monthly payments of income tax in the 4 Q 23 in relation to the 4 Q 22 , explained by inflation that decreased from 2 . 5 % in the 4 Q 22 to 1 . 6 % in the 4 Q 23 , measured as UF variation . FY 2023 vs . FY 2022 Our Other Operating Income (including the line - items mentioned above) posted an annual increase of Ch $ 48 , 330 million or 106 . 8 % in the year ended on December 31 , 2023 in relation to the Ch $ 45 , 243 million recorded in 2022 . This change was mostly underlain by an annual rise of Ch $ 46 , 336 million in other operating revenues, which in turn was primarily sustained by : (i) a one - time release of non - credit related provisions by nearly Ch $ 23 , 355 million, (ii) further income of nearly Ch $ 24 , 000 related to the above - mentioned change in the accounting treatment of income from collection services, and (iii) approximately Ch $ 6 , 701 million linked to the effect of inflation on VAT payments to the IRS . These factors were to some degree counterbalanced by an annual decrease of Ch $ 7 , 900 million in income from the recognition of inflation on provisional monthly payments of income tax, due to a sharp decrease in year - to - date inflation from 13 . 3 % in 2022 to 4 . 8 % in 2023 .
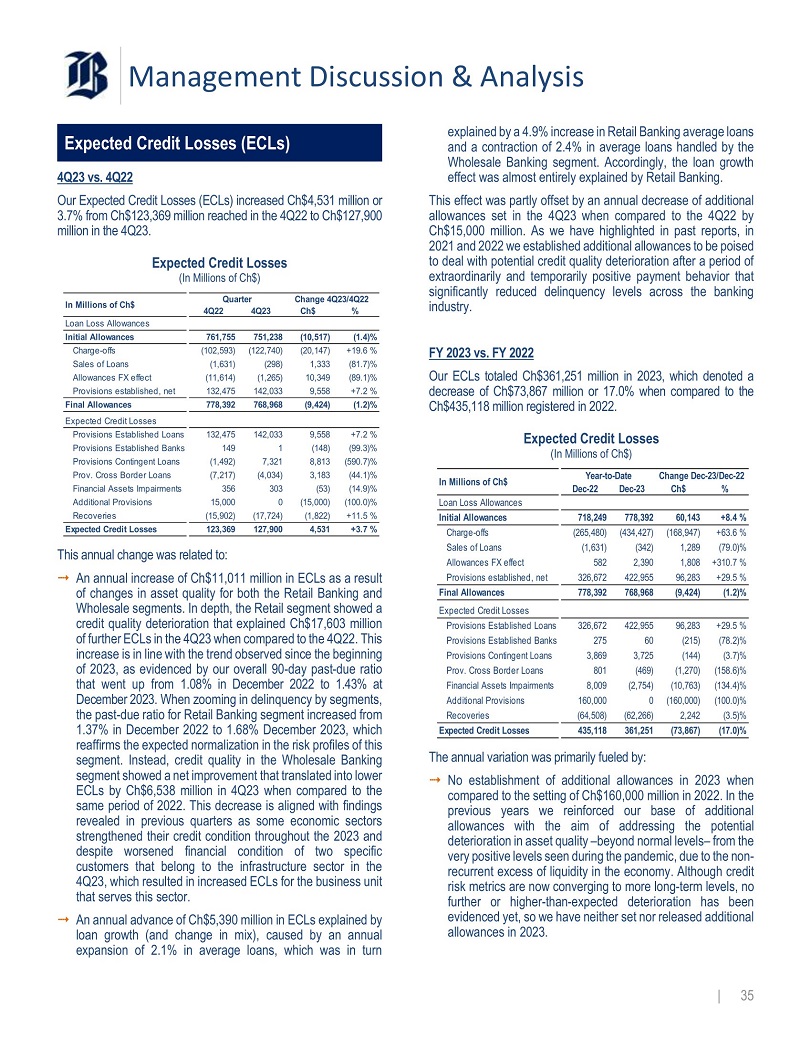
Management Discussion & Analysis Expected Credit Losses (ECLs) 4 Q 23 vs . 4 Q 22 Our Expected Credit Losses (ECLs) increased Ch $ 4 , 531 million or 3 . 7 % from Ch $ 123 , 369 million reached in the 4 Q 22 to Ch $ 127 , 900 million in the 4 Q 23 . Expected Credit Losses (In Millions of Ch$) 23/4Q22 % Change 4Q Ch$ ter 4Q23 Quar 4Q22 In Millions of Ch$ Loan Loss Allowances (1.4)% (10,517) 751,238 761,755 Initial Allowances +19.6 % (20,147) (122,740) (102,593) Charge - offs (81.7)% 1,333 (298) (1,631) Sales of Loans (89.1)% 10,349 (1,265) (11,614) Allowances FX effect +7.2 % 9,558 142,033 132,475 Provisions established, net (1.2)% (9,424) 768,968 778,392 Final Allowances Expected Credit Losses +7.2 % 9,558 142,033 132,475 Provisions Established Loans (99.3)% (148) 1 149 Provisions Established Banks (590.7)% 8,813 7,321 (1,492) Provisions Contingent Loans (44.1)% 3,183 (4,034) (7,217) Prov. Cross Border Loans (14.9)% (53) 303 356 Financial Assets Impairments Loan Loss Allowances (100.0)% (15,000) 0 15,000 Additional Provisions +8.4 % 60,143 778,392 718,249 Initial Allowances +11.5 % (1,822) (17,724) (15,902) Recoveries +63.6 % (168,947) (434,427) (265,480) Charge - offs +3.7 % 4,531 127,900 123,369 Expected Credit Losses This annual change was related to: reaffirms the expected normalization in the risk profiles of this segment . Instead, credit quality in the Wholesale Banking segment showed a net improvement that translated into lower ECLs by Ch $ 6 , 538 million in 4 Q 23 when compared to the same period of 2022 . This decrease is aligned with findings revealed in previous quarters as some economic sectors strengthened their credit condition throughout the 2023 and despite worsened financial condition of two specific customers that belong to the infrastructure sector in the 4 Q 23 , which resulted in increased ECLs for the business unit that serves this sector . ⭬ An annual advance of Ch $ 5 , 390 million in ECLs explained by loan growth (and change in mix), caused by an annual expansion of 2 . 1 % in average loans, which was in turn +29.5 % 96,283 422,955 326,672 Provisions established, net An annual increase of Ch$11,011 million in ECLs as a result ⭬ (1.2)% (9,424) 768,968 778,392 Final Allowances of changes in asset quality for both the Retail Banking and Expected Credit Losses Wholesale segments. In depth, the Retail segment showed a +29.5 % 96,283 422,955 326,672 Provisions Established Loans credit quality deterioration that explained Ch$17,603 million (78.2)% (215) 60 275 Provisions Established Banks of further ECLs in the 4Q23 when compared to the 4Q22. This (3.7)% (144) 3,725 3,869 Provisions Contingent Loans increase is in line with the trend observed since the beginning (158.6)% (1,270) (469) 801 Prov. Cross Border Loans of 2023, as evidenced by our overall 90 - day past - due ratio (134.4)% (10,763) (2,754) 8,009 Financial Assets Impairments that went up from 1.08% in December 2022 to 1.43% at (100.0)% (160,000) 0 160,000 Additional Provisions December 2023. When zooming in delinquency by segments, (3.5)% 2,242 (62,266) (64,508) Recoveries the past - due ratio for Retail Banking segment increased from (17.0)% (73,867) 361,251 435,118 Expected Credit Losses 1.37% in December 2022 to 1.68% December 2023, which (79.0)% 1,289 (342) (1,631) Sales of Loans +310.7 % 1,808 2,390 582 Allowances FX effect In Millions of Ch$ explained by a 4 . 9 % increase in Retail Banking average loans and a contraction of 2 . 4 % in average loans handled by the Wholesale Banking segment . Accordingly, the loan growth effect was almost entirely explained by Retail Banking . This effect was partly offset by an annual decrease of additional allowances set in the 4 Q 23 when compared to the 4 Q 22 by Ch $ 15 , 000 million . As we have highlighted in past reports, in 2021 and 2022 we established additional allowances to be poised to deal with potential credit quality deterioration after a period of extraordinarily and temporarily positive payment behavior that significantly reduced delinquency levels across the banking industry . FY 2023 vs . FY 2022 Our ECLs totaled Ch $ 361 , 251 million in 2023 , which denoted a decrease of Ch $ 73 , 867 million or 17 . 0 % when compared to the Ch $ 435 , 118 million registered in 2022 . Expected Credit Losses (In Millions of Ch$) Year - to - Date Change Dec - 23/Dec - 22 Dec - 22 Dec - 23 Ch$ % The annual variation was primarily fueled by : ⭬ No establishment of additional allowances in 2023 when compared to the setting of Ch $ 160 , 000 million in 2022 . In the previous years we reinforced our base of additional allowances with the aim of addressing the potential deterioration in asset quality – beyond normal levels – from the very positive levels seen during the pandemic, due to the non - recurrent excess of liquidity in the economy . Although credit risk metrics are now converging to more long - term levels, no further or higher - than - expected deterioration has been evidenced yet, so we have neither set nor released additional allowances in 2023 . | 35
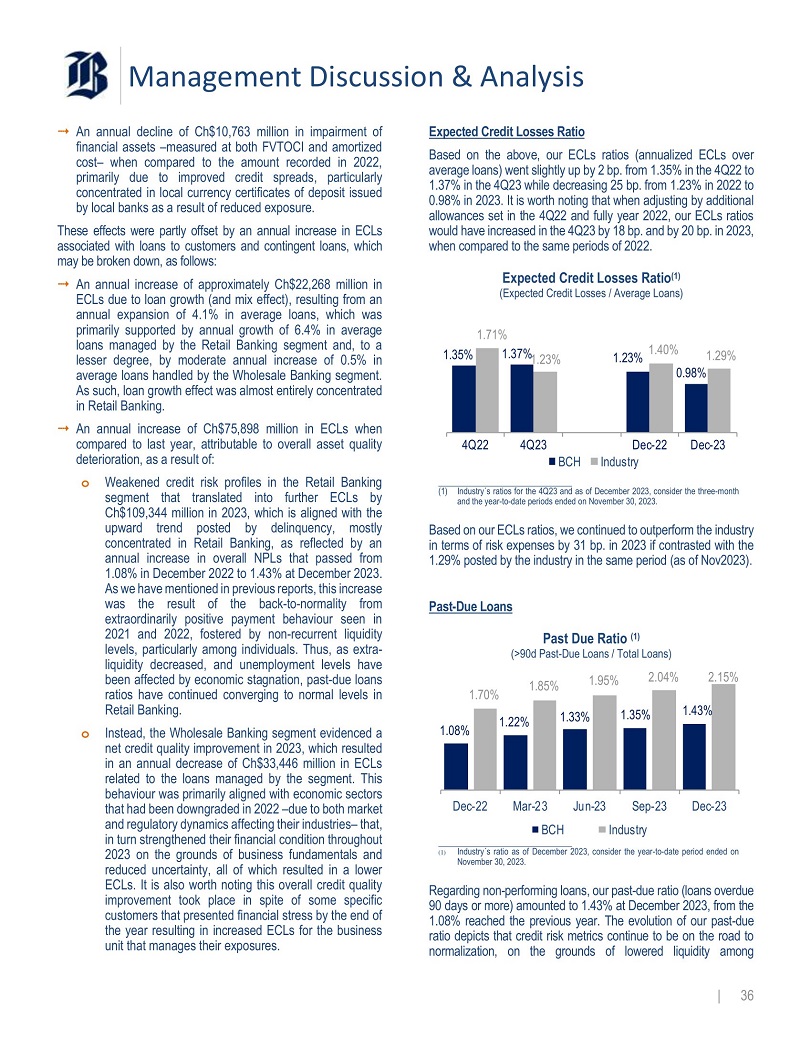
Management Discussion & Analysis ⭬ An annual decline of Ch $ 10 , 763 million in impairment of financial assets – measured at both FVTOCI and amortized cost – when compared to the amount recorded in 2022 , primarily due to improved credit spreads, particularly concentrated in local currency certificates of deposit issued by local banks as a result of reduced exposure . These effects were partly offset by an annual increase in ECLs associated with loans to customers and contingent loans, which may be broken down, as follows : ⭬ An annual increase of approximately Ch $ 22 , 268 million in ECLs due to loan growth (and mix effect), resulting from an annual expansion of 4 . 1 % in average loans, which was primarily supported by annual growth of 6 . 4 % in average loans managed by the Retail Banking segment and, to a lesser degree, by moderate annual increase of 0 . 5 % in average loans handled by the Wholesale Banking segment . As such, loan growth effect was almost entirely concentrated in Retail Banking . ⭬ An annual increase of Ch $ 75 , 898 million in ECLs when compared to last year, attributable to overall asset quality deterioration, as a result of : o Weakened credit risk profiles in the Retail Banking segment that translated into further ECLs by Ch $ 109 , 344 million in 2023 , which is aligned with the upward trend posted by delinquency, mostly concentrated in Retail Banking, as reflected by an annual increase in overall NPLs that passed from 1 . 08 % in December 2022 to 1 . 43 % at December 2023 . As we have mentioned in previous reports, this increase was the result of the back - to - normality from extraordinarily positive payment behaviour seen in 2021 and 2022 , fostered by non - recurrent liquidity levels, particularly among individuals . Thus, as extra - liquidity decreased, and unemployment levels have been affected by economic stagnation, past - due loans ratios have continued converging to normal levels in Retail Banking . o Instead, the Wholesale Banking segment evidenced a net credit quality improvement in 2023 , which resulted in an annual decrease of Ch $ 33 , 446 million in ECLs related to the loans managed by the segment . This behaviour was primarily aligned with economic sectors that had been downgraded in 2022 – due to both market and regulatory dynamics affecting their industries – that, in turn strengthened their financial condition throughout 2023 on the grounds of business fundamentals and reduced uncertainty, all of which resulted in a lower ECLs . It is also worth noting this overall credit quality improvement took place in spite of some specific customers that presented financial stress by the end of the year resulting in increased ECLs for the business unit that manages their exposures . Expected Credit Losses Ratio Based on the above, our ECLs ratios (annualized ECLs over average loans) went slightly up by 2 bp . from 1 . 35 % in the 4 Q 22 to 1 . 37 % in the 4 Q 23 while decreasing 25 bp . from 1 . 23 % in 2022 to 0 . 98 % in 2023 . It is worth noting that when adjusting by additional allowances set in the 4 Q 22 and fully year 2022 , our ECLs ratios would have increased in the 4 Q 23 by 18 bp . and by 20 bp . in 2023 , when compared to the same periods of 2022 . Expected Credit Losses Ratio (1) (Expected Credit Losses / Average Loans) 1.35% 0.98% 1.37% 1.23% 1.23% 1.40% 1.71% 1.29% 4Q22 4Q23 Dec - 23 Dec - 22 BCH Industry (1) Industry s ratios for the 4Q23 and as of December 2023, consider the three - month and the year - to - date periods ended on November 30, 2023. Based on our ECLs ratios, we continued to outperform the industry in terms of risk expenses by 31 bp . in 2023 if contrasted with the 1 . 29 % posted by the industry in the same period (as of Nov 2023 ) . Past - Due Loans Past Due Ratio (1) (>90d Past - Due Loans / Total Loans) 1.08% 1.22% 1.33% 1.35% 1.43% 1.70% 1.85% 1.95% 2.04% 2.15% Dec - 22 Mar - 23 Jun - 23 Sep - 23 Industry Dec - 23 BCH (1) Industry s ratio as of December 2023, consider the year - to - date period ended on November 30, 2023. | 36 Regarding non - performing loans, our past - due ratio (loans overdue 90 days or more) amounted to 1 . 43 % at December 2023 , from the 1 . 08 % reached the previous year . The evolution of our past - due ratio depicts that credit risk metrics continue to be on the road to normalization, on the grounds of lowered liquidity among
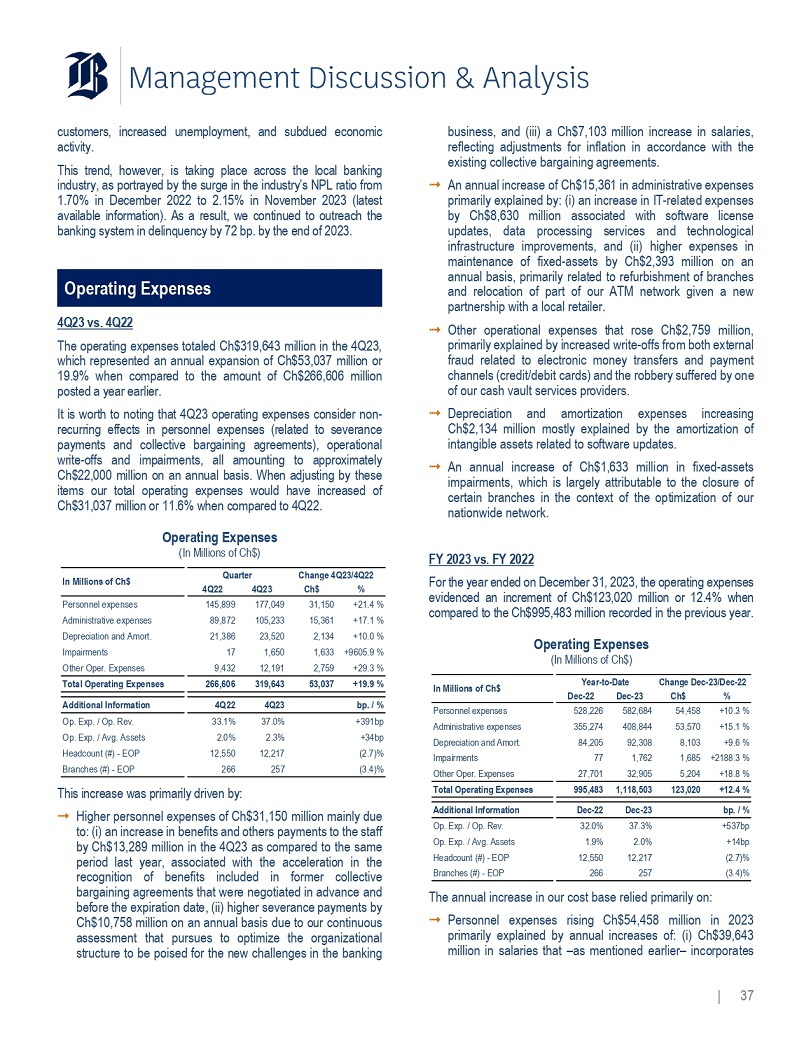
Management Discussion & Analysis customers, increased unemployment, and subdued economic activity . This trend, however, is taking place across the local banking industry, as portrayed by the surge in the industry’s NPL ratio from 1 . 70 % in December 2022 to 2 . 15 % in November 2023 (latest available information) . As a result, we continued to outreach the banking system in delinquency by 72 bp . by the end of 2023 . Operating Expenses 4 Q 23 vs . 4 Q 22 The operating expenses totaled Ch $ 319 , 643 million in the 4 Q 23 , which represented an annual expansion of Ch $ 53 , 037 million or 19 . 9 % when compared to the amount of Ch $ 266 , 606 million posted a year earlier . It is worth to noting that 4 Q 23 operating expenses consider non - recurring effects in personnel expenses (related to severance payments and collective bargaining agreements), operational write - offs and impairments, all amounting to approximately Ch $ 22 , 000 million on an annual basis . When adjusting by these items our total operating expenses would have increased of Ch $ 31 , 037 million or 11 . 6 % when compared to 4 Q 22 . Operating Expenses (In Millions of Ch$) 4Q22 4Q23 +21.4 % 31,150 177,049 145,899 Personnel expenses +17.1 % 15,361 105,233 89,872 Administrative expenses +10.0 % 2,134 23,520 21,386 Depreciation and Amort. +9605.9 % 1,633 1,650 17 Impairments +29.3 % 2,759 12,191 9,432 Other Oper. Expenses +19.9 % 53,037 319,643 266,606 Total Operating Expenses +34bp 2.3% 2.0% Op. Exp. / Avg. Assets (2.6)% 12,229 12,550 Headcount (#) - EOP (3.4)% 257 266 Branches (#) - EOP In Millions of Ch$ Quarter Change 4Q23/4Q22 Ch$ % +10.3 % 54,458 582,684 528,226 Personnel expenses bp. / % 4Q23 4Q22 Additional Information +15.1 % 53,570 408,844 355,274 Administrative expenses +391bp 37.0% 33.1% Op. Exp. / Op. Rev. This increase was primarily driven by : ⭬ Higher personnel expenses of Ch $ 31 , 150 million mainly due to : (i) an increase in benefits and others payments to the staff by Ch $ 13 , 289 million in the 4 Q 23 as compared to the same period last year, associated with the acceleration in the recognition of benefits included in former collective bargaining agreements that were negotiated in advance and before the expiration date, (ii) higher severance payments by Ch $ 10 , 758 million on an annual basis due to our continuous assessment that pursues to optimize the organizational structure to be poised for the new challenges in the banking business, and (iii) a Ch $ 7 , 103 million increase in salaries, reflecting adjustments for inflation in accordance with the existing collective bargaining agreements. ⭬ An annual increase of Ch $ 15 , 361 in administrative expenses primarily explained by : (i) an increase in IT - related expenses by Ch $ 8 , 630 million associated with software license updates, data processing services and technological infrastructure improvements, and (ii) higher expenses in maintenance of fixed - assets by Ch $ 2 , 393 million on an annual basis, primarily related to refurbishment of branches and relocation of part of our ATM network given a new partnership with a local retailer . ⭬ Other operational expenses that rose Ch $ 2 , 759 million, primarily explained by increased write - offs from both external fraud related to electronic money transfers and payment channels (credit/debit cards) and the robbery suffered by one of our cash vault services providers . ⭬ Depreciation and amortization expenses increasing Ch $ 2 , 134 million mostly explained by the amortization of intangible assets related to software updates . ⭬ An annual increase of Ch $ 1 , 633 million in fixed - assets impairments, which is largely attributable to the closure of certain branches in the context of the optimization of our nationwide network . FY 2023 vs. FY 2022 For the year ended on December 31 , 2023 , the operating expenses evidenced an increment of Ch $ 123 , 020 million or 12 . 4 % when compared to the Ch $ 995 , 483 million recorded in the previous year . Operating Expenses (In Millions of Ch$) Year - to - Date Change Dec - 23/Dec - 22 Dec - 22 Dec - 23 Ch$ % +9.6 % 8,103 92,308 84,205 Depreciation and Amort. +2188.3 % 1,685 1,762 77 Impairments +18.8 % 5,204 32,905 27,701 Other Oper. Expenses +12.4 % 123,020 1,118,503 995,483 Total Operating Expenses bp. / % Dec - 23 Dec - 22 Additional Information +537bp 37.3% 32.0% Op. Exp. / Op. Rev. +14bp 2.0% 1.9% Op. Exp. / Avg. Assets (2.6)% 12,229 12,550 Headcount (#) - EOP (3.4)% 257 266 Branches (#) - EOP In Millions of Ch$ The annual increase in our cost base relied primarily on: ⭬ Personnel expenses rising Ch $ 54 , 458 million in 2023 primarily explained by annual increases of : (i) Ch $ 39 , 643 million in salaries that – as mentioned earlier – incorporates | 37
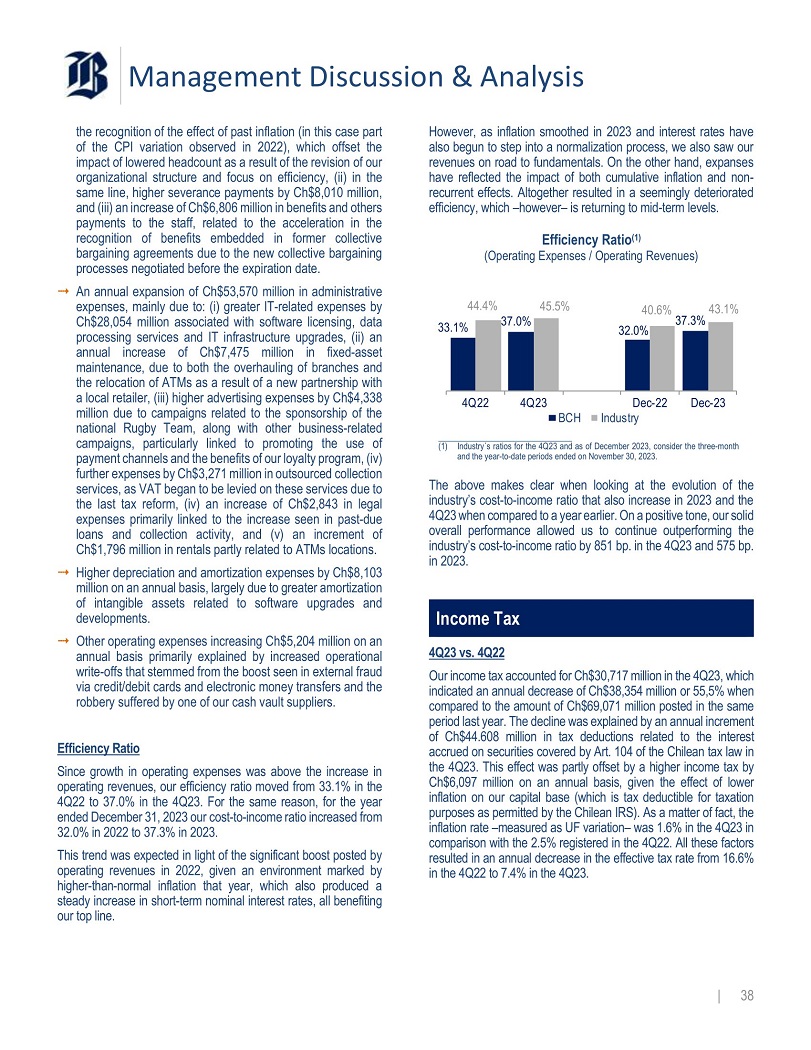
Management Discussion & Analysis the recognition of the effect of past inflation (in this case part of the CPI variation observed in 2022 ), which offset the impact of lowered headcount as a result of the revision of our organizational structure and focus on efficiency, (ii) in the same line, higher severance payments by Ch $ 8 , 010 million, and (iii) an increase of Ch $ 6 , 806 million in benefits and others payments to the staff, related to the acceleration in the recognition of benefits embedded in former collective bargaining agreements due to the new collective bargaining processes negotiated before the expiration date . ⭬ An annual expansion of Ch $ 53 , 570 million in administrative expenses, mainly due to : (i) greater IT - related expenses by Ch $ 28 , 054 million associated with software licensing, data processing services and IT infrastructure upgrades, (ii) an annual increase of Ch $ 7 , 475 million in fixed - asset maintenance, due to both the overhauling of branches and the relocation of ATMs as a result of a new partnership with a local retailer, (iii) higher advertising expenses by Ch $ 4 , 338 million due to campaigns related to the sponsorship of the national Rugby Team, along with other business - related campaigns, particularly linked to promoting the use of payment channels and the benefits of our loyalty program, (iv) further expenses by Ch $ 3 , 271 million in outsourced collection services, as VAT began to be levied on these services due to the last tax reform, (iv) an increase of Ch $ 2 , 843 in legal expenses primarily linked to the increase seen in past - due loans and collection activity, and (v) an increment of Ch $ 1 , 796 million in rentals partly related to ATMs locations . ⭬ Higher depreciation and amortization expenses by Ch $ 8 , 103 million on an annual basis, largely due to greater amortization of intangible assets related to software upgrades and developments . ⭬ Other operating expenses increasing Ch $ 5 , 204 million on an annual basis primarily explained by increased operational write - offs that stemmed from the boost seen in external fraud via credit/debit cards and electronic money transfers and the robbery suffered by one of our cash vault suppliers . Efficiency Ratio Since growth in operating expenses was above the increase in operating revenues, our efficiency ratio moved from 33 . 1 % in the 4 Q 22 to 37 . 0 % in the 4 Q 23 . For the same reason, for the year ended December 31 , 2023 our cost - to - income ratio increased from 32 . 0 % in 2022 to 37 . 3 % in 2023 . This trend was expected in light of the significant boost posted by operating revenues in 2022 , given an environment marked by higher - than - normal inflation that year, which also produced a steady increase in short - term nominal interest rates, all benefiting our top line . However, as inflation smoothed in 2023 and interest rates have also begun to step into a normalization process, we also saw our revenues on road to fundamentals . On the other hand, expanses have reflected the impact of both cumulative inflation and non - recurrent effects . Altogether resulted in a seemingly deteriorated efficiency, which – however – is returning to mid - term levels . Efficiency Ratio (1) (Operating Expenses / Operating Revenues) 33.1% 37.0% 32.0% 37.3% 44.4% 45.5% 40.6% 43.1% 4Q22 4Q23 Dec - 23 Dec - 22 BCH Industry (1) Industry s ratios for the 4Q23 and as of December 2023, consider the three - month and the year - to - date periods ended on November 30, 2023. | 38 The above makes clear when looking at the evolution of the industry’s cost - to - income ratio that also increase in 2023 and the 4 Q 23 when compared to a year earlier . On a positive tone, our solid overall performance allowed us to continue outperforming the industry’s cost - to - income ratio by 851 bp . in the 4 Q 23 and 575 bp . in 2023 . Income Tax 4 Q 23 vs . 4 Q 22 Our income tax accounted for Ch $ 30 , 717 million in the 4 Q 23 , which indicated an annual decrease of Ch $ 38 , 354 million or 55 , 5 % when compared to the amount of Ch $ 69 , 071 million posted in the same period last year . The decline was explained by an annual increment of Ch $ 44 . 608 million in tax deductions related to the interest accrued on securities covered by Art . 104 of the Chilean tax law in the 4 Q 23 . This effect was partly offset by a higher income tax by Ch $ 6 , 097 million on an annual basis, given the effect of lower inflation on our capital base (which is tax deductible for taxation purposes as permitted by the Chilean IRS) . As a matter of fact, the inflation rate – measured as UF variation – was 1 . 6 % in the 4 Q 23 in comparison with the 2 . 5 % registered in the 4 Q 22 . All these factors resulted in an annual decrease in the effective tax rate from 16 . 6 % in the 4 Q 22 to 7 . 4 % in the 4 Q 23 .
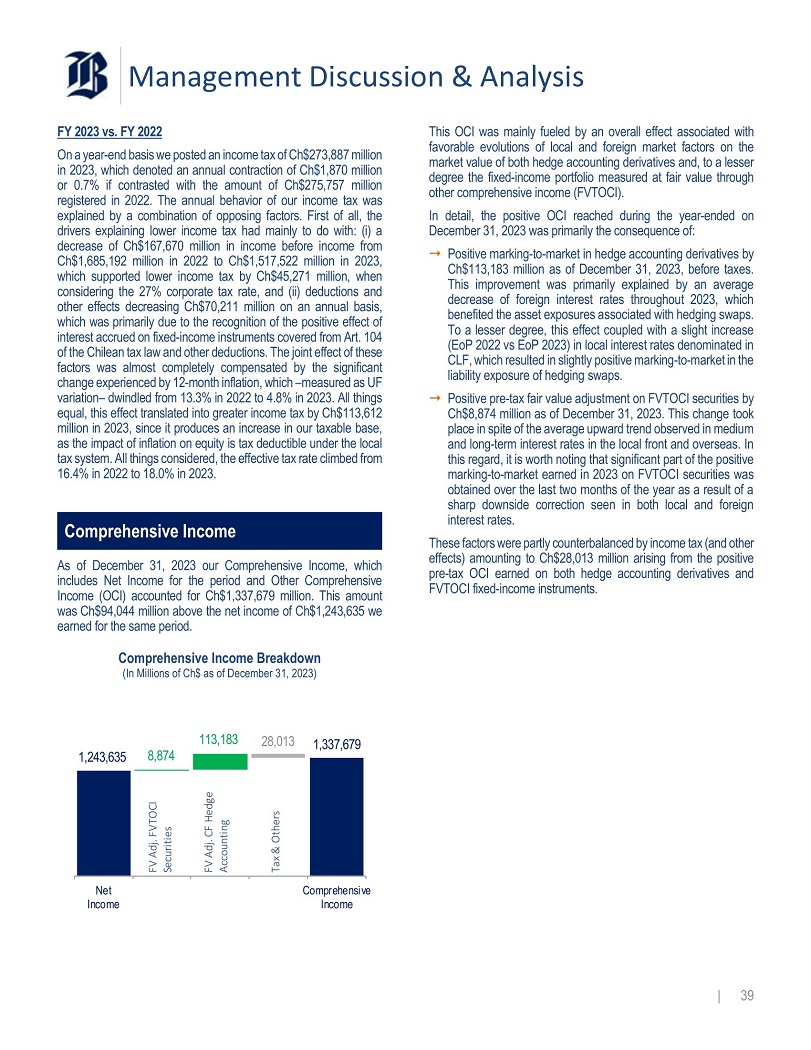
Management Discussion & Analysis FY 2023 vs . FY 2022 On a year - end basis we posted an income tax of Ch $ 273 , 887 million in 2023 , which denoted an annual contraction of Ch $ 1 , 870 million or 0 . 7 % if contrasted with the amount of Ch $ 275 , 757 million registered in 2022 . The annual behavior of our income tax was explained by a combination of opposing factors . First of all, the drivers explaining lower income tax had mainly to do with : (i) a decrease of Ch $ 167 , 670 million in income before income from Ch $ 1 , 685 , 192 million in 2022 to Ch $ 1 , 517 , 522 million in 2023 , which supported lower income tax by Ch $ 45 , 271 million, when considering the 27 % corporate tax rate, and (ii) deductions and other effects decreasing Ch $ 70 , 211 million on an annual basis, which was primarily due to the recognition of the positive effect of interest accrued on fixed - income instruments covered from Art . 104 of the Chilean tax law and other deductions . The joint effect of these factors was almost completely compensated by the significant change experienced by 12 - month inflation, which – measured as UF variation – dwindled from 13 . 3 % in 2022 to 4 . 8 % in 2023 . All things equal, this effect translated into greater income tax by Ch $ 113 , 612 million in 2023 , since it produces an increase in our taxable base, as the impact of inflation on equity is tax deductible under the local tax system . All things considered, the effective tax rate climbed from 16 . 4 % in 2022 to 18 . 0 % in 2023 . Comprehensive Income As of December 31 , 2023 our Comprehensive Income, which includes Net Income for the period and Other Comprehensive Income (OCI) accounted for Ch $ 1 , 337 , 679 million . This amount was Ch $ 94 , 044 million above the net income of Ch $ 1 , 243 , 635 we earned for the same period . Comprehensive Income Breakdown (In Millions of Ch$ as of December 31, 2023) 1,243,635 | 39 1,337,679 8,874 113,183 28,013 Net Income Comprehensive Income FV Adj. FVTOCI Securities FV Adj. CF Hedge Accounting Tax & Others This OCI was mainly fueled by an overall effect associated with favorable evolutions of local and foreign market factors on the market value of both hedge accounting derivatives and, to a lesser degree the fixed - income portfolio measured at fair value through other comprehensive income (FVTOCI) . In detail, the positive OCI reached during the year - ended on December 31 , 2023 was primarily the consequence of : ⭬ Positive marking - to - market in hedge accounting derivatives by Ch $ 113 , 183 million as of December 31 , 2023 , before taxes . This improvement was primarily explained by an average decrease of foreign interest rates throughout 2023 , which benefited the asset exposures associated with hedging swaps . To a lesser degree, this effect coupled with a slight increase (EoP 2022 vs EoP 2023 ) in local interest rates denominated in CLF, which resulted in slightly positive marking - to - market in the liability exposure of hedging swaps . ⭬ Positive pre - tax fair value adjustment on FVTOCI securities by Ch $ 8 , 874 million as of December 31 , 2023 . This change took place in spite of the average upward trend observed in medium and long - term interest rates in the local front and overseas . In this regard, it is worth noting that significant part of the positive marking - to - market earned in 2023 on FVTOCI securities was obtained over the last two months of the year as a result of a sharp downside correction seen in both local and foreign interest rates . These factors were partly counterbalanced by income tax (and other effects) amounting to Ch $ 28 , 013 million arising from the positive pre - tax OCI earned on both hedge accounting derivatives and FVTOCI fixed - income instruments .
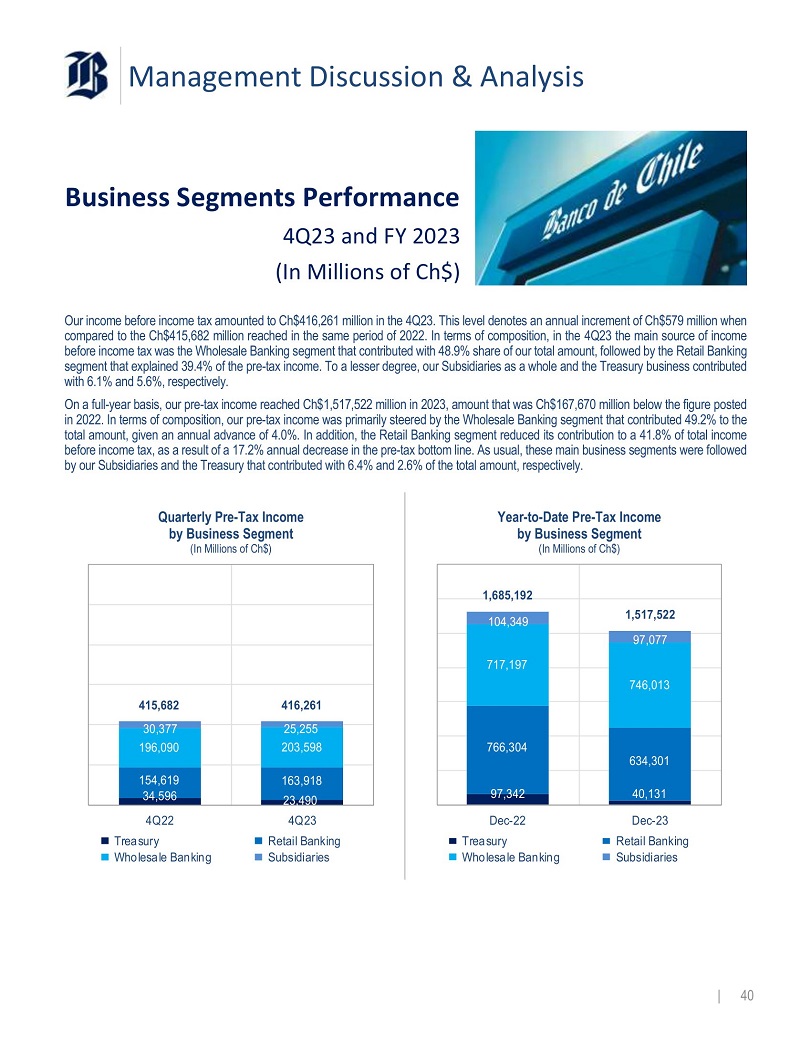
Management Discussion & Analysis Business Segments Performance 4Q23 and FY 2023 (In Millions of Ch$) Our income before income tax amounted to Ch $ 416 , 261 million in the 4 Q 23 . This level denotes an annual increment of Ch $ 579 million when compared to the Ch $ 415 , 682 million reached in the same period of 2022 . In terms of composition, in the 4 Q 23 the main source of income before income tax was the Wholesale Banking segment that contributed with 48 . 9 % share of our total amount, followed by the Retail Banking segment that explained 39 . 4 % of the pre - tax income . To a lesser degree, our Subsidiaries as a whole and the Treasury business contributed with 6 . 1 % and 5 . 6 % , respectively . On a full - year basis, our pre - tax income reached Ch $ 1 , 517 , 522 million in 2023 , amount that was Ch $ 167 , 670 million below the figure posted in 2022 . In terms of composition, our pre - tax income was primarily steered by the Wholesale Banking segment that contributed 49 . 2 % to the total amount, given an annual advance of 4 . 0 % . In addition, the Retail Banking segment reduced its contribution to a 41 . 8 % of total income before income tax, as a result of a 17 . 2 % annual decrease in the pre - tax bottom line . As usual, these main business segments were followed by our Subsidiaries and the Treasury that contributed with 6 . 4 % and 2 . 6 % of the total amount, respectively . Quarterly Pre - Tax Income by Business Segment (In Millions of Ch$) 416,261 415,682 25,255 203,598 30,377 196,090 163,918 23,490 154,619 34,596 4Q22 Treasury Wholesale Banking 4Q23 Retail Banking Subsidiaries Year - to - Date Pre - Tax Income by Business Segment (In Millions of Ch$) 97,342 766,304 634,301 40,131 717,197 746,013 104,349 97,077 1,685,192 1,517,522 Dec - 22 Treasury Wholesale Banking Dec - 23 Retail Banking Subsidiaries | 40
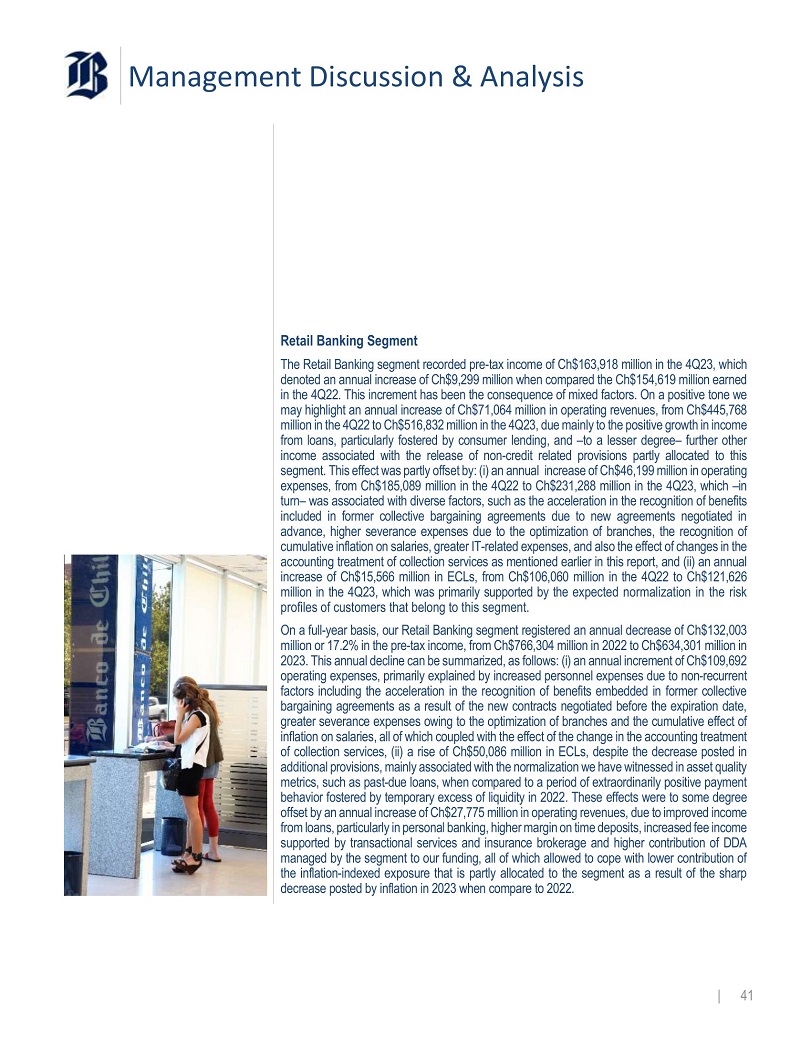
Management Discussion & Analysis Retail Banking Segment The Retail Banking segment recorded pre - tax income of Ch $ 163 , 918 million in the 4 Q 23 , which denoted an annual increase of Ch $ 9 , 299 million when compared the Ch $ 154 , 619 million earned in the 4 Q 22 . This increment has been the consequence of mixed factors . On a positive tone we may highlight an annual increase of Ch $ 71 , 064 million in operating revenues, from Ch $ 445 , 768 million in the 4 Q 22 to Ch $ 516 , 832 million in the 4 Q 23 , due mainly to the positive growth in income from loans, particularly fostered by consumer lending, and – to a lesser degree – further other income associated with the release of non - credit related provisions partly allocated to this segment . This effect was partly offset by : (i) an annual increase of Ch $ 46 , 199 million in operating expenses, from Ch $ 185 , 089 million in the 4 Q 22 to Ch $ 231 , 288 million in the 4 Q 23 , which – in turn – was associated with diverse factors, such as the acceleration in the recognition of benefits included in former collective bargaining agreements due to new agreements negotiated in advance, higher severance expenses due to the optimization of branches, the recognition of cumulative inflation on salaries, greater IT - related expenses, and also the effect of changes in the accounting treatment of collection services as mentioned earlier in this report, and (ii) an annual increase of Ch $ 15 , 566 million in ECLs, from Ch $ 106 , 060 million in the 4 Q 22 to Ch $ 121 , 626 million in the 4 Q 23 , which was primarily supported by the expected normalization in the risk profiles of customers that belong to this segment . On a full - year basis, our Retail Banking segment registered an annual decrease of Ch $ 132 , 003 million or 17 . 2 % in the pre - tax income, from Ch $ 766 , 304 million in 2022 to Ch $ 634 , 301 million in 2023 . This annual decline can be summarized, as follows : (i) an annual increment of Ch $ 109 , 692 operating expenses, primarily explained by increased personnel expenses due to non - recurrent factors including the acceleration in the recognition of benefits embedded in former collective bargaining agreements as a result of the new contracts negotiated before the expiration date, greater severance expenses owing to the optimization of branches and the cumulative effect of inflation on salaries, all of which coupled with the effect of the change in the accounting treatment of collection services, (ii) a rise of Ch $ 50 , 086 million in ECLs, despite the decrease posted in additional provisions, mainly associated with the normalization we have witnessed in asset quality metrics, such as past - due loans, when compared to a period of extraordinarily positive payment behavior fostered by temporary excess of liquidity in 2022 . These effects were to some degree offset by an annual increase of Ch $ 27 , 775 million in operating revenues, due to improved income from loans, particularly in personal banking, higher margin on time deposits, increased fee income supported by transactional services and insurance brokerage and higher contribution of DDA managed by the segment to our funding, all of which allowed to cope with lower contribution of the inflation - indexed exposure that is partly allocated to the segment as a result of the sharp decrease posted by inflation in 2023 when compare to 2022 . | 41
Management Discussion & Analysis Wholesale Banking Segment The Wholesale Banking segment posted pre - tax income of Ch $ 203 , 598 million in the 4 Q 23 , which represented an increase of Ch $ 7 , 508 million or 3 . 8 % when compared to the figure posted in the same period of 2022 . This performance was mainly the result of : (i) a decline of Ch $ 10 , 979 million in ECLs in the 4 Q 23 , from the Ch $ 50 , 966 million posted in the 4 Q 22 , which was primarily explained by the decrease experienced by additional provisions, as mentioned earlier, that are partly allocated to this segment as well, in addition to a net credit quality improvement given favorable changes in the financial condition of customers that participate in specific sectors, (ii) higher operating revenues by Ch $ 5 , 122 million on an annual basis, primarily due to higher other income associated with the release of non - credit related provisions, higher fee income related to services and products rendered by the segment and enhanced contribution of DDA managed by the segment to our cost of funds, all permitting us to deal with the impact of lower inflation on the portion of the UF net asset position allocated to the segment and a slight decrease in income from loans, due to lowered average balances . These effects were partially offset by a rise in operating expenses by Ch $ 8 , 593 million associated mainly, as in the Retail Banking segment, to factors such as expenses related to collective bargaining agreements negotiated in advance, severance expenses, the recognition of cumulative inflation on salaries, greater IT - related expenses . In the full - year 2023 , the Wholesale Banking segment posted total pre - tax income of Ch $ 746 , 013 million, amount that was Ch $ 28 , 816 million above the level registered in 2022 . In this case, the main underlying factors explaining this annual growth we may highlight the sharp annual decrease of Ch $ 113 , 188 million in ECLs, attributable to no additional allowances set in 2023 as compared to 2022 , partly allocated to this segment, which coupled with asset quality improvements in some industries served by this segment that benefited the risk profile of wholesale banking customers, as described earlier . This effect was partly offset by : (i) an annual decrease of Ch $ 63 , 472 million in operating revenues, mostly due to the already mentioned impact of lower inflation on net interest income, as part of our inflation - indexed exposure is allocated to this segment, which was to some extent counterbalanced by higher DDA funding contribution on the grounds of higher interest rates on average, and (ii) operating expenses increasing Ch $ 20 , 900 million, primarily due to cumulative inflation effect on salaries and other one - time effect on personnel expenses, such as the acceleration in the recognition of benefits provided through former collective bargaining agreements as we anticipated negotiations with some of our unions and increased severance expenses as a result of organizational restructuring . | 42
Management Discussion & Analysis Treasury Segment Our Treasury posted income before income tax of Ch $ 23 , 490 million in the 4 Q 23 , which means an Ch $ 11 , 106 million decline when compared to a year earlier . Even though the 4 Q 23 was a positive one, the annual underperformance when compared to the 4 Q 22 was mainly explained by less favorable changes in market factors or a comparison base effect . For instance, inflation decreased from 2 . 5 % in the 4 Q 22 to 1 . 6 % in the 4 Q 23 , while changes in short - term and long - term interest rates were not as favorable as those observed in the las three months of 2022 . These trends affected the operating revenues generated by the segment that decreased Ch $ 11 , 564 million in the 4 Q 23 when compared to a year earlier . Specifically, this decline in the top line was the result of : (i) lower income from the management of our Investment Portfolio by Ch $ 2 , 929 million on an annual basis, primarily explained by the steady surge in foreign long - term interest rates that was to some extent compensated by interest rates in local currency that declined by the end of 2023 , which negatively impacted on the fair value of fixed - income securities managed by the Debt Securities desk, and (ii) an annual decline of Ch $ 5 , 974 million from the management of the Trading desk, including CVA/DVA for derivatives, mainly due to the changes in market factors mentioned above and worsened credit profiles of some derivative counterparties that resulted in increased CVA charges in the 4 Q 23 compared to 4 Q 22 . Although posting a positive bottom line of Ch $ 40 , 131 million in the full - year 2023 , our Treasury presented an annual decline of Ch $ 57 , 211 million when compared to the Ch $ 97 , 342 million posted in 2022 . This performance had to do with a marked change in market factors, particularly in inflation and interest rates . Accordingly, the lower pre - tax income was primarily explained by a decrease of Ch $ 68 , 039 million in operating revenues that, in turn, was attributable to : (i) lower net financial income from the management of our Investment Portfolio by Ch $ 41 , 506 million in 2023 , primarily explained by the steady upward trend shown by local interest rates – particularly in UF – until the October 2023 , which significantly battered the fair value of fixed - income securities, and (ii) lower revenues from our Trading Desk by Ch $ 22 , 484 million in 2023 , which was to great extent underlain by a high comparison base, given by increased volatility that benefited the marking - to - market of trading positions in 2022 , together with increased charges of CVA/DVA for derivatives . In both cases, moreover, it is worth noting that short - term nominal interest rates remained at higher - than expected levels all through 2023 , which adversely affected the cost of funds for positions with shorter maturities, such as trading ones . These factors were to some degree offset by a decrease in impairments for fixed - income securities booked as FVTOCI and amortized cost by Ch $ 10 , 762 million in 2023 when compared to 2022 , primarily given enhanced credit spreads on short - term securities (CDs) issued by local banks . | 43
Management Discussion & Analysis Subsidiaries Overall, our Subsidiaries reached pre - tax income of Ch $ 25 , 255 million in the 4 Q 23 , amount that was Ch $ 5 , 122 million below the level posted in the same period last year . This decrease was the result of : (i) lower income before income tax by Ch $ 3 , 640 million from our Stock Brokerage subsidiary mostly affected by the impact of less favorable interest rates changes on the own portfolio managed by the subsidiary in the 4 Q 23 when compared to the 4 Q 22 , (ii) an annual decrease of Ch $ 1 , 708 million in the pre - tax income of our Collection Services Business mainly due to higher personnel expenses related to inflation recognition and further administrative expenses, (iii) an annual decline of Ch $ 660 million in the pre - tax income of our Insurance Brokerage subsidiary totally explained by higher personnel expenses, and (iv) lower pre - tax income of Ch $ 593 million in our Mutual Funds subsidiary due to both an increase in operating expenses and lower operating income due to changes in investors’ preferences that have moved towards fixed - income funds that bear lower margins, given the expected path to be followed by interest rates in coming quarters . These effects were partly offset by an annual increase of Ch $ 1 , 480 million in pre - tax income of our Financial Investment business mainly explained by the increase in operating income due to a higher volume of transactions . In 2023 , our Subsidiaries jointly posted an annual income before income tax of Ch $ 97 , 077 million, which represented an annual contraction of Ch $ 7 , 272 million when compared to the same period last year . This behavior was mainly supported by : (i) an annual decrease of Ch $ 3 , 578 million in pre - tax income earned by our Stock Brokerage subsidiary, primarily due to increased costs as a consequence of the recognition of cumulative inflation on salaries and greater IT - related expenses, (ii) lower income before income tax of our Mutual Funds subsidiary by Ch $ 3 , 206 million, as investors moved from equity to fixed - income funds waiting for the expected downward correction in interest rates, a mix change that resulted in lower margins, (iii) an annual decline of Ch $ 3 , 032 million in the pre - tax income of our Investment Banking subsidiary as a consequence of lower business activity in 2023 , in connection with subdued economic growth, and (iv) lower pre - tax income of Ch $ 1 , 295 million in our Collection Services subsidiary, fully explained by higher personnel expenses . These factors were partly offset greater income before income tax from our Insurance Brokerage subsidiary by Ch $ 3 , 839 million in 2023 in comparison with a year earlier, which was primarily prompted by higher fee - income generated by the recovery evidenced in consumer loans and the enhancement of non - credit related insurance business . | 44
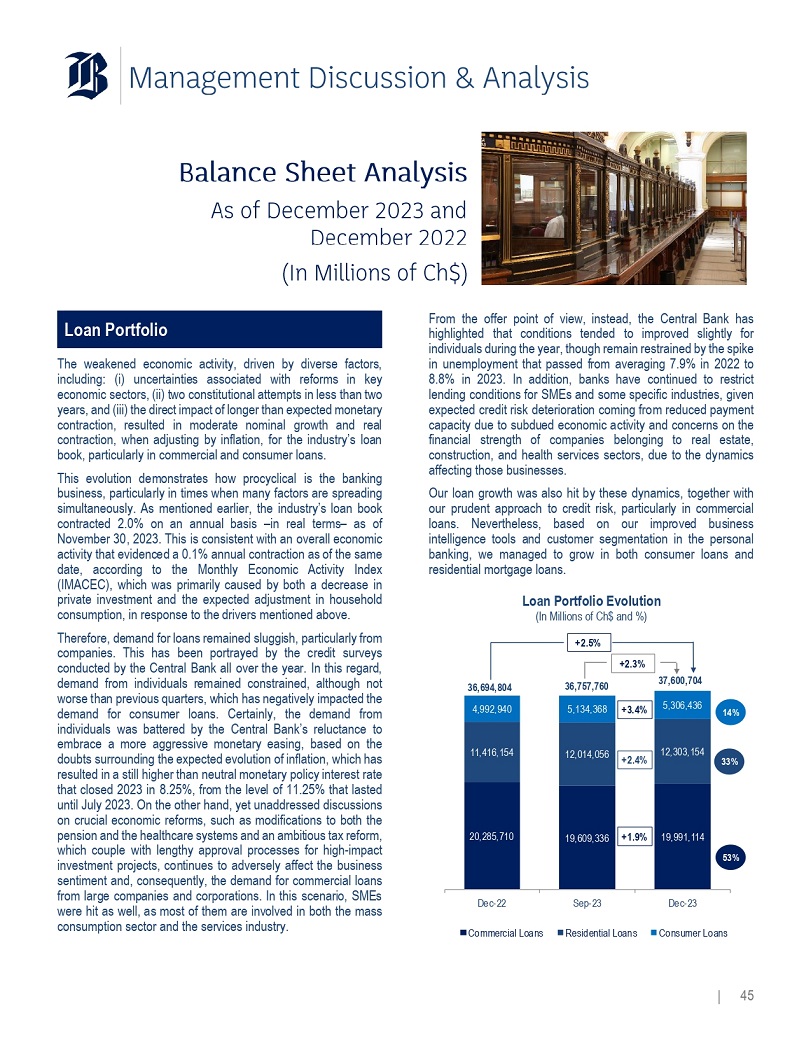
Management Discussion & Analysis Balance Sheet Analysis As of December 2023 and December 2022 (In Millions of Ch$) Loan Portfolio The weakened economic activity, driven by diverse factors, including : (i) uncertainties associated with reforms in key economic sectors, (ii) two constitutional attempts in less than two years, and (iii) the direct impact of longer than expected monetary contraction, resulted in moderate nominal growth and real contraction, when adjusting by inflation, for the industry’s loan book, particularly in commercial and consumer loans . This evolution demonstrates how procyclical is the banking business, particularly in times when many factors are spreading simultaneously . As mentioned earlier, the industry’s loan book contracted 2 . 0 % on an annual basis – in real terms – as of November 30 , 2023 . This is consistent with an overall economic activity that evidenced a 0 . 1 % annual contraction as of the same date, according to the Monthly Economic Activity Index (IMACEC), which was primarily caused by both a decrease in private investment and the expected adjustment in household consumption, in response to the drivers mentioned above . Therefore, demand for loans remained sluggish, particularly from companies . This has been portrayed by the credit surveys conducted by the Central Bank all over the year . In this regard, the survey for the 4 Q 23 has not been the exception by indicating that the demand from individuals remained constrained, although not worse than previous quarters, which has negatively impacted the demand for consumer loans . Certainly, the demand from individuals was battered by the Central Bank’s reluctance to embrace a more aggressive monetary easing, based on the doubts surrounding the expected evolution of inflation, which has resulted in a still higher than neutral monetary policy interest rate that closed 2023 in 8 . 25 % , from the level of 11 . 25 % that lasted until July 2023 . On the other hand, yet unaddressed discussions on crucial economic reforms, such as modifications to both the pension and the healthcare systems and an ambitious tax reform, which couple with lengthy approval processes for high - impact investment projects, continues to adversely affect the business sentiment and, consequently, the demand for commercial loans from large companies and corporations . In this scenario, SMEs were hit as well, as most of them are involved in both the mass consumption sector and the services industry . From the offer point of view, instead, the Central Bank highlighted those conditions tended to improved slightly for individuals during the year, though remain restrained by the spike in unemployment that passed from averaging 7 . 9 % in 2022 to 8 . 8 % in 2023 . In addition, banks have continued to restrict lending conditions for SMEs and some specific industries, given expected credit risk deterioration coming from reduced payment capacity due to subdued economic activity and concerns on the financial strength of companies belonging to real estate, construction, and health services sectors, due to the dynamics affecting those businesses . Our loan growth was also hit by these dynamics, together with our prudent approach to credit risk, particularly in commercial loans . Nevertheless, based on our improved business intelligence tools and customer segmentation in the personal banking, we managed to grow in both consumer loans and residential mortgage loans . Loan Portfolio Evolution (In Millions of Ch$ and %) 20,285,710 19,609,336 19,991,114 11,416,154 12,014,056 12,303,154 4,992,940 5,134,368 5,306,436 36,694,804 36,757,760 37,600,704 Dec - 22 Sep - 23 Dec - 23 Commercial Loans Residential Loans Consumer Loans +1.9% +2.4% +2.5% 53% 33% 14% +3.4% +2.3% | 45
Management Discussion & Analysis Thus, as of December 31 , 2023 our total loans accounted for Ch $ 37 , 600 , 704 million, which represented an annual increase of Ch $ 905 , 900 million or 2 . 5 % when compared to the Ch $ 36 , 694 , 804 million at the end of 2022 . As previously mentioned, this expansion is in line with the evolution of the industry’s loan book by denoting a moderate contraction in real terms, which in turn was fostered by constrained demand for commercial loans that was more than offset by growth in both consumer and residential mortgage loans . When looking at a lending product level, our loan book expansion was sustained by : ⭬ An annual increase of Ch $ 887 , 000 million or 7 . 8 % in residential mortgage loans that totalled Ch $ 12 , 303 , 154 million at the end of 2023 in comparison with the Ch $ 11 , 416 , 154 million balance in December 2022 . This expansion represented positive real growth of around 3 . 0 % when adjusting by inflation . During 2023 , residential mortgage loans have continued to be decoupled from economic and financial conditions . Although demand for this type of loans seemed to temper during some periods of the last and this year as well, primarily due to increasing long - term interest rates and soared inflation, the specific dynamics influencing the housing market, such as steadily increasing demand and supply management, have continued to support loan growth . Therefore, the annual expansion in residential mortgage loans has been fostered by : (i) an increase of 68 . 1 % in loan origination that evolved from Ch $ 814 , 139 million in 2022 to Ch $ 1 , 368 , 376 million in 2023 , which was mainly the result of improved risk intelligence that has bolstered the effectiveness of commercial campaigns targeting specific personal banking subsegments . Additionally, as most of residential mortgage loans are denominated in UF, the annual rise of 4 . 8 % in inflation, measured as UF variation, also contributed to explain a large portion of total nominal growth . ⭬ An annual expansion of Ch $ 313 , 496 million or 6 . 3 % in consumer loans, which amounted to Ch $ 5 , 306 , 436 million as of December 31 , 2023 in relation to the Ch $ 4 , 992 , 940 million recorded in December 2022 . As in the case of residential mortgage loans, the reactivation of targeted campaigns, based on accurate analytics, enabled us to maintain a reasonable performance in terms of installment loan origination by achieving a total amount of Ch $ 1 , 961 , 909 million in 2023 that represented a moderate, though steady, annual growth of 1 . 9 % when compared to the level posted in 2022 . As a result, installment loans amounted to Ch $ 3 , 181 , 587 million as of December 31 , 2023 , which was 2 . 1 % above the Ch $ 3 , 114 , 956 million reached in December 2022 . Furthermore, the main source of growth in consumer loans was the expansion in credit card loans . These credits accounted for Ch $ 1 , 852 , 377 million on December 31 , 2023 , which represented an annual growth Ch $ 228 , 841 million or 14 . 1 % when compared to 2022 . This expansion has been the | 46 consequence of diverse strategies we have deployed to promote the use of credit cards as main payment channel for our customers by delivering more benefits through our loyalty program while improving segmentation to target medium and upper - income segments of Retail Banking with tailored value offerings . Likewise, we have witnessed a significant increase in the usage of this payment channel after the pandemic, as the use of cash decreased dramatically among banking customers for purchases of all type of goods and services through internet and mobile apps, which gave dramatic traction to payments with credit cards . Furthermore, the year ended on December 31 , 2022 represents a low comparison base, since the overall liquidity surplus caused by extraordinary aid measures (pension funds withdrawals) was still present among personal banking customers while disappearing in 2023 , which indirectly resulted in higher credit card related loans . It is worth noting, however, that in parallel with developing improved commercial strategies, we have also made significant progress in our scoring and provisioning models to deal with the steepening in credit card lending while bolstering our knowledge of the diverse personal banking subsegments that have starred this expansion . ⭬ A 12 - month contraction of Ch $ 294 , 596 million or 1 . 5 % in commercial loans from Ch $ 20 , 285 , 710 million recorded as of December 31 , 2022 to Ch $ 19 , 991 , 114 million in December 2023 . As mentioned earlier, this evolution was in line with findings revealed for the industry in terms of commercial loans expansion and the insights shared by the Central Bank in the quarterly credit surveys released throughout the year . The decline in commercial loan balances was particularly concentrated in commercial credits, which had to do with both an important decrease in demand for loans from Wholesale Banking customers and demand stagnation from SMEs, notwithstanding the measures adopted to reactivate the latter . Hence, amid a scenario characterized by falling private investment – given the doubts on the evolution of political and economic reforms mentioned earlier – and still high interest rates, the business sentiment has not been able to take off from negative territory . As a consequence, Wholesale Banking customers have postponed, or even dismissed, capital expenditure plans, which has resulted in lower demand for medium and long - term commercial credits . The case of SMEs is somewhat different, since the government launched a new state - guaranteed credit program in 2023 , called “ FOGAPE Chile Apoya ”, to support these types of borrowers (and middle market companies) by means of improving their risk profiles through guarantees with the purpose to facilitate their access to working capital financing to deal with the lagged effects of the pandemic downturn . As of December 31 , 2023 we had “FOGAPE Chile Apoya” loans amounting to Ch $ 808 , 182 million, which significantly sustained the evolution of SMEs loans while enabling us overcome the scheduled amortization of former FOGAPE loan programs . In this regard, as of the
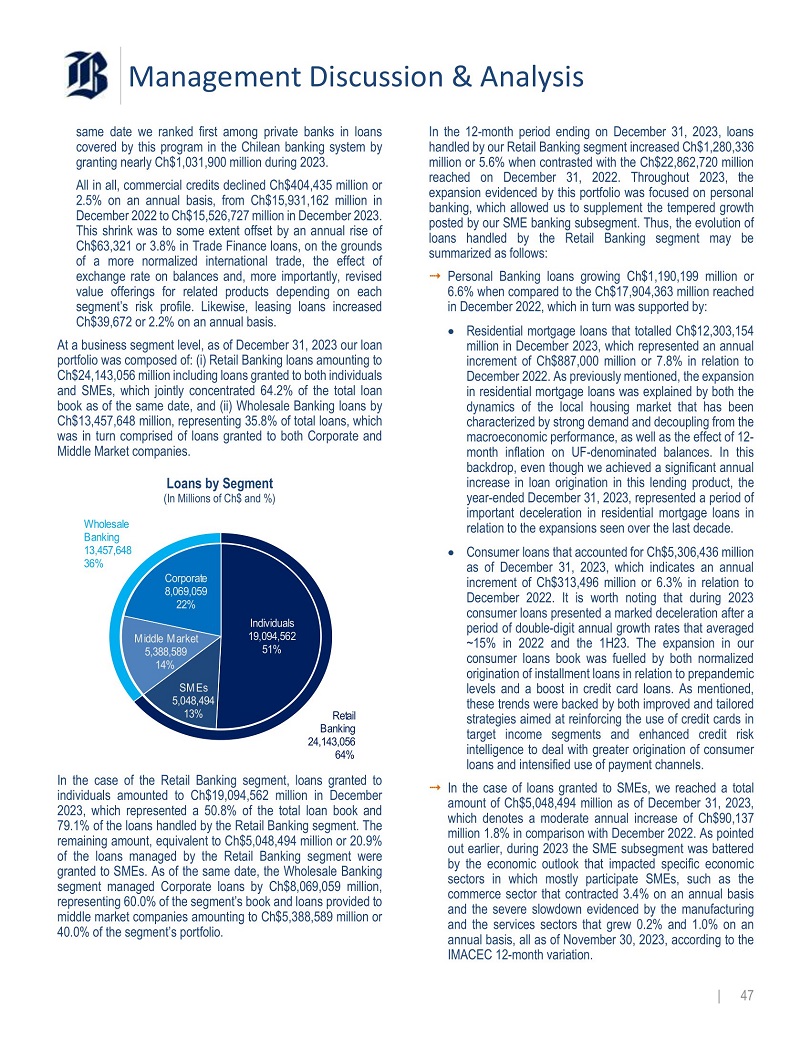
Management Discussion & Analysis Retail Banking 24,143,056 64% Individuals 19,094,562 51% IMACEC 12 - month variation. | 47 Middle Market 5,388,589 14% SMEs 5,048,494 13% same date we ranked first among private banks in loans covered by this program in the Chilean banking system by granting nearly Ch $ 1 , 031 , 900 million during 2023 . All in all, commercial credits declined Ch $ 404 , 435 million or 2 . 5 % on an annual basis, from Ch $ 15 , 931 , 162 million in December 2022 to Ch $ 15 , 526 , 727 million in December 2023 . This shrink was to some extent offset by an annual rise of Ch $ 63 , 321 or 3 . 8 % in Trade Finance loans, on the grounds of a more normalized international trade, the effect of exchange rate on balances and, more importantly, revised value offerings for related products depending on each segment’s risk profile . Likewise, leasing loans increased Ch $ 39 , 672 or 2 . 2 % on an annual basis . At a business segment level, as of December 31 , 2023 our loan portfolio was composed of : (i) Retail Banking loans amounting to Ch $ 24 , 143 , 056 million including loans granted to both individuals and SMEs, which jointly concentrated 64 . 2 % of the total loan book as of the same date, and (ii) Wholesale Banking loans by Ch $ 13 , 457 , 648 million, representing 35 . 8 % of total loans, which was in turn comprised of loans granted to both Corporate and Middle Market companies . Loans by Segment (In Millions of Ch$ and %) Wholesale Banking 13,457,648 36% Corporate 8,069,059 22% In the case of the Retail Banking segment, loans granted to individuals amounted to Ch $ 19 , 094 , 562 million in December 2023 , which represented a 50 . 8 % of the total loan book and 79 . 1 % of the loans handled by the Retail Banking segment . The remaining amount, equivalent to Ch $ 5 , 048 , 494 million or 20 . 9 % of the loans managed by the Retail Banking segment were granted to SMEs . As of the same date, the Wholesale Banking segment managed Corporate loans by Ch $ 8 , 069 , 059 million, representing 60 . 0 % of the segment’s book and loans provided to middle market companies amounting to Ch $ 5 , 388 , 589 million or 40 . 0 % of the segment’s portfolio . In the 12 - month period ending on December 31 , 2023 , loans handled by our Retail Banking segment increased Ch $ 1 , 280 , 336 million or 5 . 6 % when contrasted with the Ch $ 22 , 862 , 720 million reached on December 31 , 2022 . Throughout 2023 , the expansion evidenced by this portfolio was focused on personal banking, which allowed us to supplement the tempered growth posted by our SME banking subsegment . Thus, the evolution of loans handled by the Retail Banking segment may be summarized as follows : ⭬ Personal Banking loans growing Ch $ 1 , 190 , 199 million or 6 . 6 % when compared to the Ch $ 17 , 904 , 363 million reached in December 2022 , which in turn was supported by : ● Residential mortgage loans that totalled Ch $ 12 , 303 , 154 million in December 2023 , which represented an annual increment of Ch $ 887 , 000 million or 7 . 8 % in relation to December 2022 . As previously mentioned, the expansion in residential mortgage loans was explained by both the dynamics of the local housing market that has been characterized by strong demand and decoupling from the macroeconomic performance, as well as the effect of 12 - month inflation on UF - denominated balances . In this backdrop, even though we achieved a significant annual increase in loan origination in this lending product, the year - ended December 31 , 2023 , represented a period of important deceleration in residential mortgage loans in relation to the expansions seen over the last decade . ● Consumer loans that accounted for Ch $ 5 , 306 , 436 million as of December 31 , 2023 , which indicates an annual increment of Ch $ 313 , 496 million or 6 . 3 % in relation to December 2022 . It is worth noting that during 2023 consumer loans presented a marked deceleration after a period of double - digit annual growth rates that averaged ~ 15 % in 2022 and the 1 H 23 . The expansion in our consumer loans book was fuelled by both normalized origination of installment loans in relation to prepandemic levels and a boost in credit card loans . As mentioned, these trends were backed by both improved and tailored strategies aimed at reinforcing the use of credit cards in target income segments and enhanced credit risk intelligence to deal with greater origination of consumer loans and intensified use of payment channels . ⭬ In the case of loans granted to SMEs, we reached a total amount of Ch $ 5 , 048 , 494 million as of December 31 , 2023 , which denotes a moderate annual increase of Ch $ 90 , 137 million 1 . 8 % in comparison with December 2022 . As pointed out earlier, during 2023 the SME subsegment was battered by the economic outlook that impacted specific economic sectors in which mostly participate SMEs, such as the commerce sector that contracted 3 . 4 % on an annual basis and the severe slowdown evidenced by the manufacturing and the services sectors that grew 0 . 2 % and 1 . 0 % on an annual basis, all as of November 30 , 2023 , according to the
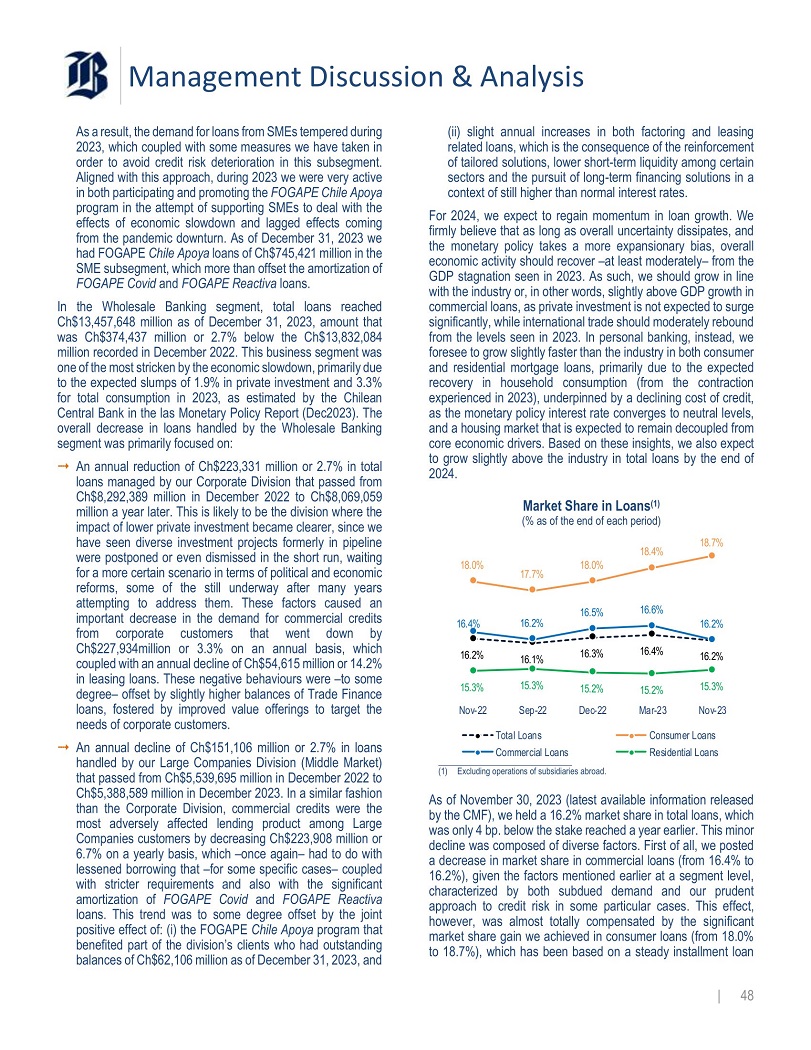
Management Discussion & Analysis As a result, the demand for loans from SMEs tempered during 2023 , which coupled with some measures we have taken in order to avoid credit risk deterioration in this subsegment . Aligned with this approach, during 2023 we were very active in both participating and promoting the FOGAPE Chile Apoya program in the attempt of supporting SMEs to deal with the effects of economic slowdown and lagged effects coming from the pandemic downturn . As of December 31 , 2023 we had FOGAPE Chile Apoya loans of Ch $ 745 , 421 million in the SME subsegment, which more than offset the amortization of FOGAPE Covid and FOGAPE Reactiva loans . In the Wholesale Banking segment, total loans reached Ch $ 13 , 457 , 648 million as of December 31 , 2023 , amount that was Ch $ 374 , 437 million or 2 . 7 % below the Ch $ 13 , 832 , 084 million recorded in December 2022 . This business segment was one of the most stricken by the economic slowdown, primarily due to the expected slumps of 1 . 9 % in private investment and 3 . 3 % for total consumption in 2023 , as estimated by the Chilean Central Bank in the las Monetary Policy Report (Dec 2023 ) . The overall decrease in loans handled by the Wholesale Banking segment was primarily focused on : ⭬ An annual reduction of Ch $ 223 , 331 million or 2 . 7 % in total loans managed by our Corporate Division that passed from Ch $ 8 , 292 , 389 million in December 2022 to Ch $ 8 , 069 , 059 million a year later . This is likely to be the division where the impact of lower private investment became clearer, since we have seen diverse investment projects formerly in pipeline were postponed or even dismissed in the short run, waiting for a more certain scenario in terms of political and economic reforms, some of the still underway after many years attempting to address them . These factors caused an important decrease in the demand for commercial credits from corporate customers that went down by Ch $ 227 , 934 million or 3 . 3 % on an annual basis, which coupled with an annual decline of Ch $ 54 , 615 million or 14 . 2 % in leasing loans . These negative behaviours were – to some degree – offset by slightly higher balances of Trade Finance loans, fostered by improved value offerings to target the needs of corporate customers . ⭬ An annual decline of Ch $ 151 , 106 million or 2 . 7 % in loans handled by our Large Companies Division (Middle Market) that passed from Ch $ 5 , 539 , 695 million in December 2022 to Ch $ 5 , 388 , 589 million in December 2023 . In a similar fashion than the Corporate Division, commercial credits were the most adversely affected lending product among Large Companies customers by decreasing Ch $ 223 , 908 million or 6 . 7 % on a yearly basis, which – once again – had to do with lessened borrowing that – for some specific cases – coupled with stricter requirements and also with the significant amortization of FOGAPE Covid and FOGAPE Reactiva loans . This trend was to some degree offset by the joint positive effect of : (i) the FOGAPE Chile Apoya program that benefited part of the division’s clients who had outstanding (ii) slight annual increases in both factoring and leasing related loans, which is the consequence of the reinforcement of tailored solutions, lower short - term liquidity among certain sectors and the pursuit of long - term financing solutions in a context of still higher than normal interest rates . For 2024 , we expect to regain momentum in loan growth . We firmly believe that as long as overall uncertainty dissipates, and the monetary policy takes a more expansionary bias, overall economic activity should recover – at least moderately – from the GDP stagnation seen in 2023 . As such, we should grow in line with the industry or, in other words, slightly above GDP growth in commercial loans, as private investment is not expected to surge significantly, while international trade should moderately rebound from the levels seen in 2023 . In personal banking, instead, we foresee to grow slightly faster than the industry in both consumer and residential mortgage loans, primarily due to the expected recovery in household consumption (from the contraction experienced in 2023 ), underpinned by a declining cost of credit, as the monetary policy interest rate converges to neutral levels, and a housing market that is expected to remain decoupled from core economic drivers . Based on these insights, we also expect to grow slightly above the industry in total loans by the end of 2024 . Market Share in Loans (1) (% as of the end of each period) 16.2% 16.1% 16.3% 16.4% 16.2% 18.0% 17.7% 18.0% 18.4% 18.7% 16.4% 16.2% 16.5% 16.6% 16.2% 15.3% 15.2% 15.2% 15.3% 15.3% Nov - 23 Mar - 23 Dec - 22 Sep - 22 Nov - 22 Total Loans Consumer Loans Residential Loans Commercial Loans (1) Excluding operations of subsidiaries abroad. balances of Ch$62,106 million as of December 31, 2023, and | 48 As of November 30 , 2023 (latest available information released by the CMF), we held a 16 . 2 % market share in total loans, which was only 4 bp . below the stake reached a year earlier . This minor decline was composed of diverse factors . First of all, we posted a decrease in market share in commercial loans (from 16 . 4 % to 16 . 2 % ), given the factors mentioned earlier at a segment level, characterized by both subdued demand and our prudent approach to credit risk in some particular cases . This effect, however, was almost totally compensated by the significant market share gain we achieved in consumer loans (from 18 . 0 % to 18 . 7 % ), which has been based on a steady installment loan
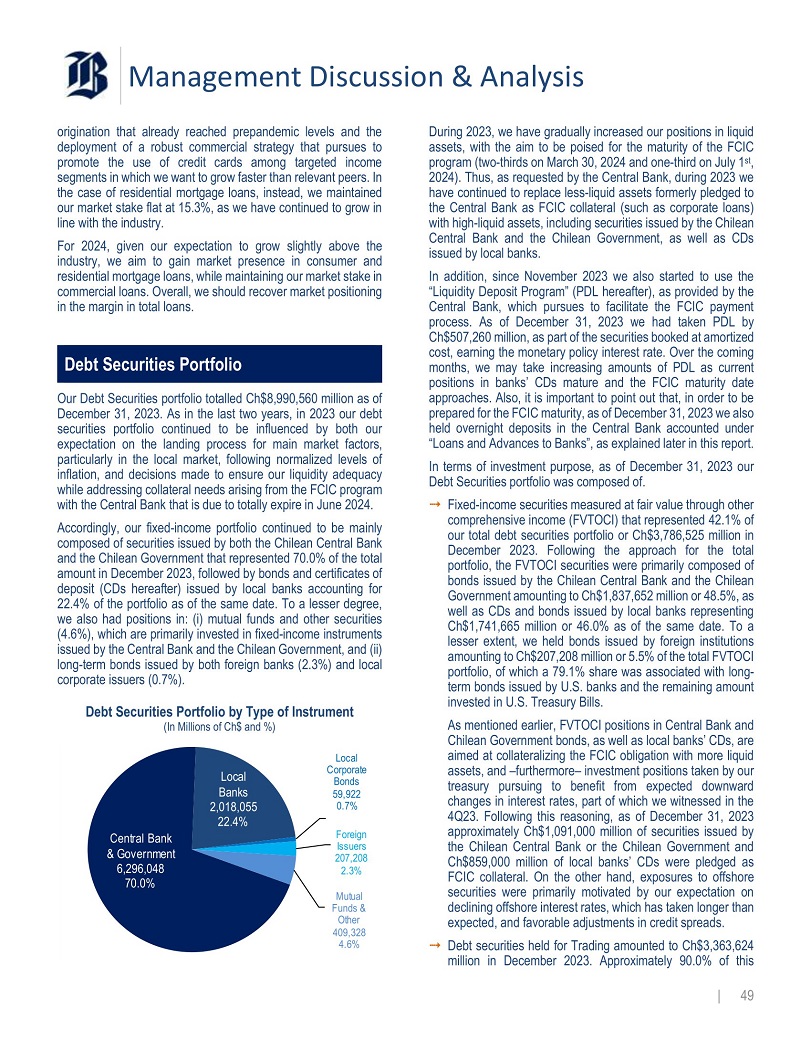
Management Discussion & Analysis origination that already reached prepandemic levels and the deployment of a robust commercial strategy that pursues to promote the use of credit cards among targeted income segments in which we want to grow faster than relevant peers . In the case of residential mortgage loans, instead, we maintained our market stake flat at 15 . 3 % , as we have continued to grow in line with the industry . For 2024 , given our expectation to grow slightly above the industry, we aim to gain market presence in consumer and residential mortgage loans, while maintaining our market stake in commercial loans . Overall, we should recover market positioning in the margin in total loans . Debt Securities Portfolio Our Debt Securities portfolio totalled Ch $ 8 , 990 , 560 million as of December 31 , 2023 . As in the last two years, in 2023 our debt securities portfolio continued to be influenced by both our expectation on the landing process for main market factors, particularly in the local market, following normalized levels of inflation, and decisions made to ensure our liquidity adequacy while addressing collateral needs arising from the FCIC program with the Central Bank that is due to totally expire in June 2024 . Accordingly, our fixed - income portfolio continued to be mainly composed of securities issued by both the Chilean Central Bank and the Chilean Government that represented 70 . 0 % of the total amount in December 2023 , followed by bonds and certificates of deposit (CDs hereafter) issued by local banks accounting for 22 . 4 % of the portfolio as of the same date . To a lesser degree, we also had positions in : (i) mutual funds and other securities ( 4 . 6 % ), which are primarily invested in fixed - income instruments issued by the Central Bank and the Chilean Government, and (ii) long - term bonds issued by both foreign banks ( 2 . 3 % ) and local corporate issuers ( 0 . 7 % ) . Debt Securities Portfolio by Type of Instrument (In Millions of Ch$ and %) Local Banks 2,018,055 22.4% Central Bank & Government 6,296,048 70.0% million in December 2023. Approximately 90.0% of this | 49 Local Corporate Bonds 59,922 0.7% Foreign Issuers 207 , 208 2.3% Mutual Funds & Other 409,328 4.6% During 2023 , we have gradually increased our positions in liquid assets, with the aim to be poised for the maturity of the FCIC program (two - thirds on March 30 , 2024 and one - third on July 1 st , 2024 ) . Thus, as requested by the Central Bank, during 2023 we have continued to replace less - liquid assets formerly pledged to the Central Bank as FCIC collateral (such as corporate loans) with high - liquid assets, including securities issued by the Chilean Central Bank and the Chilean Government, as well as CDs issued by local banks . In addition, since November 2023 we also started to use the “Liquidity Deposit Program” (PDL hereafter), as provided by the Central Bank, which pursues to facilitate the FCIC payment process . As of December 31 , 2023 we had taken PDL by Ch $ 507 , 260 million, as part of the securities booked at amortized cost, earning the monetary policy interest rate . Over the coming months, we may take increasing amounts of PDL as current positions in banks’ CDs mature and the FCIC maturity date approaches . Also, it is important to point out that, in order to be prepared for the FCIC maturity, as of December 31 , 2023 we also held overnight deposits in the Central Bank accounted under “Loans and Advances to Banks”, as explained later in this report . In terms of investment purpose, as of December 31 , 2023 our Debt Securities portfolio was composed of . ⭬ Fixed - income securities measured at fair value through other comprehensive income (FVTOCI) that represented 42 . 1 % of our total debt securities portfolio or Ch $ 3 , 786 , 525 million in December 2023 . Following the approach for the total portfolio, the FVTOCI securities were primarily composed of bonds issued by the Chilean Central Bank and the Chilean Government amounting to Ch $ 1 , 837 , 652 million or 48 . 5 % , as well as CDs and bonds issued by local banks representing Ch $ 1 , 741 , 665 million or 46 . 0 % as of the same date . To a lesser extent, we held bonds issued by foreign institutions amounting to Ch $ 207 , 208 million or 5 . 5 % of the total FVTOCI portfolio, of which a 79 . 1 % share was associated with long - term bonds issued by U . S . banks and the remaining amount invested in U . S . Treasury Bills . As mentioned earlier, FVTOCI positions in Central Bank and Chilean Government bonds, as well as local banks’ CDs, are aimed at collateralizing the FCIC obligation with more liquid assets, and – furthermore – investment positions taken by our treasury pursuing to benefit from expected downward changes in interest rates, part of which we witnessed in the 4 Q 23 . Following this reasoning, as of December 31 , 2023 approximately Ch $ 1 , 091 , 000 million of securities issued by the Chilean Central Bank or the Chilean Government and Ch $ 859 , 000 million of local banks’ CDs were pledged as FCIC collateral . On the other hand, exposures to offshore securities were primarily motivated by our expectation on declining offshore interest rates, which has taken longer than expected, and favorable adjustments in credit spreads . ⭬ Debt securities held for Trading amounted to Ch $ 3 , 363 , 624
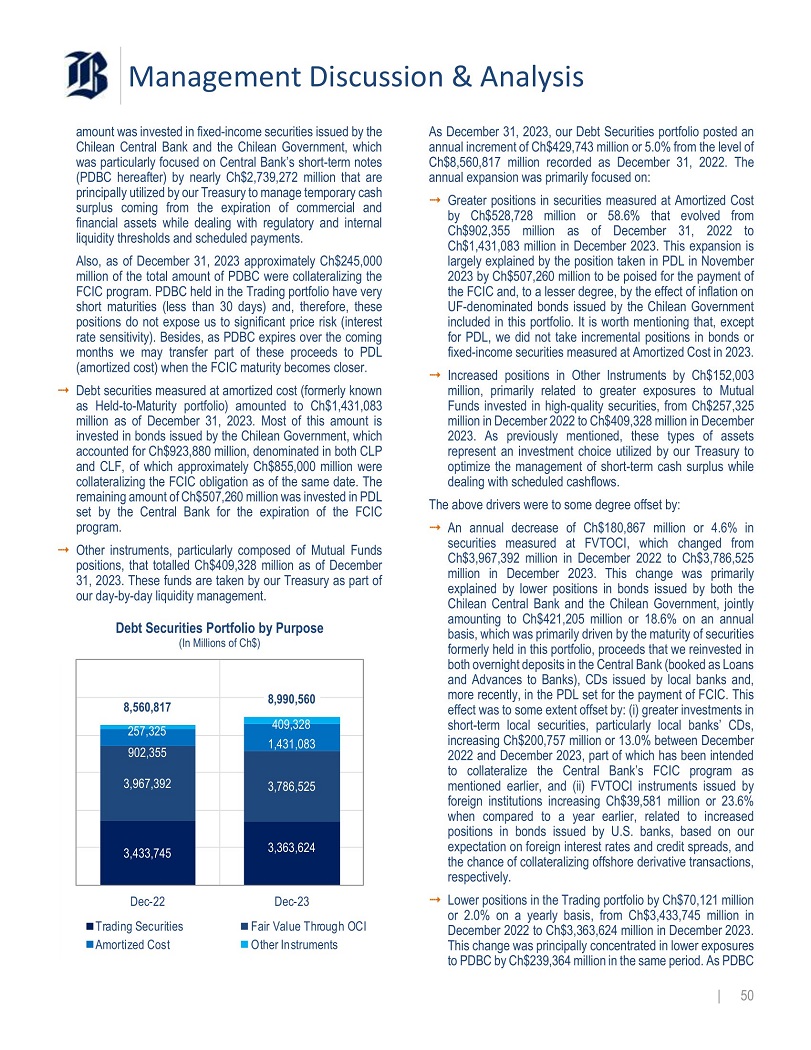
Management Discussion & Analysis amount was invested in fixed - income securities issued by the Chilean Central Bank and the Chilean Government, which was particularly focused on Central Bank’s short - term notes (PDBC hereafter) by nearly Ch $ 2 , 739 , 272 million that are principally utilized by our Treasury to manage temporary cash surplus coming from the expiration of commercial and financial assets while dealing with regulatory and internal liquidity thresholds and scheduled payments . Also, as of December 31 , 2023 approximately Ch $ 245 , 000 million of the total amount of PDBC were collateralizing the FCIC program . PDBC held in the Trading portfolio have very short maturities (less than 30 days) and, therefore, these positions do not expose us to significant price risk (interest rate sensitivity) . Besides, as PDBC expires over the coming months we may transfer part of these proceeds to PDL (amortized cost) when the FCIC maturity becomes closer . ⭬ Debt securities measured at amortized cost (formerly known as Held - to - Maturity portfolio) amounted to Ch $ 1 , 431 , 083 million as of December 31 , 2023 . Most of this amount is invested in bonds issued by the Chilean Government, which accounted for Ch $ 923 , 880 million, denominated in both CLP and CLF, of which approximately Ch $ 855 , 000 million were collateralizing the FCIC obligation as of the same date . The remaining amount of Ch $ 507 , 260 million was invested in PDL set by the Central Bank for the expiration of the FCIC program . ⭬ Other instruments, particularly composed of Mutual Funds positions, that totalled Ch $ 409 , 328 million as of December 31 , 2023 . These funds are taken by our Treasury as part of our day - by - day liquidity management . Debt Securities Portfolio by Purpose (In Millions of Ch$) 3,433,745 3,363,624 3,967,392 3,786,525 902,355 1,431,083 257,325 8,560,817 8,990,560 409,328 Dec - 22 Trading Securities Amortized Cost Dec - 23 Fair Value Through OCI Other Instruments As December 31 , 2023 , our Debt Securities portfolio posted an annual increment of Ch $ 429 , 743 million or 5 . 0 % from the level of Ch $ 8 , 560 , 817 million recorded as December 31 , 2022 . The annual expansion was primarily focused on : ⭬ Greater positions in securities measured at Amortized Cost by Ch $ 528 , 728 million or 58 . 6 % that evolved from Ch $ 902 , 355 million as of December 31 , 2022 to Ch $ 1 , 431 , 083 million in December 2023 . This expansion is largely explained by the position taken in PDL in November 2023 by Ch $ 507 , 260 million to be poised for the payment of the FCIC and, to a lesser degree, by the effect of inflation on UF - denominated bonds issued by the Chilean Government included in this portfolio . It is worth mentioning that, except for PDL, we did not take incremental positions in bonds or fixed - income securities measured at Amortized Cost in 2023 . ⭬ Increased positions in Other Instruments by Ch $ 152 , 003 million, primarily related to greater exposures to Mutual Funds invested in high - quality securities, from Ch $ 257 , 325 million in December 2022 to Ch $ 409 , 328 million in December 2023 . As previously mentioned, these types of assets represent an investment choice utilized by our Treasury to optimize the management of short - term cash surplus while dealing with scheduled cashflows . The above drivers were to some degree offset by : ⭬ An annual decrease of Ch $ 180 , 867 million or 4 . 6 % in securities measured at FVTOCI, which changed from Ch $ 3 , 967 , 392 million in December 2022 to Ch $ 3 , 786 , 525 million in December 2023 . This change was primarily explained by lower positions in bonds issued by both the Chilean Central Bank and the Chilean Government, jointly amounting to Ch $ 421 , 205 million or 18 . 6 % on an annual basis, which was primarily driven by the maturity of securities formerly held in this portfolio, proceeds that we reinvested in both overnight deposits in the Central Bank (booked as Loans and Advances to Banks), CDs issued by local banks and, more recently, in the PDL set for the payment of FCIC . This effect was to some extent offset by : (i) greater investments in short - term local securities, particularly local banks’ CDs, increasing Ch $ 200 , 757 million or 13 . 0 % between December 2022 and December 2023 , part of which has been intended to collateralize the Central Bank’s FCIC program as mentioned earlier, and (ii) FVTOCI instruments issued by foreign institutions increasing Ch $ 39 , 581 million or 23 . 6 % when compared to a year earlier, related to increased positions in bonds issued by U . S . banks, based on our expectation on foreign interest rates and credit spreads, and the chance of collateralizing offshore derivative transactions, respectively . ⭬ Lower positions in the Trading portfolio by Ch $ 70 , 121 million or 2 . 0 % on a yearly basis, from Ch $ 3 , 433 , 745 million in December 2022 to Ch $ 3 , 363 , 624 million in December 2023 . This change was principally concentrated in lower exposures to PDBC by Ch$239,364 million in the same period. As PDBC | 50
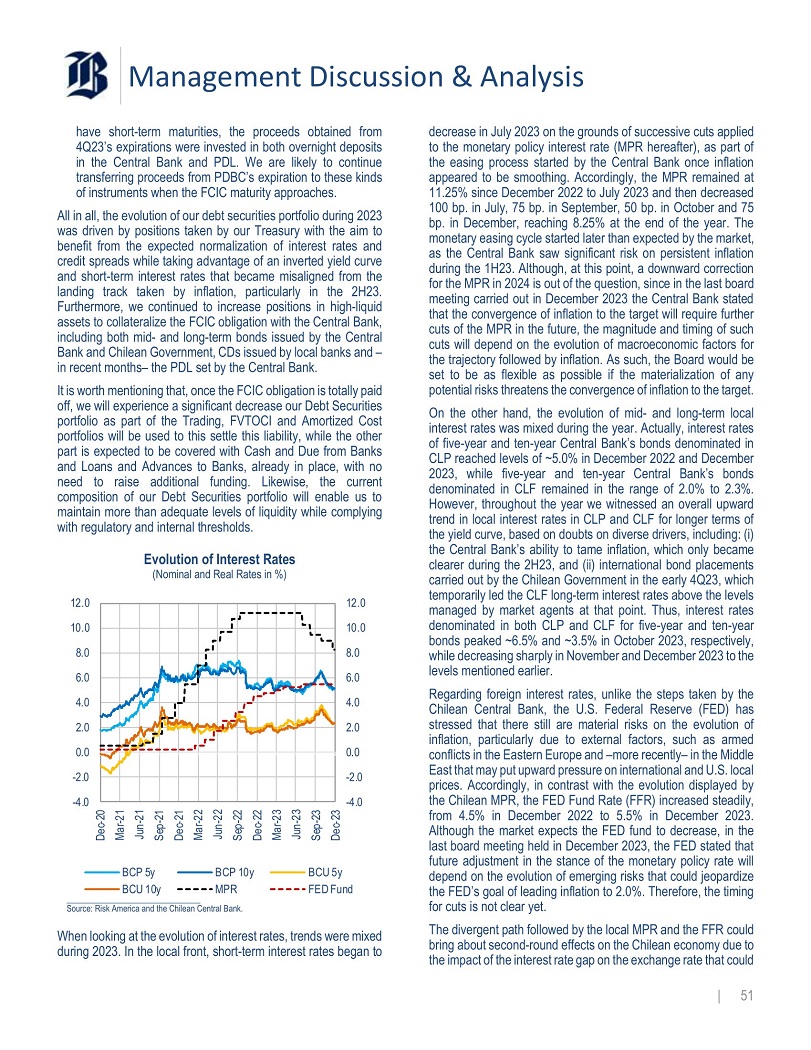
Management Discussion & Analysis have short - term maturities, the proceeds obtained from 4 Q 23 ’s expirations were invested in both overnight deposits in the Central Bank and PDL . We are likely to continue transferring proceeds from PDBC’s expiration to these kinds of instruments when the FCIC maturity approaches . All in all, the evolution of our debt securities portfolio during 2023 was driven by positions taken by our Treasury with the aim to benefit from the expected normalization of interest rates and credit spreads while taking advantage of an inverted yield curve and short - term interest rates that became misaligned from the landing track taken by inflation, particularly in the 2 H 23 . Furthermore, we continued to increase positions in high - liquid assets to collateralize the FCIC obligation with the Central Bank, including both mid - and long - term bonds issued by the Central Bank and Chilean Government, CDs issued by local banks and – in recent months – the PDL set by the Central Bank . It is worth mentioning that, once the FCIC obligation is totally paid off, we will experience a significant decrease our Debt Securities portfolio as part of the Trading, FVTOCI and Amortized Cost portfolios will be used to this settle this liability, while the other part is expected to be covered with Cash and Due from Banks and Loans and Advances to Banks, already in place, with no need to raise additional funding . Likewise, the current composition of our Debt Securities portfolio will enable us to maintain more than adequate levels of liquidity while complying with regulatory and internal thresholds . Evolution of Interest Rates (Nominal and Real Rates in %) 12.0 10.0 8.0 6.0 4.0 2.0 0.0 - 2.0 - 4.0 12.0 10.0 8.0 6.0 4.0 2.0 0.0 - 2.0 - 4.0 Dec - 20 Mar - 21 Jun - 21 Sep - 21 Dec - 21 Mar - 22 Jun - 22 Sep - 22 Dec - 22 Mar - 23 Jun - 23 Sep - 23 Dec - 23 BCP 5y BCU 10y BCP 10y MPR BCU 5y FED Fund Source: Risk America and the Chilean Central Bank. the impact of the interest rate gap on the exchange rate that could | 51 When looking at the evolution of interest rates, trends were mixed during 2023. In the local front, short - term interest rates began to decrease in July 2023 on the grounds of successive cuts applied to the monetary policy interest rate (MPR hereafter), as part of the easing process started by the Central Bank once inflation appeared to be smoothing . Accordingly, the MPR remained at 11 . 25 % since December 2022 to July 2023 and then decreased 100 bp . in July, 75 bp . in September, 50 bp . in October and 75 bp . in December, reaching 8 . 25 % at the end of the year . The monetary easing cycle started later than expected by the market, as the Central Bank saw significant risk on persistent inflation during the 1 H 23 . Although, at this point, a downward correction for the MPR in 2024 is out of the question, since in the last board meeting carried out in December 2023 the Central Bank stated that the convergence of inflation to the target will require further cuts of the MPR in the future, the magnitude and timing of such cuts will depend on the evolution of macroeconomic factors for the trajectory followed by inflation . As such, the Board would be set to be as flexible as possible if the materialization of any potential risks threatens the convergence of inflation to the target . On the other hand, the evolution of mid - and long - term local interest rates was mixed during the year . Actually, interest rates of five - year and ten - year Central Bank’s bonds denominated in CLP reached levels of ~ 5 . 0 % in December 2022 and December 2023 , while five - year and ten - year Central Bank’s bonds denominated in CLF remained in the range of 2 . 0 % to 2 . 3 % . However, throughout the year we witnessed an overall upward trend in local interest rates in CLP and CLF for longer terms of the yield curve, based on doubts on diverse drivers, including : (i) the Central Bank’s ability to tame inflation, which only became clearer during the 2 H 23 , and (ii) international bond placements carried out by the Chilean Government in the early 4 Q 23 , which temporarily led the CLF long - term interest rates above the levels managed by market agents at that point . Thus, interest rates denominated in both CLP and CLF for five - year and ten - year bonds peaked ~ 6 . 5 % and ~ 3 . 5 % in October 2023 , respectively, while decreasing sharply in November and December 2023 to the levels mentioned earlier . Regarding foreign interest rates, unlike the steps taken by the Chilean Central Bank, the U . S . Federal Reserve (FED) has stressed that there still are material risks on the evolution of inflation, particularly due to external factors, such as armed conflicts in the Eastern Europe and – more recently – in the Middle East that may put upward pressure on international and U . S . local prices . Accordingly, in contrast with the evolution displayed by the Chilean MPR, the FED Fund Rate (FFR) increased steadily, from 4 . 5 % in December 2022 to 5 . 5 % in December 2023 . Although the market expects the FED fund to decrease, in the last board meeting held in December 2023 , the FED stated that future adjustment in the stance of the monetary policy rate will depend on the evolution of emerging risks that could jeopardize the FED’s goal of leading inflation to 2 . 0 % . Therefore, the timing for cuts is not clear yet . The divergent path followed by the local MPR and the FFR could bring about second - round effects on the Chilean economy due to
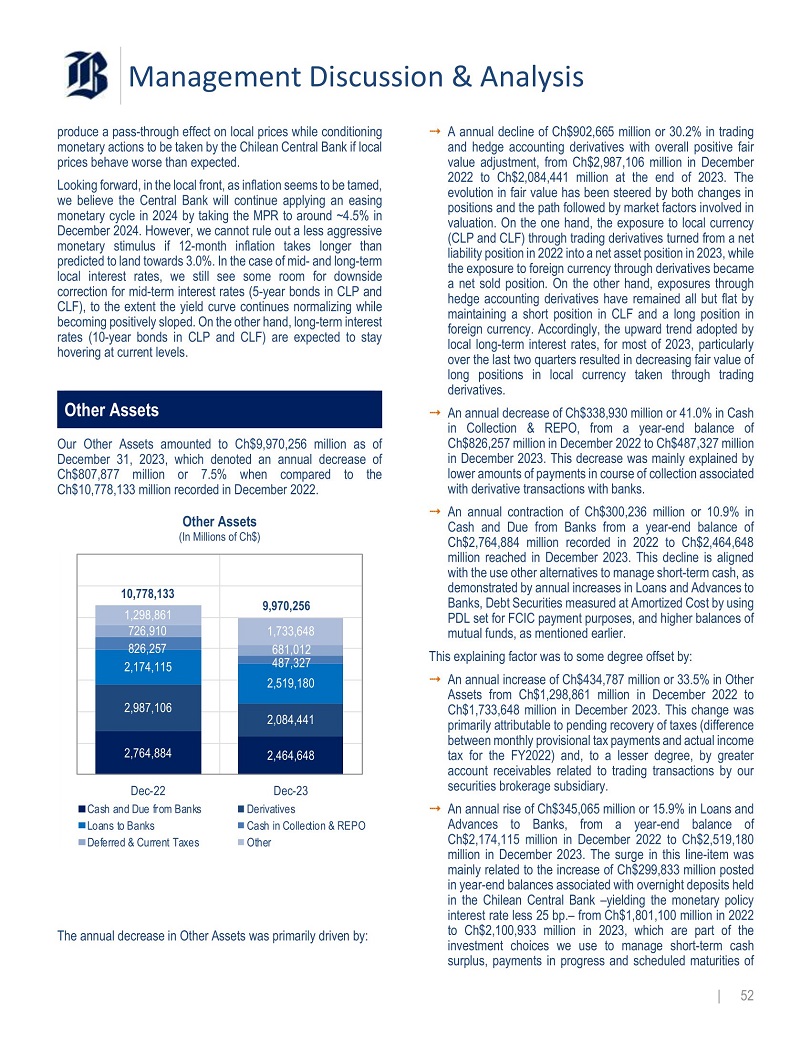
Management Discussion & Analysis produce a pass - through effect on local prices while conditioning monetary actions to be taken by the Chilean Central Bank if local prices behave worse than expected . Looking forward, in the local front, as inflation seems to be tamed, we believe the Central Bank will continue applying an easing monetary cycle in 2024 by taking the MPR to around ~ 4 . 5 % in December 2024 . However, we cannot rule out a less aggressive monetary stimulus if 12 - month inflation takes longer than predicted to land towards 3 . 0 % . In the case of mid - and long - term local interest rates, we still see some room for downside correction for mid - term interest rates ( 5 - year bonds in CLP and CLF), to the extent the yield curve continues normalizing while becoming positively sloped . On the other hand, long - term interest rates ( 10 - year bonds in CLP and CLF) are expected to stay hovering at current levels . Other Assets Our Other Assets amounted to Ch $ 9 , 970 , 256 million as of December 31 , 2023 , which denoted an annual decrease of Ch $ 807 , 877 million or 7 . 5 % when compared to the Ch $ 10 , 778 , 133 million recorded in December 2022 . Other Assets (In Millions of Ch$) 9,970,256 10,778,133 1,298,861 1,733,648 726,910 826,257 681,012 2,174,115 487,327 2,519,180 2,987,106 2,084,441 2,464,648 2,764,884 Dec - 22 Cash and Due from Banks Loans to Banks Deferred & Current Taxes Dec - 23 Derivatives Cash in Collection & REPO Other The annual decrease in Other Assets was primarily driven by: | 52 ⭬ A annual decline of Ch $ 902 , 665 million or 30 . 2 % in trading and hedge accounting derivatives with overall positive fair value adjustment, from Ch $ 2 , 987 , 106 million in December 2022 to Ch $ 2 , 084 , 441 million at the end of 2023 . The evolution in fair value has been steered by both changes in positions and the path followed by market factors involved in valuation . On the one hand, the exposure to local currency (CLP and CLF) through trading derivatives turned from a net liability position in 2022 into a net asset position in 2023 , while the exposure to foreign currency through derivatives became a net sold position . On the other hand, exposures through hedge accounting derivatives have remained all but flat by maintaining a short position in CLF and a long position in foreign currency . Accordingly, the upward trend adopted by local long - term interest rates, for most of 2023 , particularly over the last two quarters resulted in decreasing fair value of long positions in local currency taken through trading derivatives . ⭬ An annual decrease of Ch $ 338 , 930 million or 41 . 0 % in Cash in Collection & REPO, from a year - end balance of Ch $ 826 , 257 million in December 2022 to Ch $ 487 , 327 million in December 2023 . This decrease was mainly explained by lower amounts of payments in course of collection associated with derivative transactions with banks . ⭬ An annual contraction of Ch $ 300 , 236 million or 10 . 9 % in Cash and Due from Banks from a year - end balance of Ch $ 2 , 764 , 884 million recorded in 2022 to Ch $ 2 , 464 , 648 million reached in December 2023 . This decline is aligned with the use other alternatives to manage short - term cash, as demonstrated by annual increases in Loans and Advances to Banks, Debt Securities measured at Amortized Cost by using PDL set for FCIC payment purposes, and higher balances of mutual funds, as mentioned earlier . This explaining factor was to some degree offset by : ⭬ An annual increase of Ch $ 434 , 787 million or 33 . 5 % in Other Assets from Ch $ 1 , 298 , 861 million in December 2022 to Ch $ 1 , 733 , 648 million in December 2023 . This change was primarily attributable to pending recovery of taxes (difference between monthly provisional tax payments and actual income tax for the FY 2022 ) and, to a lesser degree, by greater account receivables related to trading transactions by our securities brokerage subsidiary . ⭬ An annual rise of Ch $ 345 , 065 million or 15 . 9 % in Loans and Advances to Banks, from a year - end balance of Ch $ 2 , 174 , 115 million in December 2022 to Ch $ 2 , 519 , 180 million in December 2023 . The surge in this line - item was mainly related to the increase of Ch $ 299 , 833 million posted in year - end balances associated with overnight deposits held in the Chilean Central Bank – yielding the monetary policy interest rate less 25 bp . – from Ch $ 1 , 801 , 100 million in 2022 to Ch $ 2 , 100 , 933 million in 2023 , which are part of the investment choices we use to manage short - term cash surplus, payments in progress and scheduled maturities of
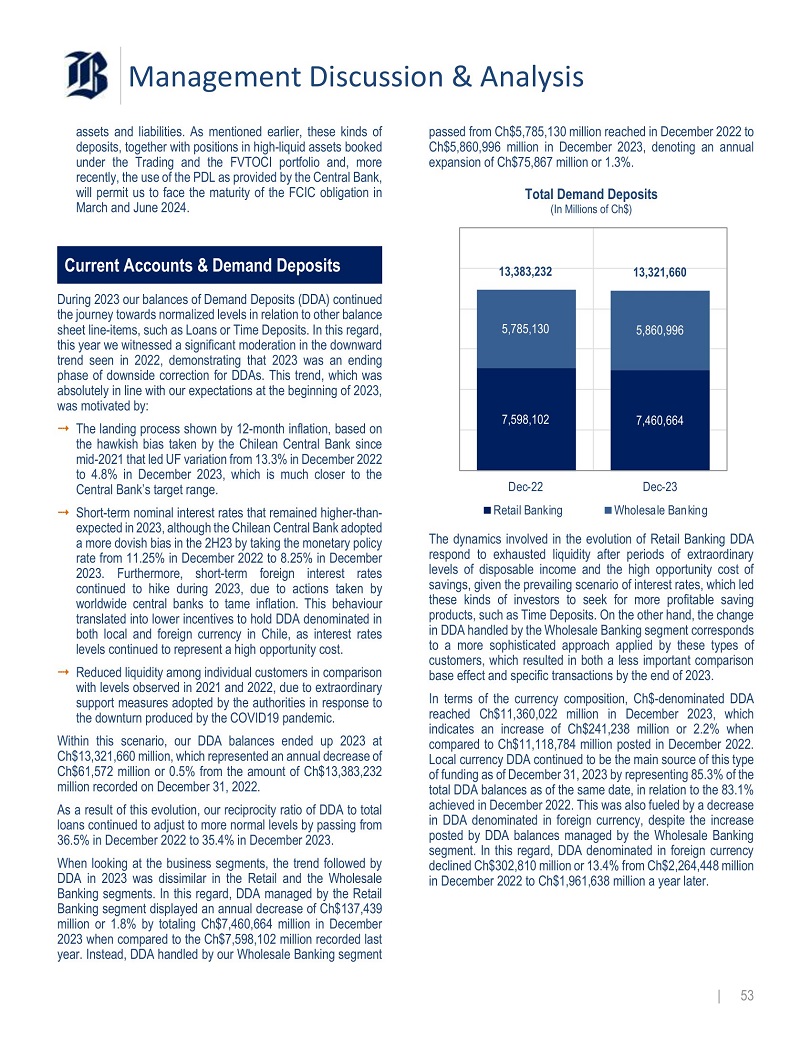
Management Discussion & Analysis assets and liabilities . As mentioned earlier, these kinds of deposits, together with positions in high - liquid assets booked under the Trading and the FVTOCI portfolio and, more recently, the use of the PDL as provided by the Central Bank, will permit us to face the maturity of the FCIC obligation in March and June 2024 . Current Accounts & Demand Deposits During 2023 our balances of Demand Deposits (DDA) continued the journey towards normalized levels in relation to other balance sheet line - items, such as Loans or Time Deposits . In this regard, this year we witnessed a significant moderation in the downward trend seen in 2022 , demonstrating that 2023 was an ending phase of downside correction for DDAs . This trend, which was absolutely in line with our expectations at the beginning of 2023 , was motivated by : ⭬ The landing process shown by 12 - month inflation, based on the hawkish bias taken by the Chilean Central Bank since mid - 2021 that led UF variation from 13 . 3 % in December 2022 to 4 . 8 % in December 2023 , which is much closer to the Central Bank’s target range . ⭬ Short - term nominal interest rates that remained higher - than - expected in 2023 , although the Chilean Central Bank adopted a more dovish bias in the 2 H 23 by taking the monetary policy rate from 11 . 25 % in December 2022 to 8 . 25 % in December 2023 . Furthermore, short - term foreign interest rates continued to hike during 2023 , due to actions taken by worldwide central banks to tame inflation . This behaviour translated into lower incentives to hold DDA denominated in both local and foreign currency in Chile, as interest rates levels continued to represent a high opportunity cost . ⭬ Reduced liquidity among individual customers in comparison with levels observed in 2021 and 2022 , due to extraordinary support measures adopted by the authorities in response to the downturn produced by the COVID 19 pandemic . Within this scenario, our DDA balances ended up 2023 at Ch $ 13 , 321 , 660 million, which represented an annual decrease of Ch $ 61 , 572 million or 0 . 5 % from the amount of Ch $ 13 , 383 , 232 million recorded on December 31 , 2022 . As a result of this evolution, our reciprocity ratio of DDA to total loans continued to adjust to more normal levels by passing from 36 . 5 % in December 2022 to 35 . 4 % in December 2023 . When looking at the business segments, the trend followed by DDA in 2023 was dissimilar in the Retail and the Wholesale Banking segments . In this regard, DDA managed by the Retail Banking segment displayed an annual decrease of Ch $ 137 , 439 million or 1 . 8 % by totaling Ch $ 7 , 460 , 664 million in December 2023 when compared to the Ch $ 7 , 598 , 102 million recorded last year . Instead, DDA handled by our Wholesale Banking segment passed from Ch $ 5 , 785 , 130 million reached in December 2022 to Ch $ 5 , 860 , 996 million in December 2023 , denoting an annual expansion of Ch $ 75 , 867 million or 1 . 3 % . Total Demand Deposits (In Millions of Ch$) 13,321,660 13,383,232 5,860,996 5,785,130 7,460,664 7,598,102 Dec - 22 Retail Banking Dec - 23 Wholesale Banking The dynamics involved in the evolution of Retail Banking DDA respond to exhausted liquidity after periods of extraordinary levels of disposable income and the high opportunity cost of savings, given the prevailing scenario of interest rates, which led these kinds of investors to seek for more profitable saving products, such as Time Deposits . On the other hand, the change in DDA handled by the Wholesale Banking segment corresponds to a more sophisticated approach applied by these types of customers, which resulted in both a less important comparison base effect and specific transactions by the end of 2023 . In terms of the currency composition, Ch $ - denominated DDA reached Ch $ 11 , 360 , 022 million in December 2023 , which indicates an increase of Ch $ 241 , 238 million or 2 . 2 % when compared to Ch $ 11 , 118 , 784 million posted in December 2022 . Local currency DDA continued to be the main source of this type of funding as of December 31 , 2023 by representing 85 . 3 % of the total DDA balances as of the same date, in relation to the 83 . 1 % achieved in December 2022 . This was also fueled by a decrease in DDA denominated in foreign currency, despite the increase posted by DDA balances managed by the Wholesale Banking segment . In this regard, DDA denominated in foreign currency declined Ch $ 302 , 810 million or 13 . 4 % from Ch $ 2 , 264 , 448 million in December 2022 to Ch $ 1 , 961 , 638 million a year later . | 53
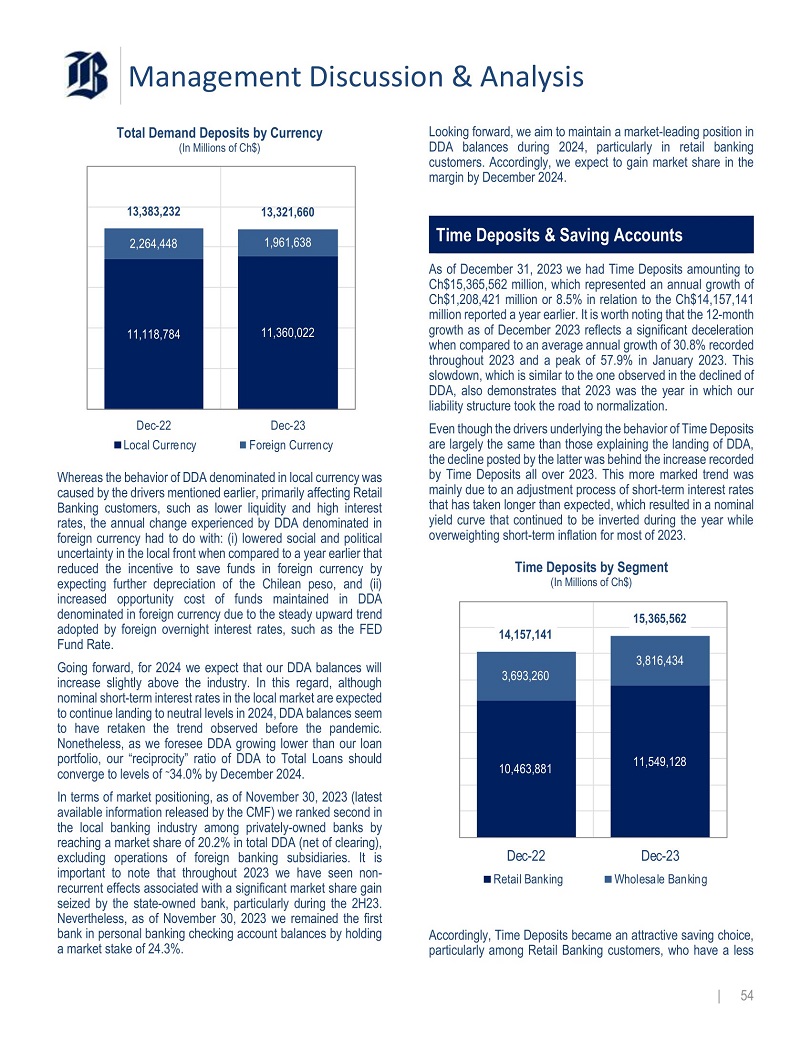
Management Discussion & Analysis Total Demand Deposits by Currency (In Millions of Ch$) 13,321,660 13,383,232 1,961,638 2,264,448 11,360,022 11,118,784 Dec - 22 Local Currency Dec - 23 Foreign Currency Whereas the behavior of DDA denominated in local currency was caused by the drivers mentioned earlier, primarily affecting Retail Banking customers, such as lower liquidity and high interest rates, the annual change experienced by DDA denominated in foreign currency had to do with : (i) lowered social and political uncertainty in the local front when compared to a year earlier that reduced the incentive to save funds in foreign currency by expecting further depreciation of the Chilean peso, and (ii) increased opportunity cost of funds maintained in DDA denominated in foreign currency due to the steady upward trend adopted by foreign overnight interest rates, such as the FED Fund Rate . Going forward, for 2024 we expect that our DDA balances will increase slightly above the industry . In this regard, although nominal short - term interest rates in the local market are expected to continue landing to neutral levels in 2024 , DDA balances seem to have retaken the trend observed before the pandemic . Nonetheless, as we foresee DDA growing lower than our loan portfolio, our “reciprocity” ratio of DDA to Total Loans should converge to levels of ~ 34 . 0 % by December 2024 . In terms of market positioning, as of November 30 , 2023 (latest available information released by the CMF) we ranked second in the local banking industry among privately - owned banks by reaching a market share of 20 . 2 % in total DDA (net of clearing), excluding operations of foreign banking subsidiaries . It is important to note that throughout 2023 we have seen non - recurrent effects associated with a significant market share gain seized by the state - owned bank, particularly during the 2 H 23 . Nevertheless, as of November 30 , 2023 we remained the first bank in personal banking checking account balances by holding a market stake of 24 . 3 % . Looking forward, we aim to maintain a market - leading position in DDA balances during 2024 , particularly in retail banking customers . Accordingly, we expect to gain market share in the margin by December 2024 . Time Deposits & Saving Accounts As of December 31 , 2023 we had Time Deposits amounting to Ch $ 15 , 365 , 562 million, which represented an annual growth of Ch $ 1 , 208 , 421 million or 8 . 5 % in relation to the Ch $ 14 , 157 , 141 million reported a year earlier . It is worth noting that the 12 - month growth as of December 2023 reflects a significant deceleration when compared to an average annual growth of 30 . 8 % recorded throughout 2023 and a peak of 57 . 9 % in January 2023 . This slowdown, which is similar to the one observed in the declined of DDA, also demonstrates that 2023 was the year in which our liability structure took the road to normalization . Even though the drivers underlying the behavior of Time Deposits are largely the same than those explaining the landing of DDA, the decline posted by the latter was behind the increase recorded by Time Deposits all over 2023 . This more marked trend was mainly due to an adjustment process of short - term interest rates that has taken longer than expected, which resulted in a nominal yield curve that continued to be inverted during the year while overweighting short - term inflation for most of 2023 . Time Deposits by Segment (In Millions of Ch$) 15,365,562 14,157,141 3,816,434 3,693,260 11,549,128 10,463,881 Dec - 22 Retail Banking Dec - 23 Wholesale Banking Accordingly, Time Deposits became an attractive saving choice, particularly among Retail Banking customers, who have a less | 54
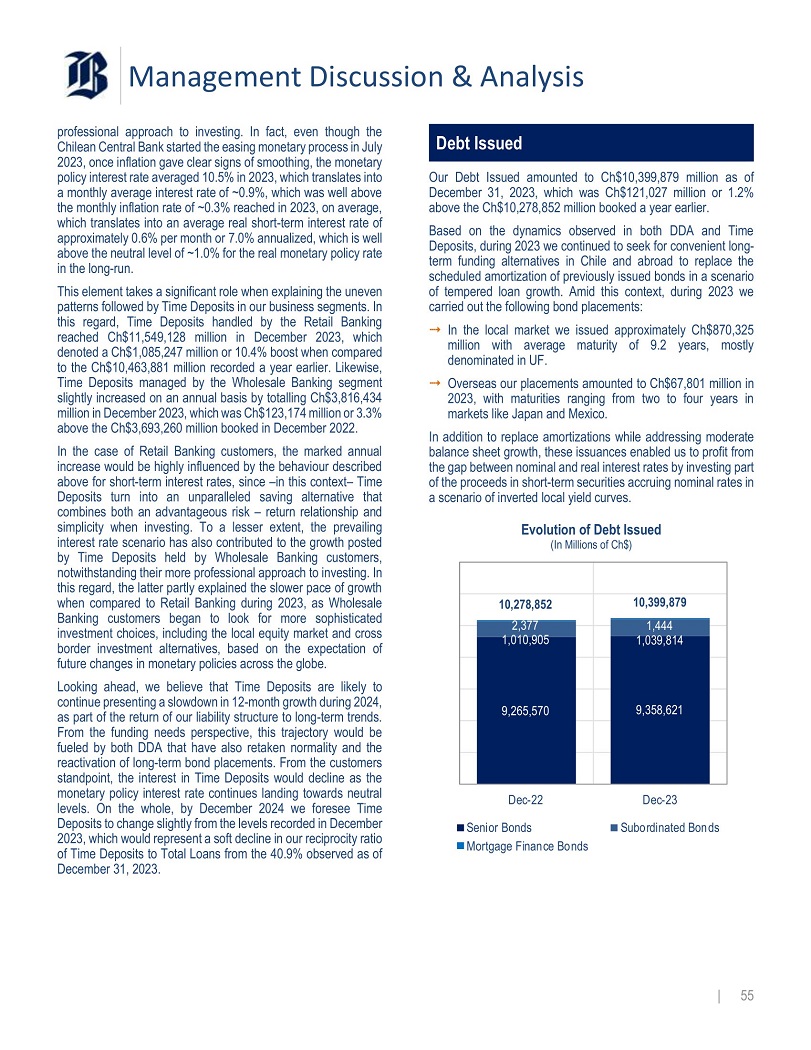
Management Discussion & Analysis professional approach to investing . In fact, even though the Chilean Central Bank started the easing monetary process in July 2023 , once inflation gave clear signs of smoothing, the monetary policy interest rate averaged 10 . 5 % in 2023 , which translates into a monthly average interest rate of ~ 0 . 9 % , which was well above the monthly inflation rate of ~ 0 . 3 % reached in 2023 , on average, which translates into an average real short - term interest rate of approximately 0 . 6 % per month or 7 . 0 % annualized, which is well above the neutral level of ~ 1 . 0 % for the real monetary policy rate in the long - run . This element takes a significant role when explaining the uneven patterns followed by Time Deposits in our business segments . In this regard, Time Deposits handled by the Retail Banking reached Ch $ 11 , 549 , 128 million in December 2023 , which denoted a Ch $ 1 , 085 , 247 million or 10 . 4 % boost when compared to the Ch $ 10 , 463 , 881 million recorded a year earlier . Likewise, Time Deposits managed by the Wholesale Banking segment slightly increased on an annual basis by totalling Ch $ 3 , 816 , 434 million in December 2023 , which was Ch $ 123 , 174 million or 3 . 3 % above the Ch $ 3 , 693 , 260 million booked in December 2022 . In the case of Retail Banking customers, the marked annual increase would be highly influenced by the behaviour described above for short - term interest rates, since – in this context – Time Deposits turn into an unparalleled saving alternative that combines both an advantageous risk – return relationship and simplicity when investing . To a lesser extent, the prevailing interest rate scenario has also contributed to the growth posted by Time Deposits held by Wholesale Banking customers, notwithstanding their more professional approach to investing . In this regard, the latter partly explained the slower pace of growth when compared to Retail Banking during 2023 , as Wholesale Banking customers began to look for more sophisticated investment choices, including the local equity market and cross border investment alternatives, based on the expectation of future changes in monetary policies across the globe . Looking ahead, we believe that Time Deposits are likely to continue presenting a slowdown in 12 - month growth during 2024 , as part of the return of our liability structure to long - term trends . From the funding needs perspective, this trajectory would be fueled by both DDA that have also retaken normality and the reactivation of long - term bond placements . From the customers standpoint, the interest in Time Deposits would decline as the monetary policy interest rate continues landing towards neutral levels . On the whole, by December 2024 we foresee Time Deposits to change slightly from the levels recorded in December 2023 , which would represent a soft decline in our reciprocity ratio of Time Deposits to Total Loans from the 40 . 9 % observed as of December 31 , 2023 . Debt Issued Our Debt Issued amounted to Ch $ 10 , 399 , 879 million as of December 31 , 2023 , which was Ch $ 121 , 027 million or 1 . 2 % above the Ch $ 10 , 278 , 852 million booked a year earlier . Based on the dynamics observed in both DDA and Time Deposits, during 2023 we continued to seek for convenient long - term funding alternatives in Chile and abroad to replace the scheduled amortization of previously issued bonds in a scenario of tempered loan growth . Amid this context, during 2023 we carried out the following bond placements : ⭬ In the local market we issued approximately Ch $ 870 , 325 million with average maturity of 9 . 2 years, mostly denominated in UF . ⭬ Overseas our placements amounted to Ch $ 67 , 801 million in 2023 , with maturities ranging from two to four years in markets like Japan and Mexico . In addition to replace amortizations while addressing moderate balance sheet growth, these issuances enabled us to profit from the gap between nominal and real interest rates by investing part of the proceeds in short - term securities accruing nominal rates in a scenario of inverted local yield curves . Evolution of Debt Issued (In Millions of Ch$) 10,399,879 10,278,852 1,444 2,377 1,039,814 9,358,621 1,010,905 9,265,570 Dec - 22 Senior Bonds Mortgage Finance Bonds Dec - 23 Subordinated Bonds | 55
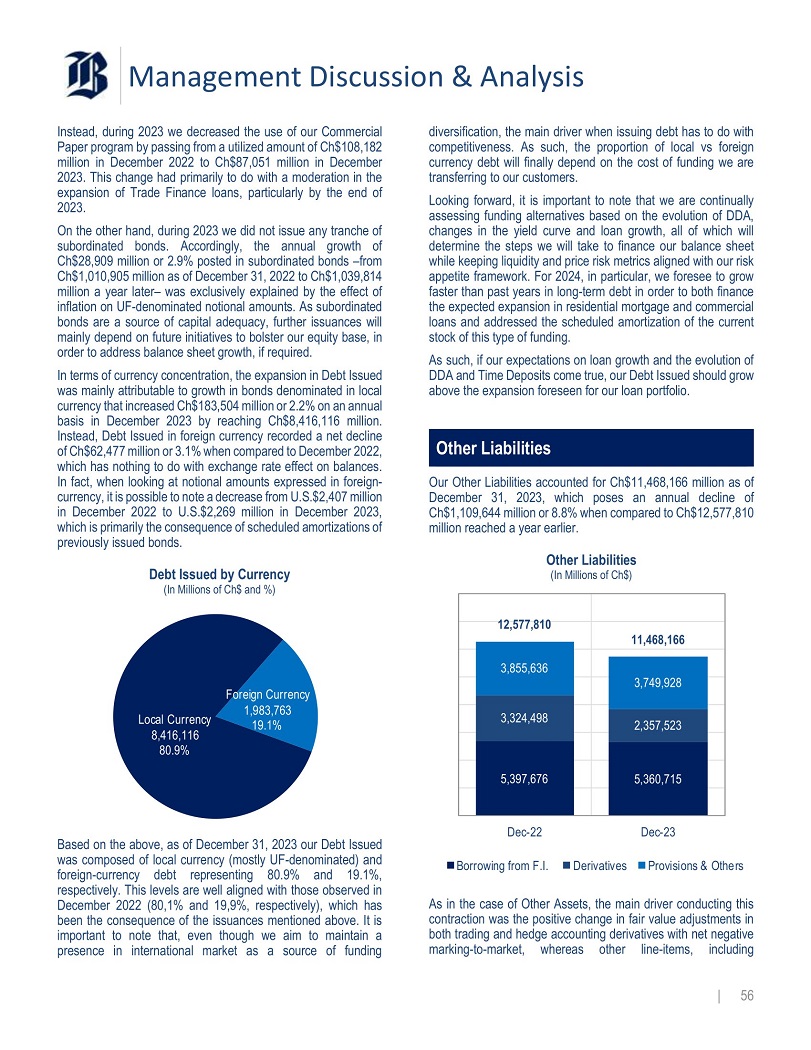
Management Discussion & Analysis Instead, during 2023 we decreased the use of our Commercial Paper program by passing from a utilized amount of Ch $ 108 , 182 million in December 2022 to Ch $ 87 , 051 million in December 2023 . This change had primarily to do with a moderation in the expansion of Trade Finance loans, particularly by the end of 2023 . On the other hand, during 2023 we did not issue any tranche of subordinated bonds . Accordingly, the annual growth of Ch $ 28 , 909 million or 2 . 9 % posted in subordinated bonds – from Ch $ 1 , 010 , 905 million as of December 31 , 2022 to Ch $ 1 , 039 , 814 million a year later – was exclusively explained by the effect of inflation on UF - denominated notional amounts . As subordinated bonds are a source of capital adequacy, further issuances will mainly depend on future initiatives to bolster our equity base, in order to address balance sheet growth, if required . In terms of currency concentration, the expansion in Debt Issued was mainly attributable to growth in bonds denominated in local currency that increased Ch $ 183 , 504 million or 2 . 2 % on an annual basis in December 2023 by reaching Ch $ 8 , 416 , 116 million . Instead, Debt Issued in foreign currency recorded a net decline of Ch $ 62 , 477 million or 3 . 1 % when compared to December 2022 , which has nothing to do with exchange rate effect on balances . In fact, when looking at notional amounts expressed in foreign - currency, it is possible to note a decrease from U . S . $ 2 , 407 million in December 2022 to U . S . $ 2 , 269 million in December 2023 , which is primarily the consequence of scheduled amortizations of previously issued bonds . Debt Issued by Currency (In Millions of Ch$ and %) Local Currency 8,416,116 80.9% Foreign Currency 1,983,763 19.1% Based on the above, as of December 31 , 2023 our Debt Issued was composed of local currency (mostly UF - denominated) and foreign - currency debt representing 80 . 9 % and 19 . 1 % , respectively . This levels are well aligned with those observed in December 2022 ( 80 , 1 % and 19 , 9 % , respectively), which has been the consequence of the issuances mentioned above . It is important to note that, even though we aim to maintain a presence in international market as a source of funding diversification, the main driver when issuing debt has to do with competitiveness . As such, the proportion of local vs foreign currency debt will finally depend on the cost of funding we are transferring to our customers . Looking forward, it is important to note that we are continually assessing funding alternatives based on the evolution of DDA, changes in the yield curve and loan growth, all of which will determine the steps we will take to finance our balance sheet while keeping liquidity and price risk metrics aligned with our risk appetite framework . For 2024 , in particular, we foresee to grow faster than past years in long - term debt in order to both finance the expected expansion in residential mortgage and commercial loans and addressed the scheduled amortization of the current stock of this type of funding . As such, if our expectations on loan growth and the evolution of DDA and Time Deposits come true, our Debt Issued should grow above the expansion foreseen for our loan portfolio . Other Liabilities Our Other Liabilities accounted for Ch $ 11 , 468 , 166 million as of December 31 , 2023 , which poses an annual decline of Ch $ 1 , 109 , 644 million or 8 . 8 % when compared to Ch $ 12 , 577 , 810 million reached a year earlier . Other Liabilities (In Millions of Ch$) 11,468,166 12,577,810 3,855,636 3,749,928 3,324,498 2,357,523 5,360,715 5,397,676 Dec - 22 Dec - 23 Borrowing from F.I. Derivatives Provisions & Others As in the case of Other Assets, the main driver conducting this contraction was the positive change in fair value adjustments in both trading and hedge accounting derivatives with net negative marking - to - market, whereas other line - items, including | 56
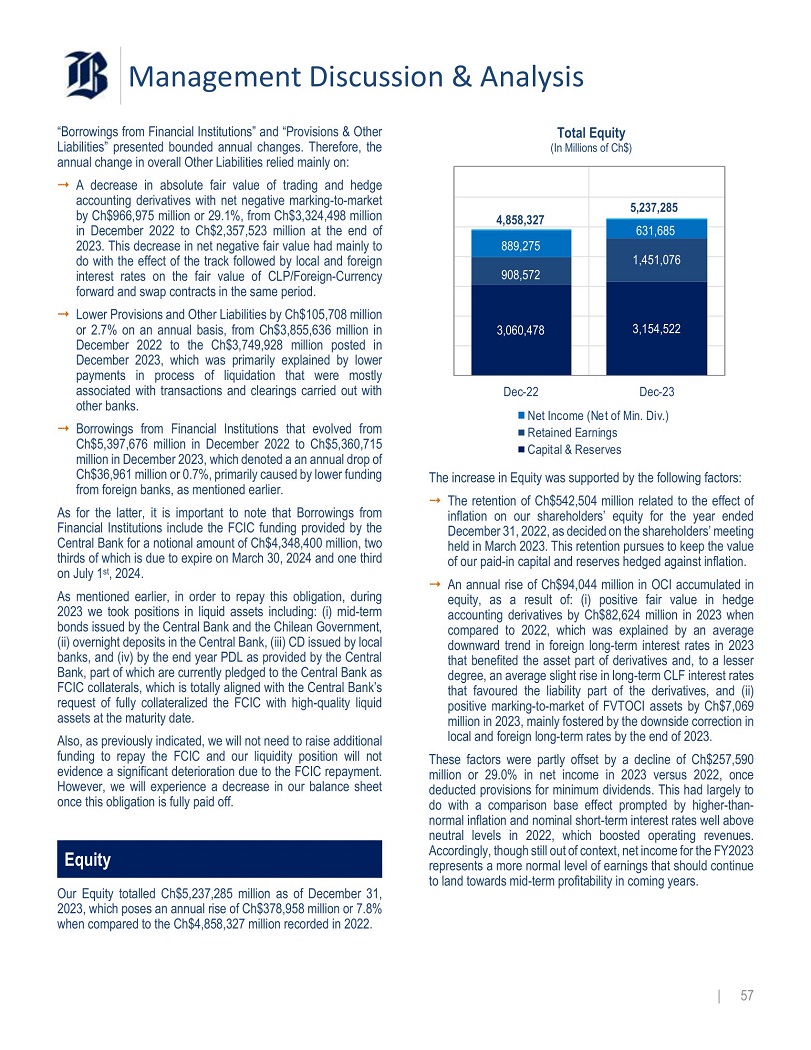
Management Discussion & Analysis “Borrowings from Financial Institutions” and “Provisions & Other Liabilities” presented bounded annual changes . Therefore, the annual change in overall Other Liabilities relied mainly on : ⭬ A decrease in absolute fair value of trading and hedge accounting derivatives with net negative marking - to - market by Ch $ 966 , 975 million or 29 . 1 % , from Ch $ 3 , 324 , 498 million in December 2022 to Ch $ 2 , 357 , 523 million at the end of 2023 . This decrease in net negative fair value had mainly to do with the effect of the track followed by local and foreign interest rates on the fair value of CLP/Foreign - Currency forward and swap contracts in the same period . ⭬ Lower Provisions and Other Liabilities by Ch $ 105 , 708 million or 2 . 7 % on an annual basis, from Ch $ 3 , 855 , 636 million in December 2022 to the Ch $ 3 , 749 , 928 million posted in December 2023 , which was primarily explained by lower payments in process of liquidation that were mostly associated with transactions and clearings carried out with other banks . ⭬ Borrowings from Financial Institutions that evolved from Ch $ 5 , 397 , 676 million in December 2022 to Ch $ 5 , 360 , 715 million in December 2023 , which denoted a an annual drop of Ch $ 36 , 961 million or 0 . 7 % , primarily caused by lower funding from foreign banks, as mentioned earlier . As for the latter, it is important to note that Borrowings from Financial Institutions include the FCIC funding provided by the Central Bank for a notional amount of Ch $ 4 , 348 , 400 million, two thirds of which is due to expire on March 30 , 2024 and one third on July 1 st , 2024 . As mentioned earlier, in order to repay this obligation, during 2023 we took positions in liquid assets including : (i) mid - term bonds issued by the Central Bank and the Chilean Government, (ii) overnight deposits in the Central Bank, (iii) CD issued by local banks, and (iv) by the end year PDL as provided by the Central Bank, part of which are currently pledged to the Central Bank as FCIC collaterals, which is totally aligned with the Central Bank’s request of fully collateralized the FCIC with high - quality liquid assets at the maturity date . Also, as previously indicated, we will not need to raise additional funding to repay the FCIC and our liquidity position will not evidence a significant deterioration due to the FCIC repayment . However, we will experience a decrease in our balance sheet once this obligation is fully paid off . Equity Our Equity totalled Ch $ 5 , 237 , 285 million as of December 31 , 2023 , which poses an annual rise of Ch $ 378 , 958 million or 7 . 8 % when compared to the Ch $ 4 , 858 , 327 million recorded in 2022 . Total Equity (In Millions of Ch$) 5,237,285 4,858,327 631,685 889,275 1,451,076 908,572 3,154,522 3,060,478 Dec - 22 Dec - 23 Net Income (Net of Min. Div.) Retained Earnings Capital & Reserves The increase in Equity was supported by the following factors : ⭬ The retention of Ch $ 542 , 504 million related to the effect of inflation on our shareholders’ equity for the year ended December 31 , 2022 , as decided on the shareholders’ meeting held in March 2023 . This retention pursues to keep the value of our paid - in capital and reserves hedged against inflation . ⭬ An annual rise of Ch $ 94 , 044 million in OCI accumulated in equity, as a result of : (i) positive fair value in hedge accounting derivatives by Ch $ 82 , 624 million in 2023 when compared to 2022 , which was explained by an average downward trend in foreign long - term interest rates in 2023 that benefited the asset part of derivatives and, to a lesser degree, an average slight rise in long - term CLF interest rates that favoured the liability part of the derivatives, and (ii) positive marking - to - market of FVTOCI assets by Ch $ 7 , 069 million in 2023 , mainly fostered by the downside correction in local and foreign long - term rates by the end of 2023 . These factors were partly offset by a decline of Ch $ 257 , 590 million or 29 . 0 % in net income in 2023 versus 2022 , once deducted provisions for minimum dividends . This had largely to do with a comparison base effect prompted by higher - than - normal inflation and nominal short - term interest rates well above neutral levels in 2022 , which boosted operating revenues . Accordingly, though still out of context, net income for the FY 2023 represents a more normal level of earnings that should continue to land towards mid - term profitability in coming years . | 57
Risk & Capital Management Risk Management Approach Risk Management Principles Banco de Chile’s risk profile ensures that its business can sustainably grow and is aligned with its strategic objectives, in order to maximize value creation and guarantee its long - term solvency . Global risk management takes into consideration the business segments served by the bank and its subsidiaries, which is approached from an integrated and differentiated perspective . The bank's corporate governance relies on active participation by the board, in order to adequately manage risk, either directly or through committees composed of directors and senior management that have been described in the Corporate Governance section of this report . The board establishes the risk policies, the risk appetite framework, and the guidelines to develop, validate and monitor its models . It approves the provision models and annually issues an opinion on the adequacy of provisions . Management is responsible for establishing rules and procedures, and for controlling compliance with the board’s instructions . The bank has integrated its capital and liquidity planning process into its strategic planning, in line with the risks inherent to its business, the financial and competitive environment, its business strategy, corporate values, and its risk governance, management and control systems . Its capital planning process is aligned with the regulator’s requirements and incorporates Risk Weighted Asset calculations and stress tests for its credit, market and operational risks, and the integrated measurement of its financial and non - financial risks . The Wholesale Credit Risk Division, the Retail Credit Risk and Global Risk Control Division and the Cybersecurity Division jointly manage risk . They form the corporate risk governance structure, and their highly experienced and specialized teams, together with a robust regulatory framework, secure optimal and effective management of the matters they address . The first two divisions are responsible for credit risk during the loan origination, monitoring and recovery stages for these respective segments . The Wholesale Credit Risk Division has a Market Risk Area that is responsible for measuring, limiting, controlling and reporting on market risk, as well as defining valuation and management standards for the bank’s assets and liabilities . | 58
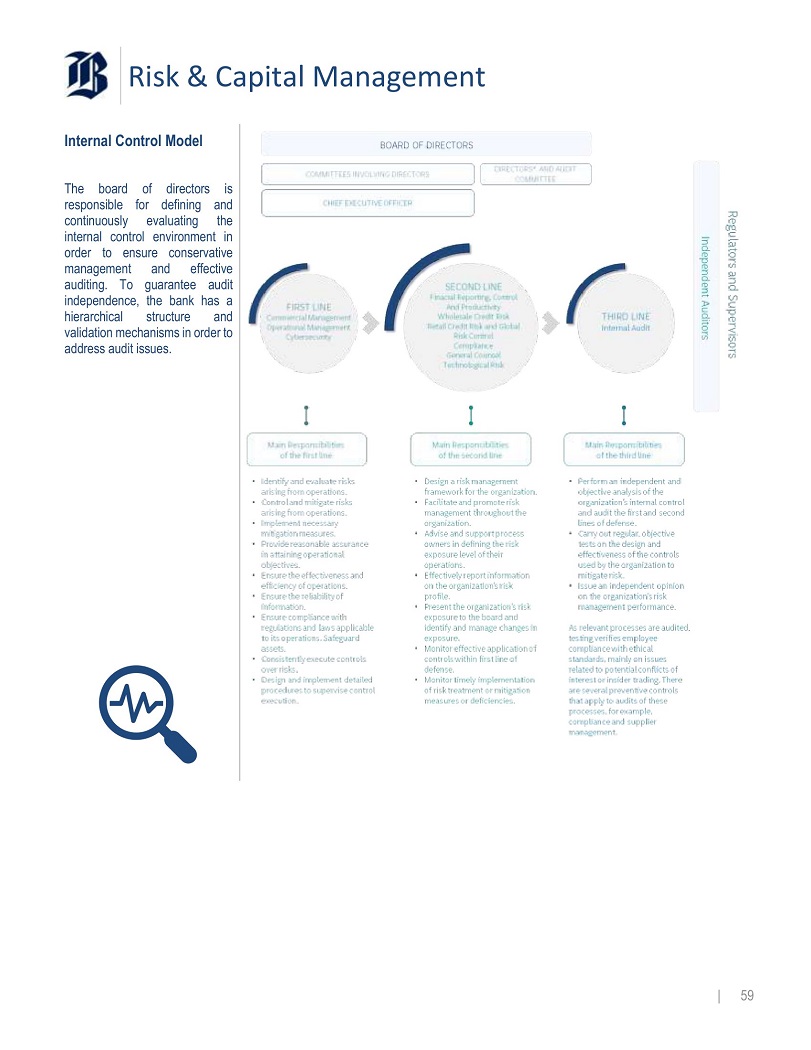
Risk & Capital Management Internal Control Model The board of directors is responsible for defining and continuously evaluating the internal control environment in order to ensure conservative management and effective auditing . To guarantee audit independence, the bank has a hierarchical structure and validation mechanisms in order to address audit issues . | 59
Risk & Capital Management Credit Risk Credit risk assesses the probability that the counterparty in a loan transaction does not meet its contractual obligation because of payment incapacity or financial insolvency, and that leads to a potential loan loss. The bank seeks an adequate risk - return and an appropriate risk balance, through careful credit risk management, which covers the loan origination, monitoring and recovery processes . It also continuously manages risk knowledge using an integral approach, in order to contribute to the business and anticipate threats that may damage its solvency or the quality of its loan portfolio, by developing a unique risk awareness culture throughout the corporation . This requires developing a risk management framework for the business segments served by the bank, responding to regulatory requirements and commercial dynamism, contributing to digital transformation, and contributing to the bank’s businesses from a risk management perspective . It adopts a portfolio perspective that efficiently and proactively manages, resolves and controls the business approval process . The bank integrates socio - environmental criteria into its evaluations for granting financing for domestic and regional projects that might generate such an impact, wherever executed . Projects must have all the permits, authorizations, licenses and studies required for their impacts in order to qualify for financing . For large customers, the bank also has specialized customer service units involved in the process of financing large - scale projects such as public works concessions that include building infrastructure and mining, power or real estate developments, all of which may have an environmental impact . Credit policies and processes are based on the following management principles, which use a specialized approach according to the characteristics of the bank’s markets and segments, and acknowledges their peculiarities : ● Perform a rigorous evaluation during the loan origination process ● Implement a continuous, robust portfolio monitoring process ● Develop credit risk modelling guidelines, covering regulatory and management aspects, for efficient decision making at each stage of the lending process. ● Implement a timely, flexible, efficient collections structure ● Efficiently manage teams, tools and information availability Our two credit risk divisions use these management principles to contribute to the business and anticipate threats that may affect solvency and portfolio quality, based on a segmentation by business, as follows : ● Retail Banking Segment Loan origination for these segments is mainly managed using risk evaluation scoring tools, supported by an appropriate credit attribution model, which is required to approve each transaction . These evaluations examine factors such as total borrowings, payment capacity and maximum acceptable exposure for the customer . ● Wholesale Banking Segment Origination management for this segment involves an individual assessment of the customer and if it belongs to a group of companies then this takes into consideration the bank’s relationship with the rest of the group . This individual assessment considers income - generating capacity, financial capacity with emphasis on solvency, exposure levels, industry variables, an evaluation of the partners and management and aspects particular to the transaction such as the financing structure, terms, products and any guarantees . | 60
Risk & Capital Management Price Risk Price risk can be defined as the risk of losses in the Trading and / or the Banking Book, arising from adverse movements in market factors. The Bank separates this risk based on three types of market factors : spot prices, interest rates and option volatility . The Bank has a Market Risk Management policy, which is annually approved by the Board of Directors, where the types of internal limits and alerts are established, in addition to the regulatory ones, for the measurement of financial exposures and/or price risks . The measurement and control of the price risk, for management purposes, is carried out through various internal metrics and reports that differ from each other, depending on whether they are used for exposures in the Trading and Currency Book or for those belonging to the Accrual Book . Regarding the internal tools designed for the Trading and Currency Book, the price risk management is deployed through the calculation and reporting of financial exposures through their sensitivities or greeks and the risk of the entire portfolio by means of the VaR model . Additionally, the Bank has established internal metrics for the management of the price risk of the Accrual Book, defining limits and alerts for interest rate exposures . The Bank measures interest rate exposures through the Interest Rate Exposure (IRE) metric, and interest rate risk for the Accrual Book using the EaR 12 M (Earnings at Risk 12 months) methodology . In addition, internal policies establish the periodic carrying out of stress exercises on the positions of the Trading and Currency Book, and the Accrual Book, which are used to contrast them against the maximum price risk tolerance defined by the Board of Directors . Limit usage and alert status are regularly reported to the respective business units . Likewise, the Bank's Senior Management is immediately notified in the case of excess limits or activation of alerts, including the monitoring of corrective action plans, if necessary . This information is reported monthly to the Finance, International and Market Risk Committee and on a quarterly basis to the Board of Directors . Liquidity Risk Liquidity risk can arise either due to a reduction in the bank’s funding capacity (funding liquidity risk) or a reduction in the traded value of its assets that can be liquidated or its market factors from derivatives held in its portfolios (transaction or trading liquidity risk). The Bank has a Liquidity Risk Management Policy, reviewed and approved at least annually by the Board, which establishes the main guidelines for measuring, limiting, reporting and controlling liquidity risk . Funding liquidity is measured, reported and controlled by means of using internal metrics, including the Market Access Report (MAR) . MAR limits are established to ensure that funding can be obtained and / or renewed in professional markets under normal business conditions, in different time horizons and currencies . The Bank also sets a minimum amount of highly liquid assets (or liquidity buffer), and a limit of the cross - currency funding position . Concentration ratios and other complementary metrics are also periodically measured, reported and controlled against warning levels . In addition, the Bank reports standardized metrics to regulators in accordance with their guidelines, such as the Liquidity Coverage Ratio (LCR) and the Net Stable Financing Ratio (NSFR) . It also continuously monitors and tracks market variables and/or material events that could affect our liquidity position . In accordance with its Liquidity Risk Management Policy, the Bank performs regular stress testing in order to quantify its cash needs in the event of adverse scenarios of varying severity, which are contrasted against potentially available action plans detailed within the Liquidity Contingency Plan . These results are daily reported, monitored and controlled based on the maximum liquidity risk appetite defined by the Board . On the other hand, trading liquidity is assured by using limits with certain specific maturities based on the amounts that are normally traded in professional markets for interest rate exposure generated by debt instruments and derivatives . The same process is used to limit the Bank's overall exposure to each currency and to exchange rate volatility with varying maturities . These internal and regulatory metrics are regularly reported to the business units responsible for managing liquidity risk . Similarly, senior management is immediately notified if the limits are exceeded or triggers are breached, including, if necessary, monitoring of corrective action plans . Finally, the general status of liquidity risk is reported to the Asset and Liabilities Committee on a monthly basis and to the Board on a quarterly basis . | 61
Risk & Capital Management Operational Risk Operational risk is the risk of loss resulting from deficiencies or failures in internal processes, staff or systems, or from external events. This definition includes legal risks and excludes strategic and reputation risks. Operational risk is inherent to all activities, products and systems, as well as strategic, business and support processes throughout the organization . All bank employees are appropriately responsible for the management and control of operational risks inherent to their duties, since these risks may result in direct or indirect financial losses . The bank controls and manages operational risk by developing a regulatory and governance framework adapted to the complexity of its business . The Operational Risk Policy defines a comprehensive management framework that includes identifying, evaluating, controlling, mitigating, monitoring and reporting these risks . This requires executing several processes as follows : ● Process Assessment ● Supplier Management ● Fraud Management ● Management of Operational Events and Operational Losses ● Operational Risk Assessment for Projects ● Control Testing ● Risk Appetite Profile and Framework ● Self - Assessment Matrix ● Relations with External Entities and Corporate Training Plan Business Continuity Different situations that could affect the business continuity of the organization or the country, which requires to be constantly prepared to keep operating the products and services that are critical to its customers. Being prepared to face any emergency is key to providing exceptional services to our customers . Therefore, we have developed a robust, consistent Business Continuity Plan to safeguard the bank and its subsidiaries . The objective of the plan is to establish general guidelines for ensuring the safety of our employees, protecting the organization's capital from catastrophic events, maintaining and updating documentation, and conducting training and testing . To comply with these guidelines, the bank has developed a strategy to meet this objective that covers the following areas : ● Document Management ● Business Continuity Testing ● Crisis Management ● Critical Supplier Management ● Management of Alternative Sites ● Relationship with Subsidiaries and External Organizations ● Continuous Improvement ● Training ● Information Security Officer (ISO) | 62
Risk & Capital Management Technological Risk, Cybersecurity and Data Protection Society is increasingly digitalized, so customer privacy and cybersecurity risk management is a priority for Banco de Chile . Therefore, the bank has developed a Strategic Cybersecurity Plan, which is aligned with the bank's business strategy . The main objectives of this plan are to protect customer and employee data, safeguard the bank's data, manage technological, cybersecurity and data security risks, and strengthen the risk prevention culture . This plan complies with the appropriate regulations, which include the Personal Data Protection Law 21 , 096 , the Protection of Privacy Law 19 , 628 and the provisions published in the Updated Compilation of Rules (RAN) issued by the Financial Market Commission (CMF) . This plan has been approved by senior management, who regularly receive associated progress reports . Data security and cybersecurity policies at Banco de Chile establish guidelines regarding the responsibility for and protection of data and its associated risk management, based on both regulatory aspects and international standards . These policies are reviewed annually and apply to employees, outsourced personnel, as well as suppliers and contractors of services who access its facilities or have access to bank and subsidiary data . The controls that protect this information and IT assets are defined by regulations, processes and the bank’s internal procedures . Conduct Risk and Anti - Money Laundering Banco de Chile knows that sound ethical management is essential for its industry leading position . Therefore, the bank has diverse protocols, systems and models to ensure ethical behavior of all its employees . The Code of Conduct is the key guideline and essential component of the bank's corporate ethics . It contains the general principles and instructions that guide the ethical - professional conduct of the employees, directors and board advisors . The purpose of the code is to safeguard the fundamental values to properly conduct the bank's business, in accordance with the bank's corporate philosophy . The Ethics Committee is responsible for overseeing its implementation within the bank . Preventing corruption and the use of the bank and its subsidiaries to engage in unlawful practices has been a concern over the last few decades for Banco de Chile . Awareness - raising measures and controls have been intensified during 2022 , in order to prevent this kind of behavior . The bank has approved a Code of Conduct, a Prevention of Dishonest Practices Policy and a Handling Conflicts of Interest Policy, which describe the main roles and responsibilities to avoid that anything may be interpreted as a violation of ethical conduct or imply the risk of corruption or bribery . The Compliance Division by means of its Regulatory Compliance Area and the Ethics Committee are responsible for ensuring compliance with the conduct described in these policies . Model Risk and Internal Control Its purpose is to manage the risks associated with models and their processes, so it relies on the model validation, model risk management and internal control functions . Model validation is responsible for performing an independent review of risk models, including risk - weighted assets and stress testing, during their construction and implementation stages . It validates compliance with board - approved guidelines and addresses aspects such as governance, data quality, modeling techniques, methodological and parametric implementation analysis and documentation . The results of these reviews are submitted to the respective committees . Model risk management is responsible for monitoring models and ensuring that they fulfill their life cycle status . The Model Risk Management Committee was created in July 2023 and is composed of members of the Bank’ senior management . | 63
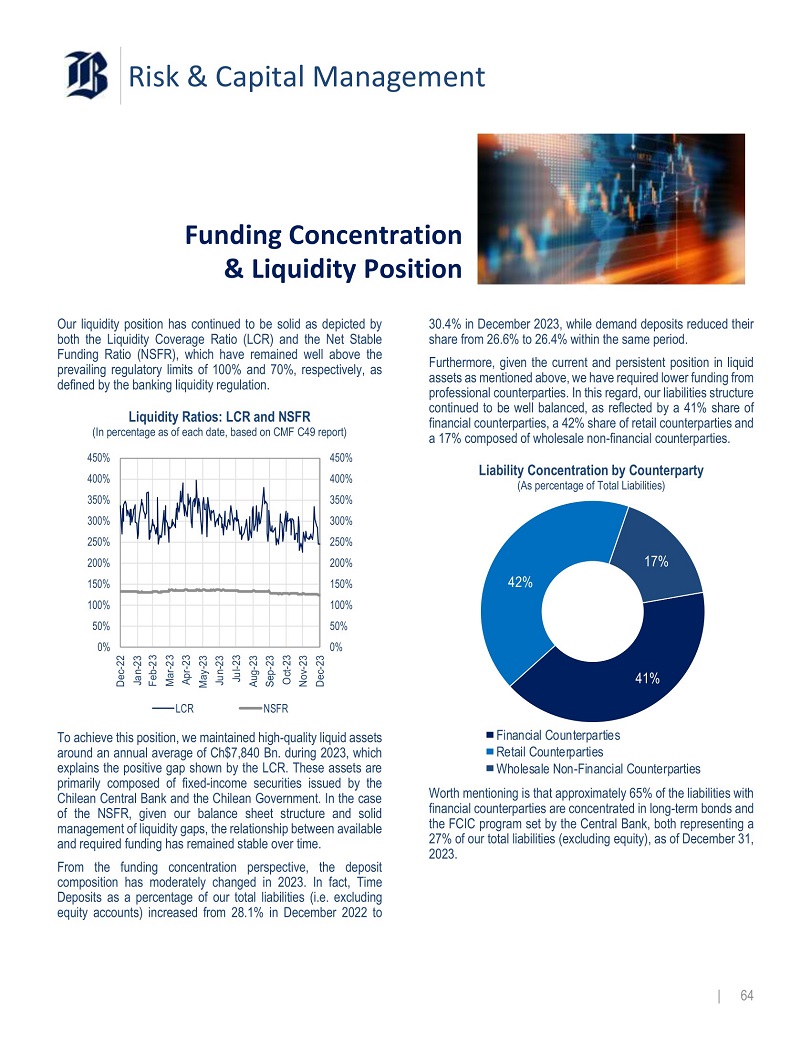
Risk & Capital Management Funding Concentration & Liquidity Position Our liquidity position has continued to be solid as depicted by both the Liquidity Coverage Ratio (LCR) and the Net Stable Funding Ratio (NSFR), which have remained well above the prevailing regulatory limits of 100 % and 70 % , respectively, as defined by the banking liquidity regulation . Liquidity Ratios: LCR and NSFR (In percentage as of each date, based on CMF C49 report) 450% 400% 350% 300% 250% 200% 150% 100% 50% 0% 450% 400% 350% 300% 250% 200% 150% 100% 50% 0% Dec - 22 Jan - 23 Feb - 23 Mar - 23 Apr - 23 May - 23 Jun - 23 Jul - 23 Aug - 23 Sep - 23 Oct - 23 Nov - 23 Dec - 23 LCR NSFR To achieve this position, we maintained high - quality liquid assets around an annual average of Ch $ 7 , 840 Bn . during 2023 , which explains the positive gap shown by the LCR . These assets are primarily composed of fixed - income securities issued by the Chilean Central Bank and the Chilean Government . In the case of the NSFR, given our balance sheet structure and solid management of liquidity gaps, the relationship between available and required funding has remained stable over time . From the funding concentration perspective, the deposit composition has moderately changed in 2023 . In fact, Time Deposits as a percentage of our total liabilities (i . e . excluding equity accounts) increased from 28 . 1 % in December 2022 to 30 . 4 % in December 2023 , while demand deposits reduced their share from 26 . 6 % to 26 . 4 % within the same period . Furthermore, given the current and persistent position in liquid assets as mentioned above, we have required lower funding from professional counterparties . In this regard, our liabilities structure continued to be well balanced, as reflected by a 41 % share of financial counterparties, a 42 % share of retail counterparties and a 17 % composed of wholesale non - financial counterparties . Liability Concentration by Counterparty (As percentage of Total Liabilities) 41% 42% 17% Financial Counterparties Retail Counterparties Wholesale Non - Financial Counterparties Worth mentioning is that approximately 65 % of the liabilities with financial counterparties are concentrated in long - term bonds and the FCIC program set by the Central Bank, both representing a 27 % of our total liabilities (excluding equity), as of December 31 , 2023 . | 64
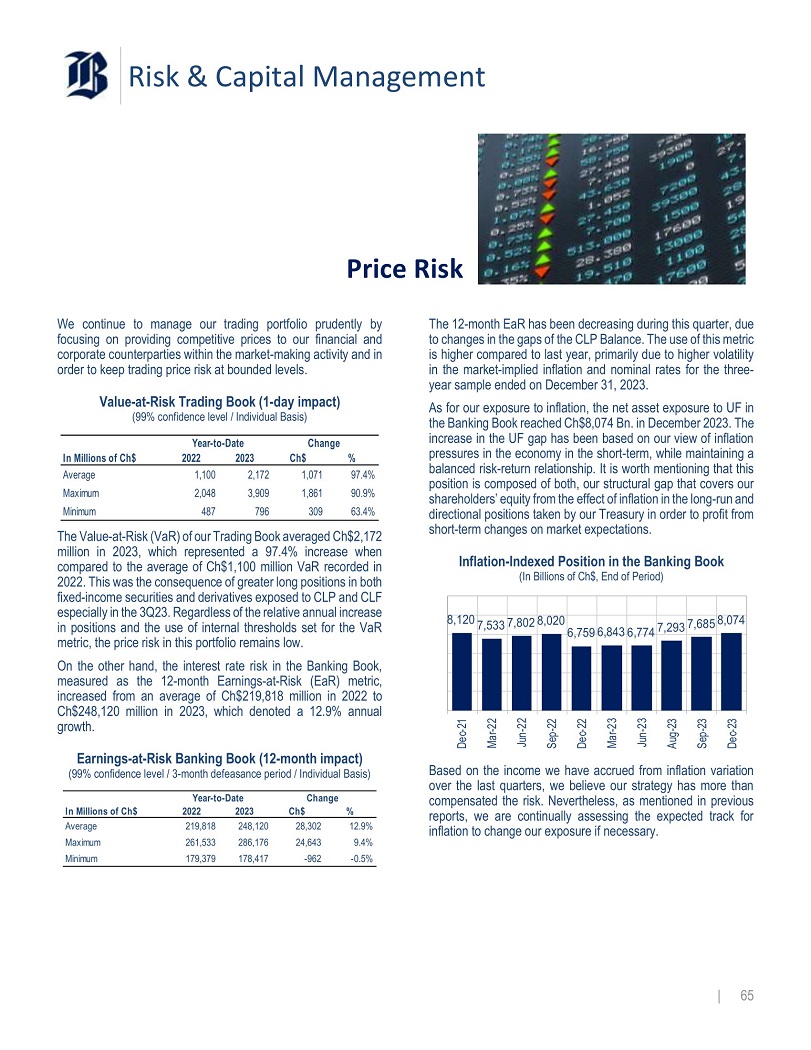
Risk & Capital Management Price Risk We continue to manage our trading portfolio prudently by focusing on providing competitive prices to our financial and corporate counterparties within the market - making activity and in order to keep trading price risk at bounded levels . 97.4% 1,071 2,172 1,100 Average 90.9% 1,861 3,909 2,048 Maximum 63.4% 309 796 487 Minimum Value - at - Risk Trading Book (1 - day impact) (99% confidence level / Individual Basis) Year - to - Date Change In Millions of Ch$ 2022 2023 Ch$ % The Value - at - Risk (VaR) of our Trading Book averaged Ch $ 2 , 172 million in 2023 , which represented a 97 . 4 % increase when compared to the average of Ch $ 1 , 100 million VaR recorded in 2022 . This was the consequence of greater long positions in both fixed - income securities and derivatives exposed to CLP and CLF especially in the 3 Q 23 . Regardless of the relative annual increase in positions and the use of internal thresholds set for the VaR metric, the price risk in this portfolio remains low . On the other hand, the interest rate risk in the Banking Book, measured as the 12 - month Earnings - at - Risk (EaR) metric, increased from an average of Ch $ 219 , 818 million in 2022 to Ch $ 248 , 120 million in 2023 , which denoted a 12 . 9 % annual growth . 12.9% 28,302 248,120 219,818 Average 9.4% 24,643 286,176 261,533 Maximum - 0.5% - 962 178,417 179,379 Minimum Earnings - at - Risk Banking Book (12 - month impact) (99% confidence level / 3 - month defeasance period / Individual Basis) Year - to - Date Change In Millions of Ch$ 2022 2023 Ch$ % The 12 - month EaR has been decreasing during this quarter, due to changes in the gaps of the CLP Balance . The use of this metric is higher compared to last year, primarily due to higher volatility in the market - implied inflation and nominal rates for the three - year sample ended on December 31 , 2023 . As for our exposure to inflation, the net asset exposure to UF in the Banking Book reached Ch $ 8 , 074 Bn . in December 2023 . The increase in the UF gap has been based on our view of inflation pressures in the economy in the short - term, while maintaining a balanced risk - return relationship . It is worth mentioning that this position is composed of both, our structural gap that covers our shareholders’ equity from the effect of inflation in the long - run and directional positions taken by our Treasury in order to profit from short - term changes on market expectations . Inflation - Indexed Position in the Banking Book (In Billions of Ch$, End of Period) 8,120 7,533 7,802 8,020 6,759 6,843 6,774 7,293 7,685 8,074 Dec - 21 Mar - 22 Jun - 22 Sep - 22 Dec - 22 Mar - 23 Jun - 23 Aug - 23 Sep - 23 Dec - 23 Based on the income we have accrued from inflation variation over the last quarters, we believe our strategy has more than compensated the risk . Nevertheless, as mentioned in previous reports, we are continually assessing the expected track for inflation to change our exposure if necessary . | 65
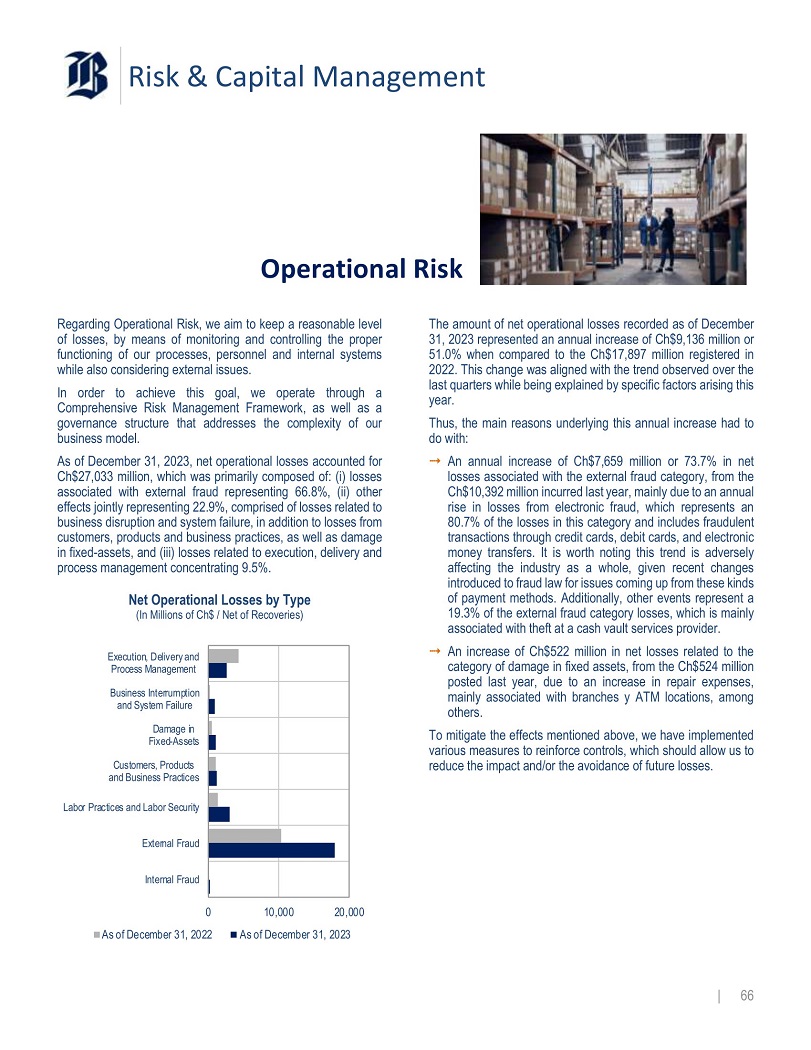
Risk & Capital Management Operational Risk Regarding Operational Risk, we aim to keep a reasonable level of losses, by means of monitoring and controlling the proper functioning of our processes, personnel and internal systems while also considering external issues . In order to achieve this goal, we operate through a Comprehensive Risk Management Framework, as well as a governance structure that addresses the complexity of our business model . As of December 31 , 2023 , net operational losses accounted for Ch $ 27 , 033 million, which was primarily composed of : (i) losses associated with external fraud representing 66 . 8 % , (ii) other effects jointly representing 22 . 9 % , comprised of losses related to business disruption and system failure, in addition to losses from customers, products and business practices, as well as damage in fixed - assets, and (iii) losses related to execution, delivery and process management concentrating 9 . 5 % . Net Operational Losses by Type (In Millions of Ch$ / Net of Recoveries) 0 As of December 31, 2022 10,000 20,000 As of December 31, 2023 Labor Practices and Labor Security External Fraud Internal Fraud Customers, Products and Business Practices Damage in Fixed - Assets Business Interrumption and System Failure Execution, Delivery and Process Management The amount of net operational losses recorded as of December 31 , 2023 represented an annual increase of Ch $ 9 , 136 million or 51 . 0 % when compared to the Ch $ 17 , 897 million registered in 2022 . This change was aligned with the trend observed over the last quarters while being explained by specific factors arising this year . Thus, the main reasons underlying this annual increase had to do with : ⭬ An annual increase of Ch $ 7 , 659 million or 73 . 7 % in net losses associated with the external fraud category, from the Ch $ 10 , 392 million incurred last year, mainly due to an annual rise in losses from electronic fraud, which represents an 80 . 7 % of the losses in this category and includes fraudulent transactions through credit cards, debit cards, and electronic money transfers . It is worth noting this trend is adversely affecting the industry as a whole, given recent changes introduced to fraud law for issues coming up from these kinds of payment methods . Additionally, other events represent a 19 . 3 % of the external fraud category losses, which is mainly associated with theft at a cash vault services provider . ⭬ An increase of Ch $ 522 million in net losses related to the category of damage in fixed assets, from the Ch $ 524 million posted last year, due to an increase in repair expenses, mainly associated with branches y ATM locations, among others . To mitigate the effects mentioned above, we have implemented various measures to reinforce controls, which should allow us to reduce the impact and/or the avoidance of future losses . | 66
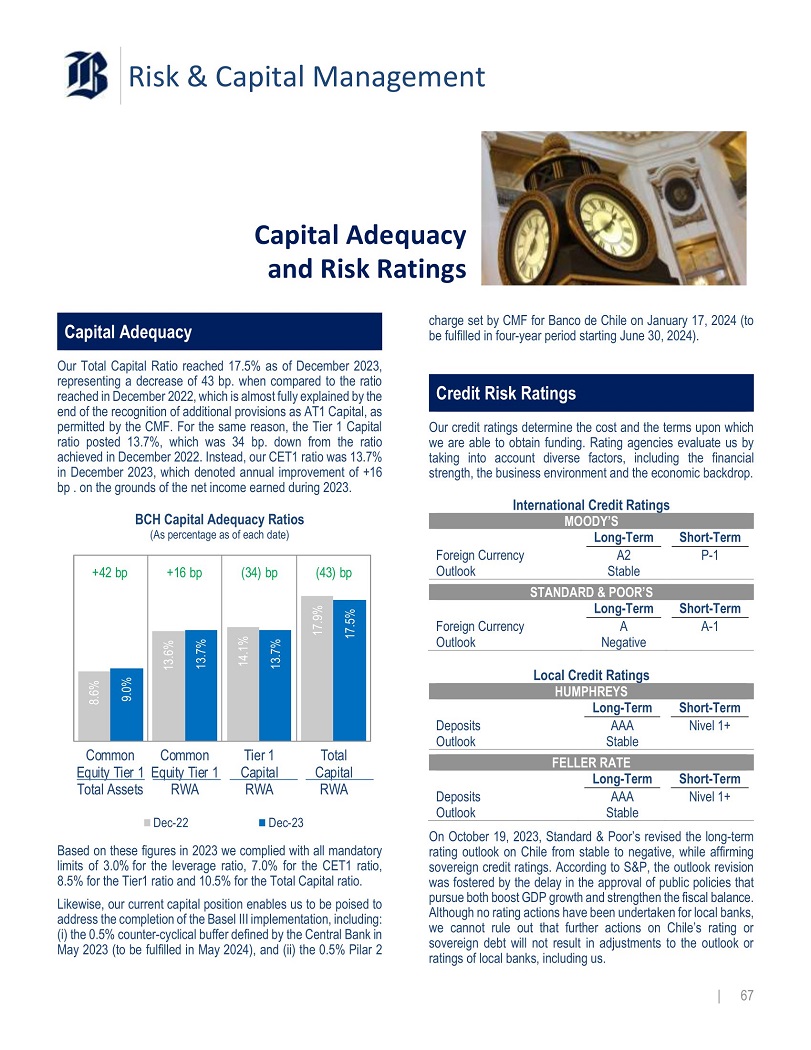
Risk & Capital Management Capital Adequacy and Risk Ratings Capital Adequacy Our Total Capital Ratio reached 17 . 5 % as of December 2023 , representing a decrease of 43 bp . when compared to the ratio reached in December 2022 , which is almost fully explained by the end of the recognition of additional provisions as AT 1 Capital, as permitted by the CMF . For the same reason, the Tier 1 Capital ratio posted 13 . 7 % , which was 34 bp . down from the ratio achieved in December 2022 . Instead, our CET 1 ratio was 13 . 7 % in December 2023 , which denoted annual improvement of + 16 bp . on the grounds of the net income earned during 2023 . 8.6% 13.6% 14.1% 17.9% 9.0% 13.7% 13.7% 17.5% +42 bp BCH Capital Adequacy Ratios (As percentage as of each date) +16 bp (34) bp (43) bp Common Common Equity Tier 1 Equity Tier 1 Total Assets RWA Tier 1 Total Capital Capital RWA RWA Dec - 22 Dec - 23 Based on these figures in 2023 we complied with all mandatory limits of 3 . 0 % for the leverage ratio, 7 . 0 % for the CET 1 ratio, 8 . 5 % for the Tier 1 ratio and 10 . 5 % for the Total Capital ratio . Likewise, our current capital position enables us to be poised to address the completion of the Basel III implementation, including : (i) the 0.5% counter - cyclical buffer defined by the Central Bank in May 2023 (to be fulfilled in May 2024), and (ii) the 0.5% Pilar 2 charge set by CMF for Banco de Chile on January 17, 2024 (to be fulfilled in four - year period starting June 30, 2024). Credit Risk Ratings Our credit ratings determine the cost and the terms upon which we are able to obtain funding . Rating agencies evaluate us by taking into account diverse factors, including the financial strength, the business environment and the economic backdrop . International Credit Ratings MOODY’S Long - Term Short - Term Foreign Currency Outlook A2 P - 1 Stable STANDARD & POOR’S Long - Term Short - Term Foreign Currency Outlook A A - 1 Negative Local Credit Ratings HUMPHREYS Long - Term Short - Term Deposits Outlook AAA Nivel 1+ Stable FELLER RATE Short - Term Nivel 1+ Deposits Outlook Long - Term AAA Stable On October 19 , 2023 , Standard & Poor’s revised the long - term rating outlook on Chile from stable to negative, while affirming sovereign credit ratings . According to S&P, the outlook revision was fostered by the delay in the approval of public policies that pursue both boost GDP growth and strengthen the fiscal balance . Although no rating actions have been undertaken for local banks, we cannot rule out that further actions on Chile’s rating or sovereign debt will not result in adjustments to the outlook or ratings of local banks, including us . | 67
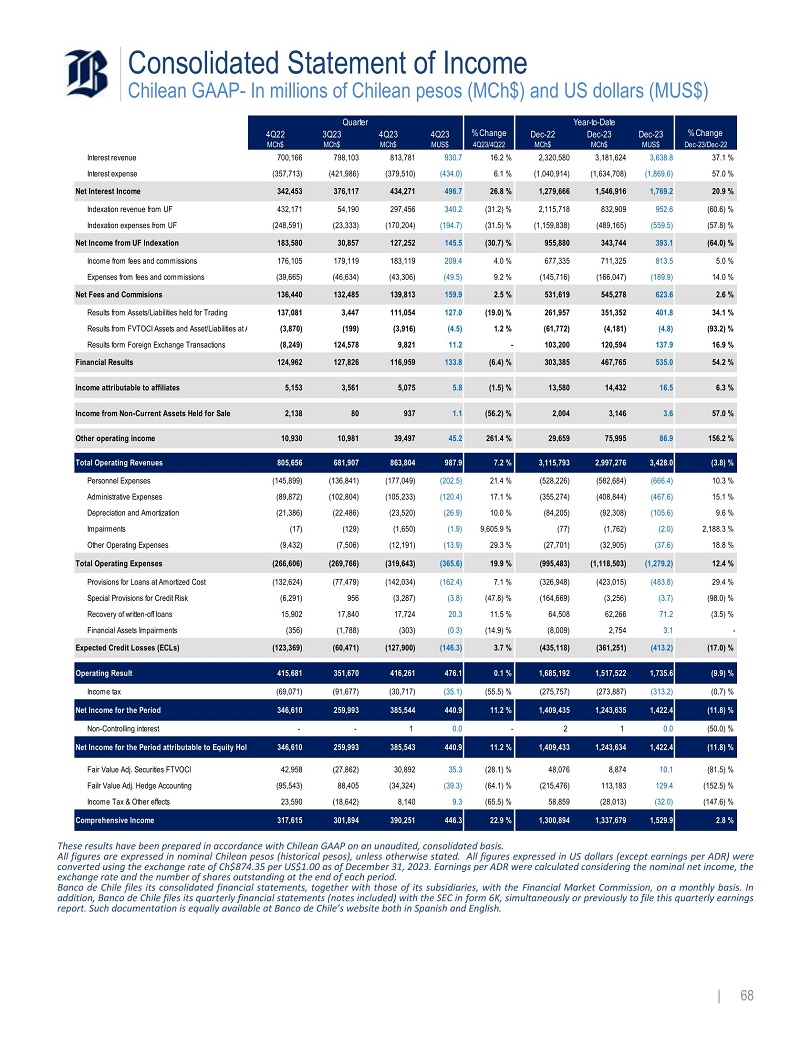
Consolidated Statement of Income Chilean GAAP - In millions of Chilean pesos (MCh$) and US dollars (MUS$) Year - to - Date Quarter % Change Dec - 23/Dec - 22 Dec - 23 MUS$ Dec - 23 MCh$ Dec - 22 MCh$ % Change 4Q23/4Q22 4Q23 MUS$ 4Q23 MCh$ 3Q23 MCh$ 4Q22 MCh$ 37.1 % 3,638.8 3,181,624 2,320,580 16.2 % 930.7 813,781 798,103 700,166 Interest revenue 57.0 % (1,869.6) (1,634,708) (1,040,914) 6.1 % (434.0) (379,510) (421,986) (357,713) Interest expense 20.9 % 1,769.2 1,546,916 1,279,666 26.8 % 496.7 434,271 376,117 342,453 Net Interest Income (60.6) % 952.6 832,909 2,115,718 (31.2) % 340.2 297,456 54,190 432,171 Indexation revenue from UF (57.8) % (559.5) (489,165) (1,159,838) (31.5) % (194.7) (170,204) (23,333) (248,591) Indexation expenses from UF (64.0) % 393.1 343,744 955,880 (30.7) % 145.5 127,252 30,857 183,580 Net Income from UF Indexation 5.0 % 813.5 711,325 677,335 4.0 % 209.4 183,119 179,119 176,105 Income from fees and commissions 14.0 % (189.9) (166,047) (145,716) 9.2 % (49.5) (43,306) (46,634) (39,665) Expenses from fees and commissions 2.6 % 623.6 545,278 531,619 2.5 % 159.9 139,813 132,485 136,440 Net Fees and Commisions 34.1 % 401.8 351,352 261,957 (19.0) % 127.0 111,054 3,447 137,081 Results from Assets/Liabilities held for Trading (93.2) % (4.8) (4,181) (61,772) 1.2 % (4.5) (3,916) (199) (3,870) Results from FVTOCI Assets and Asset/Liabilities at 16.9 % 137.9 120,594 103,200 - 11.2 9,821 124,578 (8,249) Results form Foreign Exchange Transactions 54.2 % 535.0 467,765 303,385 (6.4) % 133.8 116,959 127,826 124,962 Financial Results 6.3 % 16.5 14,432 13,580 (1.5) % 5.8 5,075 3,561 5,153 Income attributable to affiliates 57.0 % 3.6 3,146 2,004 (56.2) % 1.1 937 80 2,138 Income from Non - Current Assets Held for Sale 156.2 % 86.9 75,995 29,659 261.4 % 45.2 39,497 10,981 10,930 Other operating income (3.8) % 3,428.0 2,997,276 3,115,793 7.2 % 987.9 863,804 681,907 805,656 Total Operating Revenues 10.3 % (666.4) (582,684) (528,226) 21.4 % (202.5) (177,049) (136,841) (145,899) Personnel Expenses 15.1 % (467.6) (408,844) (355,274) 17.1 % (120.4) (105,233) (102,804) (89,872) Administrative Expenses 9.6 % (105.6) (92,308) (84,205) 10.0 % (26.9) (23,520) (22,486) (21,386) Depreciation and Amortization 2,188.3 % (2.0) (1,762) (77) 9,605.9 % (1.9) (1,650) (129) (17) Impairments 18.8 % (37.6) (32,905) (27,701) 29.3 % (13.9) (12,191) (7,506) (9,432) Other Operating Expenses 12.4 % (1,279.2) (1,118,503) (995,483) 19.9 % (365.6) (319,643) (269,766) (266,606) Total Operating Expenses 29.4 % (483.8) (423,015) (326,948) 7.1 % (162.4) (142,034) (77,479) (132,624) Provisions for Loans at Amortized Cost (98.0) % (3.7) (3,256) (164,669) (47.8) % (3.8) (3,287) 956 (6,291) Special Provisions for Credit Risk (3.5) % 71.2 62,266 64,508 11.5 % 20.3 17,724 17,840 15,902 Recovery of written - off loans - 3.1 2,754 (8,009) (14.9) % (0.3) (303) (1,788) (356) Financial Assets Impairments (17.0) % (413.2) (361,251) (435,118) 3.7 % (146.3) (127,900) (60,471) (123,369) Expected Credit Losses (ECLs) (9.9) % 1,735.6 1,517,522 1,685,192 0.1 % 476.1 416,261 351,670 415,681 Operating Result (0.7) % (313.2) (273,887) (275,757) (55.5) % (35.1) (30,717) (91,677) (69,071) Income tax (11.8) % 1,422.4 1,243,635 1,409,435 11.2 % 440.9 385,544 259,993 346,610 Net Income for the Period (50.0) % 0.0 1 2 - 0.0 1 - - Non - Controlling interest (11.8) % 1,422.4 1,243,634 1,409,433 11.2 % 440.9 385,543 259,993 346,610 Net Income for the Period attributable to Equity Hol (81.5) % 10.1 8,874 48,076 (28.1) % 35.3 30,892 (27,862) 42,958 Fair Value Adj. Securities FTVOCI (152.5) % 129.4 113,183 (215,476) (64.1) % (39.3) (34,324) 88,405 (95,543) Failr Value Adj. Hedge Accounting (147.6) % (32.0) (28,013) 58,859 (65.5) % 9.3 8,140 (18,642) 23,590 Income Tax & Other effects 2.8 % 1,529.9 1,337,679 1,300,894 22.9 % 446.3 390,251 301,894 317,615 Comprehensive Income | 68 These results have been prepared in accordance with Chilean GAAP on an unaudited, consolidated basis . All figures are expressed in nominal Chilean pesos (historical pesos), unless otherwise stated . All figures expressed in US dollars (except earnings per ADR) were converted using the exchange rate of Ch $ 874 . 35 per US $ 1 . 00 as of December 31 , 2023 . Earnings per ADR were calculated considering the nominal net income, the exchange rate and the number of shares outstanding at the end of each period . Banco de Chile files its consolidated financial statements, together with those of its subsidiaries, with the Financial Market Commission, on a monthly basis . In addition, Banco de Chile files its quarterly financial statements (notes included) with the SEC in form 6 K, simultaneously or previously to file this quarterly earnings report . Such documentation is equally available at Banco de Chile’s website both in Spanish and English .
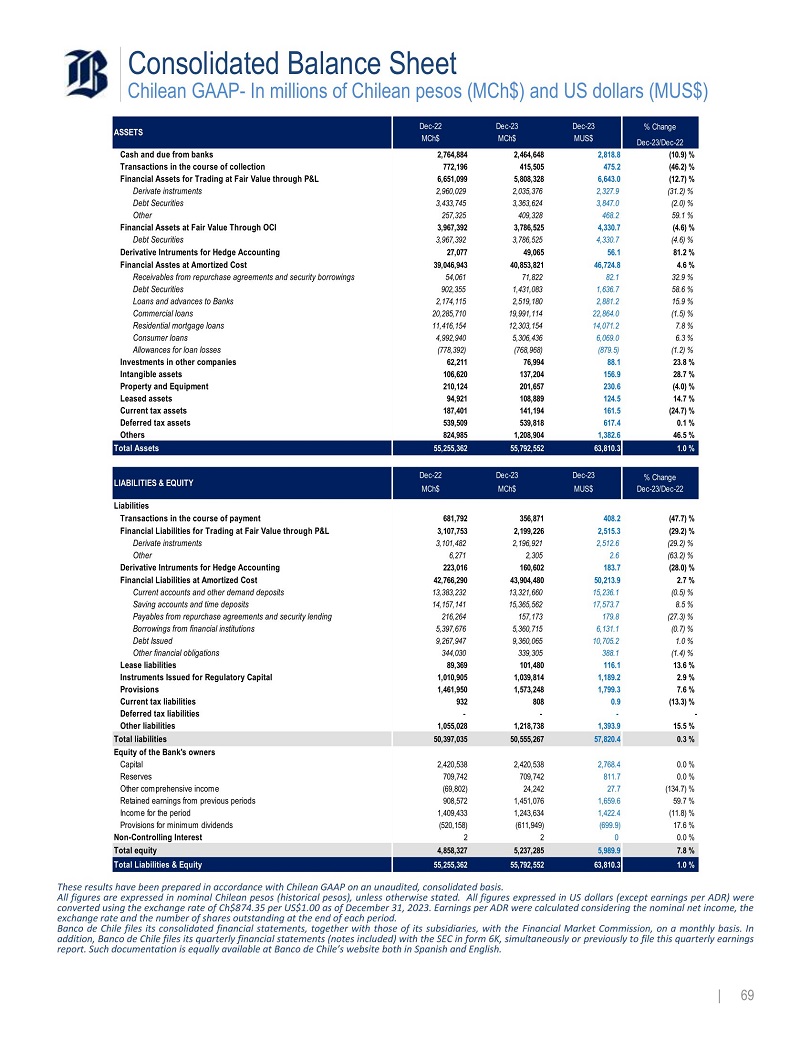
Consolidated Balance Sheet Chilean GAAP - In millions of Chilean pesos (MCh$) and US dollars (MUS$) % Change Dec - 23/Dec - 22 Dec - 23 MUS$ Dec - 23 MCh$ Dec - 22 MCh$ ASSETS (10.9) % 2,818.8 2,464,648 2,764,884 Cash and due from banks (46.2) % 475.2 415,505 772,196 Transactions in the course of collection (12.7) % 6,643.0 5,808,328 6,651,099 Financial Assets for Trading at Fair Value through P&L (31.2) % 2,327.9 2,035,376 2,960,029 Derivate instruments (2.0) % 3,847.0 3,363,624 3,433,745 Debt Securities 59.1 % 468.2 409,328 257,325 Other (4.6) % 4,330.7 3,786,525 3,967,392 Financial Assets at Fair Value Through OCI (4.6) % 4,330.7 3,786,525 3,967,392 Debt Securities 81.2 % 56.1 49,065 27,077 Derivative Intruments for Hedge Accounting 4.6 % 46,724.8 40,853,821 39,046,943 Financial Asstes at Amortized Cost 32.9 % 82.1 71,822 54,061 Receivables from repurchase agreements and security borrowings 58.6 % 1,636.7 1,431,083 902,355 Debt Securities 15.9 % 2,881.2 2,519,180 2,174,115 Loans and advances to Banks (1.5) % 22,864.0 19,991,114 20,285,710 Commercial loans 7.8 % 14,071.2 12,303,154 11,416,154 Residential mortgage loans 6.3 % 6,069.0 5,306,436 4,992,940 Consumer loans (1.2) % (879.5) (768,968) (778,392) Allowances for loan losses 23.8 % 88.1 76,994 62,211 Investments in other companies 28.7 % 156.9 137,204 106,620 Intangible assets (4.0) % 230.6 201,657 210,124 Property and Equipment 14.7 % 124.5 108,889 94,921 Leased assets (24.7) % 161.5 141,194 187,401 Current tax assets 0.1 % 617.4 539,818 539,509 Deferred tax assets 46.5 % 1,382.6 1,208,904 824,985 Others 1.0 % 63,810.3 55,792,552 55,255,362 Total Assets | 69 % Change Dec - 23/Dec - 22 Dec - 23 MUS$ Dec - 23 MCh$ Dec - 22 MCh$ LIABILITIES & EQUITY Liabilities Transactions in the course of payment Financial Liabilities for Trading at Fair Value through P&L Derivate instruments Other Derivative Intruments for Hedge Accounting Financial Liabilities at Amortized Cost Current accounts and other demand deposits Saving accounts and time deposits Payables from repurchase agreements and security lending Borrowings from financial institutions Debt Issued Other financial obligations Lease liabilities Instruments Issued for Regulatory Capital Provisions Current tax liabilities Deferred tax liabilities Other liabilities (47.7) % (29.2) % (29.2) % (63.2) % (28.0) % 2.7 % (0.5) % 8.5 % (27.3) % (0.7) % 1.0 % (1.4) % 13.6 % 2.9 % 7.6 % (13.3) % - 15.5 % 408.2 2,515.3 2,512.6 2.6 183.7 50,213.9 15,236.1 17,573.7 179.8 6,131.1 10,705.2 388.1 116.1 1,189.2 1,799.3 0.9 - 1,393.9 356,871 2,199,226 2,196,921 2,305 160,602 43,904,480 13,321,660 15,365,562 157,173 5,360,715 9,360,065 339,305 101,480 1,039,814 1,573,248 808 - 1,218,738 681,792 3,107,753 3,101,482 6,271 223,016 42,766,290 13,383,232 14,157,141 216,264 5,397,676 9,267,947 344,030 89,369 1,010,905 1,461,950 932 - 1,055,028 0.3 % 57,820.4 50,555,267 50,397,035 Total liabilities 0.0 % 0.0 % (134.7) % 59.7 % (11.8) % 17.6 % 0.0 % 2,768.4 811.7 27.7 1,659.6 1,422.4 (699.9) 0 2,420,538 709,742 24,242 1,451,076 1,243,634 (611,949) 2 2,420,538 709,742 (69,802) 908,572 1,409,433 (520,158) 2 Equity of the Bank's owners Capital Reserves Other comprehensive income Retained earnings from previous periods Income for the period Provisions for minimum dividends Non - Controlling Interest 7.8 % 5,989.9 5,237,285 4,858,327 Total equity 1.0 % 63,810.3 55,792,552 55,255,362 Total Liabilities & Equity These results have been prepared in accordance with Chilean GAAP on an unaudited, consolidated basis . All figures are expressed in nominal Chilean pesos (historical pesos), unless otherwise stated . All figures expressed in US dollars (except earnings per ADR) were converted using the exchange rate of Ch $ 874 . 35 per US $ 1 . 00 as of December 31 , 2023 . Earnings per ADR were calculated considering the nominal net income, the exchange rate and the number of shares outstanding at the end of each period . Banco de Chile files its consolidated financial statements, together with those of its subsidiaries, with the Financial Market Commission, on a monthly basis . In addition, Banco de Chile files its quarterly financial statements (notes included) with the SEC in form 6 K, simultaneously or previously to file this quarterly earnings report . Such documentation is equally available at Banco de Chile’s website both in Spanish and English .
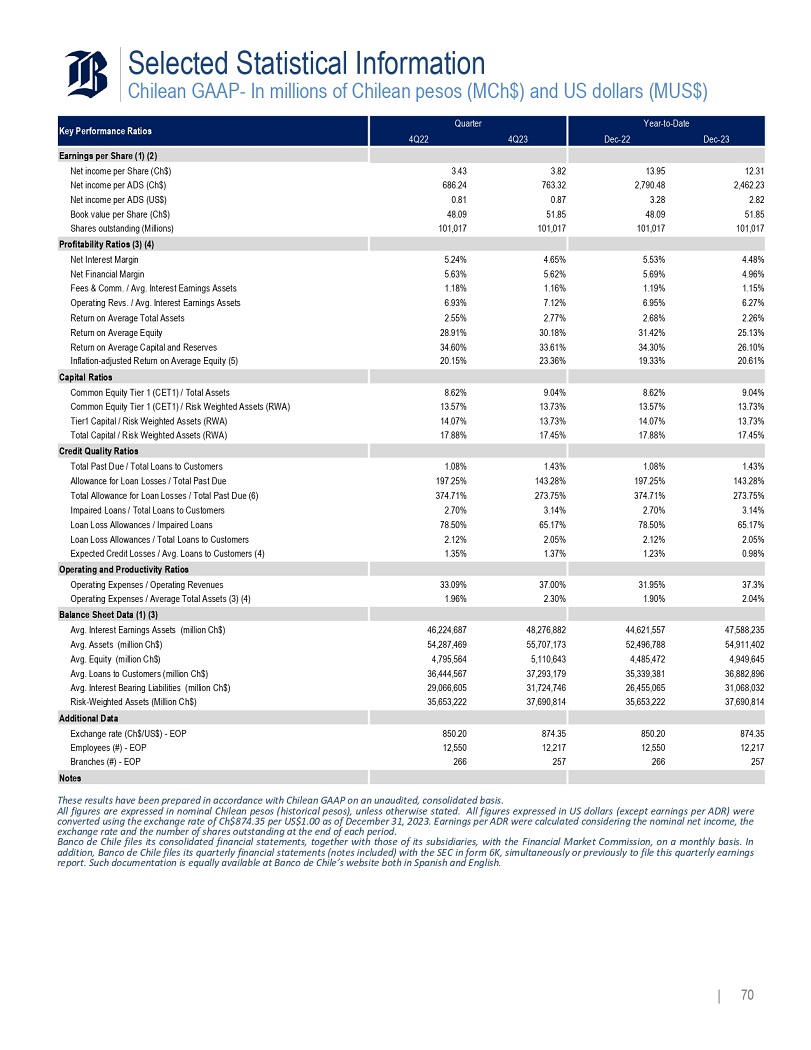
Selected Statistical Information Chilean GAAP - In millions of Chilean pesos (MCh$) and US dollars (MUS$) Year - to - Date Dec - 22 Dec - 23 4Q23 Quarter 4Q22 Key Performance Ratios Earnings per Share (1) (2) 13.95 12.31 3.43 3.82 Net income per Share (Ch$) 2,790.48 2,462.23 763.32 686.24 Net income per ADS (Ch$) 3.28 2.82 0.81 0.87 Net income per ADS (US$) 48.09 51.85 51.85 48.09 Book value per Share (Ch$) 101,017 101,017 101,017 101,017 Shares outstanding (Millions) Profitability Ratios (3) (4) 5.53% 4.48% 5.24% 4.65% Net Interest Margin 5.69% 4.96% 5.63% 5.62% Net Financial Margin 1.19% 1.15% 1.18% 1.16% Fees & Comm. / Avg. Interest Earnings Assets 6.95% 6.27% 6.93% 7.12% Operating Revs. / Avg. Interest Earnings Assets 2.68% 2.26% 2.55% 2.77% Return on Average Total Assets 31.42% 25.13% 28.91% 30.18% Return on Average Equity 34.30% 26.10% 34.60% 33.61% Return on Average Capital and Reserves 19.33% 20.61% 20.15% 23.36% Inflation - adjusted Return on Average Equity (5) Capital Ratios 8.62% 9.04% 8.62% 9.04% Common Equity Tier 1 (CET1) / Total Assets 13.57% 13.73% 13.57% 13.73% Common Equity Tier 1 (CET1) / Risk Weighted Assets (RWA) 14.07% 13.73% 14.07% 13.73% Tier1 Capital / Risk Weighted Assets (RWA) 17.88% 17.45% 17.88% 17.45% Total Capital / Risk Weighted Assets (RWA) Credit Quality Ratios 1.08% 1.43% 1.08% 1.43% Total Past Due / Total Loans to Customers 197.25% 143.28% 197.25% 143.28% Allowance for Loan Losses / Total Past Due 374.71% 273.75% 374.71% 273.75% Total Allowance for Loan Losses / Total Past Due (6) 2.70% 3.14% 2.70% 3.14% Impaired Loans / Total Loans to Customers 78.50% 65.17% 78.50% 65.17% Loan Loss Allowances / Impaired Loans 2.12% 2.05% 2.12% 2.05% Loan Loss Allowances / Total Loans to Customers 1.23% 0.98% 1.35% 1.37% Expected Credit Losses / Avg. Loans to Customers (4) Operating and Productivity Ratios 31.95% 37.3% 33.09% 37.00% Operating Expenses / Operating Revenues 1.90% 2.04% 1.96% 2.30% Operating Expenses / Average Total Assets (3) (4) Balance Sheet Data (1) (3) 44,621,557 47,588,235 48,276,882 46,224,687 Avg. Interest Earnings Assets (million Ch$) 52,496,788 54,911,402 55,707,173 54,287,469 Avg. Assets (million Ch$) 4,485,472 4,949,645 5,110,643 4,795,564 Avg. Equity (million Ch$) 35,339,381 36,882,896 37,293,179 36,444,567 Avg. Loans to Customers (million Ch$) 26,455,065 31,068,032 31,724,746 29,066,605 Avg. Interest Bearing Liabilities (million Ch$) 35,653,222 37,690,814 37,690,814 35,653,222 Risk - Weighted Assets (Million Ch$) Additional Data 850.20 874.35 874.35 850.20 Exchange rate (Ch$/US$) - EOP 12,550 12,229 12,229 12,550 Employees (#) - EOP 266 257 266 257 Branches (#) - EOP Notes (1) Figures are expressed in nominal Chilean pesos. (2) Figures are calculated considering nominal net income, the shares outstanding and the exchange rate existing at the end of each period. (3) Ratios consider daily average balances. (4) Annualized data. (5) Non - GAAP measure computed as net income less the effect of inflation on shareholders’ equity (both for the period) divided by average shareholders’ equity. (6) Including additional allowances. | 70 These results have been prepared in accordance with Chilean GAAP on an unaudited, consolidated basis . All figures are expressed in nominal Chilean pesos (historical pesos), unless otherwise stated . All figures expressed in US dollars (except earnings per ADR) were converted using the exchange rate of Ch $ 874 . 35 per US $ 1 . 00 as of December 31 , 2023 . Earnings per ADR were calculated considering the nominal net income, the exchange rate and the number of shares outstanding at the end of each period . Banco de Chile files its consolidated financial statements, together with those of its subsidiaries, with the Financial Market Commission, on a monthly basis . In addition, Banco de Chile files its quarterly financial statements (notes included) with the SEC in form 6 K, simultaneously or previously to file this quarterly earnings report . Such documentation is equally available at Banco de Chile’s website both in Spanish and English .
Banco de Chile (NYSE:BCH)
Historical Stock Chart
From Mar 2024 to Apr 2024

Banco de Chile (NYSE:BCH)
Historical Stock Chart
From Apr 2023 to Apr 2024
