BlackRock Smll Cos Portfolio Update
January 23 2020 - 4:34AM
UK Regulatory
TIDMBRSC

BLACKROCK SMALLER COMPANIES TRUST PLC (LEI: 549300MS535KC2WH4082)


All information is at 31 December 2019 and unaudited.
Performance at month end is calculated on a capital only basis

                                            One     Three     One    Three      Five
                                          month    months    year    years     years
                                              %         %       %        %         %

Net asset value*                            8.8      14.5    29.7     47.2      87.9

Share price*                                9.2      24.1    42.7     78.1     122.6

Numis ex Inv Companies + AIM Index          7.1      11.9    18.8     15.7      33.1

*performance calculations based on a capital only NAV with debt at par, without
income reinvested. Share price performance calculations exclude income
reinvestment.

Sources:  BlackRock and Datastream

At month end

Net asset value Capital only (debt at par value):                        1,684.88p

Net asset value Capital only (debt at fair value):                       1,674.81p

Net asset value incl. Income (debt at par value)1:                       1,705.91p

Net asset value incl. Income (debt at fair value)1:                      1,695.85p

Share price                                                              1,712.00p

Premium to Cum Income NAV (debt at par value):                                0.4%

Premium to Cum Income NAV (debt at fair value):                               1.0%

Net yield2:                                                                   1.9%

Gross assets3:                                                             GBP897.8m

Gearing range as a % of net assets:                                          0-15%

Net gearing including income (debt at par):                                   2.0%

2019 Ongoing charges ratio4:                                                  0.7%

Ordinary shares in issue5:                                              48,554,792

 1. includes net revenue of 21.03p.

 2. Yield calculations are based on dividends announced in the last 12 months
    as at the date of release of this announcement, and comprise of the final
    dividend of 19.20 pence per share, (announced on 03 May 2019, ex-dividend
    on 16 May 2019) and the interim dividend of 12.8 pence per share (announced
    on 5 November 2019, ex-dividend on 14 November 2019).

 3. includes current year revenue.

 4. As reported in the Annual Financial Report for the year ended 28 February
    2019 the Ongoing Charges Ratio (OCR) was 0.7%. The OCR is calculated as a
    percentage of net assets and using operating expenses, excluding
    performance fees, finance costs and taxation.

 5. excludes 1,438,731 shares held in treasury.

Sector Weightings                                                   % of portfolio

Industrials                                                                   32.8

Financials                                                                    20.8

Consumer Services                                                             18.2

Consumer Goods                                                                 9.2

Health Care                                                                    6.1

Technology                                                                     5.2

Basic Materials                                                                4.1

Oil & Gas                                                                      3.0

Telecommunications                                                             0.6

                                                                             -----

Total                                                                        100.0

                                                                             =====


Ten Largest Equity Investments

Company                                                             % of portfolio

4imprint Group                                                                 2.6

YouGov                                                                         2.4

IntegraFin                                                                     2.2

Avon Rubber                                                                    1.8

Johnson Service Group                                                          1.7

Watches of Switzerland                                                         1.6

Workspace Group                                                                1.6

Bovis Homes Group                                                              1.5

Central Asia Metals                                                            1.4

Oxford Instruments                                                             1.4

Commenting on the markets, Roland Arnold, representing the Investment Manager
noted:


During December the Company's NAV per share rose by 8.8%1 to 1,684.88p on a
capital only basis, whilst our benchmark index, Numis ex Inv Companies + AIM
Index, returned 7.1%1; the FTSE 100 Index rose by 2.7%1 (all calculations are
on a capital only basis).

Equity markets continued to rise through to the end of 2019, responding
positively to the signs of progress on US/China trade and furthermore by the
outcome of the UK General Election, where Boris Johnson's Conservative party
secured a strong majority in Parliament. Unsurprisingly Sterling continued to
rise on the back of the result of the election, leading to domestic businesses
and UK small & mid-cap companies outperforming during the month.

While UK domestics drove the market higher during the month, the Company's
outperformance came from a broad range of businesses rather than a basket of
sterling earners. For example, 4imprint, which generates almost 100% of its
earnings from the US, was a top contributor to performance. The largest
contributor to performance during the month was specialist sustainable
investing fund manager, Impax Asset Management. The shares rallied in response
to strong full year results that were ahead of expectations, as investor demand
for sustainable products continues build traction. Watches of Switzerland
reported strong interim results with upgrades, whilst also announcing the
acquisition of four new showrooms. Shares in The Pebble Group rose following
its IPO (Initial Public Offering) during the month, and also  benefitted from
some of our more domestic holdings including Renew and Ibstock.

Of the largest detractors to performance, a number were domestic facing
businesses that we do not own, which simply received a post-election boost, for
example, Dunelm and Frasers Group (previously Sports Direct). Importantly, and
as we have alluded to in recent reports, the result of the election does not
change our view on many of these businesses and we will not be chasing any
sterling led rallies. Shares in AB Dynamics, the manufacturer of testing
products for the automotive industry, fell in response to full year results
which although highlighted strong profit growth, warned of margin constraints
in their business and challenges facing their customers in the automotive
industry.

The significant Conservative majority in the General Election should begin to
remove the cloud that has been hanging over the UK equity market. As a result
of the increased stability in Government, the political risk premium is
certainly eroding and we would expect this to clear the way for fundamentals to
be the key driver to returns.  In the mid to long-term, this outcome could
result in increased business confidence, and subsequently result in a return/
uptick in corporate spending. However, while the UK is undoubtably in better
position post the election, the path to Brexit remains complicated. Meanwhile
US/China trade negotiations, which we believe will be a far more significant
driver of equity markets, may cause further volatility. We therefore remain
focussed on bottom-up company fundamentals, with a bias towards high quality
market leading global businesses, which are operating in attractive end markets
and run by strong management teams.

1Source: BlackRock as at 31 December 2019

23 January 2020


Latest information is available by typing www.blackrock.co.uk/brsc on the
internet, "BLRKINDEX" on Reuters, "BLRK" on Bloomberg or "8800" on Topic 3 (ICV
terminal).  Neither the contents of the Manager's website nor the contents of
any website accessible from hyperlinks on the Manager's website (or any other
website) is incorporated into, or forms part of, this announcement.


END
(END) Dow Jones Newswires
January 23, 2020 04:34 ET (09:34 GMT)
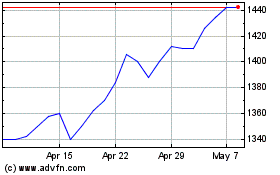
Blackrock Smaller (LSE:BRSC)
Historical Stock Chart
From Mar 2024 to Apr 2024

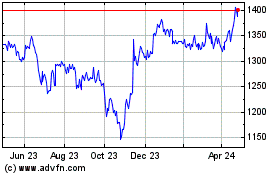
Blackrock Smaller (LSE:BRSC)
Historical Stock Chart
From Apr 2023 to Apr 2024
