0001766267
false
Q1
2024
--03-31
0001766267
2023-04-01
2023-06-30
0001766267
2023-08-14
0001766267
2023-06-30
0001766267
2023-03-31
0001766267
us-gaap:RelatedPartyMember
2023-06-30
0001766267
us-gaap:RelatedPartyMember
2023-03-31
0001766267
2022-04-01
2022-06-30
0001766267
us-gaap:CommonStockMember
2023-03-31
0001766267
us-gaap:AdditionalPaidInCapitalMember
2023-03-31
0001766267
us-gaap:RetainedEarningsMember
2023-03-31
0001766267
us-gaap:AccumulatedOtherComprehensiveIncomeMember
2023-03-31
0001766267
us-gaap:CommonStockMember
2022-03-31
0001766267
us-gaap:AdditionalPaidInCapitalMember
2022-03-31
0001766267
us-gaap:RetainedEarningsMember
2022-03-31
0001766267
us-gaap:AccumulatedOtherComprehensiveIncomeMember
2022-03-31
0001766267
2022-03-31
0001766267
us-gaap:CommonStockMember
2023-04-01
2023-06-30
0001766267
us-gaap:AdditionalPaidInCapitalMember
2023-04-01
2023-06-30
0001766267
us-gaap:RetainedEarningsMember
2023-04-01
2023-06-30
0001766267
us-gaap:AccumulatedOtherComprehensiveIncomeMember
2023-04-01
2023-06-30
0001766267
us-gaap:CommonStockMember
2022-04-01
2022-06-30
0001766267
us-gaap:AdditionalPaidInCapitalMember
2022-04-01
2022-06-30
0001766267
us-gaap:RetainedEarningsMember
2022-04-01
2022-06-30
0001766267
us-gaap:AccumulatedOtherComprehensiveIncomeMember
2022-04-01
2022-06-30
0001766267
us-gaap:CommonStockMember
2023-06-30
0001766267
us-gaap:AdditionalPaidInCapitalMember
2023-06-30
0001766267
us-gaap:RetainedEarningsMember
2023-06-30
0001766267
us-gaap:AccumulatedOtherComprehensiveIncomeMember
2023-06-30
0001766267
us-gaap:CommonStockMember
2022-06-30
0001766267
us-gaap:AdditionalPaidInCapitalMember
2022-06-30
0001766267
us-gaap:RetainedEarningsMember
2022-06-30
0001766267
us-gaap:AccumulatedOtherComprehensiveIncomeMember
2022-06-30
0001766267
2022-06-30
0001766267
SHMY:SynergyEmpireHoldingLimitedMember
SHMY:SynergyEmpireMarshallMember
2019-01-16
0001766267
SHMY:SynergyEmpireHKMember
SHMY:SynergyEmpireMarshallMember
2018-12-31
0001766267
SHMY:SynergyEmpireHKMember
SHMY:LuckyStarMember
2019-02-21
0001766267
SHMY:LuckyStarMember
SHMY:SHDessertMember
2016-02-19
0001766267
SHMY:SynergyEmpireMarshallMember
SHMY:LuckyStarMember
2021-02-26
0001766267
SHMY:LeongWillLiamMember
SHMY:LuckyStarMember
2021-03-31
0001766267
SHMY:SubsidiaryCompanyOneMember
2023-04-01
2023-06-30
0001766267
SHMY:SubsidiaryCompanyTwoMember
2023-04-01
2023-06-30
0001766267
SHMY:SubsidiaryCompanyThreeMember
2023-04-01
2023-06-30
0001766267
SHMY:OfficeAndKitchenEquipmentMember
2023-06-30
0001766267
us-gaap:VehiclesMember
2023-06-30
0001766267
us-gaap:TrademarksMember
2023-06-30
0001766267
SHMY:PeriodEndMYRMember
2023-06-30
0001766267
SHMY:PeriodEndMYRMember
2022-06-30
0001766267
SHMY:PeriodEndPeriodAverageHKMember
2023-06-30
0001766267
SHMY:PeriodEndPeriodAverageHKMember
2022-06-30
0001766267
us-gaap:OfficeEquipmentMember
2023-06-30
0001766267
us-gaap:OfficeEquipmentMember
2023-03-31
0001766267
SHMY:KitchenEquipmentMember
2023-06-30
0001766267
SHMY:KitchenEquipmentMember
2023-03-31
0001766267
us-gaap:VehiclesMember
2023-03-31
0001766267
SHMY:KitchenEquipmentMember
2022-04-01
2022-06-30
0001766267
us-gaap:OfficeEquipmentMember
2022-04-01
2022-06-30
0001766267
SHMY:LeongWillLiamMember
2023-03-31
0001766267
SHMY:SynergyEmpireHKMember
2023-03-31
0001766267
SHMY:LeongWillLiamMember
2023-04-01
2023-06-30
0001766267
SHMY:LeongWillLiamMember
srt:DirectorMember
2023-03-31
0001766267
SHMY:LeongWillLiamMember
srt:DirectorMember
2023-04-01
2023-06-30
0001766267
SHMY:LeongWillLiamMember
srt:DirectorMember
2023-06-30
0001766267
SHMY:SynergyEmpireHKMember
srt:DirectorMember
2023-06-30
0001766267
srt:DirectorMember
2023-06-30
0001766267
SHMY:LuckyStarFAndBSdnBhdMember
SHMY:StandardCharteredSaadiqBerhadMember
2017-01-25
0001766267
SHMY:LuckyStarFAndBSdnBhdMember
SHMY:StandardCharteredSaadiqBerhadMember
2017-01-24
2017-01-25
0001766267
SHMY:LuckyStarFAndBSdnBhdMember
SHMY:StandardCharteredSaadiqBerhadMember
2020-04-01
2020-04-01
0001766267
us-gaap:SalesRevenueNetMember
us-gaap:CustomerConcentrationRiskMember
SHMY:OneCustomerMember
2023-04-01
2023-06-30
0001766267
us-gaap:SalesRevenueNetMember
us-gaap:CustomerConcentrationRiskMember
SHMY:NoCustomerMember
2022-04-01
2022-06-30
0001766267
us-gaap:SalesRevenueNetMember
us-gaap:SupplierConcentrationRiskMember
SHMY:NoSupplierMember
2023-04-01
2023-06-30
0001766267
us-gaap:SalesRevenueNetMember
us-gaap:SupplierConcentrationRiskMember
SHMY:NoSupplierMember
2022-04-01
2022-06-30
0001766267
country:MH
2023-04-01
2023-06-30
0001766267
country:MH
2022-04-01
2022-06-30
0001766267
country:HK
2023-04-01
2023-06-30
0001766267
country:HK
2022-04-01
2022-06-30
0001766267
country:MY
2023-04-01
2023-06-30
0001766267
country:MY
2022-04-01
2022-06-30
0001766267
country:US
2023-04-01
2023-06-30
0001766267
country:US
2023-06-30
0001766267
SHMY:LuckyStarFAndBSdnBhdMember
2023-06-30
0001766267
SHMY:SHDessertsSdnBhdMember
2023-06-30
0001766267
country:MY
2023-06-30
0001766267
SHMY:LuckyStarFAndBSdnBhdMember
2023-04-01
2023-06-30
0001766267
SHMY:LuckyStarFAndBSdnBhdSHDessertsShdBhdMember
2023-06-30
0001766267
SHMY:LuckyStarFAndBSdnBhdSHDessertsShdBhdMember
2023-04-01
2023-06-30
0001766267
country:US
2022-06-30
0001766267
country:MH
2023-06-30
0001766267
country:MH
2022-06-30
0001766267
country:MY
2022-06-30
0001766267
SHMY:LeongWillLiamMember
2018-10-16
2018-10-17
0001766267
SHMY:LeongWillLiamMember
2018-10-17
0001766267
SHMY:LuckyStarFAndBSdnBhdMember
SHMY:CBACapitalHoldingsSdnBhdMember
2019-01-20
2019-01-21
0001766267
SHMY:OfferingMember
2020-12-29
2020-12-30
0001766267
SHMY:OfferingMember
2020-12-30
0001766267
2021-03-31
0001766267
SHMY:AssetsLeasingBusinessMember
2023-04-01
2023-06-30
0001766267
SHMY:FoodAndBeverageBusinessMember
2023-04-01
2023-06-30
0001766267
SHMY:AssetsLeasingBusinessMember
2023-06-30
0001766267
SHMY:FoodAndBeverageBusinessMember
2023-06-30
0001766267
SHMY:AssetsLeasingBusinessMember
2022-04-01
2022-06-30
0001766267
SHMY:FoodAndBeverageBusinessMember
2022-04-01
2022-06-30
0001766267
SHMY:AssetsLeasingBusinessMember
2022-06-30
0001766267
SHMY:FoodAndBeverageBusinessMember
2022-06-30
0001766267
country:US
2022-04-01
2022-06-30
iso4217:USD
xbrli:shares
iso4217:USD
xbrli:shares
xbrli:pure
iso4217:HKD
iso4217:MYR
UNITED
STATES
SECURITIES
AND EXCHANGE COMMISSION
Washington,
D.C. 20549
FORM
10-Q
| ☒ |
QUARTERLY
REPORT PURSUANT TO SECTION 13 OR 15(d) OF THE SECURITIES EXCHANGE ACT OF 1934 |
For
The Quarterly Period Ended June 30, 2023
or
| ☐ |
TRANSITION
REPORT PURSUANT TO SECTION 13 OR 15(d) OF THE SECURITIES EXCHANGE ACT OF 1934 |
For
the transition period from ____________ to ____________
Commission
File Number 333-235700
SYNERGY
EMPIRE LIMITED
(Exact
name of registrant issuer as specified in its charter)
| Nevada |
|
38-4096727 |
(State
or other jurisdiction
of
incorporation or organization) |
|
(I.R.S.
Employer
Identification
No.) |
No.19
Jalan 12/118B, Desa Tun Razak, 56100, Kuala Lumpur, Malaysia.
Address
of principal executive offices, including zip code
+(60)3
- 9171 2828
Registrant’s
phone number, including area code
N/A
(Former
name, former address and former fiscal year, if changed since last report)
Securities
registered pursuant to Section 12(b) of the Act:
| Title
of each class |
|
Trading
Symbol(s) |
|
Name
on each exchange on which registered |
| N/A |
|
N/A |
|
N/A |
Indicate
by check mark whether the registrant (1) has filed all reports required to be filed by Section 13 or 15(d) of the Securities Exchange
Act of 1934 during the preceding 12 months (or for such shorter period that the registrant was required to file such reports), and (2)
has been subject to such filing requirements for the past 90 days.
Yes
☒ No ☐
Indicate
by check mark whether the registrant has submitted electronically every Interactive Data File required to be submitted pursuant to Rule
405 of Regulation S-T (§232.405 of this chapter) during the preceding 12 months (or for such shorter period that the registrant
was required to submit such files).
Yes
☒ No ☐
Indicate
by check mark whether the registrant is a large accelerated filer, an accelerated filer, a non-accelerated filer, a smaller reporting
company, or an emerging growth company. See the definitions of “large accelerated filer”, “accelerated filer”,
“smaller reporting company” and “emerging growth company” in Rule 12b-2 of the Exchange Act.
| Large Accelerated Filer ☐ |
Accelerated Filer ☐ |
Non-accelerated Filer ☒ |
Smaller reporting company ☒ |
| |
|
|
Emerging growth company ☒ |
If
an emerging growth company, indicate by check mark if the registrant has elected not to use the extended transition period for complying
with any new or revised financial accounting standards provided pursuant to Section 13(a) of the Exchange Act.
Indicate
by check mark whether the registrant is a shell company (as defined in Rule12b-2 of the Exchange Act).
Yes
☐ No ☒
APPLICABLE
ONLY TO ISSUERS INVOLVED IN BANKRUPTCY PROCEEDINGS DURING THE PRECEDING FIVE YEARS:
Indicate
by check mark whether the registrant has filed all documents and reports required to be filed by Sections 12, 13 or 15(d) of the Securities
Exchange Act of 1934 subsequent to the distribution of securities under a plan confirmed by a court.
N/A
Indicate
the number of shares outstanding of each of the issuer’s classes of common stock, as of the latest practicable date.
| Class |
|
Outstanding
at August 14, 2023 |
| Common Stock, $0.0001 par
value |
|
1,000,000 |
TABLE
OF CONTENTS
PART
I — FINANCIAL INFORMATION
Item
1. Financial statements
SYNERGY
EMPIRE LIMITED.
CONDENSED
CONSOLIDATED BALANCE SHEETS
AS
OF JUNE 30, 2023 and MARCH 31, 2023
(Currency
expressed in United States Dollars (“US$”), except for number of share)
| | |
As of
June 30,
2023 | | |
As of
March 31,
2023 | |
| | |
| (Unaudited) | | |
| (Audited) | |
| ASSETS | |
| | | |
| | |
| CURRENT ASSETS | |
| | | |
| | |
| Cash and cash equivalents | |
$ | 3,680 | | |
$ | 9,868 | |
| Accounts receivable, net | |
| - | | |
| - | |
| Prepaid expenses and deposits | |
| 9,193 | | |
| 15,681 | |
| TOTAL CURRENT ASSETS | |
$ | 12,873 | | |
$ | 25,549 | |
| | |
| | | |
| | |
| NON-CURRENT ASSETS | |
| | | |
| | |
| Plant and equipment, net | |
| 60,756 | | |
| 66,184 | |
| Intangible asset, net | |
| 1,101 | | |
| 1,199 | |
| TOTAL ASSETS | |
$ | 74,730 | | |
$ | 92,932 | |
| | |
| | | |
| | |
| LIABILITIES AND STOCKHOLDERS’ EQUITY | |
| | | |
| | |
| CURRENT LIABILITIES | |
| | | |
| | |
| Accounts payable | |
$ | 5,617 | | |
$ | 5,928 | |
| Accrued expenses and other payables | |
| 58,507 | | |
| 70,885 | |
| Bank borrowing | |
| 3,480 | | |
| 7,954 | |
| Amount due to a director | |
| 1,290,909 | | |
| 1,325,308 | |
| TOTAL CURRENT LIABILITIES | |
$ | 1,358,513 | | |
$ | 1,410,075 | |
| TOTAL LIABILITIES | |
$ | 1,358,513 | | |
$ | 1,410,075 | |
| | |
| | | |
| | |
| STOCKHOLDERS’ EQUITY | |
| | | |
| | |
| Preferred stock – Par value $0.0001; Authorized: 500,000 None issued and outstanding | |
| - | | |
| - | |
| Common stock – Par value $0.0001; Authorized: 5,000,000 Issued and outstanding: 1,000,000 shares as of June 30 and March 31, 2023 | |
| 100 | | |
| 100 | |
| Additional paid-in capital | |
| 784,083 | | |
| 784,083 | |
| Accumulated other comprehensive income/(loss) | |
| 113,054 | | |
| 32,881 | |
| Accumulated deficit | |
| (2,181,020 | ) | |
| (2,134,207 | ) |
| TOTAL STOCKHOLDERS’ DEFICIT | |
$ | (1,283,783 | ) | |
$ | (1,317,143 | ) |
| | |
| | | |
| | |
| TOTAL LIABILITIES AND STOCKHOLDERS’ EQUITY | |
$ | 74,730 | | |
$ | 92,932 | |
See
accompanying notes to the unaudited condensed consolidated financial statements.
SYNERGY
EMPIRE LIMITED
CONDENSED
CONSOLIDATED STATEMENTS OF OPERATIONS AND COMPREHENSIVE INCOME (LOSS)
FOR
THE THREE MONTHS ENDED JUNE 30, 2023 AND 2022
(Currency
expressed in United States Dollars (“US$”), except for number of shares)
| | |
2023 | | |
2022 | |
| | |
For the Three Months Ended,
June 30 | |
| | |
2023 | | |
2022 | |
| | |
(Unaudited) | | |
(Unaudited) | |
| | |
| | |
| |
| REVENUE | |
$ | 7,859 | | |
$ | 44,909 | |
| | |
| | | |
| | |
| COST AND EXPENSES: | |
| | | |
| | |
| Cost of revenue | |
| - | | |
| (20,963 | ) |
| General and administrative expenses | |
| (54,549 | ) | |
| (167,029 | ) |
| Total operating costs and expenses | |
| (54,549 | ) | |
| (187,992 | ) |
| Loss from operations | |
| (46,690 | ) | |
| (143,083 | ) |
| | |
| | | |
| | |
| Finance cost | |
| (123 | ) | |
| (514 | ) |
| | |
| | | |
| | |
| | |
| | | |
| | |
| Income tax expense | |
| - | | |
| - | |
| | |
| | | |
| | |
| Net loss | |
| (46,813 | ) | |
| (143,597 | ) |
| | |
| | | |
| | |
| Foreign currency translation gain | |
| 80,173 | | |
| 53,377 | |
| | |
| | | |
| | |
| Total comprehensive income | |
$ | 33,360 | | |
$ | (90,220 | ) |
| | |
| | | |
| | |
| Net loss per share, basic and diluted | |
$ | (0.05 | ) | |
$ | (0.14 | ) |
| Net loss per share, basic
| |
$ | (0.05 | ) | |
$ | (0.14 | ) |
| Weighted average number of common shares outstanding, basic and diluted | |
| 1,000,000 | | |
| 1,000,000 | |
| Weighted average number of common shares outstanding, basic | |
| 1,000,000 | | |
| 1,000,000 | |
See
accompanying notes to the unaudited condensed consolidated financial statements.
SYNERGY
EMPIRE LIMITED
CONDENSED
CONSOLIDATED STATEMENTS OF CHANGES IN STOCKHOLDERS’ EQUITY
FOR
THE THREE MONTHS ENDED JUNE 30, 2023 AND 2022
(Currency
expressed in United States Dollars (“US$”), except for number of shares)
| | |
NUMBER
OF
Shares | | |
Amount | | |
Additional
Paid-in
Capital | | |
Accumulated
(DEFICIT)/
PROFIT | | |
Accumulated
comprehensive
loss | | |
Total
STOCKHOLDERS
EQUITY | |
| | |
Common Stock | | |
| | |
| | |
| | |
| |
| | |
NUMBER
OF
Shares | | |
Amount | | |
Additional
Paid-in
Capital | | |
Accumulated
(DEFICIT)/
PROFIT | | |
Accumulated
comprehensive
loss | | |
Total
STOCKHOLDERS
EQUITY | |
| Balance as of April 1, 2023 | |
| 1,000,000 | | |
$ | 100 | | |
$ | 784,083 | | |
$ | (2,134,207 | ) | |
$ | 32,881 | | |
$ | (1,317,143 | ) |
| Net loss for the period | |
| - | | |
| - | | |
| - | | |
| (46,813 | ) | |
| - | | |
| (46,813 | ) |
| Foreign currency translation | |
| - | | |
| - | | |
| - | | |
| - | | |
| 80,173 | | |
| 80,173 | |
| Balance as of June 30, 2023 | |
| 1,000,000 | | |
$ | 100 | | |
$ | 784,083 | | |
$ | (2,181,020 | ) | |
$ | 113,054 | | |
$ | (1,283,783 | ) |
| | |
Common Stock | | |
| | |
| | |
| | |
| |
| | |
NUMBER
OF
Shares | | |
Amount | | |
Additional
Paid-in
Capital | | |
Accumulated
(DEFICIT)/
PROFIT | | |
Accumulated
comprehensive
loss | | |
Total
STOCKHOLDERS
EQUITY | |
| Balance as of April 1, 2022 | |
| 1,000,000 | | |
$ | 100 | | |
$ | 784,083 | | |
$ | (1,599,531 | ) | |
$ | (20,271 | ) | |
$ | (835,619 | ) |
| Net loss for the period | |
| - | | |
| - | | |
| - | | |
| (143,597 | ) | |
| - | | |
| (143,597 | ) |
| Foreign currency translation | |
| - | | |
| - | | |
| - | | |
| - | | |
| 53,377 | | |
| 53,377 | |
| Balance as of June 30, 2022 | |
| 1,000,000 | | |
$ | 100 | | |
$ | 784,083 | | |
$ | (1,743,128 | ) | |
$ | 33,106 | | |
$ | (925,839 | ) |
See
accompanying notes to consolidated financial statements
SYNERGY
EMPIRE LIMITED
CONDENSED
CONSOLIDATED STATEMENTS OF CASH FLOWS
FOR
THREE MONTHS ENDED JUNE 30, 2023 AND 2022
(Currency
expressed in United States Dollars (“US$”), except for number of shares)
| | |
2023 | | |
2022 | |
| | |
For the Three Months Ended,
June 30 | |
| | |
2023 | | |
2022 | |
| | |
(Unaudited) | | |
(Unaudited) | |
| CASH FLOWS FROM OPERATING ACTIVITIES: | |
| | | |
| | |
| Net loss | |
$ | (46,813 | ) | |
$ | (143,597 | ) |
| Adjustments to reconcile net loss to net cash used in operating activities | |
| | | |
| | |
| Depreciation and amortization expenses | |
| 2,027 | | |
| 31,882 | |
| Write off of other receivables | |
| - | | |
| 699 | |
| Changes in operating assets and liabilities: | |
| | | |
| | |
| Increase in accounts receivable | |
| - | | |
| (740 | ) |
| Increase in inventories | |
| - | | |
| (3,664 | ) |
| Decrease/(Increase) in prepaid expenses and deposit | |
| 6,370 | | |
| (642 | ) |
| Decrease in accounts payable | |
| - | | |
| (57 | ) |
| Decrease in accrued liabilities and other payables | |
| (9,893 | ) | |
| (15,365 | ) |
| Change in operating lease liability | |
| - | | |
| (15,413 | ) |
| Net cash flows used in operating activities | |
$ | (48,309 | ) | |
$ | (146,897 | ) |
| | |
| | | |
| | |
| CASH FLOWS FROM INVESTING ACTIVITY: | |
| | | |
| | |
| Purchase of plant and equipment | |
| - | | |
| (10,209 | ) |
| Net cash flows used in investing activity | |
$ | - | | |
$ | (10,209 | ) |
| | |
| | | |
| | |
| CASH FLOWS FROM FINANCING ACTIVITIES: | |
| | | |
| | |
| Advance from directors | |
| 15,050 | | |
| 126,075 | |
| Principal repayments of bank loan | |
| (4,134 | ) | |
| (3,938 | ) |
| Net cash flows provided by financing activities | |
$ | 10,916 | | |
$ | 122,137 | |
| | |
| | | |
| | |
| Effect of exchange rate changes | |
$ | 31,205 | | |
$ | 26,602 | |
| | |
| | | |
| | |
| Net changes in cash and cash equivalents | |
| (6,188 | ) | |
| (8,367 | ) |
| Cash and cash equivalents, beginning of year | |
| 9,868 | | |
| 18,561 | |
| | |
| | | |
| | |
| CASH AND CASH EQUIVALENTS, END OF YEAR | |
$ | 3,680 | | |
$ | 10,194 | |
| | |
| | | |
| | |
| SUPPLEMENTAL CASH FLOWS INFORMATION | |
| | | |
| | |
| | |
| | | |
| | |
| Income taxes paid | |
$ | - | | |
$ | - | |
| Interest paid | |
$ | 123 | | |
$ | 514 | |
See
accompanying notes to the unaudited condensed consolidated financial statements.
SYNERGY
EMPIRE LIMITED
NOTES
TO CONDENSED CONSOLIDATED FINANCIAL STATEMENTS
FOR
THE THREE MONTHS ENDED JUNE 30, 2023 AND 2022
(Currency
expressed in United States Dollars (“US$”), except for number of shares)
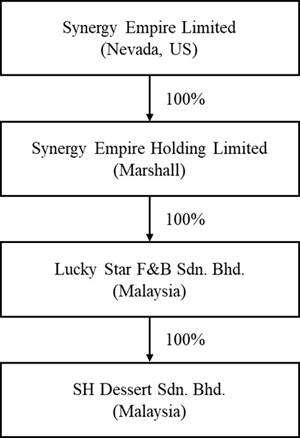
1. ORGANIZATION AND BUSINESS BACKGROUND
Synergy
Empire Limited (“the Company”) was incorporated under the laws of the State of Nevada on October 17, 2018. We have historically
conducted our business through Lucky Star F&B Sdn. Bhd. and SH Dessert Sdn. Bhd, both are private limited liability company, incorporated
in Malaysia.
On
January 16, 2019, the Company acquired 100% of the equity interests of Synergy Empire Holding Limited, a company incorporated in Republic
of the Marshall Islands (“Synergy Empire Marshall”).
On
December 31, 2018, Synergy Empire Marshall acquired 100% of Synergy Empire Limited, a limited liability company incorporated in Hong
Kong (“Synergy Empire HK”).
On
February 21, 2019, Synergy Empire HK acquired 100% of the equity interests of Lucky Star F&B Sdn. Bhd., a limited liability company
incorporated in Malaysia (“Lucky Star”).
Lucky
Star acquired 100% of the equity interests of SH Dessert Sdn. Bhd., a limited liability company incorporated in Malaysia (“SH Dessert”)
by Lucky Star on February 19, 2016.
On
February 26, 2021, Synergy Empire Marshall acquired 100% of Lucky Star F&B Sdn. Bhd from Synergy Empire HK. Subsequently on March
31, 2021, Mr. Leong Will Liam acquired 100% of Synergy Empire HK, as such Synergy Empire HK is no longer a subsidiary of the Company.
Mr.
Leong Will Liam is the common director and major shareholder of the Company, Synergy Empire Marshall and Synergy Empire HK.
On
July 29, 2022, the Company approved the resignation of Mr. Leong Will Liam concurrently with the appointment of Mr. Vicknesya Naayaker
A/L Punosamy as the director of Lucky Star F&B Sdn. Bhd.
On
July 29, 2022, the Company approved the resignation of Mr. Leong Will Liam concurrently with the appointment of Mr. Praveen A/L Ravichandran
as the director of SH Dessert Sdn. Bhd.
The
Company, through its wholly owned subsidiaries, produce and distribute high quality dessert through Lucky Star and operate two restaurants
through SH Dessert. Details of the Company’s subsidiaries:
SCHEDULE
OF COMPANY'S SUBSIDIARIES
| No. | |
Company Name | |
Domicile and Date of
Incorporation | |
Particulars of Issued
Capital | |
Principal Activities |
| 1 | |
Synergy Empire Holding Limited | |
Marshall Islands, October 22, 2018 | |
1 Share of Ordinary Share, US$1 each | |
Investment Holding |
| | |
| |
| |
| |
|
| 2 | |
Lucky Star F&B Sdn. Bhd. | |
Malaysia, February 9, 2010 | |
100,000 Share of Ordinary Share, MYR1 each | |
Food and Beverage Assets Leasing |
| | |
| |
| |
| |
|
| 3 | |
SH Dessert Sdn. Bhd. | |
Malaysia, February 19, 2016 | |
100 Share of Ordinary Share, MYR1 each | |
Food and Beverage Assets Leasing |
On
October 31, 2022, the Company terminated all the tenancy agreements before the due date of the agreements.
On
November 30, 2022, the Company has entered into a lease agreement with a third party, Sweet Bakery & Dessert Café Sdn Bhd
to lease their assets to the third party. The leasing period is commencing from January 1, 2023 to December 31, 2023. The Company did
not cease its business operation nor sell the operating assets. The Company is looking for a new strategic location to continue their
business while leasing out their assets to the third party.
2.
SUMMARY OF SIGNIFICANT ACCOUNTING POLICIES
Basis
of Presentation
These
accompanying financial statements have been prepared in accordance with generally accepted accounting principles in the United States
of America (“US GAAP”).
The
accompanying financial statements include the accounts of the Company and its wholly-owned subsidiaries. Intercompany transactions and
balances were eliminated in consolidation.
Below
is the organization chart of the Group.
Use
of Estimates
In
preparing these financial statements, management makes estimates and assumptions that affect the reported amounts of assets and liabilities
in the balance sheets and revenues and expenses during the years reported. Actual results may differ from these estimates.
Cash
and Cash Equivalents
The
Company considers short-term, highly liquid investments with an original maturity of 90 days or less to be cash equivalents.
Our
deposit in Malaysia is currently deposit in Public Bank Berhad and Standard Chartered Bank (Malaysia) Berhad, and there is a Perbadanan
Insurans Deposit Malaysia protects our eligible deposits held with bank in Malaysia which is members of the Scheme. The scheme will pay
a compensation up to a limit of Malaysia Ringgit (“MYR”) 250,000 per deposit per member bank, which is equivalent to $53,557,
if the aforementioned banks fail.
Plant
and Equipment
Plant
and equipment are stated at cost, with depreciation provided using the straight-line method over the following periods:
SCHEDULE
OF DEPRECIATION AND AMORTIZATION PERIODS OF PLANT AND EQUIPMENT
| Asset Categories | |
Depreciation Periods |
| Office and kitchen equipment | |
10 years |
| Motor vehicle | |
5 years |
Intangible
Asset
Intangible
assets are stated at cost, with amortization provided using the straight-line method over the following periods:
SCHEDULE
OF AMORTIZATION PERIOD OF INTANGIBLE ASSET
| Asset
Categories |
|
Amortization
Periods |
| Trademark |
|
10 years |
Inventories
Inventories
consisting of products available for sell, are stated at the lower of cost or market value. Cost of inventory is determined using the
first-in, first-out (FIFO) method. Inventory reserve is recorded to write down the cost of inventory to the estimated market value due
to slow-moving merchandise and damaged goods, which is dependent upon factors such as historical and forecasted consumer demand, and
promotional environment. The Company takes ownership, risks and rewards of the products purchased. Write downs are recorded in cost of
revenue in the consolidated statements of operations and comprehensive income (loss).
Revenue
recognition
Revenue
is generated through sale of goods and delivery services. Revenue is recognized when a customer obtains control of promised goods or
services and is recognized in an amount that reflects the consideration that the Company expects to receive in exchange for those goods
or services. In addition, the standard requires disclosure of the nature, amount, timing, and uncertainty of revenue and cash flows arising
from contracts with customers. The amount of revenue that is recorded reflects the consideration that the Company expects to receive
in exchange for those goods and services. The Company applies the following five-step model in order to determine this amount:
| (i) | identification
of the promised goods and services in the contract; |
(ii)
determination of whether the promised goods and services are performance obligations, including whether they are distinct in the context
of the contract;
(iii)
measurement of the transaction price, including the constraint on variable consideration;
(iv)
allocation of the transaction price to the performance obligations; and
(v)
recognition of revenue when (or as) the Company satisfies each performance obligation.
The
Company adopted ASU 2014-09, Revenue from Contracts with Customers (Topic 606). Under Topic 606, the Company records revenue when persuasive
evidence of an arrangement exists, delivery has occurred, the fee is fixed or determinable and collectability is probable. The Company
records revenue from the sale of product upon shipment or delivery of the products to the customer. The Company doesn’t allow return
of the products purchased or refund unless the food delivered is spoilt.
Cost
of revenue
Cost
of revenue includes the purchase cost of raw material for manufacturing and distribute to customers and packing materials. It includes
purchasing and receiving costs, internal transfer costs, other costs of distribution network, opening and closing inventory net off discount
received and return outwards in cost of revenue.
Income
tax expense
Income
taxes are determined in accordance with the provisions of ASC Topic 740, “Income Taxes” (“ASC Topic 740”). Under
this method, deferred tax assets and liabilities are recognized for the future tax consequences attributable to differences between the
financial statement carrying amounts of existing assets and liabilities and their respective tax basis. Deferred tax assets and liabilities
are measured using enacted income tax rates expected to apply to taxable income in the years in which those temporary differences are
expected to be recovered or settled. Any effect on deferred tax assets and liabilities of a change in tax rates is recognized in income
in the period that includes the enactment date.
ASC
740 prescribes a comprehensive model for how companies should recognize, measure, present, and disclosed in their financial statements
uncertain tax positions taken or expected to be taken on a tax return. Under ASC 740, tax positions must initially be recognized in the
financial statements when it is more likely than not the position will be sustained upon examination by the tax authorities. Such tax
positions must initially and subsequently be measured as the largest amount of tax benefit that has a greater than 50% likelihood of
being realized upon ultimate settlement with the tax authority assuming full knowledge of the position and relevant facts.
The
Company conducts major businesses in Malaysia and is subject to tax in their own jurisdictions. As a result of its business activities,
the Company will file separate tax returns that are subject to examination by the foreign tax authorities.
Foreign
currencies translation
Transactions
denominated in currencies other than the functional currency are translated into the functional currency at the exchange rates prevailing
at the dates of the transaction. Monetary assets and liabilities denominated in currencies other than the functional currency are translated
into the functional currency using the applicable exchange rates at the balance sheet dates. The resulting exchange differences are recorded
in the statement of operations and comprehensive income (loss).
The
functional currency of the Company is the United States Dollars (“US$”) and the accompanying financial statements have been
expressed in US$. In addition, the Company’s subsidiary maintains its books and record in Malaysian Ringgits (“MYR”)
and United States Dollars (“US$”), which is the respective functional currency as being the primary currency of the economic
environment in which the entity operates.
In
general, for consolidation purposes, assets and liabilities of its subsidiaries whose functional currency is not US$ are translated into
US$, in accordance with ASC Topic 830-30, “Translation of Financial Statement”, using the exchange rate on the balance sheet
date. Revenues and expenses are translated at average rates prevailing during the period. The gains and losses resulting from translation
of financial statements of foreign subsidiary are recorded as a separate component of accumulated other comprehensive income.
Translation
of amounts from the local currency of the Company into US$1 has been made at the following exchange rates for the respective periods:
SCHEDULE OF EXCHANGE RATE TRANSLATION OF AMOUNTS FROM LOCAL CURRENCY
| | |
For the three months ended
June 30 | |
| | |
2023 | | |
2022 | |
| Period-end MYR : US$1 exchange rate | |
| 4.67 | | |
| 4.41 | |
| Period-average MYR : US$1 exchange rate | |
| 4.58 | | |
| 4.38 | |
Related
parties
Parties,
which can be a corporation or individual, are considered to be related if the Company has the ability, directly or indirectly, to control
the other party or exercise significant influence over the other party in making financial and operating decisions. Companies are also
considered to be related if they are subject to common control or common significant influence.
Fair
value of financial instruments
The carrying value of the Company’s financial instruments: cash and
cash equivalents, account receivable, deposits and other receivables, account payable and accrued expenses and other payable approximate
at their fair values because of the short-term nature of these financial instruments.
The
Company also follows the guidance of the ASC Topic 820-10, “Fair Value Measurements and Disclosures” (“ASC 820-10”),
with respect to financial assets and liabilities that are measured at fair value. ASC 820-10 establishes a three-tier fair value hierarchy
that prioritizes the inputs used in measuring fair value as follows:
Level
1 : Observable inputs such as quoted prices in active markets;
Level
2 : Inputs, other than the quoted prices in active markets, that are observable either directly or indirectly; and
Level
3 : Unobservable inputs in which there is little or no market data, which require the reporting entity to develop its own assumptions.
As
of June 30, 2023 and 2022, the Company did not have any nonfinancial assets and liabilities that are recognized or disclosed at fair
value in the financial statements, at least annually, on a recurring basis, nor did the Company have any assets or liabilities measured
at fair value on a non-recurring basis.
Net
Income/(Loss) per Share
The
Company calculates net income/(loss) per share in accordance with ASC Topic 260, “Earnings per Share.” Basic income/(loss)
per share is computed by dividing the net income/(loss) by the weighted-average number of common shares outstanding during the period.
Diluted income per share is computed similar to basic income/(loss) per share except that the denominator is increased to include the
number of additional common shares that would have been outstanding if the potential common stock equivalents had been issued and if
the additional common shares were dilutive.
Lease
The
Company adopted the ASU No. 2016-02, on April 1, 2019 (date of inception). The Company leases central kitchen and restaurants for fixed
periods pre-emptive extension options. The Company recognizes lease payments for its short-term lease on a straight-line basis over the
lease term.
As
of June 30, 2023, the Company have no operating lease of which lease liability is initially and subsequently measured at the present
value of the unpaid lease payments at the lease commencement date. The right-of-use asset is initially measured at cost, which comprises
the initial amount of the lease liability adjusted for lease payments made at or before the lease commencement date, plus any initial
direct costs incurred less any lease incentives received. Costs associated with operating lease assets are recognized on a straight-line
basis within operating expenses over the term of the lease.
In
determining the present value of the unpaid lease payments, ASC 842 requires a lessee to discount its unpaid lease payments using the
interest rate implicit in the lease or, if that rate cannot be readily determined, its incremental borrowing rate. As most of the Company
leases do not provide an implicit rate, the Company uses its incremental borrowing rate as the discount rate for the lease. The Company
incremental borrowing rate is estimated to approximate the interest rate on a collateralized basis with similar terms and payments.
Accounts Receivable
Financial instruments that
potentially subject the Company to concentrations of credit risk consist primarily of accounts receivable. The Company extends credit
to its customers in the normal course of business and generally does not require collateral. The Company’s credit terms are dependent
upon the segment, and the customer. The Company assesses the probability of collection from each customer at the outset of the arrangement
based on a number of factors, including the customer’s payment history and its current creditworthiness. If in management’s
judgment collection is not probable, the Company does not record revenue until the uncertainty is removed.
Management performs ongoing
credit evaluations, and the Company maintains an allowance for potential credit losses based upon its loss history and its aging analysis.
The allowance for doubtful accounts is the Company’s best estimate of the amount of credit losses in existing accounts receivable.
Management reviews the allowance for doubtful accounts each reporting period based on a detailed analysis of trade receivables. In the
analysis, management primarily considers the age of the customer’s receivable, and also considers the creditworthiness of the customer,
the economic conditions of the customer’s industry, general economic conditions and trends, and the business relationship and history
with its customers, among other factors. If any of these factors change, the Company may also change its original estimates, which could
impact the level of the Company’s future allowance for doubtful accounts. If judgments regarding the collectability of receivables
were incorrect, adjustments to the allowance may be required, which would reduce profitability.
Accounts receivable are recognized and carried at the original invoice
amount less an allowance for any uncollectible amounts. An estimate for doubtful accounts receivable is made when collection of the full
amount is no longer probable. Bad debts are written off as identified. For the quarter ended
June 30, 2023, the Company makes an allowance for expected credit loss of $7,859.
Recently
Issued Accounting Standards
In
June 2016, the FASB issued Accounting Standards Update No. 2016-13, Financial Instruments—Credit Losses (Topic 326): Measurement
of Credit Losses on Financial Instruments, which introduced the expected credit losses methodology for the measurement of credit losses
on financial assets measured at amortized cost basis, replacing the previous incurred loss methodology. In November 2019, the FASB issued
ASU 2019-10 highlighted the adoption timeline. For smaller reporting entities, Topic 326 is effective for annual periods beginning after
December 15, 2022, including interim periods within those fiscal years, of which is effective for the Company on April 1, 2023. An analysis
of receivables, including credit losses, was conducted during the first quarter of fiscal 2023. The Company does not anticipate that
the adoption of the new guidance will have a material impact on our consolidated financial statements.
Other
recent accounting pronouncements issued by the FASB, including its Emerging Issues Task Force, the American Institute of Certified Public
Accountants, and the Securities and Exchange Commission did not or are not believed by management to have a material impact on the Company’s
present or future financial statements.
3.
GOING CONCERN UNCERTAINTIES
The
accompanying financial statements have been prepared assuming that the Company will continue as a going concern. The company having accumulated
deficit of $2,181,020 and $2,134,207 as of June 30, 2023 and March 31, 2023 respectively.
For
the three months ended June 30, 2023 and 2022, the Company suffered from a net loss of $46,813 and $143,597 respectively.
Furthermore,
the Company recorded a negative working capital of $1,345,640 and $1,384,526 as of June 30, 2023 and March 31, 2023 respectively.
The
Company’s cash position is not sufficient to support the Company’s daily operations. While the Company believes in the viability
of its strategy and in its ability to raise additional funds, there can be no assurances to that effect. The Company’s ability
to continue as a going concern is dependent upon its ability to improve profitability and the ability to acquire financial support from
its shareholder.
These
and other factors raise substantial doubt about the Company’s ability to continue as a going concern within one year after the
date that financial statements are issued. These financial statements do not include any adjustments to reflect the possible future effects
on the recoverability and classification of assets or the amounts and classification of liabilities that may result in the Company not
being able to continue as a going concern.
4. ACCOUNTS RECEIVABLE, NET
SCHEDULE
OF ACCOUNTS RECEIVABLE NET
| | |
As of June 30, 2023 | | |
As of March 31, 2023 | |
| Accounts receivable, gross | |
$ | 7,859 | | |
$ | - | |
| Allowance for expected credit loss | |
| (7,859 | ) | |
| - | |
| Accounts receivable, net | |
$ | - | | |
$ | - | |
5.
PREPAID EXPENSES AND DEPOSITS
SCHEDULE
OF PREPAID EXPENSES AND DEPOSITS
| | |
As of
June 30, 2023 | | |
As of
March 31, 2023 | |
| Prepaid expenses | |
| 8,750 | | |
| 12,500 | |
| Other receivables | |
| 443 | | |
| 3,181 | |
| Total | |
$ | 9,193 | | |
$ | 15,681 | |
Prepaid
expenses represent OTCQB annual fee.
Other
receivables consist of overpayment to supplier.
6.
PLANT AND EQUIPMENT
SCHEDULE OF PLANT AND EQUIPMENT
| | |
As of
June 30, 2023 | | |
As of March
31, 2023 | |
| Office equipment | |
| 37,223 | | |
| 39,285 | |
| Kitchen equipment | |
| 40,953 | | |
| 43,222 | |
| Motor vehicle | |
| 10,497 | | |
| 11,078 | |
| Total plant and equipment | |
$ | 88,673 | | |
$ | 93,585 | |
| Less: Accumulated depreciation | |
| (27,917 | ) | |
| (27,401 | ) |
| Total plant and equipment | |
$ | 60,756 | | |
$ | 66,184 | |
For
the three months ended June 30, 2023, the Company does not invest in plant and equipment.
For
the three months ended June 30, 2022, the Company has invested $10,076 in kitchen equipment and $134 in office equipment respectively.
Depreciation
expenses for the three months ended June 30, 2023 and 2022 amounted to $1,992 and $16,157 respectively.
7.
ACCRUED EXPENSES AND OTHER PAYABLES
SCHEDULE
OF ACCRUED EXPENSES AND OTHER PAYABLES
| | |
As of
June 30, 2023 | | |
As of
March 31, 2023 | |
| Accrued expenses | |
$ | 24,685 | | |
$ | 31,322 | |
| Other payables | |
| 33,394 | | |
| 39,111 | |
| Deposit received | |
| 428 | | |
| 452 | |
| Total | |
$ | 58,507 | | |
$ | 70,885 | |
Accrued
expenses consist of accrued salary and professional fee.
Other payable consist of payables to suppliers and sales and service tax
payable.
Deposit
received consist of deposit from lease agreement.
8.
AMOUNT DUE TO A DIRECTOR
As
of March 31, 2023, the Company has an outstanding loan payable to Mr. Leong Will Liam amounted $1,325,308,
of which including an amount due to Synergy Empire HK, amounted $24,822.
For the three months ended June 30, 2023, Mr. Leong Will Liam has further advanced $15,050
to the Company for working capital purpose.
Both
aforementioned loans are unsecured, non-interest bearing and payable on demand.
SCHEDULE
OF AMOUNT DUE TO A DIRECTOR
| Amount due to director, Mr. Leong Will Liam | |
| |
| Balance as of March 31, 2023 | |
$ | 1,300,486 | |
| Loan from Director | |
| 15,050 | |
| Foreign currency translation | |
| (49,449 | ) |
| Balance as of June 30, 2023 | |
$ | 1,266,087 | |
| Balance as of June 30, 2023 – Amount due to Synergy Empire HK | |
| 24,822 | |
| Balance as of June 30, 2023 – Total amount due to director | |
$ | 1,290,909 | |
9.
BANK BORROWING
On
January 25, 2017, Lucky Star F&B Sdn. Bhd., a wholly owned subsidiary of the Company has acquired a business loan from Standard Chartered
Saadiq Berhad, a bank incorporated in Malaysia, amounted to MYR342,834 (approximately $83,972) at annual interest of 6.00% accrued in
arrear, for a repayment period of 72 months with interest bearing monthly installment of MYR6,473 (approximately $1,585) which is the
sole bank borrowing by the Company.
The
outstanding balance of business loan as of June 30 and March 31, 2023 can be summarized as follow:
SUMMARY
OF OUTSTANDING BALANCE OF BUSINESS LOANS
| | |
As of
June 30, 2022 | | |
As of
March 31, 2023 | |
| Bank borrowing (Current portion) | |
$ | 3,480 | | |
$ | 7,954 | |
| Bank borrowing (Non-current portion) | |
| - | | |
| - | |
| Total | |
$ | 3,480 | | |
$ | 7,954 | |
On
April 1, 2020, Standard Chartered Saadiq Berhad announced to provide loan deferment to borrower for a period 6 months in supporting of
Malaysia National Bank to ease financial pressure as a result of movement control order promulgated by Malaysia Government to contain
the outbreak of COVID- 19. Pursuant to the announcement, no instalment is required, and no penalty will be imposed during the 6 months
period however additional non-compounding interest will continue to accrue. As such, the Company has incurred additional interest of
$2,141 interest expenses. The last repayment is expected on August 2023.
For
the three months ended June 30, 2023, the Company repaid $4,134 in bank borrowings.
For
the three months ended June 30, 2022, the Company repaid $3,938 in bank borrowings.
Maturities
of the loan for each of the three years and thereafter are as follows:
SCHEDULE
OF MATURITIES OF LOAN
| Year ending March 31 | | |
| |
| | | |
| |
| 2023 | | |
$ | 3,480 | |
| Total | | |
$ | 3,480 | |
10.
CONCENTRATION OF RISK
(a) Major Customers
For
the three months ended June 30, 2023, there was one customer who accounted for 100% of the Company’s revenues with significant
outstanding receivables.
For
the three months ended June 30, 2022, there was no customer who accounted for 10% or more of the Company’s revenues nor with significant
outstanding receivables.
(b) Major Suppliers
For
the three months ended June 30, 2023 and 2022, there was no supplier who accounted for 10% or more of the Company’s purchases nor
with significant outstanding payables.
11.
INCOME TAXES
The
loss before income taxes of the Company for the three months ended June 30, 2023 and 2022 were comprised of the following:
SCHEDULE
OF INCOME (LOSS) BEFORE INCOME TAXES
| | |
For the three months ended
June 30 | |
| | |
2023 | | |
2022 | |
| Tax jurisdictions from: | |
| | | |
| | |
| – Local | |
$ | (43,854 | ) | |
$ | (40,188 | ) |
| | |
| | | |
| | |
| – Foreign, representing: | |
| | | |
| | |
| Marshall Islands (non-taxable jurisdiction) | |
| - | | |
| - | |
| Hong Kong | |
| - | | |
| - | |
| Malaysia | |
| (2,959 | ) | |
| (103,409 | ) |
| Loss before income taxes | |
$ | ) | |
$ | ) |
Provision
for income taxes consisted of the following:
SUMMARY
OF PROVISION FOR INCOME TAX
| | |
| For the three months ended
June 30 | |
| | |
| 2023 | | |
| 2022 | |
| Current: | |
| | | |
| | |
| – Local | |
$ | - | | |
$ | - | |
| – Foreign: | |
| | | |
| | |
| Marshall Islands (non-taxable jurisdiction) | |
| - | | |
| - | |
| Malaysia | |
| - | | |
| - | |
| | |
| | | |
| | |
| Deferred: | |
| | | |
| | |
| – Local | |
| - | | |
| - | |
| – Foreign | |
| - | | |
| - | |
| | |
$ | - | | |
$ | - | |
The
effective tax rate in the periods presented is the result of the mix of income earned in various tax jurisdictions that apply a broad
range of income tax rates. During the periods presented, the Company has a number of subsidiaries that operates in different countries
and is subject to tax in the jurisdictions in which its subsidiaries operate, as follows:
United
States of America
The
Tax Act reduces the U.S. statutory corporate tax rate from 35% to 21% for our tax years beginning in 2018. The Company is registered
in the State of Nevada and is subject to United States of America tax law. As of June 30, 2023, the operations in the United States of
America incurred $331,658 of cumulative net operating losses (NOL’s) which can be carried forward to offset future taxable income.
The NOL carry forwards begin to expire in 2043, if unutilized. The Company has provided for a full valuation allowance of approximately
$69,648 against the deferred tax assets on the expected future tax benefits from the net operating loss carry forwards as the management
believes it is more likely than not that these assets will not be realized in the future.
Malaysia
Lucky
Star F&B Sdn. Bhd. and SH Desserts Sdn. Bhd. are subject to the Malaysia Corporate Tax Laws at a two-tier corporate income tax rate
based on amount of paid-up capital. The 2023 tax rate for company with paid-up capital of MYR 2,500,000 (approximately $535,573) or less
and that are not part of a group containing a company exceeding this capitalization threshold is 17% on the first MYR 600,000 (approximately
$128,537) taxable profit with the remaining balance being taxed at 24%.
For
the three months ended June 30, 2023, Lucky Star F&B Sdn. Bhd.and SH Desserts Sdn. Bhd. incurred a loss of $1,483 and $1,476 respectively,
which can be carried forward for seven years to offset its taxable income.
As
of June 30, 2023, the operations in Malaysia generated $1,844,318 of cumulative net operating losses which can be carried forward to
offset future taxable income. The net operating loss can be carried forward for seven years. The Company has provided for a full valuation
allowance against the deferred tax assets of $313,534 on the expected future tax benefits from the net operating loss carry forwards
as the management believes it is more likely than not that these assets will not be realized in the future.
The
following table sets forth the significant components of the aggregate deferred tax assets of the Company as of June 30 and March 31,
2023:
SCHEDULE
OF DEFERRED TAX ASSETS AND LIABILITIES
| | |
As of
June 30, 2023 | | |
As of
March 31, 2023 |
| Deferred tax assets: | |
| | |
|
|
|
|
| | |
| | |
|
|
|
|
| Net operating loss carryforwards | |
$ | | | |
$ |
|
|
| – United States of America | |
| 69,648 | | |
|
60,439 |
|
| – Marshall Islands | |
| - | | |
|
- |
|
| – Malaysia | |
| 313,534 | | |
|
313,031 |
|
| | |
| 383,182 | | |
|
373,470 |
|
| Less: valuation allowance | |
| (383,182 | ) | |
|
(373,470 |
) |
| Deferred tax assets | |
$ | - | | |
$ |
- |
|
Management
believes that it is more likely than not that the deferred tax assets will not be fully realizable in the future. Accordingly, the Company
provided for a full valuation allowance against its deferred tax assets of $383,182 as of June 30, 2023. For three months ended June
30, 2023, the valuation allowance increased by $9,712, primarily relating to the loss incurred by the Company, Lucky Star F&B Sdn. Bhd. and SH Desserts Shd. Bhd.
12.
STOCKHOLDERS’ EQUITY
On
October 17, 2018, the founder of the Company, Mr. Leong Will Liam purchased 900,000 shares of restricted common stock of the Company
at $0.03 per share for the Company’s initial working capital. Each share was with a par value of $0.0001. All proceeds received
are used for the Company’s working capital.
On
January 21, 2019, CBA Capital Holdings Sdn. Bhd. waived an interest-free loan of $257,183 in Lucky Star F&B Sdn. Bhd., our wholly
own subsidiary, as contribution and recorded in additional paid in capital. CBA Capital Holdings Sdn. Bhd. is wholly owned by our Director,
Mr. Leong Will Liam.
On
December 30, 2020, the Company resolved to close the offering from the registration statement on Form S-1/A, dated February 25, 2020,
that had been declared effective by the Securities and Exchange Commission on March 10, 2020. The Offering resulting in 100,000 shares
of common stock being sold at $5.00 per share for a total of $500,000. The proceed of $500,000 will become the capital for our expansion,
pursuant to the use of proceed stated in the aforementioned Form S-1/A.
As
of March 31, 2021, the Company have an issued and outstanding share of common stock of 1,000,000 with an authorized share of common stock
of 450,000,000 with a par value of $0.0001. In addition, the Company have an authorized share of preference stock of 50,000,000 with
a par value of $0.0001, however no share of preference stock was issued and outstanding as of March 31, 2021.
During
the year ended March 31, 2022, the Company reduce authorized share capital for both common stock of 450,000,000 to 5,000,000 and preferred
stock of 50,000,000 to 500,000, while par value remains the same for both common and preferred stock. As of June 30, 2023, the Company
have an issued and outstanding share of common stock of 1,000,000 while no preferred share was issued and outstanding.
13.
FOREIGN CURRENCY EXCHANGE RATE
The
Company cannot guarantee that the current exchange rate will remain stable, therefore there is a possibility that the Company could post
the same amount of income for two comparable periods and because of the fluctuating exchange rate post higher or lower income depending
on exchange rate converted into US$ at the end of the financial year. The exchange rate could fluctuate depending on changes in political
and economic environments without notice.
14.
SEGMENT REPORTING
ASC
280, “Segment Reporting” establishes standards for reporting information about operating segments on a basis consistent with
the Company’s internal organization structure as well as information about services categories, business segments and major customers
in financial statements. The Company has two reportable segments based on business unit, food and beverage business and asset leasing
business and three reportable segments based on country, United States, Marshall and Malaysia.
In
accordance with the “Segment Reporting” Topic of the ASC, the Company’s chief operating decision maker has been identified
as the Chief Executive Officer and President, who reviews operating results to make decisions about allocating resources and assessing
performance for the entire Company. Existing guidance, which is based on a management approach to segment reporting, establishes requirements
to report selected segment information quarterly and to report annually entity-wide disclosures about products and services, major customers,
and the countries in which the entity holds material assets and reports revenue. All material operating units qualify for aggregation
under “Segment Reporting” due to their similar customer base and similarities in economic characteristics; nature of products
and services; and procurement, manufacturing and distribution processes.
SCHEDULE
OF SEGMENT REPORTING INFORMATION BY BUSINESS UNIT
| | |
| | |
|
|
|
| |
| | |
| | |
For the Three Months Ended and As of June 30, 2023 | |
| By Business Unit | |
Assets Leasing Business | | |
Food & Beverage Business | | |
Total | |
| Revenue | |
$ | 7,859 | | |
$ | - | | |
$ | 7,859 | |
| | |
| | | |
| | | |
| | |
| Cost of revenue | |
| - | | |
| - | | |
| - | |
| General and administrative expenses | |
| (54,549 | ) | |
| - | | |
| (54,549 | ) |
| | |
| | | |
| | | |
| | |
| Loss from operations | |
| (46,690 | ) | |
| - | | |
| (46,690 | ) |
| | |
| | | |
| | | |
| | |
| Total assets | |
$ | 74,730 | | |
$ | - | | |
$ | 74,730 | |
| Capital expenditure | |
$ | - | | |
$ | - | | |
$ | - | |
| | |
|
|
|
|
| | | |
| | |
| | |
For the Three Months Ended and As of June 30, 2022 | |
| By Business Unit | |
Assets Leasing Business | | |
Food & Beverage Business | | |
Total | |
| Revenue | |
$ | - | | |
$ | 44,909 | | |
$ | 44,909 | |
| | |
| | | |
| | | |
| | |
| Cost of revenue | |
| - | | |
| (20,963 | ) | |
| (20,963 | ) |
| General and administrative expenses | |
| - | | |
| (167,029 | ) | |
| (167,029 | ) |
| | |
| | | |
| | | |
| | |
| Loss from operations | |
| - | | |
| (143,083 | ) | |
| (143,083 | ) |
| | |
| | | |
| | | |
| | |
| Total assets | |
$ | - | | |
$ | 604,353 | | |
$ | 604,353 | |
| Capital expenditure | |
$ | - | | |
$ | 10,209 | | |
$ | 10,209 | |
SCHEDULE
OF SEGMENT REPORTING INFORMATION BY COUNTRY
| | |
| | | |
| | | |
| | | |
| | |
| | |
For the Three Months Ended and As of June 30, 2023 | |
| By Country | |
United States | | |
Marshall | | |
Malaysia | | |
Total | |
| Revenue | |
$ | - | | |
$ | - | | |
$ | 7,859 | | |
$ | 7,859 | |
| | |
| | | |
| | | |
| | | |
| | |
| Cost of revenue | |
| - | | |
| - | | |
| - | | |
| - | |
| General and administrative expenses | |
| (43,854 | ) | |
| - | | |
| (10,695 | ) | |
| (54,549 | ) |
| | |
| | | |
| | | |
| | | |
| | |
| Loss from operations | |
| (43,854 | ) | |
| - | | |
| (2,836 | ) | |
| (46,690 | ) |
| | |
| | | |
| | | |
| | | |
| | |
| Total assets | |
$ | 8,834 | | |
$ | - | | |
$ | 65,896 | | |
$ | 74,730 | |
| Capital expenditure | |
$ | - | | |
$ | - | | |
$ | - | | |
$ | - | |
| | |
| | |
|
|
|
| |
| | | |
| | |
| | |
For the Three Months Ended and As of June 30, 2022 | |
| By Country | |
United States | | |
Marshall | | |
Malaysia | | |
Total | |
| Revenue | |
$ | - | | |
$ | - | | |
$ | 44,909 | | |
$ | 44,909 | |
| | |
| | | |
| | | |
| | | |
| | |
| Cost of revenue | |
| - | | |
| - | | |
| (20,963 | ) | |
| (20,963 | ) |
| General and administrative expenses | |
| - | | |
| - | | |
| (167,029 | ) | |
| (167,029 | ) |
| | |
| | | |
| | | |
| | | |
| | |
| Loss from operations | |
| - | | |
| - | | |
| (143,083 | ) | |
| (143,083 | ) |
| | |
| | | |
| | | |
| | | |
| | |
| Total assets | |
$ | 7,310 | | |
$ | - | | |
$ | 597,043 | | |
$ | 604,353 | |
| Capital expenditure | |
$ | - | | |
$ | - | | |
$ | 10,209 | | |
$ | 10,209 | |
15.
SUBSEQUENT EVENTS
In
accordance with ASC Topic 855, “Subsequent Events”, which establishes general standards of accounting for and disclosure
of events that occur after the balance sheet date but before financial statements are issued, the Company has evaluated all events or
transactions that occurred after June 30, 2023 up through the date the Company presented these audited financial statements.
ITEM
2. MANAGEMENT’S DISCUSSION AND ANALYSIS OF FINANCIAL CONDITION AND RESULTS OF OPERATIONS
The
information contained in this quarter report on Form 10-Q is intended to update the information contained in our Form 10-K dated June
28, 2023, for the year ended March 31, 2023 and presumes that readers have access to, and will have read, the “Management’s
Discussion and Analysis of Financial Condition and Results of Operations” and other information contained in such Form 10-K. The
following discussion and analysis also should be read together with our financial statements and the notes to the financial statements
included elsewhere in this Form 10-Q.
Certain
statements in this Report constitute forward-looking statements. These forward-looking statements include statements, which involve risks
and uncertainties, regarding, among other things, (a) our projected sales, profitability, and cash flows, (b) our growth strategy, (c)
anticipated trends in our industry, (d) our future financing plans, and café our anticipated needs for, and use of, working capital.
They are generally identifiable by use of the words “may,” “will,” “should,” “anticipate,”
“estimate,” “plan,” “potential,” “project,” “continuing,” “ongoing,”
“expects,” “management believes,” “we believe,” “we intend,” or the negative of these
words or other variations on these words or comparable terminology. In light of these risks and uncertainties, there can be no assurance
that the forward-looking statements contained in this filing will in fact occur. You should not place undue reliance on these forward-looking
statements.
The
forward-looking statements speak only as of the date on which they are made, and, except to the extent required by federal securities
laws, we undertake no obligation to update any forward-looking statements to reflect events or circumstances after the date on which
the statements are made or to reflect the occurrence of unanticipated events.
Overview
We
share the same business plan as that of our subsidiaries. We are engaged in the production and sale of food products, specifically dessert
created and sold through various restaurants that we operate in Malaysia. We sell our goods under our brand name “Sweet Hut.”
We have two dessert restaurant chains and one central kitchen.
On
October 31, 2022, the Company terminated all the tenancy agreements before the due date of the agreements.
On
November 30, 2022, the Company has entered into a lease agreement with a third party, Sweet Bakery & Dessecaféafe Sdn Bhd
to lease their assets to the third party. The leasing period is commencing from January 1, 2023 to December 31, 2023. The Company did
not cease its business operation nor sell the operating assets. The Company is looking for a new strategic location to continue their
business while leasing out their assets to the third party.
Results
of Operations
For
the three months ended June 30, 2023 and 2022, the Company has generated a revenue of $7,859 and $44,909. The breakdown of revenue is
as following:
| | |
Three months ended June 30 | |
| | |
2023 | | |
2022 | |
| Lease Revenue | |
$ | 7,859 | | |
$ | - | |
| Percentage towards Total Revenue | |
| 100.00 | % | |
| 0 | % |
| | |
| | | |
| | |
| Dine-In and Take Away Revenue | |
$ | - | | |
$ | 26,495 | |
| Percentage towards Total Revenue | |
| 0 | % | |
| 59.00 | % |
| | |
| | | |
| | |
| Delivery Revenue | |
$ | - | | |
$ | 18,414 | |
| Percentage towards Total Revenue | |
| 0 | % | |
| 41.00 | % |
| | |
| | | |
| | |
| Total Revenue | |
$ | 7,859 | | |
$ | 44,909 | |
| | |
| | | |
| | |
| Total Cost of Sales | |
$ | - | | |
$ | 20,963 | |
| | |
| | | |
| | |
| Total Gross Profit | |
$ | 7,859 | | |
$ | 23,946 | |
| Gross Profit Margin | |
| 100.00 | % | |
| 53.32 | % |
Revenue
for the Three Months ended June 30, 2023 and 2022
For
the three months ended June 30, 2023, the Company earned a lease revenue of $7,859 due to the Company has entered into a lease agreement
with a third party, Sweet Bakery & Dessert Café Sdn Bhd to lease their assets to the third party.
Dine-in
and take away revenue declined from $26,495 for the three months ended June 30, 2022 to $0 for the three months ended June 30, 2023.
The decline in dine-in revenue primarily due to the termination of all the tenancy agreements on October 31, 2022. Therefore, the Company
do not generate any dine-in revenue from March 2023 to June 2023.
Delivery
revenue declined from $18,414 for the three months ended June 30, 2022 to $0 for the three months ended June 30, 2023. The decline in
delivery revenue primarily due to the termination of all the tenancy agreements on October 31, 2022. Therefore, the Company do not generate
any dine-in revenue from March 2023 to June 2023.
Total
revenue declined from $44,909 for the three months ended June 30, 2022 to $7,859 for the three months ended June 30, 2023, primarily
due to the termination of all the tenancy agreements on October 31, 2022. Therefore, the Company do not generate any dine-in revenue
from March 2023 to June 2023.
General
and Administrative Expenses
For
the three months ended June 30, 2023 and 2022, the Company has incurred a general and administrative expenses of $54,549 and $167,029
respectively. Of which primarily consist of salary, lease expenses, utilities, depreciation, professional fees and repair and maintenance
and advertisement and promotions.
| | |
Three months ended
June 30 | |
| Primary expenses | |
2023 | | |
2022 | |
| Salary and salary related expenses | |
$ | - | | |
$ | 68,913 | |
| Percentage towards General and Administrative Expenses | |
| 0 | % | |
| 41.26 | % |
| | |
| | | |
| | |
| Lease expenses | |
$ | - | | |
$ | 19,382 | |
| Percentage towards General and Administrative Expenses | |
| 0 | % | |
| 11.60 | % |
| | |
| | | |
| | |
| Utility expenses | |
$ | - | | |
$ | 8,955 | |
| Percentage towards General and Administrative Expenses | |
| 0 | % | |
| 5.36 | % |
| | |
| | | |
| | |
| Depreciation and amortization expenses | |
$ | 2,027 | | |
$ | 16,194 | |
| Percentage towards General and Administrative Expenses | |
| 3.71 | % | |
| 9.70 | % |
| | |
| | | |
| | |
| Professional expenses | |
$ | 11,646 | | |
$ | 13,325 | |
| Percentage towards General and Administrative Expenses | |
| 21.35 | % | |
| 7.98 | % |
| | |
| | | |
| | |
| Repair and maintenance expenses | |
$ | 70 | | |
$ | 3,138 | |
| Percentage towards General and Administrative Expenses | |
| 0.13 | % | |
| 1.88 | % |
| | |
| | | |
| | |
| Compliance expenses | |
$ | 240 | | |
$ | 410 | |
| Percentage towards general and administrative expenses | |
| 0.44 | % | |
| 0.24 | % |
| | |
| | | |
| | |
| Advertisement and promotion expenses | |
$ | - | | |
$ | 2,967 | |
| Percentage towards General and Administrative Expenses | |
| 0 | % | |
| 1.78 | % |
| | |
| | | |
| | |
| Total primary expenses | |
$ | 13,983 | | |
$ | 133,284 | |
| Percentage towards General and Administrative Expenses | |
| 25.63 | % | |
| 79.80 | % |
| | |
| | | |
| | |
| Miscellaneous expenses | |
$ | 40,566 | | |
| 33,745 | |
| Percentage towards General and Administrative Expenses | |
| 74.37 | % | |
| 20.20 | % |
Net
Loss
For
the three months ended June 30, 2023 and 2022, the Company has incurred a net loss of $46,813 and $143,597 respectively.
Liquidity
and Capital Resources
Cash
Used In Operating Activities
For
the three months ended June 30, 2023, the Company has used $48,309 in operating activities primarily caused by net loss from
operating and decrease in accrued liabilities and other payables contra by depreciation expenses and
decrease in prepaid expenses and deposit.
For
the three months ended June 30, 2022, the Company has used $146,897 in operating activities primarily caused by net loss from operating,
decrease in accrued liability and lease liability contra by depreciation expenses add back.
Cash
Used In Investing Activities
The
Company has invested $0 in investing activity for the three months ended June 30, 2023.
The
Company has invested $10,209 in investing activity for the acquisition of new kitchen equipment and office equipment for the three months
ended June 30, 2022.
Cash
Provided by Financing Activities
For
the three months ended June 30, 2023, the Company repaid $4,134 to bank loan and received $15,050 from financing cash flow primarily
consist of advances from director.
For
the three months ended June 30, 2022, the Company repaid $3,938 to bank loan and received $126,075 from financing cash flow primarily
consist of advances from director.
Off-balance
Sheet Arrangements
We
have no significant off-balance sheet arrangements that have or are reasonably likely to have a current or future effect on our financial
condition, changes in our financial condition, revenues or expenses, results of operations, liquidity, capital expenditures or capital
resources that are material to our stockholders as of June 30, 2023 and June 30, 2022.
Contractual
Obligations
As
of June 30, 2023, the Company has no contractual obligations involved.
ITEM
3 QUANTITATIVE AND QUALITATIVE DISCLOSURES ABOUT MARKET RISK
As
a “smaller reporting company” as defined by Item 10 of Regulation S-K, the Company is not required to provide information
required by this Item.
ITEM
4 CONTROLS AND PROCEDURES
Evaluation
of Disclosure Controls and Procedures:
We
carried out an evaluation of the effectiveness of the design and operation of our disclosure controls and procedures (as defined in Exchange
Act Rules 13a-15(e) and 15d-15(e)) as of June 30, 2023. This evaluation was carried out under the supervision and with the participation
of our Chief Executive Officer and our Chief Financial Officer. Based upon that evaluation, our Chief Executive Officer and Chief Financial
Officer concluded that, as of June 30, 2023, our disclosure controls and procedures were not effective due to the presence of material
weaknesses in internal control over financial reporting.
A
material weakness is a deficiency, or a combination of deficiencies, in internal control over financial reporting, such that there is
a reasonable possibility that a material misstatement of the company’s annual or interim financial statements will not be prevented
or detected on a timely basis. Management has identified the following material weaknesses which have caused management to conclude that,
as of June 30, 2023, our disclosure controls and procedures were not effective: (1) lack of a functioning audit committee due to a lack
of a majority of independent members and a lack of a majority of outside directors on our board of directors, resulting in ineffective
oversight in the establishment and monitoring of required internal controls and procedures; (2) inadequate segregation of duties and
effective risk assessment; (3) insufficient written policies and procedures for accounting and financial reporting with respect to the
requirements and application of both US GAAP and SEC guidelines; and (4) lack of internal audit function due to the fact that the Company
lacks qualified resources to perform the internal audit functions properly and that the scope and effectiveness of the internal audit
function are yet to be developed.
Changes
in Internal Control Over Financial Reporting:
There
were no changes in our internal control over financial reporting during the quarter ended June 30, 2023, that have materially affected,
or are reasonably likely to materially affect, our internal control over financial reporting.
PART
II — OTHER INFORMATION
Item
1. Legal Proceedings
From
time to time, we may become party to litigation or other legal proceedings that we consider to be a part of the ordinary course of our
business. We are not currently involved in legal proceedings that could reasonably be expected to have a material adverse effect on our
business, prospects, financial condition or results of operations. We may become involved in material legal proceedings in the future.
Item
1A. Risk Factors
As
a “smaller reporting company” as defined by Item 10 of Regulation S-K, the Company is not required to provide information
required by this Item.
Item
2. Unregistered Sales of Equity Securities and Use of Proceeds
(a)
None.
(b)
None.
(c)
None.
Item
3. Defaults Upon Senior Securities
(a)
None.
(b)
None.
Item
4. Mine Safety Disclosures
Not
applicable.
Item
5. Other Information.
None.
Item
6. Exhibits
SIGNATURES
Pursuant
to the requirements of the Securities Exchange Act of 1934, the registrant has duly caused this report to be signed on its behalf by
the undersigned, thereunto duly authorized.
| |
SYNERGY EMPIRE LIMITED |
| |
(Name of Registrant) |
| |
|
| Date: August 14, 2023 |
|
| |
|
| |
By: |
/s/
Law Jia Ming |
| |
Name: |
Law Jia Ming |
| |
Title: |
Chief Executive Officer, Chief Financial Officer |
EXHIBIT
31.1
CERTIFICATION
I,
Law Jia Ming, certify that:
1.
I have reviewed this quarterly report on Form 10-Q of SYNERGY EMPIRE LIMITED (the “Company”) for the quarter ended June 30,
2023;
2.
Based on my knowledge, this quarterly report does not contain any untrue statement of a material fact or omit to state a material fact
necessary to make the statements made, in light of the circumstances under which such statements were made, not misleading with respect
to the period covered by this report;
3.
Based on my knowledge, the financial statements, and other financial information included in this report, fairly present in all material
respects the financial condition, results of operations and cash flows of the registrant as of, and for, the periods presented in this
report;
4.
The registrant’s other certifying officer and I are responsible for establishing and maintaining disclosure controls and procedures
(as defined in Exchange Act Rules 13a-15(e) and 15d-15(e)) and internal control over financial reporting (as defined in Exchange Act
Rules 13a-15(f) and 15d-15(f)) for the registrant and have:
| |
a. |
Designed such
disclosure controls and procedures, or caused such disclosure controls and procedures to be designed under our supervision, to ensure
that material information relating to the registrant, including its consolidated subsidiaries, is made known to us by others within
those entities, particularly during the period in which this report is being prepared; |
| |
|
|
| |
b. |
Designed such internal
control over financial reporting, or caused such internal control to be designed under our supervision, to provide reasonable assurance
regarding the reliability of financial reporting and the preparation of financial statements for external purposes in accordance
with generally accepted accounting principles. |
| |
|
|
| |
c. |
Evaluated the effectiveness
of the registrant’s disclosure controls and procedures and presented in this report our conclusions about the effectiveness
of the disclosure controls and procedures, as of the end of the period covered by this report based on such evaluation; and |
| |
|
|
| |
d. |
Disclosed in this report
any change in the registrant’s internal control over financial reporting that occurred during the registrant’s most recent
fiscal quarter (the registrant’s fourth fiscal quarter in the case of an annual report) that has materially affected, or is
reasonably likely to materially affect, the registrant’s internal control over financial reporting; and |
5.
The registrant’s other certifying officer and I have disclosed, based on our most recent evaluation of internal control over financial
reporting, to the registrant’s auditors and the audit committee of the registrant’s board of directors (or persons performing
the equivalent functions):
| |
a. |
All significant
deficiencies and material weaknesses in the design or operation of internal control over financial reporting which are reasonably
likely to adversely affect the registrant’s ability to record, process, summarize and report financial information; and |
| |
|
|
| |
b. |
Any fraud, whether or not
material, that involves management or other employees who have a significant role in the registrant’s internal control over
financial reporting. |
| Date: August
14, 2023 |
By: |
/s/
Law Jia Ming |
| |
|
Law Jia Ming |
| |
|
Chief Executive Officer, Chief Financial Officer |
EXHIBIT 32.1
CERTIFICATION PURSUANT TO 18 U.S.C. SECTION 1350,
AS ADOPTED PURSUANT TO
SECTION 906 OF THE SARBANES-OXLEY ACT OF 2002
In connection with the Quarterly Report of SYNERGY
EMPIRE LIMITED (the “Company”) on Form 10-Q for the period ended June 30, 2023 as filed with the Securities and Exchange Commission
on the date hereof (the “Report”), The undersigned hereby certifies, pursuant to 18 U.S.C. § 1350, as adopted pursuant
to § 906 of the Sarbanes-Oxley Act of 2002, that, to the best of my knowledge and belief:
| |
(1) |
The Report fully complies with the requirements of section 13(a) or 15(d) of the Securities Exchange Act of 1934; and |
| |
|
|
| |
(2) |
The information contained in the Report fairly presents, in all material respects, the financial condition and result of operations of the Company. |
| Date: August 14, 2023 |
By: |
/s/ Law Jia Ming |
| |
|
Law Jia Ming |
| |
|
Chief Executive Officer, Chief Financial Officer |
A signed original of this written statement required
by Section 906, or other document authenticating, acknowledging, or otherwise adopting the signature that appears in typed form within
the electronic version of this written statement has been provided to the Company and will be retained by the Company and furnished to
the Securities and Exchange Commission or its staff upon request.
v3.23.2
Cover - shares
|
3 Months Ended |
|
Jun. 30, 2023 |
Aug. 14, 2023 |
| Cover [Abstract] |
|
|
| Document Type |
10-Q
|
|
| Amendment Flag |
false
|
|
| Document Quarterly Report |
true
|
|
| Document Transition Report |
false
|
|
| Document Period End Date |
Jun. 30, 2023
|
|
| Document Fiscal Period Focus |
Q1
|
|
| Document Fiscal Year Focus |
2024
|
|
| Current Fiscal Year End Date |
--03-31
|
|
| Entity File Number |
333-235700
|
|
| Entity Registrant Name |
SYNERGY
EMPIRE LIMITED
|
|
| Entity Central Index Key |
0001766267
|
|
| Entity Tax Identification Number |
38-4096727
|
|
| Entity Incorporation, State or Country Code |
NV
|
|
| Entity Address, Address Line One |
No.19
Jalan 12/118B
|
|
| Entity Address, Address Line Two |
Desa Tun Razak
|
|
| Entity Address, City or Town |
Kuala Lumpur
|
|
| Entity Address, Country |
MY
|
|
| Entity Address, Postal Zip Code |
56100
|
|
| City Area Code |
+(60)
|
|
| Local Phone Number |
3
- 9171 2828
|
|
| Entity Current Reporting Status |
Yes
|
|
| Entity Interactive Data Current |
Yes
|
|
| Entity Filer Category |
Non-accelerated Filer
|
|
| Entity Small Business |
true
|
|
| Entity Emerging Growth Company |
true
|
|
| Elected Not To Use the Extended Transition Period |
false
|
|
| Entity Shell Company |
false
|
|
| Entity Common Stock, Shares Outstanding |
|
1,000,000
|
| X |
- DefinitionBoolean flag that is true when the XBRL content amends previously-filed or accepted submission.
| Name: |
dei_AmendmentFlag |
| Namespace Prefix: |
dei_ |
| Data Type: |
xbrli:booleanItemType |
| Balance Type: |
na |
| Period Type: |
duration |
|
| X |
- DefinitionEnd date of current fiscal year in the format --MM-DD.
| Name: |
dei_CurrentFiscalYearEndDate |
| Namespace Prefix: |
dei_ |
| Data Type: |
xbrli:gMonthDayItemType |
| Balance Type: |
na |
| Period Type: |
duration |
|
| X |
- DefinitionFiscal period values are FY, Q1, Q2, and Q3. 1st, 2nd and 3rd quarter 10-Q or 10-QT statements have value Q1, Q2, and Q3 respectively, with 10-K, 10-KT or other fiscal year statements having FY.
| Name: |
dei_DocumentFiscalPeriodFocus |
| Namespace Prefix: |
dei_ |
| Data Type: |
dei:fiscalPeriodItemType |
| Balance Type: |
na |
| Period Type: |
duration |
|
| X |
- DefinitionThis is focus fiscal year of the document report in YYYY format. For a 2006 annual report, which may also provide financial information from prior periods, fiscal 2006 should be given as the fiscal year focus. Example: 2006.
| Name: |
dei_DocumentFiscalYearFocus |
| Namespace Prefix: |
dei_ |
| Data Type: |
xbrli:gYearItemType |
| Balance Type: |
na |
| Period Type: |
duration |
|
| X |
- DefinitionFor the EDGAR submission types of Form 8-K: the date of the report, the date of the earliest event reported; for the EDGAR submission types of Form N-1A: the filing date; for all other submission types: the end of the reporting or transition period. The format of the date is YYYY-MM-DD.
| Name: |
dei_DocumentPeriodEndDate |
| Namespace Prefix: |
dei_ |
| Data Type: |
xbrli:dateItemType |
| Balance Type: |
na |
| Period Type: |
duration |
|
| X |
- DefinitionBoolean flag that is true only for a form used as an quarterly report. Reference 1: http://www.xbrl.org/2003/role/presentationRef
-Publisher SEC
-Name Form 10-Q
-Number 240
-Section 308
-Subsection a
| Name: |
dei_DocumentQuarterlyReport |
| Namespace Prefix: |
dei_ |
| Data Type: |
xbrli:booleanItemType |
| Balance Type: |
na |
| Period Type: |
duration |
|
| X |
- DefinitionBoolean flag that is true only for a form used as a transition report. Reference 1: http://www.xbrl.org/2003/role/presentationRef
-Publisher SEC
-Name Forms 10-K, 10-Q, 20-F
-Number 240
-Section 13
-Subsection a-1
| Name: |
dei_DocumentTransitionReport |
| Namespace Prefix: |
dei_ |
| Data Type: |
xbrli:booleanItemType |
| Balance Type: |
na |
| Period Type: |
duration |
|
| X |
- DefinitionThe type of document being provided (such as 10-K, 10-Q, 485BPOS, etc). The document type is limited to the same value as the supporting SEC submission type, or the word 'Other'.
| Name: |
dei_DocumentType |
| Namespace Prefix: |
dei_ |
| Data Type: |
dei:submissionTypeItemType |
| Balance Type: |
na |
| Period Type: |
duration |
|
| X |
- DefinitionAddress Line 1 such as Attn, Building Name, Street Name
| Name: |
dei_EntityAddressAddressLine1 |
| Namespace Prefix: |
dei_ |
| Data Type: |
xbrli:normalizedStringItemType |
| Balance Type: |
na |
| Period Type: |
duration |
|
| X |
- DefinitionAddress Line 2 such as Street or Suite number
| Name: |
dei_EntityAddressAddressLine2 |
| Namespace Prefix: |
dei_ |
| Data Type: |
xbrli:normalizedStringItemType |
| Balance Type: |
na |
| Period Type: |
duration |
|
| X |
- Definition
+ References
+ Details
| Name: |
dei_EntityAddressCityOrTown |
| Namespace Prefix: |
dei_ |
| Data Type: |
xbrli:normalizedStringItemType |
| Balance Type: |
na |
| Period Type: |
duration |
|
| X |
- DefinitionISO 3166-1 alpha-2 country code.
| Name: |
dei_EntityAddressCountry |
| Namespace Prefix: |
dei_ |
| Data Type: |
dei:countryCodeItemType |
| Balance Type: |
na |
| Period Type: |
duration |
|
| X |
- DefinitionCode for the postal or zip code
| Name: |
dei_EntityAddressPostalZipCode |
| Namespace Prefix: |
dei_ |
| Data Type: |
xbrli:normalizedStringItemType |
| Balance Type: |
na |
| Period Type: |
duration |
|
| X |
- DefinitionA unique 10-digit SEC-issued value to identify entities that have filed disclosures with the SEC. It is commonly abbreviated as CIK. Reference 1: http://www.xbrl.org/2003/role/presentationRef
-Publisher SEC
-Name Exchange Act
-Number 240
-Section 12
-Subsection b-2
| Name: |
dei_EntityCentralIndexKey |
| Namespace Prefix: |
dei_ |
| Data Type: |
dei:centralIndexKeyItemType |
| Balance Type: |
na |
| Period Type: |
duration |
|
| X |
- DefinitionIndicate number of shares or other units outstanding of each of registrant's classes of capital or common stock or other ownership interests, if and as stated on cover of related periodic report. Where multiple classes or units exist define each class/interest by adding class of stock items such as Common Class A [Member], Common Class B [Member] or Partnership Interest [Member] onto the Instrument [Domain] of the Entity Listings, Instrument.
| Name: |
dei_EntityCommonStockSharesOutstanding |
| Namespace Prefix: |
dei_ |
| Data Type: |
xbrli:sharesItemType |
| Balance Type: |
na |
| Period Type: |
instant |
|
| X |
- DefinitionIndicate 'Yes' or 'No' whether registrants (1) have filed all reports required to be filed by Section 13 or 15(d) of the Securities Exchange Act of 1934 during the preceding 12 months (or for such shorter period that registrants were required to file such reports), and (2) have been subject to such filing requirements for the past 90 days. This information should be based on the registrant's current or most recent filing containing the related disclosure.
| Name: |
dei_EntityCurrentReportingStatus |
| Namespace Prefix: |
dei_ |
| Data Type: |
dei:yesNoItemType |
| Balance Type: |
na |
| Period Type: |
duration |
|
| X |
- DefinitionIndicate if registrant meets the emerging growth company criteria. Reference 1: http://www.xbrl.org/2003/role/presentationRef
-Publisher SEC
-Name Exchange Act
-Number 240
-Section 12
-Subsection b-2
| Name: |
dei_EntityEmergingGrowthCompany |
| Namespace Prefix: |
dei_ |
| Data Type: |
xbrli:booleanItemType |
| Balance Type: |
na |
| Period Type: |
duration |
|
| X |
- DefinitionCommission file number. The field allows up to 17 characters. The prefix may contain 1-3 digits, the sequence number may contain 1-8 digits, the optional suffix may contain 1-4 characters, and the fields are separated with a hyphen.
| Name: |
dei_EntityFileNumber |
| Namespace Prefix: |
dei_ |
| Data Type: |
dei:fileNumberItemType |
| Balance Type: |
na |
| Period Type: |
duration |
|
| X |
- DefinitionIndicate whether the registrant is one of the following: Large Accelerated Filer, Accelerated Filer, Non-accelerated Filer. Definitions of these categories are stated in Rule 12b-2 of the Exchange Act. This information should be based on the registrant's current or most recent filing containing the related disclosure. Reference 1: http://www.xbrl.org/2003/role/presentationRef
-Publisher SEC
-Name Exchange Act
-Number 240
-Section 12
-Subsection b-2
| Name: |
dei_EntityFilerCategory |
| Namespace Prefix: |
dei_ |
| Data Type: |
dei:filerCategoryItemType |
| Balance Type: |
na |
| Period Type: |
duration |
|
| X |
- DefinitionTwo-character EDGAR code representing the state or country of incorporation.
| Name: |
dei_EntityIncorporationStateCountryCode |
| Namespace Prefix: |
dei_ |
| Data Type: |
dei:edgarStateCountryItemType |
| Balance Type: |
na |
| Period Type: |
duration |
|
| X |
- DefinitionBoolean flag that is true when the registrant has submitted electronically every Interactive Data File required to be submitted pursuant to Rule 405 of Regulation S-T during the preceding 12 months (or for such shorter period that the registrant was required to submit such files). Reference 1: http://www.xbrl.org/2003/role/presentationRef
-Publisher SEC
-Name Regulation S-T
-Number 232
-Section 405
| Name: |
dei_EntityInteractiveDataCurrent |
| Namespace Prefix: |
dei_ |
| Data Type: |
dei:yesNoItemType |
| Balance Type: |
na |
| Period Type: |
duration |
|
| X |
- DefinitionThe exact name of the entity filing the report as specified in its charter, which is required by forms filed with the SEC. Reference 1: http://www.xbrl.org/2003/role/presentationRef
-Publisher SEC
-Name Exchange Act
-Number 240
-Section 12
-Subsection b-2
| Name: |
dei_EntityRegistrantName |
| Namespace Prefix: |
dei_ |
| Data Type: |
xbrli:normalizedStringItemType |
| Balance Type: |
na |
| Period Type: |
duration |
|
| X |
- DefinitionBoolean flag that is true when the registrant is a shell company as defined in Rule 12b-2 of the Exchange Act. Reference 1: http://www.xbrl.org/2003/role/presentationRef
-Publisher SEC
-Name Exchange Act
-Number 240
-Section 12
-Subsection b-2
| Name: |
dei_EntityShellCompany |
| Namespace Prefix: |
dei_ |
| Data Type: |
xbrli:booleanItemType |
| Balance Type: |
na |
| Period Type: |
duration |
|
| X |
- DefinitionIndicates that the company is a Smaller Reporting Company (SRC). Reference 1: http://www.xbrl.org/2003/role/presentationRef
-Publisher SEC
-Name Exchange Act
-Number 240
-Section 12
-Subsection b-2
| Name: |
dei_EntitySmallBusiness |
| Namespace Prefix: |
dei_ |
| Data Type: |
xbrli:booleanItemType |
| Balance Type: |
na |
| Period Type: |
duration |
|
| X |
- DefinitionThe Tax Identification Number (TIN), also known as an Employer Identification Number (EIN), is a unique 9-digit value assigned by the IRS. Reference 1: http://www.xbrl.org/2003/role/presentationRef
-Publisher SEC
-Name Exchange Act
-Number 240
-Section 12
-Subsection b-2
| Name: |
dei_EntityTaxIdentificationNumber |
| Namespace Prefix: |
dei_ |
| Data Type: |
dei:employerIdItemType |
| Balance Type: |
na |
| Period Type: |
duration |
|
| X |
- DefinitionLocal phone number for entity.
| Name: |
dei_LocalPhoneNumber |
| Namespace Prefix: |
dei_ |
| Data Type: |
xbrli:normalizedStringItemType |
| Balance Type: |
na |
| Period Type: |
duration |
|
v3.23.2
Condensed Consolidated Balance Sheets - USD ($)
|
Jun. 30, 2023 |
Mar. 31, 2023 |
| CURRENT ASSETS |
|
|
| Cash and cash equivalents |
$ 3,680
|
$ 9,868
|
| Accounts receivable, net |
|
|
| Prepaid expenses and deposits |
9,193
|
15,681
|
| TOTAL CURRENT ASSETS |
12,873
|
25,549
|
| NON-CURRENT ASSETS |
|
|
| Plant and equipment, net |
60,756
|
66,184
|
| Intangible asset, net |
1,101
|
1,199
|
| TOTAL ASSETS |
74,730
|
92,932
|
| CURRENT LIABILITIES |
|
|
| Accounts payable |
5,617
|
5,928
|
| Accrued expenses and other payables |
58,507
|
70,885
|
| Bank borrowing |
3,480
|
7,954
|
| TOTAL CURRENT LIABILITIES |
1,358,513
|
1,410,075
|
| TOTAL LIABILITIES |
1,358,513
|
1,410,075
|
| STOCKHOLDERS’ EQUITY |
|
|
| Preferred stock – Par value $0.0001; Authorized: 500,000 None issued and outstanding |
|
|
| Common stock – Par value $0.0001; Authorized: 5,000,000 Issued and outstanding: 1,000,000 shares as of June 30 and March 31, 2023 |
100
|
100
|
| Additional paid-in capital |
784,083
|
784,083
|
| Accumulated other comprehensive income/(loss) |
113,054
|
32,881
|
| Accumulated deficit |
(2,181,020)
|
(2,134,207)
|
| TOTAL STOCKHOLDERS’ DEFICIT |
(1,283,783)
|
(1,317,143)
|
| TOTAL LIABILITIES AND STOCKHOLDERS’ EQUITY |
74,730
|
92,932
|
| Related Party [Member] |
|
|
| CURRENT LIABILITIES |
|
|
| Amount due to a director |
$ 1,290,909
|
$ 1,325,308
|
| X |
- DefinitionAmount of liabilities incurred to vendors for goods and services received, and accrued liabilities classified as other, payable within one year or the normal operating cycle, if longer.
| Name: |
us-gaap_AccountsPayableAndOtherAccruedLiabilitiesCurrent |
| Namespace Prefix: |
us-gaap_ |
| Data Type: |
xbrli:monetaryItemType |
| Balance Type: |
credit |
| Period Type: |
instant |
|
| X |
- DefinitionCarrying value as of the balance sheet date of liabilities incurred (and for which invoices have typically been received) and payable to vendors for goods and services received that are used in an entity's business. Used to reflect the current portion of the liabilities (due within one year or within the normal operating cycle if longer). Reference 1: http://www.xbrl.org/2003/role/exampleRef
-Topic 852
-SubTopic 10
-Name Accounting Standards Codification
-Section 55
-Paragraph 10
-Publisher FASB
-URI https://asc.fasb.org//1943274/2147481372/852-10-55-10
Reference 2: http://fasb.org/us-gaap/role/ref/legacyRef
-Name Accounting Standards Codification
-Topic 210
-SubTopic 10
-Section S99
-Paragraph 1
-Subparagraph (SX 210.5-02.19(a))
-Publisher FASB
-URI https://asc.fasb.org//1943274/2147480566/210-10-S99-1
| Name: |
us-gaap_AccountsPayableCurrent |
| Namespace Prefix: |
us-gaap_ |
| Data Type: |
xbrli:monetaryItemType |
| Balance Type: |
credit |
| Period Type: |
instant |
|
| X |
- DefinitionAmount, after allowance for credit loss, of right to consideration from customer for product sold and service rendered in normal course of business, classified as current. Reference 1: http://www.xbrl.org/2003/role/disclosureRef
-Topic 310
-SubTopic 10
-Name Accounting Standards Codification
-Section 45
-Paragraph 2
-Publisher FASB
-URI https://asc.fasb.org//1943274/2147481990/310-10-45-2
Reference 2: http://www.xbrl.org/2003/role/disclosureRef
-Topic 310
-SubTopic 10
-Name Accounting Standards Codification
-Section 45
-Paragraph 9
-Publisher FASB
-URI https://asc.fasb.org//1943274/2147481990/310-10-45-9
| Name: |
us-gaap_AccountsReceivableNetCurrent |
| Namespace Prefix: |
us-gaap_ |
| Data Type: |
xbrli:monetaryItemType |
| Balance Type: |
debit |
| Period Type: |
instant |
|
| X |
- DefinitionAmount, after tax, of accumulated increase (decrease) in equity from transaction and other event and circumstance from nonowner source. Reference 1: http://fasb.org/us-gaap/role/ref/legacyRef
-Name Accounting Standards Codification
-Topic 220
-SubTopic 10
-Section 45
-Paragraph 14A
-Publisher FASB
-URI https://asc.fasb.org//1943274/2147482790/220-10-45-14A
Reference 2: http://fasb.org/us-gaap/role/ref/legacyRef
-Topic 220
-SubTopic 10
-Name Accounting Standards Codification
-Section 45
-Paragraph 11
-Publisher FASB
-URI https://asc.fasb.org//1943274/2147482790/220-10-45-11
Reference 3: http://www.xbrl.org/2003/role/disclosureRef
-Topic 944
-SubTopic 40
-Name Accounting Standards Codification
-Section 65
-Paragraph 2
-Subparagraph (g)(2)(ii)
-Publisher FASB
-URI https://asc.fasb.org//1943274/2147480016/944-40-65-2
Reference 4: http://www.xbrl.org/2003/role/disclosureRef
-Topic 944
-SubTopic 40
-Name Accounting Standards Codification
-Section 65
-Paragraph 2
-Subparagraph (h)(2)
-Publisher FASB
-URI https://asc.fasb.org//1943274/2147480016/944-40-65-2
Reference 5: http://www.xbrl.org/2003/role/disclosureRef
-Topic 210
-SubTopic 10
-Name Accounting Standards Codification
-Section S99
-Paragraph 1
-Subparagraph (SX 210.5-02(30)(a)(4))
-Publisher FASB
-URI https://asc.fasb.org//1943274/2147480566/210-10-S99-1
Reference 6: http://www.xbrl.org/2003/role/disclosureRef
-Topic 944
-SubTopic 210
-Name Accounting Standards Codification
-Section S99
-Paragraph 1
-Subparagraph (SX 210.7-03(a)(23)(a)(3))
-Publisher FASB
-URI https://asc.fasb.org//1943274/2147479440/944-210-S99-1
Reference 7: http://fasb.org/us-gaap/role/ref/legacyRef
-Name Accounting Standards Codification
-Topic 220
-SubTopic 10
-Section 45
-Paragraph 14
-Publisher FASB
-URI https://asc.fasb.org//1943274/2147482790/220-10-45-14
| Name: |
us-gaap_AccumulatedOtherComprehensiveIncomeLossNetOfTax |
| Namespace Prefix: |
us-gaap_ |
| Data Type: |
xbrli:monetaryItemType |
| Balance Type: |
credit |
| Period Type: |
instant |
|
| X |
- DefinitionAmount of excess of issue price over par or stated value of stock and from other transaction involving stock or stockholder. Includes, but is not limited to, additional paid-in capital (APIC) for common and preferred stock. Reference 1: http://www.xbrl.org/2003/role/exampleRef
-Topic 852
-SubTopic 10
-Name Accounting Standards Codification
-Section 55
-Paragraph 10
-Publisher FASB
-URI https://asc.fasb.org//1943274/2147481372/852-10-55-10
Reference 2: http://www.xbrl.org/2009/role/commonPracticeRef
-Topic 946
-SubTopic 210
-Name Accounting Standards Codification
-Section S99
-Paragraph 1
-Subparagraph (SX 210.6-04(18))
-Publisher FASB
-URI https://asc.fasb.org//1943274/2147479617/946-210-S99-1
Reference 3: http://fasb.org/us-gaap/role/ref/legacyRef
-Topic 210
-SubTopic 10
-Name Accounting Standards Codification
-Section S99
-Paragraph 1
-Subparagraph (SX 210.5-02(30)(a)(1))
-Publisher FASB
-URI https://asc.fasb.org//1943274/2147480566/210-10-S99-1
| Name: |
us-gaap_AdditionalPaidInCapital |
| Namespace Prefix: |
us-gaap_ |
| Data Type: |
xbrli:monetaryItemType |
| Balance Type: |
credit |
| Period Type: |
instant |
|
| X |
- DefinitionSum of the carrying amounts as of the balance sheet date of all assets that are recognized. Assets are probable future economic benefits obtained or controlled by an entity as a result of past transactions or events. Reference 1: http://www.xbrl.org/2003/role/disclosureRef
-Topic 810
-SubTopic 10
-Name Accounting Standards Codification
-Section 50
-Paragraph 3
-Subparagraph (bb)
-Publisher FASB
-URI https://asc.fasb.org//1943274/2147481203/810-10-50-3
Reference 2: http://www.xbrl.org/2003/role/disclosureRef
-Topic 810
-SubTopic 10
-Name Accounting Standards Codification
-Section 45
-Paragraph 25
-Subparagraph (a)
-Publisher FASB
-URI https://asc.fasb.org//1943274/2147481231/810-10-45-25
Reference 3: http://www.xbrl.org/2003/role/disclosureRef
-Topic 235
-SubTopic 10
-Name Accounting Standards Codification
-Section S99
-Paragraph 1
-Subparagraph (SX 210.4-08(g)(1)(ii))
-Publisher FASB
-URI https://asc.fasb.org//1943274/2147480678/235-10-S99-1
Reference 4: http://www.xbrl.org/2003/role/disclosureRef
-Topic 323
-SubTopic 10
-Name Accounting Standards Codification
-Section 50
-Paragraph 3
-Subparagraph (c)
-Publisher FASB
-URI https://asc.fasb.org//1943274/2147481687/323-10-50-3
Reference 5: http://www.xbrl.org/2003/role/disclosureRef
-Topic 825
-SubTopic 10
-Name Accounting Standards Codification
-Section 50
-Paragraph 28
-Subparagraph (f)
-Publisher FASB
-URI https://asc.fasb.org//1943274/2147482907/825-10-50-28
Reference 6: http://www.xbrl.org/2003/role/exampleRef
-Topic 852
-SubTopic 10
-Name Accounting Standards Codification
-Section 55
-Paragraph 10
-Publisher FASB
-URI https://asc.fasb.org//1943274/2147481372/852-10-55-10
Reference 7: http://www.xbrl.org/2003/role/exampleRef
-Topic 946
-SubTopic 830
-Name Accounting Standards Codification
-Section 55
-Paragraph 12
-Publisher FASB
-URI https://asc.fasb.org//1943274/2147480167/946-830-55-12
Reference 8: http://www.xbrl.org/2003/role/disclosureRef
-Topic 944
-SubTopic 210
-Name Accounting Standards Codification
-Section S99
-Paragraph 1
-Subparagraph (SX 210.7-03(a)(12))
-Publisher FASB
-URI https://asc.fasb.org//1943274/2147479440/944-210-S99-1
Reference 9: http://www.xbrl.org/2003/role/disclosureRef
-Topic 280
-SubTopic 10
-Name Accounting Standards Codification
-Section 50
-Paragraph 22
-Publisher FASB
-URI https://asc.fasb.org//1943274/2147482810/280-10-50-22
Reference 10: http://www.xbrl.org/2003/role/disclosureRef
-Topic 946
-SubTopic 210
-Name Accounting Standards Codification
-Section S99
-Paragraph 1
-Subparagraph (SX 210.6-04(8))
-Publisher FASB
-URI https://asc.fasb.org//1943274/2147479617/946-210-S99-1
Reference 11: http://www.xbrl.org/2003/role/disclosureRef
-Topic 210
-SubTopic 10
-Name Accounting Standards Codification
-Section S99
-Paragraph 1
-Subparagraph (SX 210.5-02(18))
-Publisher FASB
-URI https://asc.fasb.org//1943274/2147480566/210-10-S99-1
Reference 12: http://www.xbrl.org/2003/role/disclosureRef
-Topic 470
-SubTopic 10
-Name Accounting Standards Codification
-Section S99
-Paragraph 1A
-Subparagraph (SX 210.13-01(a)(4)(i))
-Publisher FASB
-URI https://asc.fasb.org//1943274/2147480097/470-10-S99-1A
Reference 13: http://www.xbrl.org/2009/role/commonPracticeRef
-Topic 470
-SubTopic 10
-Name Accounting Standards Codification
-Section S99
-Paragraph 1A
-Subparagraph (SX 210.13-01(a)(4)(ii))
-Publisher FASB
-URI https://asc.fasb.org//1943274/2147480097/470-10-S99-1A
Reference 14: http://www.xbrl.org/2009/role/commonPracticeRef
-Topic 470
-SubTopic 10
-Name Accounting Standards Codification
-Section S99
-Paragraph 1A
-Subparagraph (SX 210.13-01(a)(4)(iii))
-Publisher FASB
-URI https://asc.fasb.org//1943274/2147480097/470-10-S99-1A
Reference 15: http://www.xbrl.org/2003/role/disclosureRef
-Topic 470
-SubTopic 10
-Name Accounting Standards Codification
-Section S99
-Paragraph 1A
-Subparagraph (SX 210.13-01(a)(4)(iii)(A))
-Publisher FASB
-URI https://asc.fasb.org//1943274/2147480097/470-10-S99-1A
Reference 16: http://www.xbrl.org/2003/role/disclosureRef
-Topic 470
-SubTopic 10
-Name Accounting Standards Codification
-Section S99
-Paragraph 1A
-Subparagraph (SX 210.13-01(a)(4)(iv))
-Publisher FASB
-URI https://asc.fasb.org//1943274/2147480097/470-10-S99-1A
Reference 17: http://www.xbrl.org/2003/role/disclosureRef
-Topic 470
-SubTopic 10
-Name Accounting Standards Codification
-Section S99
-Paragraph 1A
-Subparagraph (SX 210.13-01(a)(5))
-Publisher FASB
-URI https://asc.fasb.org//1943274/2147480097/470-10-S99-1A
Reference 18: http://www.xbrl.org/2003/role/disclosureRef
-Topic 470
-SubTopic 10
-Name Accounting Standards Codification
-Section S99
-Paragraph 1B
-Subparagraph (SX 210.13-02(a)(4)(i))
-Publisher FASB
-URI https://asc.fasb.org//1943274/2147480097/470-10-S99-1B
Reference 19: http://www.xbrl.org/2003/role/disclosureRef
-Topic 470
-SubTopic 10
-Name Accounting Standards Codification
-Section S99
-Paragraph 1B
-Subparagraph (SX 210.13-02(a)(4)(iii)(A))
-Publisher FASB
-URI https://asc.fasb.org//1943274/2147480097/470-10-S99-1B
Reference 20: http://www.xbrl.org/2003/role/disclosureRef
-Topic 470
-SubTopic 10
-Name Accounting Standards Codification
-Section S99
-Paragraph 1B
-Subparagraph (SX 210.13-02(a)(4)(iii)(B))
-Publisher FASB
-URI https://asc.fasb.org//1943274/2147480097/470-10-S99-1B
Reference 21: http://www.xbrl.org/2003/role/disclosureRef
-Topic 470
-SubTopic 10
-Name Accounting Standards Codification
-Section S99
-Paragraph 1B
-Subparagraph (SX 210.13-02(a)(4)(iv))
-Publisher FASB
-URI https://asc.fasb.org//1943274/2147480097/470-10-S99-1B
Reference 22: http://www.xbrl.org/2003/role/disclosureRef
-Topic 470
-SubTopic 10
-Name Accounting Standards Codification
-Section S99
-Paragraph 1B
-Subparagraph (SX 210.13-02(a)(5))
-Publisher FASB
-URI https://asc.fasb.org//1943274/2147480097/470-10-S99-1B
Reference 23: http://www.xbrl.org/2009/role/commonPracticeRef
-Topic 852
-SubTopic 10
-Name Accounting Standards Codification
-Section 50
-Paragraph 7
-Subparagraph (a)
-Publisher FASB
-URI https://asc.fasb.org//1943274/2147481404/852-10-50-7
Reference 24: http://www.xbrl.org/2003/role/disclosureRef
-Topic 280
-SubTopic 10
-Name Accounting Standards Codification
-Section 50
-Paragraph 30
-Subparagraph (c)
-Publisher FASB
-URI https://asc.fasb.org//1943274/2147482810/280-10-50-30
Reference 25: http://www.xbrl.org/2003/role/disclosureRef
-Topic 280
-SubTopic 10
-Name Accounting Standards Codification
-Section 50
-Paragraph 32
-Subparagraph (d)
-Publisher FASB
-URI https://asc.fasb.org//1943274/2147482810/280-10-50-32
Reference 26: http://fasb.org/us-gaap/role/ref/legacyRef
-Topic 942
-SubTopic 210
-Name Accounting Standards Codification
-Section S99
-Paragraph 1
-Subparagraph (SX 210.9-03(11))
-Publisher FASB
-URI https://asc.fasb.org//1943274/2147479853/942-210-S99-1
| Name: |
us-gaap_Assets |
| Namespace Prefix: |
us-gaap_ |
| Data Type: |
xbrli:monetaryItemType |
| Balance Type: |
debit |
| Period Type: |
instant |
|
| X |
- DefinitionSum of the carrying amounts as of the balance sheet date of all assets that are expected to be realized in cash, sold, or consumed within one year (or the normal operating cycle, if longer). Assets are probable future economic benefits obtained or controlled by an entity as a result of past transactions or events. Reference 1: http://www.xbrl.org/2003/role/disclosureRef
-Topic 810
-SubTopic 10
-Name Accounting Standards Codification
-Section 50
-Paragraph 3
-Subparagraph (bb)
-Publisher FASB
-URI https://asc.fasb.org//1943274/2147481203/810-10-50-3
Reference 2: http://www.xbrl.org/2003/role/disclosureRef
-Topic 810
-SubTopic 10
-Name Accounting Standards Codification
-Section 45
-Paragraph 25
-Subparagraph (a)
-Publisher FASB
-URI https://asc.fasb.org//1943274/2147481231/810-10-45-25
Reference 3: http://www.xbrl.org/2003/role/disclosureRef
-Topic 235
-SubTopic 10
-Name Accounting Standards Codification
-Section S99
-Paragraph 1
-Subparagraph (SX 210.4-08(g)(1)(ii))
-Publisher FASB
-URI https://asc.fasb.org//1943274/2147480678/235-10-S99-1
Reference 4: http://www.xbrl.org/2003/role/disclosureRef
-Topic 323
-SubTopic 10
-Name Accounting Standards Codification
-Section 50
-Paragraph 3
-Subparagraph (c)
-Publisher FASB
-URI https://asc.fasb.org//1943274/2147481687/323-10-50-3
Reference 5: http://www.xbrl.org/2003/role/disclosureRef
-Topic 825
-SubTopic 10
-Name Accounting Standards Codification
-Section 50
-Paragraph 28
-Subparagraph (f)
-Publisher FASB
-URI https://asc.fasb.org//1943274/2147482907/825-10-50-28
Reference 6: http://www.xbrl.org/2003/role/exampleRef
-Topic 852
-SubTopic 10
-Name Accounting Standards Codification
-Section 55
-Paragraph 10
-Publisher FASB
-URI https://asc.fasb.org//1943274/2147481372/852-10-55-10
Reference 7: http://www.xbrl.org/2003/role/disclosureRef
-Topic 210
-SubTopic 10
-Name Accounting Standards Codification
-Section 45
-Paragraph 1
-Publisher FASB
-URI https://asc.fasb.org//1943274/2147483467/210-10-45-1
Reference 8: http://www.xbrl.org/2003/role/disclosureRef
-Topic 210
-SubTopic 10
-Name Accounting Standards Codification
-Section S99
-Paragraph 1
-Subparagraph (SX 210.5-02(9))
-Publisher FASB
-URI https://asc.fasb.org//1943274/2147480566/210-10-S99-1
Reference 9: http://www.xbrl.org/2003/role/disclosureRef
-Topic 470
-SubTopic 10
-Name Accounting Standards Codification
-Section S99
-Paragraph 1A
-Subparagraph (SX 210.13-01(a)(4)(i))
-Publisher FASB
-URI https://asc.fasb.org//1943274/2147480097/470-10-S99-1A
Reference 10: http://www.xbrl.org/2009/role/commonPracticeRef
-Topic 470
-SubTopic 10
-Name Accounting Standards Codification
-Section S99
-Paragraph 1A
-Subparagraph (SX 210.13-01(a)(4)(ii))
-Publisher FASB
-URI https://asc.fasb.org//1943274/2147480097/470-10-S99-1A
Reference 11: http://www.xbrl.org/2009/role/commonPracticeRef
-Topic 470
-SubTopic 10
-Name Accounting Standards Codification
-Section S99
-Paragraph 1A
-Subparagraph (SX 210.13-01(a)(4)(iii))
-Publisher FASB
-URI https://asc.fasb.org//1943274/2147480097/470-10-S99-1A
Reference 12: http://www.xbrl.org/2003/role/disclosureRef
-Topic 470
-SubTopic 10
-Name Accounting Standards Codification
-Section S99
-Paragraph 1A
-Subparagraph (SX 210.13-01(a)(4)(iii)(A))
-Publisher FASB
-URI https://asc.fasb.org//1943274/2147480097/470-10-S99-1A
Reference 13: http://www.xbrl.org/2003/role/disclosureRef
-Topic 470
-SubTopic 10
-Name Accounting Standards Codification
-Section S99
-Paragraph 1A
-Subparagraph (SX 210.13-01(a)(4)(iv))
-Publisher FASB
-URI https://asc.fasb.org//1943274/2147480097/470-10-S99-1A
Reference 14: http://www.xbrl.org/2003/role/disclosureRef
-Topic 470
-SubTopic 10
-Name Accounting Standards Codification
-Section S99
-Paragraph 1A
-Subparagraph (SX 210.13-01(a)(5))
-Publisher FASB
-URI https://asc.fasb.org//1943274/2147480097/470-10-S99-1A
Reference 15: http://www.xbrl.org/2003/role/disclosureRef
-Topic 470
-SubTopic 10
-Name Accounting Standards Codification
-Section S99
-Paragraph 1B
-Subparagraph (SX 210.13-02(a)(4)(i))
-Publisher FASB
-URI https://asc.fasb.org//1943274/2147480097/470-10-S99-1B
Reference 16: http://www.xbrl.org/2003/role/disclosureRef
-Topic 470
-SubTopic 10
-Name Accounting Standards Codification
-Section S99
-Paragraph 1B
-Subparagraph (SX 210.13-02(a)(4)(iii)(A))
-Publisher FASB
-URI https://asc.fasb.org//1943274/2147480097/470-10-S99-1B
Reference 17: http://www.xbrl.org/2003/role/disclosureRef
-Topic 470
-SubTopic 10
-Name Accounting Standards Codification
-Section S99
-Paragraph 1B
-Subparagraph (SX 210.13-02(a)(4)(iii)(B))
-Publisher FASB
-URI https://asc.fasb.org//1943274/2147480097/470-10-S99-1B
Reference 18: http://www.xbrl.org/2003/role/disclosureRef
-Topic 470
-SubTopic 10
-Name Accounting Standards Codification
-Section S99
-Paragraph 1B
-Subparagraph (SX 210.13-02(a)(4)(iv))
-Publisher FASB
-URI https://asc.fasb.org//1943274/2147480097/470-10-S99-1B
Reference 19: http://www.xbrl.org/2003/role/disclosureRef
-Topic 470
-SubTopic 10
-Name Accounting Standards Codification
-Section S99
-Paragraph 1B
-Subparagraph (SX 210.13-02(a)(5))
-Publisher FASB
-URI https://asc.fasb.org//1943274/2147480097/470-10-S99-1B
Reference 20: http://www.xbrl.org/2009/role/commonPracticeRef
-Topic 852
-SubTopic 10
-Name Accounting Standards Codification
-Section 50
-Paragraph 7
-Subparagraph (a)
-Publisher FASB
-URI https://asc.fasb.org//1943274/2147481404/852-10-50-7
| Name: |
us-gaap_AssetsCurrent |
| Namespace Prefix: |
us-gaap_ |
| Data Type: |
xbrli:monetaryItemType |
| Balance Type: |
debit |
| Period Type: |
instant |
|
| X |
- References
+ Details
| Name: |
us-gaap_AssetsCurrentAbstract |
| Namespace Prefix: |
us-gaap_ |
| Data Type: |
xbrli:stringItemType |
| Balance Type: |
na |
| Period Type: |
duration |
|
| X |
- References
+ Details
| Name: |
us-gaap_AssetsNoncurrentAbstract |
| Namespace Prefix: |
us-gaap_ |
| Data Type: |
xbrli:stringItemType |
| Balance Type: |
na |
| Period Type: |
duration |
|
| X |
- DefinitionAmount of currency on hand as well as demand deposits with banks or financial institutions. Includes other kinds of accounts that have the general characteristics of demand deposits. Also includes short-term, highly liquid investments that are both readily convertible to known amounts of cash and so near their maturity that they present insignificant risk of changes in value because of changes in interest rates. Excludes cash and cash equivalents within disposal group and discontinued operation. Reference 1: http://www.xbrl.org/2003/role/disclosureRef
-Topic 210
-SubTopic 10
-Name Accounting Standards Codification
-Section S99
-Paragraph 1
-Subparagraph (SX 210.5-02(1))
-Publisher FASB
-URI https://asc.fasb.org//1943274/2147480566/210-10-S99-1
Reference 2: http://www.xbrl.org/2003/role/exampleRef
-Topic 210
-SubTopic 10
-Name Accounting Standards Codification
-Section 45
-Paragraph 1
-Subparagraph (a)
-Publisher FASB
-URI https://asc.fasb.org//1943274/2147483467/210-10-45-1
Reference 3: http://fasb.org/us-gaap/role/ref/legacyRef
-Name Accounting Standards Codification
-Topic 230
-SubTopic 10
-Section 45
-Paragraph 4
-Publisher FASB
-URI https://asc.fasb.org//1943274/2147482740/230-10-45-4
| Name: |
us-gaap_CashAndCashEquivalentsAtCarryingValue |
| Namespace Prefix: |
us-gaap_ |
| Data Type: |
xbrli:monetaryItemType |
| Balance Type: |
debit |
| Period Type: |
instant |
|
| X |
- DefinitionAggregate par or stated value of issued nonredeemable common stock (or common stock redeemable solely at the option of the issuer). This item includes treasury stock repurchased by the entity. Note: elements for number of nonredeemable common shares, par value and other disclosure concepts are in another section within stockholders' equity. Reference 1: http://www.xbrl.org/2003/role/exampleRef
-Topic 852
-SubTopic 10
-Name Accounting Standards Codification
-Section 55
-Paragraph 10
-Publisher FASB
-URI https://asc.fasb.org//1943274/2147481372/852-10-55-10
Reference 2: http://www.xbrl.org/2003/role/disclosureRef
-Topic 944
-SubTopic 210
-Name Accounting Standards Codification
-Section S99
-Paragraph 1
-Subparagraph (SX 210.7-03(a)(22))
-Publisher FASB
-URI https://asc.fasb.org//1943274/2147479440/944-210-S99-1
Reference 3: http://fasb.org/us-gaap/role/ref/legacyRef
-Topic 210
-SubTopic 10
-Name Accounting Standards Codification
-Section S99
-Paragraph 1
-Subparagraph (SX 210.5-02(29))
-Publisher FASB
-URI https://asc.fasb.org//1943274/2147480566/210-10-S99-1
| Name: |
us-gaap_CommonStockValue |
| Namespace Prefix: |
us-gaap_ |
| Data Type: |
xbrli:monetaryItemType |
| Balance Type: |
credit |
| Period Type: |
instant |
|
| X |
- DefinitionCarrying amount of finite-lived intangible assets, indefinite-lived intangible assets and goodwill. Goodwill is an asset representing the future economic benefits arising from other assets acquired in a business combination that are not individually identified and separately recognized. Intangible assets are assets, not including financial assets, lacking physical substance.
| Name: |
us-gaap_IntangibleAssetsNetIncludingGoodwill |
| Namespace Prefix: |
us-gaap_ |
| Data Type: |
xbrli:monetaryItemType |
| Balance Type: |
debit |
| Period Type: |
instant |
|
| X |
- DefinitionSum of the carrying amounts as of the balance sheet date of all liabilities that are recognized. Liabilities are probable future sacrifices of economic benefits arising from present obligations of an entity to transfer assets or provide services to other entities in the future. Reference 1: http://www.xbrl.org/2003/role/disclosureRef
-Topic 810
-SubTopic 10
-Name Accounting Standards Codification
-Section 50
-Paragraph 3
-Subparagraph (c)
-Publisher FASB
-URI https://asc.fasb.org//1943274/2147481203/810-10-50-3
Reference 2: http://www.xbrl.org/2003/role/disclosureRef
-Topic 810
-SubTopic 10
-Name Accounting Standards Codification
-Section 45
-Paragraph 25
-Subparagraph (b)
-Publisher FASB
-URI https://asc.fasb.org//1943274/2147481231/810-10-45-25
Reference 3: http://www.xbrl.org/2003/role/disclosureRef
-Topic 810
-SubTopic 10
-Name Accounting Standards Codification
-Section 50
-Paragraph 3
-Subparagraph (bb)
-Publisher FASB
-URI https://asc.fasb.org//1943274/2147481203/810-10-50-3
Reference 4: http://www.xbrl.org/2003/role/disclosureRef
-Topic 235
-SubTopic 10
-Name Accounting Standards Codification
-Section S99
-Paragraph 1
-Subparagraph (SX 210.4-08(g)(1)(ii))
-Publisher FASB
-URI https://asc.fasb.org//1943274/2147480678/235-10-S99-1
Reference 5: http://www.xbrl.org/2003/role/disclosureRef
-Topic 323
-SubTopic 10
-Name Accounting Standards Codification
-Section 50
-Paragraph 3
-Subparagraph (c)
-Publisher FASB
-URI https://asc.fasb.org//1943274/2147481687/323-10-50-3
Reference 6: http://www.xbrl.org/2003/role/disclosureRef
-Topic 825
-SubTopic 10
-Name Accounting Standards Codification
-Section 50
-Paragraph 28
-Subparagraph (f)
-Publisher FASB
-URI https://asc.fasb.org//1943274/2147482907/825-10-50-28
Reference 7: http://www.xbrl.org/2003/role/exampleRef
-Topic 946
-SubTopic 830
-Name Accounting Standards Codification
-Section 55
-Paragraph 12
-Publisher FASB
-URI https://asc.fasb.org//1943274/2147480167/946-830-55-12
Reference 8: http://www.xbrl.org/2003/role/disclosureRef
-Topic 946
-SubTopic 210
-Name Accounting Standards Codification
-Section S99
-Paragraph 1
-Subparagraph (SX 210.6-04(14))
-Publisher FASB
-URI https://asc.fasb.org//1943274/2147479617/946-210-S99-1
Reference 9: http://www.xbrl.org/2003/role/disclosureRef
-Topic 470
-SubTopic 10
-Name Accounting Standards Codification
-Section S99
-Paragraph 1A
-Subparagraph (SX 210.13-01(a)(4)(i))
-Publisher FASB
-URI https://asc.fasb.org//1943274/2147480097/470-10-S99-1A
Reference 10: http://www.xbrl.org/2009/role/commonPracticeRef
-Topic 470
-SubTopic 10
-Name Accounting Standards Codification
-Section S99
-Paragraph 1A
-Subparagraph (SX 210.13-01(a)(4)(ii))
-Publisher FASB
-URI https://asc.fasb.org//1943274/2147480097/470-10-S99-1A
Reference 11: http://www.xbrl.org/2003/role/disclosureRef
-Topic 470
-SubTopic 10
-Name Accounting Standards Codification
-Section S99
-Paragraph 1A
-Subparagraph (SX 210.13-01(a)(4)(iii)(A))
-Publisher FASB
-URI https://asc.fasb.org//1943274/2147480097/470-10-S99-1A
Reference 12: http://www.xbrl.org/2003/role/disclosureRef
-Topic 470
-SubTopic 10
-Name Accounting Standards Codification
-Section S99
-Paragraph 1A
-Subparagraph (SX 210.13-01(a)(4)(iv))
-Publisher FASB
-URI https://asc.fasb.org//1943274/2147480097/470-10-S99-1A
Reference 13: http://www.xbrl.org/2003/role/disclosureRef
-Topic 470
-SubTopic 10
-Name Accounting Standards Codification
-Section S99
-Paragraph 1A
-Subparagraph (SX 210.13-01(a)(5))
-Publisher FASB
-URI https://asc.fasb.org//1943274/2147480097/470-10-S99-1A
Reference 14: http://www.xbrl.org/2003/role/disclosureRef
-Topic 470
-SubTopic 10
-Name Accounting Standards Codification
-Section S99
-Paragraph 1B
-Subparagraph (SX 210.13-02(a)(4)(i))
-Publisher FASB
-URI https://asc.fasb.org//1943274/2147480097/470-10-S99-1B
Reference 15: http://www.xbrl.org/2003/role/disclosureRef
-Topic 470
-SubTopic 10
-Name Accounting Standards Codification
-Section S99
-Paragraph 1B
-Subparagraph (SX 210.13-02(a)(4)(iii)(A))
-Publisher FASB
-URI https://asc.fasb.org//1943274/2147480097/470-10-S99-1B
Reference 16: http://www.xbrl.org/2003/role/disclosureRef
-Topic 470
-SubTopic 10
-Name Accounting Standards Codification
-Section S99
-Paragraph 1B
-Subparagraph (SX 210.13-02(a)(4)(iii)(B))
-Publisher FASB
-URI https://asc.fasb.org//1943274/2147480097/470-10-S99-1B
Reference 17: http://www.xbrl.org/2003/role/disclosureRef
-Topic 470
-SubTopic 10
-Name Accounting Standards Codification
-Section S99
-Paragraph 1B
-Subparagraph (SX 210.13-02(a)(4)(iv))
-Publisher FASB
-URI https://asc.fasb.org//1943274/2147480097/470-10-S99-1B
Reference 18: http://www.xbrl.org/2003/role/disclosureRef
-Topic 470
-SubTopic 10
-Name Accounting Standards Codification
-Section S99
-Paragraph 1B
-Subparagraph (SX 210.13-02(a)(5))
-Publisher FASB
-URI https://asc.fasb.org//1943274/2147480097/470-10-S99-1B
Reference 19: http://www.xbrl.org/2009/role/commonPracticeRef
-Topic 852
-SubTopic 10
-Name Accounting Standards Codification
-Section 50
-Paragraph 7
-Subparagraph (a)
-Publisher FASB
-URI https://asc.fasb.org//1943274/2147481404/852-10-50-7
Reference 20: http://www.xbrl.org/2009/role/commonPracticeRef
-Topic 852
-SubTopic 10
-Name Accounting Standards Codification
-Section 50
-Paragraph 7
-Subparagraph (b)
-Publisher FASB
-URI https://asc.fasb.org//1943274/2147481404/852-10-50-7
Reference 21: http://www.xbrl.org/2003/role/exampleRef
-Topic 280
-SubTopic 10
-Name Accounting Standards Codification
-Section 50
-Paragraph 30
-Subparagraph (d)
-Publisher FASB
-URI https://asc.fasb.org//1943274/2147482810/280-10-50-30
Reference 22: http://fasb.org/us-gaap/role/ref/legacyRef
-Name Accounting Standards Codification
-Topic 210
-SubTopic 10
-Section S99
-Paragraph 1
-Subparagraph (SX 210.5-02.19-26)
-Publisher FASB
-URI https://asc.fasb.org//1943274/2147480566/210-10-S99-1
| Name: |
us-gaap_Liabilities |
| Namespace Prefix: |
us-gaap_ |
| Data Type: |
xbrli:monetaryItemType |
| Balance Type: |
credit |
| Period Type: |
instant |
|
| X |
- DefinitionAmount of liabilities and equity items, including the portion of equity attributable to noncontrolling interests, if any. Reference 1: http://www.xbrl.org/2003/role/exampleRef
-Topic 852
-SubTopic 10
-Name Accounting Standards Codification
-Section 55
-Paragraph 10
-Publisher FASB
-URI https://asc.fasb.org//1943274/2147481372/852-10-55-10
Reference 2: http://www.xbrl.org/2003/role/disclosureRef
-Topic 944
-SubTopic 210
-Name Accounting Standards Codification
-Section S99
-Paragraph 1
-Subparagraph (SX 210.7-03(a)(25))
-Publisher FASB
-URI https://asc.fasb.org//1943274/2147479440/944-210-S99-1
Reference 3: http://www.xbrl.org/2009/role/commonPracticeRef
-Topic 235
-SubTopic 10
-Name Accounting Standards Codification
-Section S99
-Paragraph 1
-Subparagraph (SX 210.4-08(g)(1)(ii))
-Publisher FASB
-URI https://asc.fasb.org//1943274/2147480678/235-10-S99-1
Reference 4: http://www.xbrl.org/2009/role/commonPracticeRef
-Topic 323
-SubTopic 10
-Name Accounting Standards Codification
-Section 50
-Paragraph 3
-Subparagraph (c)
-Publisher FASB
-URI https://asc.fasb.org//1943274/2147481687/323-10-50-3
Reference 5: http://www.xbrl.org/2009/role/commonPracticeRef
-Topic 825
-SubTopic 10
-Name Accounting Standards Codification
-Section 50
-Paragraph 28
-Subparagraph (f)
-Publisher FASB
-URI https://asc.fasb.org//1943274/2147482907/825-10-50-28
Reference 6: http://fasb.org/us-gaap/role/ref/legacyRef
-Topic 942
-SubTopic 210
-Name Accounting Standards Codification
-Section S99
-Paragraph 1
-Subparagraph (SX 210.9-03(23))
-Publisher FASB
-URI https://asc.fasb.org//1943274/2147479853/942-210-S99-1
Reference 7: http://fasb.org/us-gaap/role/ref/legacyRef
-Topic 210
-SubTopic 10
-Name Accounting Standards Codification
-Section S99
-Paragraph 1
-Subparagraph (SX 210.5-02(32))
-Publisher FASB
-URI https://asc.fasb.org//1943274/2147480566/210-10-S99-1
| Name: |
us-gaap_LiabilitiesAndStockholdersEquity |
| Namespace Prefix: |
us-gaap_ |
| Data Type: |
xbrli:monetaryItemType |
| Balance Type: |
credit |
| Period Type: |
instant |
|
| X |
- DefinitionTotal obligations incurred as part of normal operations that are expected to be paid during the following twelve months or within one business cycle, if longer. Reference 1: http://www.xbrl.org/2003/role/disclosureRef
-Topic 810
-SubTopic 10
-Name Accounting Standards Codification
-Section 50
-Paragraph 3
-Subparagraph (c)
-Publisher FASB
-URI https://asc.fasb.org//1943274/2147481203/810-10-50-3
Reference 2: http://www.xbrl.org/2003/role/disclosureRef
-Topic 810
-SubTopic 10
-Name Accounting Standards Codification
-Section 45
-Paragraph 25
-Subparagraph (b)
-Publisher FASB
-URI https://asc.fasb.org//1943274/2147481231/810-10-45-25
Reference 3: http://www.xbrl.org/2003/role/disclosureRef
-Topic 810
-SubTopic 10
-Name Accounting Standards Codification
-Section 50
-Paragraph 3
-Subparagraph (bb)
-Publisher FASB
-URI https://asc.fasb.org//1943274/2147481203/810-10-50-3
Reference 4: http://www.xbrl.org/2003/role/disclosureRef
-Topic 235
-SubTopic 10
-Name Accounting Standards Codification
-Section S99
-Paragraph 1
-Subparagraph (SX 210.4-08(g)(1)(ii))
-Publisher FASB
-URI https://asc.fasb.org//1943274/2147480678/235-10-S99-1
Reference 5: http://www.xbrl.org/2003/role/disclosureRef
-Topic 323
-SubTopic 10
-Name Accounting Standards Codification
-Section 50
-Paragraph 3
-Subparagraph (c)
-Publisher FASB
-URI https://asc.fasb.org//1943274/2147481687/323-10-50-3
Reference 6: http://www.xbrl.org/2003/role/disclosureRef
-Topic 825
-SubTopic 10
-Name Accounting Standards Codification
-Section 50
-Paragraph 28
-Subparagraph (f)
-Publisher FASB
-URI https://asc.fasb.org//1943274/2147482907/825-10-50-28
Reference 7: http://www.xbrl.org/2003/role/exampleRef
-Topic 852
-SubTopic 10
-Name Accounting Standards Codification
-Section 55
-Paragraph 10
-Publisher FASB
-URI https://asc.fasb.org//1943274/2147481372/852-10-55-10
Reference 8: http://www.xbrl.org/2003/role/disclosureRef
-Topic 210
-SubTopic 10
-Name Accounting Standards Codification
-Section 45
-Paragraph 5
-Publisher FASB
-URI https://asc.fasb.org//1943274/2147483467/210-10-45-5
Reference 9: http://www.xbrl.org/2003/role/disclosureRef
-Topic 470
-SubTopic 10
-Name Accounting Standards Codification
-Section S99
-Paragraph 1A
-Subparagraph (SX 210.13-01(a)(4)(i))
-Publisher FASB
-URI https://asc.fasb.org//1943274/2147480097/470-10-S99-1A
Reference 10: http://www.xbrl.org/2009/role/commonPracticeRef
-Topic 470
-SubTopic 10
-Name Accounting Standards Codification
-Section S99
-Paragraph 1A
-Subparagraph (SX 210.13-01(a)(4)(ii))
-Publisher FASB
-URI https://asc.fasb.org//1943274/2147480097/470-10-S99-1A
Reference 11: http://www.xbrl.org/2003/role/disclosureRef
-Topic 470
-SubTopic 10
-Name Accounting Standards Codification
-Section S99
-Paragraph 1A
-Subparagraph (SX 210.13-01(a)(4)(iii)(A))
-Publisher FASB
-URI https://asc.fasb.org//1943274/2147480097/470-10-S99-1A
Reference 12: http://www.xbrl.org/2003/role/disclosureRef
-Topic 470
-SubTopic 10
-Name Accounting Standards Codification
-Section S99
-Paragraph 1A
-Subparagraph (SX 210.13-01(a)(4)(iv))
-Publisher FASB
-URI https://asc.fasb.org//1943274/2147480097/470-10-S99-1A
Reference 13: http://www.xbrl.org/2003/role/disclosureRef
-Topic 470
-SubTopic 10
-Name Accounting Standards Codification
-Section S99
-Paragraph 1A
-Subparagraph (SX 210.13-01(a)(5))
-Publisher FASB
-URI https://asc.fasb.org//1943274/2147480097/470-10-S99-1A
Reference 14: http://www.xbrl.org/2003/role/disclosureRef
-Topic 470
-SubTopic 10
-Name Accounting Standards Codification
-Section S99
-Paragraph 1B
-Subparagraph (SX 210.13-02(a)(4)(i))
-Publisher FASB
-URI https://asc.fasb.org//1943274/2147480097/470-10-S99-1B
Reference 15: http://www.xbrl.org/2003/role/disclosureRef
-Topic 470
-SubTopic 10
-Name Accounting Standards Codification
-Section S99
-Paragraph 1B
-Subparagraph (SX 210.13-02(a)(4)(iii)(A))
-Publisher FASB
-URI https://asc.fasb.org//1943274/2147480097/470-10-S99-1B
Reference 16: http://www.xbrl.org/2003/role/disclosureRef
-Topic 470
-SubTopic 10
-Name Accounting Standards Codification
-Section S99
-Paragraph 1B
-Subparagraph (SX 210.13-02(a)(4)(iii)(B))
-Publisher FASB
-URI https://asc.fasb.org//1943274/2147480097/470-10-S99-1B
Reference 17: http://www.xbrl.org/2003/role/disclosureRef
-Topic 470
-SubTopic 10
-Name Accounting Standards Codification
-Section S99
-Paragraph 1B
-Subparagraph (SX 210.13-02(a)(4)(iv))
-Publisher FASB
-URI https://asc.fasb.org//1943274/2147480097/470-10-S99-1B
Reference 18: http://www.xbrl.org/2003/role/disclosureRef
-Topic 470
-SubTopic 10
-Name Accounting Standards Codification
-Section S99
-Paragraph 1B
-Subparagraph (SX 210.13-02(a)(5))
-Publisher FASB
-URI https://asc.fasb.org//1943274/2147480097/470-10-S99-1B
Reference 19: http://www.xbrl.org/2009/role/commonPracticeRef
-Topic 852
-SubTopic 10
-Name Accounting Standards Codification
-Section 50
-Paragraph 7
-Subparagraph (a)
-Publisher FASB
-URI https://asc.fasb.org//1943274/2147481404/852-10-50-7
Reference 20: http://www.xbrl.org/2009/role/commonPracticeRef
-Topic 852
-SubTopic 10
-Name Accounting Standards Codification
-Section 50
-Paragraph 7
-Subparagraph (b)
-Publisher FASB
-URI https://asc.fasb.org//1943274/2147481404/852-10-50-7
Reference 21: http://fasb.org/us-gaap/role/ref/legacyRef
-Name Accounting Standards Codification
-Topic 210
-SubTopic 10
-Section S99
-Paragraph 1
-Subparagraph (SX 210.5-02.21)
-Publisher FASB
-URI https://asc.fasb.org//1943274/2147480566/210-10-S99-1
| Name: |
us-gaap_LiabilitiesCurrent |
| Namespace Prefix: |
us-gaap_ |
| Data Type: |
xbrli:monetaryItemType |
| Balance Type: |
credit |
| Period Type: |
instant |
|
| X |
- References
+ Details
| Name: |
us-gaap_LiabilitiesCurrentAbstract |
| Namespace Prefix: |
us-gaap_ |
| Data Type: |
xbrli:stringItemType |
| Balance Type: |
na |
| Period Type: |
duration |
|
| X |
- DefinitionCarrying value as of the balance sheet date of current portion of long-term loans payable to bank due within one year or the operating cycle if longer. Reference 1: http://www.xbrl.org/2003/role/disclosureRef
-Topic 946
-SubTopic 210
-Name Accounting Standards Codification
-Section S99
-Paragraph 1
-Subparagraph (SX 210.6-04(13)(a)(1))
-Publisher FASB
-URI https://asc.fasb.org//1943274/2147479617/946-210-S99-1
Reference 2: http://fasb.org/us-gaap/role/ref/legacyRef
-Topic 210
-SubTopic 10
-Name Accounting Standards Codification
-Section S99
-Paragraph 1
-Subparagraph (SX 210.5-02(19))
-Publisher FASB
-URI https://asc.fasb.org//1943274/2147480566/210-10-S99-1
| Name: |
us-gaap_LoansPayableToBankCurrent |
| Namespace Prefix: |
us-gaap_ |
| Data Type: |
xbrli:monetaryItemType |
| Balance Type: |
credit |
| Period Type: |
instant |
|
| X |
- DefinitionAmount of liabilities classified as other, due within one year or the normal operating cycle, if longer. Reference 1: http://www.xbrl.org/2003/role/exampleRef
-Topic 852
-SubTopic 10
-Name Accounting Standards Codification
-Section 55
-Paragraph 10
-Publisher FASB
-URI https://asc.fasb.org//1943274/2147481372/852-10-55-10
Reference 2: http://fasb.org/us-gaap/role/ref/legacyRef
-Name Accounting Standards Codification
-Topic 210
-SubTopic 10
-Section S99
-Paragraph 1
-Subparagraph (SX 210.5-02.20)
-Publisher FASB
-URI https://asc.fasb.org//1943274/2147480566/210-10-S99-1
| Name: |
us-gaap_OtherLiabilitiesCurrent |
| Namespace Prefix: |
us-gaap_ |
| Data Type: |
xbrli:monetaryItemType |
| Balance Type: |
credit |
| Period Type: |
instant |
|
| X |
- DefinitionAggregate par or stated value of issued nonredeemable preferred stock (or preferred stock redeemable solely at the option of the issuer). This item includes treasury stock repurchased by the entity. Note: elements for number of nonredeemable preferred shares, par value and other disclosure concepts are in another section within stockholders' equity. Reference 1: http://www.xbrl.org/2003/role/exampleRef
-Topic 852
-SubTopic 10
-Name Accounting Standards Codification
-Section 55
-Paragraph 10
-Publisher FASB
-URI https://asc.fasb.org//1943274/2147481372/852-10-55-10
Reference 2: http://www.xbrl.org/2003/role/disclosureRef
-Topic 944
-SubTopic 210
-Name Accounting Standards Codification
-Section S99
-Paragraph 1
-Subparagraph (SX 210.7-03(a)(21))
-Publisher FASB
-URI https://asc.fasb.org//1943274/2147479440/944-210-S99-1
Reference 3: http://fasb.org/us-gaap/role/ref/legacyRef
-Topic 210
-SubTopic 10
-Name Accounting Standards Codification
-Section S99
-Paragraph 1
-Subparagraph (SX 210.5-02(28))
-Publisher FASB
-URI https://asc.fasb.org//1943274/2147480566/210-10-S99-1
| Name: |
us-gaap_PreferredStockValue |
| Namespace Prefix: |
us-gaap_ |
| Data Type: |
xbrli:monetaryItemType |
| Balance Type: |
credit |
| Period Type: |
instant |
|
| X |
- DefinitionAmount of asset related to consideration paid in advance for costs that provide economic benefits in future periods, and amount of other assets that are expected to be realized or consumed within one year or the normal operating cycle, if longer. Reference 1: http://www.xbrl.org/2009/role/commonPracticeRef
-Topic 210
-SubTopic 10
-Name Accounting Standards Codification
-Section S99
-Paragraph 1
-Subparagraph (SX 210.5-02(9))
-Publisher FASB
-URI https://asc.fasb.org//1943274/2147480566/210-10-S99-1
| Name: |
us-gaap_PrepaidExpenseAndOtherAssetsCurrent |
| Namespace Prefix: |
us-gaap_ |
| Data Type: |
xbrli:monetaryItemType |
| Balance Type: |
debit |
| Period Type: |
instant |
|
| X |
- DefinitionAmount after accumulated depreciation, depletion and amortization of physical assets used in the normal conduct of business to produce goods and services and not intended for resale. Examples include, but are not limited to, land, buildings, machinery and equipment, office equipment, and furniture and fixtures. Reference 1: http://fasb.org/us-gaap/role/ref/legacyRef
-Name Accounting Standards Codification
-Section 50
-Paragraph 1
-SubTopic 10
-Topic 360
-Publisher FASB
-URI https://asc.fasb.org//1943274/2147482099/360-10-50-1
Reference 2: http://www.xbrl.org/2003/role/exampleRef
-Topic 852
-SubTopic 10
-Name Accounting Standards Codification
-Section 55
-Paragraph 10
-Publisher FASB
-URI https://asc.fasb.org//1943274/2147481372/852-10-55-10
Reference 3: http://www.xbrl.org/2003/role/disclosureRef
-Topic 944
-SubTopic 210
-Name Accounting Standards Codification
-Section S99
-Paragraph 1
-Subparagraph (SX 210.7-03(a)(8))
-Publisher FASB
-URI https://asc.fasb.org//1943274/2147479440/944-210-S99-1
Reference 4: http://www.xbrl.org/2003/role/disclosureRef
-Topic 942
-SubTopic 360
-Name Accounting Standards Codification
-Section 50
-Paragraph 1
-Publisher FASB
-URI https://asc.fasb.org//1943274/2147480842/942-360-50-1
| Name: |
us-gaap_PropertyPlantAndEquipmentNet |
| Namespace Prefix: |
us-gaap_ |
| Data Type: |
xbrli:monetaryItemType |
| Balance Type: |
debit |
| Period Type: |
instant |
|
| X |
- DefinitionAmount of accumulated undistributed earnings (deficit). Reference 1: http://www.xbrl.org/2003/role/exampleRef
-Topic 852
-SubTopic 10
-Name Accounting Standards Codification
-Section 55
-Paragraph 10
-Publisher FASB
-URI https://asc.fasb.org//1943274/2147481372/852-10-55-10
Reference 2: http://www.xbrl.org/2003/role/disclosureRef
-Topic 944
-SubTopic 40
-Name Accounting Standards Codification
-Section 65
-Paragraph 2
-Subparagraph (g)(2)(i)
-Publisher FASB
-URI https://asc.fasb.org//1943274/2147480016/944-40-65-2
Reference 3: http://www.xbrl.org/2003/role/disclosureRef
-Topic 944
-SubTopic 40
-Name Accounting Standards Codification
-Section 65
-Paragraph 2
-Subparagraph (h)(2)
-Publisher FASB
-URI https://asc.fasb.org//1943274/2147480016/944-40-65-2
Reference 4: http://www.xbrl.org/2003/role/disclosureRef
-Topic 946
-SubTopic 20
-Name Accounting Standards Codification
-Section 50
-Paragraph 11
-Publisher FASB
-URI https://asc.fasb.org//1943274/2147480990/946-20-50-11
Reference 5: http://www.xbrl.org/2003/role/disclosureRef
-Topic 944
-SubTopic 210
-Name Accounting Standards Codification
-Section S99
-Paragraph 1
-Subparagraph (SX 210.7-03(a)(23)(a)(4))
-Publisher FASB
-URI https://asc.fasb.org//1943274/2147479440/944-210-S99-1
Reference 6: http://www.xbrl.org/2003/role/disclosureRef
-Topic 946
-SubTopic 210
-Name Accounting Standards Codification
-Section S99
-Paragraph 1
-Subparagraph (SX 210.6-04(17))
-Publisher FASB
-URI https://asc.fasb.org//1943274/2147479617/946-210-S99-1
Reference 7: http://fasb.org/us-gaap/role/ref/legacyRef
-Topic 505
-SubTopic 10
-Name Accounting Standards Codification
-Section S99
-Paragraph 1
-Subparagraph (SX 210.3-04)
-Publisher FASB
-URI https://asc.fasb.org//1943274/2147480008/505-10-S99-1
Reference 8: http://fasb.org/us-gaap/role/ref/legacyRef
-Topic 210
-SubTopic 10
-Name Accounting Standards Codification
-Section S99
-Paragraph 1
-Subparagraph (SX 210.5-02(30)(a)(3))
-Publisher FASB
-URI https://asc.fasb.org//1943274/2147480566/210-10-S99-1
| Name: |
us-gaap_RetainedEarningsAccumulatedDeficit |
| Namespace Prefix: |
us-gaap_ |
| Data Type: |
xbrli:monetaryItemType |
| Balance Type: |
credit |
| Period Type: |
instant |
|
| X |
- DefinitionAmount of equity (deficit) attributable to parent. Excludes temporary equity and equity attributable to noncontrolling interest. Reference 1: http://www.xbrl.org/2003/role/exampleRef
-Topic 852
-SubTopic 10
-Name Accounting Standards Codification
-Section 55
-Paragraph 10
-Publisher FASB
-URI https://asc.fasb.org//1943274/2147481372/852-10-55-10
Reference 2: http://www.xbrl.org/2003/role/exampleRef
-Topic 946
-SubTopic 830
-Name Accounting Standards Codification
-Section 55
-Paragraph 12
-Publisher FASB
-URI https://asc.fasb.org//1943274/2147480167/946-830-55-12
Reference 3: http://www.xbrl.org/2003/role/disclosureRef
-Topic 946
-SubTopic 210
-Name Accounting Standards Codification
-Section S99
-Paragraph 1
-Subparagraph (SX 210.6-04(19))
-Publisher FASB
-URI https://asc.fasb.org//1943274/2147479617/946-210-S99-1
Reference 4: http://www.xbrl.org/2003/role/disclosureRef
-Topic 946
-SubTopic 210
-Name Accounting Standards Codification
-Section S99
-Paragraph 2
-Subparagraph (SX 210.6-05(4))
-Publisher FASB
-URI https://asc.fasb.org//1943274/2147479617/946-210-S99-2
Reference 5: http://www.xbrl.org/2009/role/commonPracticeRef
-Topic 946
-SubTopic 220
-Name Accounting Standards Codification
-Section S99
-Paragraph 3
-Subparagraph (SX 210.6-09(4)(b))
-Publisher FASB
-URI https://asc.fasb.org//1943274/2147483575/946-220-S99-3
Reference 6: http://www.xbrl.org/2003/role/disclosureRef
-Topic 946
-SubTopic 220
-Name Accounting Standards Codification
-Section S99
-Paragraph 3
-Subparagraph (SX 210.6-09(6))
-Publisher FASB
-URI https://asc.fasb.org//1943274/2147483575/946-220-S99-3
Reference 7: http://www.xbrl.org/2003/role/disclosureRef
-Topic 946
-SubTopic 220
-Name Accounting Standards Codification
-Section S99
-Paragraph 3
-Subparagraph (SX 210.6-09(7))
-Publisher FASB
-URI https://asc.fasb.org//1943274/2147483575/946-220-S99-3
Reference 8: http://www.xbrl.org/2009/role/commonPracticeRef
-Topic 235
-SubTopic 10
-Name Accounting Standards Codification
-Section S99
-Paragraph 1
-Subparagraph (SX 210.4-08(g)(1)(ii))
-Publisher FASB
-URI https://asc.fasb.org//1943274/2147480678/235-10-S99-1
Reference 9: http://www.xbrl.org/2009/role/commonPracticeRef
-Topic 323
-SubTopic 10
-Name Accounting Standards Codification
-Section 50
-Paragraph 3
-Subparagraph (c)
-Publisher FASB
-URI https://asc.fasb.org//1943274/2147481687/323-10-50-3
Reference 10: http://www.xbrl.org/2009/role/commonPracticeRef
-Topic 825
-SubTopic 10
-Name Accounting Standards Codification
-Section 50
-Paragraph 28
-Subparagraph (f)
-Publisher FASB
-URI https://asc.fasb.org//1943274/2147482907/825-10-50-28
Reference 11: http://fasb.org/us-gaap/role/ref/legacyRef
-Topic 210
-SubTopic 10
-Name Accounting Standards Codification
-Section S99
-Paragraph 1
-Subparagraph (SX 210.5-02(29))
-Publisher FASB
-URI https://asc.fasb.org//1943274/2147480566/210-10-S99-1
Reference 12: http://fasb.org/us-gaap/role/ref/legacyRef
-Topic 210
-SubTopic 10
-Name Accounting Standards Codification
-Section S99
-Paragraph 1
-Subparagraph (SX 210.5-02(31))
-Publisher FASB
-URI https://asc.fasb.org//1943274/2147480566/210-10-S99-1
Reference 13: http://fasb.org/us-gaap/role/ref/legacyRef
-Topic 210
-SubTopic 10
-Name Accounting Standards Codification
-Section S99
-Paragraph 1
-Subparagraph (SX 210.5-02(30))
-Publisher FASB
-URI https://asc.fasb.org//1943274/2147480566/210-10-S99-1
Reference 14: http://fasb.org/us-gaap/role/ref/legacyRef
-Topic 310
-SubTopic 10
-Name Accounting Standards Codification
-Section S99
-Paragraph 2
-Subparagraph (SAB Topic 4.E)
-Publisher FASB
-URI https://asc.fasb.org//1943274/2147480418/310-10-S99-2
| Name: |
us-gaap_StockholdersEquity |
| Namespace Prefix: |
us-gaap_ |
| Data Type: |
xbrli:monetaryItemType |
| Balance Type: |
credit |
| Period Type: |
instant |
|
| X |
- References
+ Details
| Name: |
us-gaap_StockholdersEquityAbstract |
| Namespace Prefix: |
us-gaap_ |
| Data Type: |
xbrli:stringItemType |
| Balance Type: |
na |
| Period Type: |
duration |
|
v3.23.2
Condensed Consolidated Balance Sheets (Parenthetical) - $ / shares
|
Jun. 30, 2023 |
Mar. 31, 2023 |
Mar. 31, 2022 |
Mar. 31, 2021 |
| Statement of Financial Position [Abstract] |
|
|
|
|
| Preferred stock, par value |
$ 0.0001
|
$ 0.0001
|
|
$ 0.0001
|
| Preferred stock, shares authorized |
500,000
|
500,000
|
500,000
|
50,000,000
|
| Preferred stock, shares issued |
0
|
0
|
|
0
|
| Preferred stock, shares outstanding |
0
|
0
|
|
0
|
| Common stock, par value |
$ 0.0001
|
$ 0.0001
|
|
$ 0.0001
|
| Common stock, shares authorized |
5,000,000
|
5,000,000
|
5,000,000
|
450,000,000
|
| Common stock, shares issued |
1,000,000
|
1,000,000
|
|
1,000,000
|
| Common stock, shares outstanding |
1,000,000
|
1,000,000
|
|
1,000,000
|
| X |
- DefinitionFace amount or stated value per share of common stock. Reference 1: http://fasb.org/us-gaap/role/ref/legacyRef
-Topic 210
-SubTopic 10
-Name Accounting Standards Codification
-Section S99
-Paragraph 1
-Subparagraph (SX 210.5-02(29))
-Publisher FASB
-URI https://asc.fasb.org//1943274/2147480566/210-10-S99-1
| Name: |
us-gaap_CommonStockParOrStatedValuePerShare |
| Namespace Prefix: |
us-gaap_ |
| Data Type: |
dtr-types:perShareItemType |
| Balance Type: |
na |
| Period Type: |
instant |
|
| X |
- DefinitionThe maximum number of common shares permitted to be issued by an entity's charter and bylaws. Reference 1: http://www.xbrl.org/2003/role/disclosureRef
-Topic 946
-SubTopic 210
-Name Accounting Standards Codification
-Section S99
-Paragraph 1
-Subparagraph (SX 210.6-04(16)(a))
-Publisher FASB
-URI https://asc.fasb.org//1943274/2147479617/946-210-S99-1
Reference 2: http://fasb.org/us-gaap/role/ref/legacyRef
-Topic 210
-SubTopic 10
-Name Accounting Standards Codification
-Section S99
-Paragraph 1
-Subparagraph (SX 210.5-02(29))
-Publisher FASB
-URI https://asc.fasb.org//1943274/2147480566/210-10-S99-1
| Name: |
us-gaap_CommonStockSharesAuthorized |
| Namespace Prefix: |
us-gaap_ |
| Data Type: |
xbrli:sharesItemType |
| Balance Type: |
na |
| Period Type: |
instant |
|
| X |
- DefinitionTotal number of common shares of an entity that have been sold or granted to shareholders (includes common shares that were issued, repurchased and remain in the treasury). These shares represent capital invested by the firm's shareholders and owners, and may be all or only a portion of the number of shares authorized. Shares issued include shares outstanding and shares held in the treasury. Reference 1: http://fasb.org/us-gaap/role/ref/legacyRef
-Topic 210
-SubTopic 10
-Name Accounting Standards Codification
-Section S99
-Paragraph 1
-Subparagraph (SX 210.5-02(29))
-Publisher FASB
-URI https://asc.fasb.org//1943274/2147480566/210-10-S99-1
| Name: |
us-gaap_CommonStockSharesIssued |
| Namespace Prefix: |
us-gaap_ |
| Data Type: |
xbrli:sharesItemType |
| Balance Type: |
na |
| Period Type: |
instant |
|
| X |
- DefinitionNumber of shares of common stock outstanding. Common stock represent the ownership interest in a corporation. Reference 1: http://fasb.org/us-gaap/role/ref/legacyRef
-Name Accounting Standards Codification
-Section 50
-Paragraph 2
-SubTopic 10
-Topic 505
-Publisher FASB
-URI https://asc.fasb.org//1943274/2147481112/505-10-50-2
Reference 2: http://www.xbrl.org/2003/role/disclosureRef
-Topic 946
-SubTopic 210
-Name Accounting Standards Codification
-Section S99
-Paragraph 2
-Subparagraph (SX 210.6-05(4))
-Publisher FASB
-URI https://asc.fasb.org//1943274/2147479617/946-210-S99-2
Reference 3: http://www.xbrl.org/2009/role/commonPracticeRef
-Topic 946
-SubTopic 220
-Name Accounting Standards Codification
-Section S99
-Paragraph 3
-Subparagraph (SX 210.6-09(4)(b))
-Publisher FASB
-URI https://asc.fasb.org//1943274/2147483575/946-220-S99-3
Reference 4: http://www.xbrl.org/2003/role/disclosureRef
-Topic 946
-SubTopic 210
-Name Accounting Standards Codification
-Section S99
-Paragraph 1
-Subparagraph (SX 210.6-04(16)(a))
-Publisher FASB
-URI https://asc.fasb.org//1943274/2147479617/946-210-S99-1
Reference 5: http://www.xbrl.org/2009/role/commonPracticeRef
-Topic 946
-SubTopic 220
-Name Accounting Standards Codification
-Section S99
-Paragraph 3
-Subparagraph (SX 210.6-09(7))
-Publisher FASB
-URI https://asc.fasb.org//1943274/2147483575/946-220-S99-3
Reference 6: http://fasb.org/us-gaap/role/ref/legacyRef
-Topic 210
-SubTopic 10
-Name Accounting Standards Codification
-Section S99
-Paragraph 1
-Subparagraph (SX 210.5-02(29))
-Publisher FASB
-URI https://asc.fasb.org//1943274/2147480566/210-10-S99-1
| Name: |
us-gaap_CommonStockSharesOutstanding |
| Namespace Prefix: |
us-gaap_ |
| Data Type: |
xbrli:sharesItemType |
| Balance Type: |
na |
| Period Type: |
instant |
|
| X |
- DefinitionFace amount or stated value per share of preferred stock nonredeemable or redeemable solely at the option of the issuer. Reference 1: http://www.xbrl.org/2003/role/disclosureRef
-Topic 505
-SubTopic 10
-Name Accounting Standards Codification
-Section 50
-Paragraph 13
-Subparagraph (a)
-Publisher FASB
-URI https://asc.fasb.org//1943274/2147481112/505-10-50-13
Reference 2: http://fasb.org/us-gaap/role/ref/legacyRef
-Topic 210
-SubTopic 10
-Name Accounting Standards Codification
-Section S99
-Paragraph 1
-Subparagraph (SX 210.5-02(28))
-Publisher FASB
-URI https://asc.fasb.org//1943274/2147480566/210-10-S99-1
| Name: |
us-gaap_PreferredStockParOrStatedValuePerShare |
| Namespace Prefix: |
us-gaap_ |
| Data Type: |
dtr-types:perShareItemType |
| Balance Type: |
na |
| Period Type: |
instant |
|
| X |
- DefinitionThe maximum number of nonredeemable preferred shares (or preferred stock redeemable solely at the option of the issuer) permitted to be issued by an entity's charter and bylaws. Reference 1: http://www.xbrl.org/2003/role/disclosureRef
-Topic 946
-SubTopic 210
-Name Accounting Standards Codification
-Section S99
-Paragraph 1
-Subparagraph (SX 210.6-04(16)(a))
-Publisher FASB
-URI https://asc.fasb.org//1943274/2147479617/946-210-S99-1
Reference 2: http://fasb.org/us-gaap/role/ref/legacyRef
-Topic 210
-SubTopic 10
-Name Accounting Standards Codification
-Section S99
-Paragraph 1
-Subparagraph (SX 210.5-02(28))
-Publisher FASB
-URI https://asc.fasb.org//1943274/2147480566/210-10-S99-1
| Name: |
us-gaap_PreferredStockSharesAuthorized |
| Namespace Prefix: |
us-gaap_ |
| Data Type: |
xbrli:sharesItemType |
| Balance Type: |
na |
| Period Type: |
instant |
|
| X |
- DefinitionTotal number of nonredeemable preferred shares (or preferred stock redeemable solely at the option of the issuer) issued to shareholders (includes related preferred shares that were issued, repurchased, and remain in the treasury). May be all or portion of the number of preferred shares authorized. Excludes preferred shares that are classified as debt. Reference 1: http://www.xbrl.org/2003/role/disclosureRef
-Topic 505
-SubTopic 10
-Name Accounting Standards Codification
-Section 50
-Paragraph 13
-Subparagraph (a)
-Publisher FASB
-URI https://asc.fasb.org//1943274/2147481112/505-10-50-13
Reference 2: http://fasb.org/us-gaap/role/ref/legacyRef
-Topic 210
-SubTopic 10
-Name Accounting Standards Codification
-Section S99
-Paragraph 1
-Subparagraph (SX 210.5-02(28))
-Publisher FASB
-URI https://asc.fasb.org//1943274/2147480566/210-10-S99-1
| Name: |
us-gaap_PreferredStockSharesIssued |
| Namespace Prefix: |
us-gaap_ |
| Data Type: |
xbrli:sharesItemType |
| Balance Type: |
na |
| Period Type: |
instant |
|
| X |
- DefinitionAggregate share number for all nonredeemable preferred stock (or preferred stock redeemable solely at the option of the issuer) held by stockholders. Does not include preferred shares that have been repurchased. Reference 1: http://www.xbrl.org/2003/role/disclosureRef
-Topic 946
-SubTopic 210
-Name Accounting Standards Codification
-Section S99
-Paragraph 2
-Subparagraph (SX 210.6-05(4))
-Publisher FASB
-URI https://asc.fasb.org//1943274/2147479617/946-210-S99-2
Reference 2: http://www.xbrl.org/2009/role/commonPracticeRef
-Topic 946
-SubTopic 220
-Name Accounting Standards Codification
-Section S99
-Paragraph 3
-Subparagraph (SX 210.6-09(4)(b))
-Publisher FASB
-URI https://asc.fasb.org//1943274/2147483575/946-220-S99-3
Reference 3: http://www.xbrl.org/2003/role/disclosureRef
-Topic 946
-SubTopic 210
-Name Accounting Standards Codification
-Section S99
-Paragraph 1
-Subparagraph (SX 210.6-04(16)(a))
-Publisher FASB
-URI https://asc.fasb.org//1943274/2147479617/946-210-S99-1
Reference 4: http://www.xbrl.org/2009/role/commonPracticeRef
-Topic 946
-SubTopic 220
-Name Accounting Standards Codification
-Section S99
-Paragraph 3
-Subparagraph (SX 210.6-09(7))
-Publisher FASB
-URI https://asc.fasb.org//1943274/2147483575/946-220-S99-3
Reference 5: http://fasb.org/us-gaap/role/ref/legacyRef
-Topic 210
-SubTopic 10
-Name Accounting Standards Codification
-Section S99
-Paragraph 1
-Subparagraph (SX 210.5-02(28))
-Publisher FASB
-URI https://asc.fasb.org//1943274/2147480566/210-10-S99-1
| Name: |
us-gaap_PreferredStockSharesOutstanding |
| Namespace Prefix: |
us-gaap_ |
| Data Type: |
xbrli:sharesItemType |
| Balance Type: |
na |
| Period Type: |
instant |
|
| X |
- References
+ Details
| Name: |
us-gaap_StatementOfFinancialPositionAbstract |
| Namespace Prefix: |
us-gaap_ |
| Data Type: |
xbrli:stringItemType |
| Balance Type: |
na |
| Period Type: |
duration |
|
v3.23.2
Condensed Consolidated Statements of Operations and Comprehensive Income (Loss) (Unaudited) - USD ($)
|
3 Months Ended |
Jun. 30, 2023 |
Jun. 30, 2022 |
| Income Statement [Abstract] |
|
|
| REVENUE |
$ 7,859
|
$ 44,909
|
| COST AND EXPENSES: |
|
|
| Cost of revenue |
|
(20,963)
|
| General and administrative expenses |
(54,549)
|
(167,029)
|
| Total operating costs and expenses |
(54,549)
|
(187,992)
|
| Loss from operations |
(46,690)
|
(143,083)
|
| Finance cost |
(123)
|
(514)
|
| Loss before income tax |
(46,813)
|
(143,597)
|
| Income tax expense |
|
|
| Net loss |
(46,813)
|
(143,597)
|
| Foreign currency translation gain |
80,173
|
53,377
|
| Total comprehensive income |
$ 33,360
|
$ (90,220)
|
| Net loss per share, basic |
$ (0.05)
|
$ (0.14)
|
| Net loss per share, diluted |
$ (0.05)
|
$ (0.14)
|
| Weighted average number of common shares outstanding, basic |
1,000,000
|
1,000,000
|
| Weighted average number of common shares outstanding, diluted |
1,000,000
|
1,000,000
|
| X |
- DefinitionAmount after tax of increase (decrease) in equity from transactions and other events and circumstances from net income and other comprehensive income, attributable to parent entity. Excludes changes in equity resulting from investments by owners and distributions to owners. Reference 1: http://www.xbrl.org/2003/role/disclosureRef
-Topic 220
-SubTopic 10
-Name Accounting Standards Codification
-Section S99
-Paragraph 2
-Subparagraph (SX 210.5-03(24))
-Publisher FASB
-URI https://asc.fasb.org//1943274/2147483621/220-10-S99-2
Reference 2: http://www.xbrl.org/2003/role/disclosureRef
-Topic 942
-SubTopic 220
-Name Accounting Standards Codification
-Section S99
-Paragraph 1
-Subparagraph (SX 210.9-04(26))
-Publisher FASB
-URI https://asc.fasb.org//1943274/2147483589/942-220-S99-1
Reference 3: http://www.xbrl.org/2003/role/disclosureRef
-Topic 944
-SubTopic 220
-Name Accounting Standards Codification
-Section S99
-Paragraph 1
-Subparagraph (SX 210.7-04(22))
-Publisher FASB
-URI https://asc.fasb.org//1943274/2147483586/944-220-S99-1
Reference 4: http://www.xbrl.org/2003/role/disclosureRef
-Topic 220
-SubTopic 10
-Name Accounting Standards Codification
-Section 45
-Paragraph 1A
-Subparagraph (c)
-Publisher FASB
-URI https://asc.fasb.org//1943274/2147482790/220-10-45-1A
Reference 5: http://www.xbrl.org/2003/role/disclosureRef
-Topic 220
-SubTopic 10
-Name Accounting Standards Codification
-Section 45
-Paragraph 1B
-Subparagraph (b)
-Publisher FASB
-URI https://asc.fasb.org//1943274/2147482790/220-10-45-1B
Reference 6: http://fasb.org/us-gaap/role/ref/legacyRef
-Name Accounting Standards Codification
-Topic 220
-SubTopic 10
-Section 45
-Paragraph 5
-Publisher FASB
-URI https://asc.fasb.org//1943274/2147482790/220-10-45-5
| Name: |
us-gaap_ComprehensiveIncomeNetOfTax |
| Namespace Prefix: |
us-gaap_ |
| Data Type: |
xbrli:monetaryItemType |
| Balance Type: |
credit |
| Period Type: |
duration |
|
| X |
- DefinitionThe aggregate cost of goods produced and sold and services rendered during the reporting period. Reference 1: http://www.xbrl.org/2003/role/disclosureRef
-Topic 235
-SubTopic 10
-Name Accounting Standards Codification
-Section S99
-Paragraph 1
-Subparagraph (SX 210.4-08(g)(1)(ii))
-Publisher FASB
-URI https://asc.fasb.org//1943274/2147480678/235-10-S99-1
Reference 2: http://www.xbrl.org/2003/role/disclosureRef
-Topic 323
-SubTopic 10
-Name Accounting Standards Codification
-Section 50
-Paragraph 3
-Subparagraph (c)
-Publisher FASB
-URI https://asc.fasb.org//1943274/2147481687/323-10-50-3
Reference 3: http://www.xbrl.org/2003/role/disclosureRef
-Topic 825
-SubTopic 10
-Name Accounting Standards Codification
-Section 50
-Paragraph 28
-Subparagraph (f)
-Publisher FASB
-URI https://asc.fasb.org//1943274/2147482907/825-10-50-28
Reference 4: http://www.xbrl.org/2003/role/disclosureRef
-Topic 470
-SubTopic 10
-Name Accounting Standards Codification
-Section S99
-Paragraph 1A
-Subparagraph (SX 210.13-01(a)(4)(i))
-Publisher FASB
-URI https://asc.fasb.org//1943274/2147480097/470-10-S99-1A
Reference 5: http://www.xbrl.org/2009/role/commonPracticeRef
-Topic 470
-SubTopic 10
-Name Accounting Standards Codification
-Section S99
-Paragraph 1A
-Subparagraph (SX 210.13-01(a)(4)(ii))
-Publisher FASB
-URI https://asc.fasb.org//1943274/2147480097/470-10-S99-1A
Reference 6: http://www.xbrl.org/2003/role/disclosureRef
-Topic 470
-SubTopic 10
-Name Accounting Standards Codification
-Section S99
-Paragraph 1A
-Subparagraph (SX 210.13-01(a)(4)(iii)(A))
-Publisher FASB
-URI https://asc.fasb.org//1943274/2147480097/470-10-S99-1A
Reference 7: http://www.xbrl.org/2003/role/disclosureRef
-Topic 470
-SubTopic 10
-Name Accounting Standards Codification
-Section S99
-Paragraph 1A
-Subparagraph (SX 210.13-01(a)(4)(iv))
-Publisher FASB
-URI https://asc.fasb.org//1943274/2147480097/470-10-S99-1A
Reference 8: http://www.xbrl.org/2003/role/disclosureRef
-Topic 470
-SubTopic 10
-Name Accounting Standards Codification
-Section S99
-Paragraph 1A
-Subparagraph (SX 210.13-01(a)(5))
-Publisher FASB
-URI https://asc.fasb.org//1943274/2147480097/470-10-S99-1A
Reference 9: http://www.xbrl.org/2003/role/disclosureRef
-Topic 470
-SubTopic 10
-Name Accounting Standards Codification
-Section S99
-Paragraph 1B
-Subparagraph (SX 210.13-02(a)(4)(i))
-Publisher FASB
-URI https://asc.fasb.org//1943274/2147480097/470-10-S99-1B
Reference 10: http://www.xbrl.org/2003/role/disclosureRef
-Topic 470
-SubTopic 10
-Name Accounting Standards Codification
-Section S99
-Paragraph 1B
-Subparagraph (SX 210.13-02(a)(4)(iii)(A))
-Publisher FASB
-URI https://asc.fasb.org//1943274/2147480097/470-10-S99-1B
Reference 11: http://www.xbrl.org/2003/role/disclosureRef
-Topic 470
-SubTopic 10
-Name Accounting Standards Codification
-Section S99
-Paragraph 1B
-Subparagraph (SX 210.13-02(a)(4)(iii)(B))
-Publisher FASB
-URI https://asc.fasb.org//1943274/2147480097/470-10-S99-1B
Reference 12: http://www.xbrl.org/2003/role/disclosureRef
-Topic 470
-SubTopic 10
-Name Accounting Standards Codification
-Section S99
-Paragraph 1B
-Subparagraph (SX 210.13-02(a)(4)(iv))
-Publisher FASB
-URI https://asc.fasb.org//1943274/2147480097/470-10-S99-1B
Reference 13: http://www.xbrl.org/2003/role/disclosureRef
-Topic 470
-SubTopic 10
-Name Accounting Standards Codification
-Section S99
-Paragraph 1B
-Subparagraph (SX 210.13-02(a)(5))
-Publisher FASB
-URI https://asc.fasb.org//1943274/2147480097/470-10-S99-1B
Reference 14: http://fasb.org/us-gaap/role/ref/legacyRef
-Topic 220
-SubTopic 10
-Name Accounting Standards Codification
-Section S99
-Paragraph 2
-Subparagraph (SX 210.5-03.2)
-Publisher FASB
-URI https://asc.fasb.org//1943274/2147483621/220-10-S99-2
| Name: |
us-gaap_CostOfRevenue |
| Namespace Prefix: |
us-gaap_ |
| Data Type: |
xbrli:monetaryItemType |
| Balance Type: |
debit |
| Period Type: |
duration |
|
| X |
- DefinitionTotal costs of sales and operating expenses for the period. Reference 1: http://fasb.org/us-gaap/role/ref/legacyRef
-Topic 220
-SubTopic 10
-Name Accounting Standards Codification
-Section S99
-Paragraph 2
-Subparagraph (SX 210.5-03)
-Publisher FASB
-URI https://asc.fasb.org//1943274/2147483621/220-10-S99-2
| Name: |
us-gaap_CostsAndExpenses |
| Namespace Prefix: |
us-gaap_ |
| Data Type: |
xbrli:monetaryItemType |
| Balance Type: |
debit |
| Period Type: |
duration |
|
| X |
- References
+ Details
| Name: |
us-gaap_CostsAndExpensesAbstract |
| Namespace Prefix: |
us-gaap_ |
| Data Type: |
xbrli:stringItemType |
| Balance Type: |
na |
| Period Type: |
duration |
|
| X |
- DefinitionThe amount of net income (loss) for the period per each share of common stock or unit outstanding during the reporting period. Reference 1: http://www.xbrl.org/2003/role/disclosureRef
-Topic 250
-SubTopic 10
-Name Accounting Standards Codification
-Section 50
-Paragraph 3
-Publisher FASB
-URI https://asc.fasb.org//1943274/2147483443/250-10-50-3
Reference 2: http://www.xbrl.org/2003/role/disclosureRef
-Topic 260
-SubTopic 10
-Name Accounting Standards Codification
-Section 55
-Paragraph 15
-Publisher FASB
-URI https://asc.fasb.org//1943274/2147482635/260-10-55-15
Reference 3: http://www.xbrl.org/2003/role/disclosureRef
-Topic 815
-SubTopic 40
-Name Accounting Standards Codification
-Section 65
-Paragraph 1
-Subparagraph (e)(4)
-Publisher FASB
-URI https://asc.fasb.org//1943274/2147480175/815-40-65-1
Reference 4: http://www.xbrl.org/2003/role/disclosureRef
-Topic 815
-SubTopic 40
-Name Accounting Standards Codification
-Section 65
-Paragraph 1
-Subparagraph (f)
-Publisher FASB
-URI https://asc.fasb.org//1943274/2147480175/815-40-65-1
Reference 5: http://www.xbrl.org/2003/role/disclosureRef
-Topic 250
-SubTopic 10
-Name Accounting Standards Codification
-Section 50
-Paragraph 11
-Subparagraph (a)
-Publisher FASB
-URI https://asc.fasb.org//1943274/2147483443/250-10-50-11
Reference 6: http://www.xbrl.org/2003/role/disclosureRef
-Topic 250
-SubTopic 10
-Name Accounting Standards Codification
-Section 50
-Paragraph 11
-Subparagraph (b)
-Publisher FASB
-URI https://asc.fasb.org//1943274/2147483443/250-10-50-11
Reference 7: http://www.xbrl.org/2003/role/disclosureRef
-Topic 250
-SubTopic 10
-Name Accounting Standards Codification
-Section 50
-Paragraph 7
-Subparagraph (a)
-Publisher FASB
-URI https://asc.fasb.org//1943274/2147483443/250-10-50-7
Reference 8: http://www.xbrl.org/2003/role/disclosureRef
-Topic 260
-SubTopic 10
-Name Accounting Standards Codification
-Section 45
-Paragraph 2
-Publisher FASB
-URI https://asc.fasb.org//1943274/2147482689/260-10-45-2
Reference 9: http://www.xbrl.org/2003/role/disclosureRef
-Topic 260
-SubTopic 10
-Name Accounting Standards Codification
-Section 45
-Paragraph 60B
-Subparagraph (d)
-Publisher FASB
-URI https://asc.fasb.org//1943274/2147482689/260-10-45-60B
Reference 10: http://www.xbrl.org/2003/role/disclosureRef
-Topic 250
-SubTopic 10
-Name Accounting Standards Codification
-Section 50
-Paragraph 4
-Publisher FASB
-URI https://asc.fasb.org//1943274/2147483443/250-10-50-4
Reference 11: http://www.xbrl.org/2003/role/disclosureRef
-Topic 260
-SubTopic 10
-Name Accounting Standards Codification
-Section 50
-Paragraph 1
-Subparagraph (a)
-Publisher FASB
-URI https://asc.fasb.org//1943274/2147482662/260-10-50-1
Reference 12: http://www.xbrl.org/2003/role/disclosureRef
-Topic 260
-SubTopic 10
-Name Accounting Standards Codification
-Section 45
-Paragraph 10
-Publisher FASB
-URI https://asc.fasb.org//1943274/2147482689/260-10-45-10
Reference 13: http://www.xbrl.org/2003/role/disclosureRef
-Topic 220
-SubTopic 10
-Name Accounting Standards Codification
-Section S99
-Paragraph 2
-Subparagraph (SX 210.5-03(25))
-Publisher FASB
-URI https://asc.fasb.org//1943274/2147483621/220-10-S99-2
Reference 14: http://www.xbrl.org/2003/role/disclosureRef
-Topic 942
-SubTopic 220
-Name Accounting Standards Codification
-Section S99
-Paragraph 1
-Subparagraph (SX 210.9-04(27))
-Publisher FASB
-URI https://asc.fasb.org//1943274/2147483589/942-220-S99-1
Reference 15: http://www.xbrl.org/2003/role/disclosureRef
-Topic 944
-SubTopic 220
-Name Accounting Standards Codification
-Section S99
-Paragraph 1
-Subparagraph (SX 210.7-04(23))
-Publisher FASB
-URI https://asc.fasb.org//1943274/2147483586/944-220-S99-1
Reference 16: http://www.xbrl.org/2003/role/exampleRef
-Topic 260
-SubTopic 10
-Name Accounting Standards Codification
-Section 55
-Paragraph 52
-Publisher FASB
-URI https://asc.fasb.org//1943274/2147482635/260-10-55-52
Reference 17: http://www.xbrl.org/2003/role/disclosureRef
-Topic 260
-SubTopic 10
-Name Accounting Standards Codification
-Section 45
-Paragraph 7
-Publisher FASB
-URI https://asc.fasb.org//1943274/2147482689/260-10-45-7
| Name: |
us-gaap_EarningsPerShareBasic |
| Namespace Prefix: |
us-gaap_ |
| Data Type: |
dtr-types:perShareItemType |
| Balance Type: |
na |
| Period Type: |
duration |
|
| X |
- DefinitionThe amount of net income (loss) for the period available to each share of common stock or common unit outstanding during the reporting period and to each share or unit that would have been outstanding assuming the issuance of common shares or units for all dilutive potential common shares or units outstanding during the reporting period. Reference 1: http://www.xbrl.org/2003/role/disclosureRef
-Topic 250
-SubTopic 10
-Name Accounting Standards Codification
-Section 50
-Paragraph 3
-Publisher FASB
-URI https://asc.fasb.org//1943274/2147483443/250-10-50-3
Reference 2: http://www.xbrl.org/2003/role/disclosureRef
-Topic 260
-SubTopic 10
-Name Accounting Standards Codification
-Section 55
-Paragraph 15
-Publisher FASB
-URI https://asc.fasb.org//1943274/2147482635/260-10-55-15
Reference 3: http://www.xbrl.org/2003/role/disclosureRef
-Topic 815
-SubTopic 40
-Name Accounting Standards Codification
-Section 65
-Paragraph 1
-Subparagraph (e)(4)
-Publisher FASB
-URI https://asc.fasb.org//1943274/2147480175/815-40-65-1
Reference 4: http://www.xbrl.org/2003/role/disclosureRef
-Topic 815
-SubTopic 40
-Name Accounting Standards Codification
-Section 65
-Paragraph 1
-Subparagraph (f)
-Publisher FASB
-URI https://asc.fasb.org//1943274/2147480175/815-40-65-1
Reference 5: http://www.xbrl.org/2003/role/disclosureRef
-Topic 250
-SubTopic 10
-Name Accounting Standards Codification
-Section 50
-Paragraph 11
-Subparagraph (a)
-Publisher FASB
-URI https://asc.fasb.org//1943274/2147483443/250-10-50-11
Reference 6: http://www.xbrl.org/2003/role/disclosureRef
-Topic 250
-SubTopic 10
-Name Accounting Standards Codification
-Section 50
-Paragraph 11
-Subparagraph (b)
-Publisher FASB
-URI https://asc.fasb.org//1943274/2147483443/250-10-50-11
Reference 7: http://www.xbrl.org/2003/role/disclosureRef
-Topic 250
-SubTopic 10
-Name Accounting Standards Codification
-Section 50
-Paragraph 7
-Subparagraph (a)
-Publisher FASB
-URI https://asc.fasb.org//1943274/2147483443/250-10-50-7
Reference 8: http://www.xbrl.org/2003/role/disclosureRef
-Topic 260
-SubTopic 10
-Name Accounting Standards Codification
-Section 45
-Paragraph 2
-Publisher FASB
-URI https://asc.fasb.org//1943274/2147482689/260-10-45-2
Reference 9: http://www.xbrl.org/2003/role/disclosureRef
-Topic 260
-SubTopic 10
-Name Accounting Standards Codification
-Section 45
-Paragraph 60B
-Subparagraph (d)
-Publisher FASB
-URI https://asc.fasb.org//1943274/2147482689/260-10-45-60B
Reference 10: http://www.xbrl.org/2003/role/disclosureRef
-Topic 250
-SubTopic 10
-Name Accounting Standards Codification
-Section 50
-Paragraph 4
-Publisher FASB
-URI https://asc.fasb.org//1943274/2147483443/250-10-50-4
Reference 11: http://www.xbrl.org/2003/role/disclosureRef
-Topic 260
-SubTopic 10
-Name Accounting Standards Codification
-Section 50
-Paragraph 1
-Subparagraph (a)
-Publisher FASB
-URI https://asc.fasb.org//1943274/2147482662/260-10-50-1
Reference 12: http://www.xbrl.org/2003/role/disclosureRef
-Topic 220
-SubTopic 10
-Name Accounting Standards Codification
-Section S99
-Paragraph 2
-Subparagraph (SX 210.5-03(25))
-Publisher FASB
-URI https://asc.fasb.org//1943274/2147483621/220-10-S99-2
Reference 13: http://www.xbrl.org/2003/role/disclosureRef
-Topic 942
-SubTopic 220
-Name Accounting Standards Codification
-Section S99
-Paragraph 1
-Subparagraph (SX 210.9-04(27))
-Publisher FASB
-URI https://asc.fasb.org//1943274/2147483589/942-220-S99-1
Reference 14: http://www.xbrl.org/2003/role/disclosureRef
-Topic 944
-SubTopic 220
-Name Accounting Standards Codification
-Section S99
-Paragraph 1
-Subparagraph (SX 210.7-04(23))
-Publisher FASB
-URI https://asc.fasb.org//1943274/2147483586/944-220-S99-1
Reference 15: http://www.xbrl.org/2003/role/exampleRef
-Topic 260
-SubTopic 10
-Name Accounting Standards Codification
-Section 55
-Paragraph 52
-Publisher FASB
-URI https://asc.fasb.org//1943274/2147482635/260-10-55-52
Reference 16: http://www.xbrl.org/2003/role/disclosureRef
-Topic 260
-SubTopic 10
-Name Accounting Standards Codification
-Section 45
-Paragraph 7
-Publisher FASB
-URI https://asc.fasb.org//1943274/2147482689/260-10-45-7
| Name: |
us-gaap_EarningsPerShareDiluted |
| Namespace Prefix: |
us-gaap_ |
| Data Type: |
dtr-types:perShareItemType |
| Balance Type: |
na |
| Period Type: |
duration |
|
| X |
- DefinitionThe aggregate total of expenses of managing and administering the affairs of an entity, including affiliates of the reporting entity, which are not directly or indirectly associated with the manufacture, sale or creation of a product or product line. Reference 1: http://www.xbrl.org/2003/role/disclosureRef
-Topic 946
-SubTopic 220
-Name Accounting Standards Codification
-Section S99
-Paragraph 1
-Subparagraph (SX 210.6-07(2)(a))
-Publisher FASB
-URI https://asc.fasb.org//1943274/2147483575/946-220-S99-1
Reference 2: http://fasb.org/us-gaap/role/ref/legacyRef
-Topic 220
-SubTopic 10
-Name Accounting Standards Codification
-Section S99
-Paragraph 2
-Subparagraph (SX 210.5-03.4)
-Publisher FASB
-URI https://asc.fasb.org//1943274/2147483621/220-10-S99-2
| Name: |
us-gaap_GeneralAndAdministrativeExpense |
| Namespace Prefix: |
us-gaap_ |
| Data Type: |
xbrli:monetaryItemType |
| Balance Type: |
debit |
| Period Type: |
duration |
|
| X |
- References
+ Details
| Name: |
us-gaap_IncomeStatementAbstract |
| Namespace Prefix: |
us-gaap_ |
| Data Type: |
xbrli:stringItemType |
| Balance Type: |
na |
| Period Type: |
duration |
|
| X |
- DefinitionAmount of the cost of borrowed funds accounted for as interest expense. Reference 1: http://www.xbrl.org/2003/role/exampleRef
-Topic 946
-SubTopic 830
-Name Accounting Standards Codification
-Section 55
-Paragraph 10
-Publisher FASB
-URI https://asc.fasb.org//1943274/2147480167/946-830-55-10
Reference 2: http://www.xbrl.org/2009/role/commonPracticeRef
-Topic 946
-SubTopic 220
-Name Accounting Standards Codification
-Section 45
-Paragraph 3
-Subparagraph (i)
-Publisher FASB
-URI https://asc.fasb.org//1943274/2147483581/946-220-45-3
Reference 3: http://www.xbrl.org/2003/role/disclosureRef
-Topic 946
-SubTopic 220
-Name Accounting Standards Codification
-Section S99
-Paragraph 1
-Subparagraph (SX 210.6-07(3))
-Publisher FASB
-URI https://asc.fasb.org//1943274/2147483575/946-220-S99-1
Reference 4: http://www.xbrl.org/2003/role/disclosureRef
-Topic 280
-SubTopic 10
-Name Accounting Standards Codification
-Section 50
-Paragraph 22
-Subparagraph (d)
-Publisher FASB
-URI https://asc.fasb.org//1943274/2147482810/280-10-50-22
Reference 5: http://fasb.org/us-gaap/role/ref/legacyRef
-Name Accounting Standards Codification
-Topic 835
-SubTopic 30
-Section 45
-Paragraph 3
-Publisher FASB
-URI https://asc.fasb.org//1943274/2147482925/835-30-45-3
Reference 6: http://fasb.org/us-gaap/role/ref/legacyRef
-Topic 942
-SubTopic 220
-Name Accounting Standards Codification
-Section S99
-Paragraph 1
-Subparagraph (SX 210.9-04.9)
-Publisher FASB
-URI https://asc.fasb.org//1943274/2147483589/942-220-S99-1
Reference 7: http://www.xbrl.org/2003/role/disclosureRef
-Topic 220
-SubTopic 10
-Name Accounting Standards Codification
-Section S99
-Paragraph 2
-Subparagraph (210.5-03(11))
-Publisher FASB
-URI https://asc.fasb.org//1943274/2147483621/220-10-S99-2
Reference 8: http://www.xbrl.org/2003/role/disclosureRef
-Topic 835
-SubTopic 20
-Name Accounting Standards Codification
-Section 50
-Paragraph 1
-Subparagraph (a)
-Publisher FASB
-URI https://asc.fasb.org//1943274/2147483013/835-20-50-1
| Name: |
us-gaap_InterestExpense |
| Namespace Prefix: |
us-gaap_ |
| Data Type: |
xbrli:monetaryItemType |
| Balance Type: |
debit |
| Period Type: |
duration |
|
| X |
- DefinitionThe portion of profit or loss for the period, net of income taxes, which is attributable to the parent. Reference 1: http://www.xbrl.org/2003/role/disclosureRef
-Topic 235
-SubTopic 10
-Name Accounting Standards Codification
-Section S99
-Paragraph 1
-Subparagraph (SX 210.4-08(g)(1)(ii))
-Publisher FASB
-URI https://asc.fasb.org//1943274/2147480678/235-10-S99-1
Reference 2: http://www.xbrl.org/2003/role/disclosureRef
-Topic 323
-SubTopic 10
-Name Accounting Standards Codification
-Section 50
-Paragraph 3
-Subparagraph (c)
-Publisher FASB
-URI https://asc.fasb.org//1943274/2147481687/323-10-50-3
Reference 3: http://www.xbrl.org/2003/role/disclosureRef
-Topic 825
-SubTopic 10
-Name Accounting Standards Codification
-Section 50
-Paragraph 28
-Subparagraph (f)
-Publisher FASB
-URI https://asc.fasb.org//1943274/2147482907/825-10-50-28
Reference 4: http://www.xbrl.org/2003/role/disclosureRef
-Topic 220
-SubTopic 10
-Name Accounting Standards Codification
-Section 50
-Paragraph 6
-Publisher FASB
-URI https://asc.fasb.org//1943274/2147482765/220-10-50-6
Reference 5: http://www.xbrl.org/2003/role/disclosureRef
-Topic 250
-SubTopic 10
-Name Accounting Standards Codification
-Section 50
-Paragraph 3
-Publisher FASB
-URI https://asc.fasb.org//1943274/2147483443/250-10-50-3
Reference 6: http://www.xbrl.org/2003/role/disclosureRef
-Topic 250
-SubTopic 10
-Name Accounting Standards Codification
-Section 50
-Paragraph 1
-Subparagraph (b)(2)
-Publisher FASB
-URI https://asc.fasb.org//1943274/2147483443/250-10-50-1
Reference 7: http://www.xbrl.org/2003/role/disclosureRef
-Topic 815
-SubTopic 40
-Name Accounting Standards Codification
-Section 65
-Paragraph 1
-Subparagraph (f)
-Publisher FASB
-URI https://asc.fasb.org//1943274/2147480175/815-40-65-1
Reference 8: http://www.xbrl.org/2003/role/disclosureRef
-Topic 250
-SubTopic 10
-Name Accounting Standards Codification
-Section 50
-Paragraph 8
-Publisher FASB
-URI https://asc.fasb.org//1943274/2147483443/250-10-50-8
Reference 9: http://www.xbrl.org/2003/role/disclosureRef
-Topic 250
-SubTopic 10
-Name Accounting Standards Codification
-Section 50
-Paragraph 9
-Publisher FASB
-URI https://asc.fasb.org//1943274/2147483443/250-10-50-9
Reference 10: http://www.xbrl.org/2003/role/disclosureRef
-Topic 250
-SubTopic 10
-Name Accounting Standards Codification
-Section 50
-Paragraph 11
-Subparagraph (a)
-Publisher FASB
-URI https://asc.fasb.org//1943274/2147483443/250-10-50-11
Reference 11: http://www.xbrl.org/2003/role/disclosureRef
-Topic 250
-SubTopic 10
-Name Accounting Standards Codification
-Section 50
-Paragraph 11
-Subparagraph (b)
-Publisher FASB
-URI https://asc.fasb.org//1943274/2147483443/250-10-50-11
Reference 12: http://www.xbrl.org/2003/role/disclosureRef
-Topic 250
-SubTopic 10
-Name Accounting Standards Codification
-Section 50
-Paragraph 4
-Publisher FASB
-URI https://asc.fasb.org//1943274/2147483443/250-10-50-4
Reference 13: http://www.xbrl.org/2003/role/exampleRef
-Topic 946
-SubTopic 830
-Name Accounting Standards Codification
-Section 55
-Paragraph 10
-Publisher FASB
-URI https://asc.fasb.org//1943274/2147480167/946-830-55-10
Reference 14: http://www.xbrl.org/2003/role/disclosureRef
-Topic 946
-SubTopic 220
-Name Accounting Standards Codification
-Section 45
-Paragraph 7
-Publisher FASB
-URI https://asc.fasb.org//1943274/2147483581/946-220-45-7
Reference 15: http://www.xbrl.org/2003/role/disclosureRef
-Topic 944
-SubTopic 220
-Name Accounting Standards Codification
-Section S99
-Paragraph 1
-Subparagraph (SX 210.7-04(18))
-Publisher FASB
-URI https://asc.fasb.org//1943274/2147483586/944-220-S99-1
Reference 16: http://www.xbrl.org/2003/role/disclosureRef
-Topic 280
-SubTopic 10
-Name Accounting Standards Codification
-Section 50
-Paragraph 22
-Publisher FASB
-URI https://asc.fasb.org//1943274/2147482810/280-10-50-22
Reference 17: http://www.xbrl.org/2003/role/disclosureRef
-Topic 946
-SubTopic 220
-Name Accounting Standards Codification
-Section S99
-Paragraph 1
-Subparagraph (SX 210.6-07(9))
-Publisher FASB
-URI https://asc.fasb.org//1943274/2147483575/946-220-S99-1
Reference 18: http://www.xbrl.org/2003/role/disclosureRef
-Topic 946
-SubTopic 220
-Name Accounting Standards Codification
-Section S99
-Paragraph 3
-Subparagraph (SX 210.6-09(1)(d))
-Publisher FASB
-URI https://asc.fasb.org//1943274/2147483575/946-220-S99-3
Reference 19: http://www.xbrl.org/2003/role/disclosureRef
-Topic 470
-SubTopic 10
-Name Accounting Standards Codification
-Section S99
-Paragraph 1A
-Subparagraph (SX 210.13-01(a)(4)(i))
-Publisher FASB
-URI https://asc.fasb.org//1943274/2147480097/470-10-S99-1A
Reference 20: http://www.xbrl.org/2009/role/commonPracticeRef
-Topic 470
-SubTopic 10
-Name Accounting Standards Codification
-Section S99
-Paragraph 1A
-Subparagraph (SX 210.13-01(a)(4)(ii))
-Publisher FASB
-URI https://asc.fasb.org//1943274/2147480097/470-10-S99-1A
Reference 21: http://www.xbrl.org/2003/role/disclosureRef
-Topic 470
-SubTopic 10
-Name Accounting Standards Codification
-Section S99
-Paragraph 1A
-Subparagraph (SX 210.13-01(a)(4)(iii)(A))
-Publisher FASB
-URI https://asc.fasb.org//1943274/2147480097/470-10-S99-1A
Reference 22: http://www.xbrl.org/2003/role/disclosureRef
-Topic 470
-SubTopic 10
-Name Accounting Standards Codification
-Section S99
-Paragraph 1A
-Subparagraph (SX 210.13-01(a)(4)(iv))
-Publisher FASB
-URI https://asc.fasb.org//1943274/2147480097/470-10-S99-1A
Reference 23: http://www.xbrl.org/2003/role/disclosureRef
-Topic 470
-SubTopic 10
-Name Accounting Standards Codification
-Section S99
-Paragraph 1A
-Subparagraph (SX 210.13-01(a)(5))
-Publisher FASB
-URI https://asc.fasb.org//1943274/2147480097/470-10-S99-1A
Reference 24: http://www.xbrl.org/2003/role/disclosureRef
-Topic 470
-SubTopic 10
-Name Accounting Standards Codification
-Section S99
-Paragraph 1B
-Subparagraph (SX 210.13-02(a)(4)(i))
-Publisher FASB
-URI https://asc.fasb.org//1943274/2147480097/470-10-S99-1B
Reference 25: http://www.xbrl.org/2003/role/disclosureRef
-Topic 470
-SubTopic 10
-Name Accounting Standards Codification
-Section S99
-Paragraph 1B
-Subparagraph (SX 210.13-02(a)(4)(iii)(A))
-Publisher FASB
-URI https://asc.fasb.org//1943274/2147480097/470-10-S99-1B
Reference 26: http://www.xbrl.org/2003/role/disclosureRef
-Topic 470
-SubTopic 10
-Name Accounting Standards Codification
-Section S99
-Paragraph 1B
-Subparagraph (SX 210.13-02(a)(4)(iii)(B))
-Publisher FASB
-URI https://asc.fasb.org//1943274/2147480097/470-10-S99-1B
Reference 27: http://www.xbrl.org/2003/role/disclosureRef
-Topic 470
-SubTopic 10
-Name Accounting Standards Codification
-Section S99
-Paragraph 1B
-Subparagraph (SX 210.13-02(a)(4)(iv))
-Publisher FASB
-URI https://asc.fasb.org//1943274/2147480097/470-10-S99-1B
Reference 28: http://www.xbrl.org/2003/role/disclosureRef
-Topic 470
-SubTopic 10
-Name Accounting Standards Codification
-Section S99
-Paragraph 1B
-Subparagraph (SX 210.13-02(a)(5))
-Publisher FASB
-URI https://asc.fasb.org//1943274/2147480097/470-10-S99-1B
Reference 29: http://www.xbrl.org/2003/role/disclosureRef
-Topic 280
-SubTopic 10
-Name Accounting Standards Codification
-Section 50
-Paragraph 30
-Subparagraph (b)
-Publisher FASB
-URI https://asc.fasb.org//1943274/2147482810/280-10-50-30
Reference 30: http://www.xbrl.org/2003/role/disclosureRef
-Topic 280
-SubTopic 10
-Name Accounting Standards Codification
-Section 50
-Paragraph 32
-Subparagraph (f)
-Publisher FASB
-URI https://asc.fasb.org//1943274/2147482810/280-10-50-32
Reference 31: http://www.xbrl.org/2003/role/disclosureRef
-Topic 260
-SubTopic 10
-Name Accounting Standards Codification
-Section 45
-Paragraph 60B
-Subparagraph (a)
-Publisher FASB
-URI https://asc.fasb.org//1943274/2147482689/260-10-45-60B
Reference 32: http://www.xbrl.org/2003/role/exampleRef
-Topic 280
-SubTopic 10
-Name Accounting Standards Codification
-Section 50
-Paragraph 31
-Publisher FASB
-URI https://asc.fasb.org//1943274/2147482810/280-10-50-31
Reference 33: http://www.xbrl.org/2003/role/disclosureRef
-Topic 280
-SubTopic 10
-Name Accounting Standards Codification
-Section 50
-Paragraph 32
-Subparagraph (c)
-Publisher FASB
-URI https://asc.fasb.org//1943274/2147482810/280-10-50-32
Reference 34: http://www.xbrl.org/2003/role/disclosureRef
-Topic 205
-SubTopic 20
-Name Accounting Standards Codification
-Section 50
-Paragraph 7
-Publisher FASB
-URI https://asc.fasb.org//1943274/2147483499/205-20-50-7
Reference 35: http://fasb.org/us-gaap/role/ref/legacyRef
-Topic 230
-SubTopic 10
-Name Accounting Standards Codification
-Section 45
-Paragraph 28
-Publisher FASB
-URI https://asc.fasb.org//1943274/2147482740/230-10-45-28
Reference 36: http://www.xbrl.org/2003/role/disclosureRef
-Topic 220
-SubTopic 10
-Name Accounting Standards Codification
-Section 45
-Paragraph 1A
-Subparagraph (a)
-Publisher FASB
-URI https://asc.fasb.org//1943274/2147482790/220-10-45-1A
Reference 37: http://www.xbrl.org/2003/role/disclosureRef
-Topic 220
-SubTopic 10
-Name Accounting Standards Codification
-Section 45
-Paragraph 1B
-Subparagraph (a)
-Publisher FASB
-URI https://asc.fasb.org//1943274/2147482790/220-10-45-1B
Reference 38: http://fasb.org/us-gaap/role/ref/legacyRef
-Topic 220
-SubTopic 10
-Name Accounting Standards Codification
-Section S99
-Paragraph 2
-Subparagraph (SX 210.5-03(20))
-Publisher FASB
-URI https://asc.fasb.org//1943274/2147483621/220-10-S99-2
Reference 39: http://fasb.org/us-gaap/role/ref/legacyRef
-Topic 942
-SubTopic 220
-Name Accounting Standards Codification
-Section S99
-Paragraph 1
-Subparagraph (SX 210.9-04(22))
-Publisher FASB
-URI https://asc.fasb.org//1943274/2147483589/942-220-S99-1
| Name: |
us-gaap_NetIncomeLoss |
| Namespace Prefix: |
us-gaap_ |
| Data Type: |
xbrli:monetaryItemType |
| Balance Type: |
credit |
| Period Type: |
duration |
|
| X |
- DefinitionThe net result for the period of deducting operating expenses from operating revenues. Reference 1: http://www.xbrl.org/2003/role/disclosureRef
-Topic 280
-SubTopic 10
-Name Accounting Standards Codification
-Section 50
-Paragraph 22
-Publisher FASB
-URI https://asc.fasb.org//1943274/2147482810/280-10-50-22
Reference 2: http://www.xbrl.org/2003/role/disclosureRef
-Topic 280
-SubTopic 10
-Name Accounting Standards Codification
-Section 50
-Paragraph 30
-Subparagraph (b)
-Publisher FASB
-URI https://asc.fasb.org//1943274/2147482810/280-10-50-30
Reference 3: http://www.xbrl.org/2003/role/disclosureRef
-Topic 280
-SubTopic 10
-Name Accounting Standards Codification
-Section 50
-Paragraph 32
-Subparagraph (f)
-Publisher FASB
-URI https://asc.fasb.org//1943274/2147482810/280-10-50-32
Reference 4: http://www.xbrl.org/2003/role/exampleRef
-Topic 280
-SubTopic 10
-Name Accounting Standards Codification
-Section 50
-Paragraph 31
-Publisher FASB
-URI https://asc.fasb.org//1943274/2147482810/280-10-50-31
Reference 5: http://www.xbrl.org/2003/role/disclosureRef
-Topic 280
-SubTopic 10
-Name Accounting Standards Codification
-Section 50
-Paragraph 32
-Subparagraph (c)
-Publisher FASB
-URI https://asc.fasb.org//1943274/2147482810/280-10-50-32
| Name: |
us-gaap_OperatingIncomeLoss |
| Namespace Prefix: |
us-gaap_ |
| Data Type: |
xbrli:monetaryItemType |
| Balance Type: |
credit |
| Period Type: |
duration |
|
| X |
- DefinitionAmount after tax and reclassification adjustments of gain (loss) on foreign currency translation adjustments, foreign currency transactions designated and effective as economic hedges of a net investment in a foreign entity and intra-entity foreign currency transactions that are of a long-term-investment nature, attributable to parent entity. Reference 1: http://fasb.org/us-gaap/role/ref/legacyRef
-Topic 810
-SubTopic 10
-Name Accounting Standards Codification
-Section 45
-Paragraph 19
-Publisher FASB
-URI https://asc.fasb.org//1943274/2147481231/810-10-45-19
Reference 2: http://fasb.org/us-gaap/role/ref/legacyRef
-Name Accounting Standards Codification
-Section 45
-Paragraph 20
-SubTopic 10
-Topic 810
-Publisher FASB
-URI https://asc.fasb.org//1943274/2147481231/810-10-45-20
Reference 3: http://fasb.org/us-gaap/role/ref/legacyRef
-Name Accounting Standards Codification
-Section 50
-Paragraph 1A
-Subparagraph (c)(3)
-SubTopic 10
-Topic 810
-Publisher FASB
-URI https://asc.fasb.org//1943274/2147481203/810-10-50-1A
| Name: |
us-gaap_OtherComprehensiveIncomeForeignCurrencyTransactionAndTranslationAdjustmentNetOfTaxPortionAttributableToParent |
| Namespace Prefix: |
us-gaap_ |
| Data Type: |
xbrli:monetaryItemType |
| Balance Type: |
credit |
| Period Type: |
duration |
|
| X |
- DefinitionAmount, excluding tax collected from customer, of revenue from satisfaction of performance obligation by transferring promised good or service to customer. Tax collected from customer is tax assessed by governmental authority that is both imposed on and concurrent with specific revenue-producing transaction, including, but not limited to, sales, use, value added and excise. Reference 1: http://www.xbrl.org/2003/role/disclosureRef
-Topic 924
-SubTopic 10
-Name Accounting Standards Codification
-Section S99
-Paragraph 1
-Subparagraph (SAB Topic 11.L)
-Publisher FASB
-URI https://asc.fasb.org//1943274/2147479941/924-10-S99-1
Reference 2: http://www.xbrl.org/2003/role/disclosureRef
-Topic 606
-SubTopic 10
-Name Accounting Standards Codification
-Section 50
-Paragraph 5
-Publisher FASB
-URI https://asc.fasb.org//1943274/2147479806/606-10-50-5
Reference 3: http://www.xbrl.org/2003/role/disclosureRef
-Topic 280
-SubTopic 10
-Name Accounting Standards Codification
-Section 50
-Paragraph 30
-Subparagraph (a)
-Publisher FASB
-URI https://asc.fasb.org//1943274/2147482810/280-10-50-30
Reference 4: http://www.xbrl.org/2003/role/disclosureRef
-Topic 280
-SubTopic 10
-Name Accounting Standards Codification
-Section 50
-Paragraph 42
-Publisher FASB
-URI https://asc.fasb.org//1943274/2147482810/280-10-50-42
Reference 5: http://www.xbrl.org/2003/role/disclosureRef
-Topic 280
-SubTopic 10
-Name Accounting Standards Codification
-Section 50
-Paragraph 22
-Subparagraph (b)
-Publisher FASB
-URI https://asc.fasb.org//1943274/2147482810/280-10-50-22
Reference 6: http://www.xbrl.org/2003/role/disclosureRef
-Topic 280
-SubTopic 10
-Name Accounting Standards Codification
-Section 50
-Paragraph 32
-Subparagraph (b)
-Publisher FASB
-URI https://asc.fasb.org//1943274/2147482810/280-10-50-32
Reference 7: http://www.xbrl.org/2003/role/disclosureRef
-Topic 280
-SubTopic 10
-Name Accounting Standards Codification
-Section 50
-Paragraph 40
-Publisher FASB
-URI https://asc.fasb.org//1943274/2147482810/280-10-50-40
Reference 8: http://www.xbrl.org/2003/role/disclosureRef
-Topic 280
-SubTopic 10
-Name Accounting Standards Codification
-Section 50
-Paragraph 22
-Subparagraph (a)
-Publisher FASB
-URI https://asc.fasb.org//1943274/2147482810/280-10-50-22
Reference 9: http://www.xbrl.org/2003/role/disclosureRef
-Topic 280
-SubTopic 10
-Name Accounting Standards Codification
-Section 50
-Paragraph 32
-Subparagraph (a)
-Publisher FASB
-URI https://asc.fasb.org//1943274/2147482810/280-10-50-32
Reference 10: http://www.xbrl.org/2003/role/disclosureRef
-Topic 280
-SubTopic 10
-Name Accounting Standards Codification
-Section 50
-Paragraph 41
-Subparagraph (a)
-Publisher FASB
-URI https://asc.fasb.org//1943274/2147482810/280-10-50-41
Reference 11: http://www.xbrl.org/2003/role/disclosureRef
-Topic 606
-SubTopic 10
-Name Accounting Standards Codification
-Section 50
-Paragraph 4
-Subparagraph (a)
-Publisher FASB
-URI https://asc.fasb.org//1943274/2147479806/606-10-50-4
| Name: |
us-gaap_RevenueFromContractWithCustomerExcludingAssessedTax |
| Namespace Prefix: |
us-gaap_ |
| Data Type: |
xbrli:monetaryItemType |
| Balance Type: |
credit |
| Period Type: |
duration |
|
| X |
- DefinitionThe average number of shares or units issued and outstanding that are used in calculating diluted EPS or earnings per unit (EPU), determined based on the timing of issuance of shares or units in the period. Reference 1: http://www.xbrl.org/2003/role/disclosureRef
-Topic 260
-SubTopic 10
-Name Accounting Standards Codification
-Section 50
-Paragraph 1
-Subparagraph (a)
-Publisher FASB
-URI https://asc.fasb.org//1943274/2147482662/260-10-50-1
Reference 2: http://www.xbrl.org/2003/role/disclosureRef
-Topic 260
-SubTopic 10
-Name Accounting Standards Codification
-Section 45
-Paragraph 16
-Publisher FASB
-URI https://asc.fasb.org//1943274/2147482689/260-10-45-16
| Name: |
us-gaap_WeightedAverageNumberOfDilutedSharesOutstanding |
| Namespace Prefix: |
us-gaap_ |
| Data Type: |
xbrli:sharesItemType |
| Balance Type: |
na |
| Period Type: |
duration |
|
| X |
- DefinitionNumber of [basic] shares or units, after adjustment for contingently issuable shares or units and other shares or units not deemed outstanding, determined by relating the portion of time within a reporting period that common shares or units have been outstanding to the total time in that period. Reference 1: http://www.xbrl.org/2003/role/disclosureRef
-Topic 260
-SubTopic 10
-Name Accounting Standards Codification
-Section 50
-Paragraph 1
-Subparagraph (a)
-Publisher FASB
-URI https://asc.fasb.org//1943274/2147482662/260-10-50-1
Reference 2: http://www.xbrl.org/2003/role/disclosureRef
-Topic 260
-SubTopic 10
-Name Accounting Standards Codification
-Section 45
-Paragraph 10
-Publisher FASB
-URI https://asc.fasb.org//1943274/2147482689/260-10-45-10
| Name: |
us-gaap_WeightedAverageNumberOfSharesOutstandingBasic |
| Namespace Prefix: |
us-gaap_ |
| Data Type: |
xbrli:sharesItemType |
| Balance Type: |
na |
| Period Type: |
duration |
|
v3.23.2
Condensed Consolidated Statements of Changes in Stockholders' Equity - USD ($)
|
Common Stock [Member] |
Additional Paid-in Capital [Member] |
Retained Earnings [Member] |
AOCI Attributable to Parent [Member] |
Total |
| Beginning balance, value at Mar. 31, 2022 |
$ 100
|
$ 784,083
|
$ (1,599,531)
|
$ (20,271)
|
$ (835,619)
|
| Beginning balance, shares at Mar. 31, 2022 |
1,000,000
|
|
|
|
|
| Net loss for the period |
|
|
(143,597)
|
|
(143,597)
|
| Foreign currency translation |
|
|
|
53,377
|
53,377
|
| Ending balance, value at Jun. 30, 2022 |
$ 100
|
784,083
|
(1,743,128)
|
33,106
|
(925,839)
|
| Ending balance, shares at Jun. 30, 2022 |
1,000,000
|
|
|
|
|
| Beginning balance, value at Mar. 31, 2023 |
$ 100
|
784,083
|
(2,134,207)
|
32,881
|
(1,317,143)
|
| Beginning balance, shares at Mar. 31, 2023 |
1,000,000
|
|
|
|
|
| Net loss for the period |
|
|
(46,813)
|
|
(46,813)
|
| Foreign currency translation |
|
|
|
80,173
|
80,173
|
| Ending balance, value at Jun. 30, 2023 |
$ 100
|
$ 784,083
|
$ (2,181,020)
|
$ 113,054
|
$ (1,283,783)
|
| Ending balance, shares at Jun. 30, 2023 |
1,000,000
|
|
|
|
|
| X |
- DefinitionThe portion of profit or loss for the period, net of income taxes, which is attributable to the parent. Reference 1: http://www.xbrl.org/2003/role/disclosureRef
-Topic 235
-SubTopic 10
-Name Accounting Standards Codification
-Section S99
-Paragraph 1
-Subparagraph (SX 210.4-08(g)(1)(ii))
-Publisher FASB
-URI https://asc.fasb.org//1943274/2147480678/235-10-S99-1
Reference 2: http://www.xbrl.org/2003/role/disclosureRef
-Topic 323
-SubTopic 10
-Name Accounting Standards Codification
-Section 50
-Paragraph 3
-Subparagraph (c)
-Publisher FASB
-URI https://asc.fasb.org//1943274/2147481687/323-10-50-3
Reference 3: http://www.xbrl.org/2003/role/disclosureRef
-Topic 825
-SubTopic 10
-Name Accounting Standards Codification
-Section 50
-Paragraph 28
-Subparagraph (f)
-Publisher FASB
-URI https://asc.fasb.org//1943274/2147482907/825-10-50-28
Reference 4: http://www.xbrl.org/2003/role/disclosureRef
-Topic 220
-SubTopic 10
-Name Accounting Standards Codification
-Section 50
-Paragraph 6
-Publisher FASB
-URI https://asc.fasb.org//1943274/2147482765/220-10-50-6
Reference 5: http://www.xbrl.org/2003/role/disclosureRef
-Topic 250
-SubTopic 10
-Name Accounting Standards Codification
-Section 50
-Paragraph 3
-Publisher FASB
-URI https://asc.fasb.org//1943274/2147483443/250-10-50-3
Reference 6: http://www.xbrl.org/2003/role/disclosureRef
-Topic 250
-SubTopic 10
-Name Accounting Standards Codification
-Section 50
-Paragraph 1
-Subparagraph (b)(2)
-Publisher FASB
-URI https://asc.fasb.org//1943274/2147483443/250-10-50-1
Reference 7: http://www.xbrl.org/2003/role/disclosureRef
-Topic 815
-SubTopic 40
-Name Accounting Standards Codification
-Section 65
-Paragraph 1
-Subparagraph (f)
-Publisher FASB
-URI https://asc.fasb.org//1943274/2147480175/815-40-65-1
Reference 8: http://www.xbrl.org/2003/role/disclosureRef
-Topic 250
-SubTopic 10
-Name Accounting Standards Codification
-Section 50
-Paragraph 8
-Publisher FASB
-URI https://asc.fasb.org//1943274/2147483443/250-10-50-8
Reference 9: http://www.xbrl.org/2003/role/disclosureRef
-Topic 250
-SubTopic 10
-Name Accounting Standards Codification
-Section 50
-Paragraph 9
-Publisher FASB
-URI https://asc.fasb.org//1943274/2147483443/250-10-50-9
Reference 10: http://www.xbrl.org/2003/role/disclosureRef
-Topic 250
-SubTopic 10
-Name Accounting Standards Codification
-Section 50
-Paragraph 11
-Subparagraph (a)
-Publisher FASB
-URI https://asc.fasb.org//1943274/2147483443/250-10-50-11
Reference 11: http://www.xbrl.org/2003/role/disclosureRef
-Topic 250
-SubTopic 10
-Name Accounting Standards Codification
-Section 50
-Paragraph 11
-Subparagraph (b)
-Publisher FASB
-URI https://asc.fasb.org//1943274/2147483443/250-10-50-11
Reference 12: http://www.xbrl.org/2003/role/disclosureRef
-Topic 250
-SubTopic 10
-Name Accounting Standards Codification
-Section 50
-Paragraph 4
-Publisher FASB
-URI https://asc.fasb.org//1943274/2147483443/250-10-50-4
Reference 13: http://www.xbrl.org/2003/role/exampleRef
-Topic 946
-SubTopic 830
-Name Accounting Standards Codification
-Section 55
-Paragraph 10
-Publisher FASB
-URI https://asc.fasb.org//1943274/2147480167/946-830-55-10
Reference 14: http://www.xbrl.org/2003/role/disclosureRef
-Topic 946
-SubTopic 220
-Name Accounting Standards Codification
-Section 45
-Paragraph 7
-Publisher FASB
-URI https://asc.fasb.org//1943274/2147483581/946-220-45-7
Reference 15: http://www.xbrl.org/2003/role/disclosureRef
-Topic 944
-SubTopic 220
-Name Accounting Standards Codification
-Section S99
-Paragraph 1
-Subparagraph (SX 210.7-04(18))
-Publisher FASB
-URI https://asc.fasb.org//1943274/2147483586/944-220-S99-1
Reference 16: http://www.xbrl.org/2003/role/disclosureRef
-Topic 280
-SubTopic 10
-Name Accounting Standards Codification
-Section 50
-Paragraph 22
-Publisher FASB
-URI https://asc.fasb.org//1943274/2147482810/280-10-50-22
Reference 17: http://www.xbrl.org/2003/role/disclosureRef
-Topic 946
-SubTopic 220
-Name Accounting Standards Codification
-Section S99
-Paragraph 1
-Subparagraph (SX 210.6-07(9))
-Publisher FASB
-URI https://asc.fasb.org//1943274/2147483575/946-220-S99-1
Reference 18: http://www.xbrl.org/2003/role/disclosureRef
-Topic 946
-SubTopic 220
-Name Accounting Standards Codification
-Section S99
-Paragraph 3
-Subparagraph (SX 210.6-09(1)(d))
-Publisher FASB
-URI https://asc.fasb.org//1943274/2147483575/946-220-S99-3
Reference 19: http://www.xbrl.org/2003/role/disclosureRef
-Topic 470
-SubTopic 10
-Name Accounting Standards Codification
-Section S99
-Paragraph 1A
-Subparagraph (SX 210.13-01(a)(4)(i))
-Publisher FASB
-URI https://asc.fasb.org//1943274/2147480097/470-10-S99-1A
Reference 20: http://www.xbrl.org/2009/role/commonPracticeRef
-Topic 470
-SubTopic 10
-Name Accounting Standards Codification
-Section S99
-Paragraph 1A
-Subparagraph (SX 210.13-01(a)(4)(ii))
-Publisher FASB
-URI https://asc.fasb.org//1943274/2147480097/470-10-S99-1A
Reference 21: http://www.xbrl.org/2003/role/disclosureRef
-Topic 470
-SubTopic 10
-Name Accounting Standards Codification
-Section S99
-Paragraph 1A
-Subparagraph (SX 210.13-01(a)(4)(iii)(A))
-Publisher FASB
-URI https://asc.fasb.org//1943274/2147480097/470-10-S99-1A
Reference 22: http://www.xbrl.org/2003/role/disclosureRef
-Topic 470
-SubTopic 10
-Name Accounting Standards Codification
-Section S99
-Paragraph 1A
-Subparagraph (SX 210.13-01(a)(4)(iv))
-Publisher FASB
-URI https://asc.fasb.org//1943274/2147480097/470-10-S99-1A
Reference 23: http://www.xbrl.org/2003/role/disclosureRef
-Topic 470
-SubTopic 10
-Name Accounting Standards Codification
-Section S99
-Paragraph 1A
-Subparagraph (SX 210.13-01(a)(5))
-Publisher FASB
-URI https://asc.fasb.org//1943274/2147480097/470-10-S99-1A
Reference 24: http://www.xbrl.org/2003/role/disclosureRef
-Topic 470
-SubTopic 10
-Name Accounting Standards Codification
-Section S99
-Paragraph 1B
-Subparagraph (SX 210.13-02(a)(4)(i))
-Publisher FASB
-URI https://asc.fasb.org//1943274/2147480097/470-10-S99-1B
Reference 25: http://www.xbrl.org/2003/role/disclosureRef
-Topic 470
-SubTopic 10
-Name Accounting Standards Codification
-Section S99
-Paragraph 1B
-Subparagraph (SX 210.13-02(a)(4)(iii)(A))
-Publisher FASB
-URI https://asc.fasb.org//1943274/2147480097/470-10-S99-1B
Reference 26: http://www.xbrl.org/2003/role/disclosureRef
-Topic 470
-SubTopic 10
-Name Accounting Standards Codification
-Section S99
-Paragraph 1B
-Subparagraph (SX 210.13-02(a)(4)(iii)(B))
-Publisher FASB
-URI https://asc.fasb.org//1943274/2147480097/470-10-S99-1B
Reference 27: http://www.xbrl.org/2003/role/disclosureRef
-Topic 470
-SubTopic 10
-Name Accounting Standards Codification
-Section S99
-Paragraph 1B
-Subparagraph (SX 210.13-02(a)(4)(iv))
-Publisher FASB
-URI https://asc.fasb.org//1943274/2147480097/470-10-S99-1B
Reference 28: http://www.xbrl.org/2003/role/disclosureRef
-Topic 470
-SubTopic 10
-Name Accounting Standards Codification
-Section S99
-Paragraph 1B
-Subparagraph (SX 210.13-02(a)(5))
-Publisher FASB
-URI https://asc.fasb.org//1943274/2147480097/470-10-S99-1B
Reference 29: http://www.xbrl.org/2003/role/disclosureRef
-Topic 280
-SubTopic 10
-Name Accounting Standards Codification
-Section 50
-Paragraph 30
-Subparagraph (b)
-Publisher FASB
-URI https://asc.fasb.org//1943274/2147482810/280-10-50-30
Reference 30: http://www.xbrl.org/2003/role/disclosureRef
-Topic 280
-SubTopic 10
-Name Accounting Standards Codification
-Section 50
-Paragraph 32
-Subparagraph (f)
-Publisher FASB
-URI https://asc.fasb.org//1943274/2147482810/280-10-50-32
Reference 31: http://www.xbrl.org/2003/role/disclosureRef
-Topic 260
-SubTopic 10
-Name Accounting Standards Codification
-Section 45
-Paragraph 60B
-Subparagraph (a)
-Publisher FASB
-URI https://asc.fasb.org//1943274/2147482689/260-10-45-60B
Reference 32: http://www.xbrl.org/2003/role/exampleRef
-Topic 280
-SubTopic 10
-Name Accounting Standards Codification
-Section 50
-Paragraph 31
-Publisher FASB
-URI https://asc.fasb.org//1943274/2147482810/280-10-50-31
Reference 33: http://www.xbrl.org/2003/role/disclosureRef
-Topic 280
-SubTopic 10
-Name Accounting Standards Codification
-Section 50
-Paragraph 32
-Subparagraph (c)
-Publisher FASB
-URI https://asc.fasb.org//1943274/2147482810/280-10-50-32
Reference 34: http://www.xbrl.org/2003/role/disclosureRef
-Topic 205
-SubTopic 20
-Name Accounting Standards Codification
-Section 50
-Paragraph 7
-Publisher FASB
-URI https://asc.fasb.org//1943274/2147483499/205-20-50-7
Reference 35: http://fasb.org/us-gaap/role/ref/legacyRef
-Topic 230
-SubTopic 10
-Name Accounting Standards Codification
-Section 45
-Paragraph 28
-Publisher FASB
-URI https://asc.fasb.org//1943274/2147482740/230-10-45-28
Reference 36: http://www.xbrl.org/2003/role/disclosureRef
-Topic 220
-SubTopic 10
-Name Accounting Standards Codification
-Section 45
-Paragraph 1A
-Subparagraph (a)
-Publisher FASB
-URI https://asc.fasb.org//1943274/2147482790/220-10-45-1A
Reference 37: http://www.xbrl.org/2003/role/disclosureRef
-Topic 220
-SubTopic 10
-Name Accounting Standards Codification
-Section 45
-Paragraph 1B
-Subparagraph (a)
-Publisher FASB
-URI https://asc.fasb.org//1943274/2147482790/220-10-45-1B
Reference 38: http://fasb.org/us-gaap/role/ref/legacyRef
-Topic 220
-SubTopic 10
-Name Accounting Standards Codification
-Section S99
-Paragraph 2
-Subparagraph (SX 210.5-03(20))
-Publisher FASB
-URI https://asc.fasb.org//1943274/2147483621/220-10-S99-2
Reference 39: http://fasb.org/us-gaap/role/ref/legacyRef
-Topic 942
-SubTopic 220
-Name Accounting Standards Codification
-Section S99
-Paragraph 1
-Subparagraph (SX 210.9-04(22))
-Publisher FASB
-URI https://asc.fasb.org//1943274/2147483589/942-220-S99-1
| Name: |
us-gaap_NetIncomeLoss |
| Namespace Prefix: |
us-gaap_ |
| Data Type: |
xbrli:monetaryItemType |
| Balance Type: |
credit |
| Period Type: |
duration |
|
| X |
- DefinitionAmount after tax and reclassification adjustments of gain (loss) on foreign currency translation adjustments, foreign currency transactions designated and effective as economic hedges of a net investment in a foreign entity and intra-entity foreign currency transactions that are of a long-term-investment nature, attributable to parent entity. Reference 1: http://fasb.org/us-gaap/role/ref/legacyRef
-Topic 810
-SubTopic 10
-Name Accounting Standards Codification
-Section 45
-Paragraph 19
-Publisher FASB
-URI https://asc.fasb.org//1943274/2147481231/810-10-45-19
Reference 2: http://fasb.org/us-gaap/role/ref/legacyRef
-Name Accounting Standards Codification
-Section 45
-Paragraph 20
-SubTopic 10
-Topic 810
-Publisher FASB
-URI https://asc.fasb.org//1943274/2147481231/810-10-45-20
Reference 3: http://fasb.org/us-gaap/role/ref/legacyRef
-Name Accounting Standards Codification
-Section 50
-Paragraph 1A
-Subparagraph (c)(3)
-SubTopic 10
-Topic 810
-Publisher FASB
-URI https://asc.fasb.org//1943274/2147481203/810-10-50-1A
| Name: |
us-gaap_OtherComprehensiveIncomeForeignCurrencyTransactionAndTranslationAdjustmentNetOfTaxPortionAttributableToParent |
| Namespace Prefix: |
us-gaap_ |
| Data Type: |
xbrli:monetaryItemType |
| Balance Type: |
credit |
| Period Type: |
duration |
|
| X |
- DefinitionNumber of shares issued which are neither cancelled nor held in the treasury.
| Name: |
us-gaap_SharesOutstanding |
| Namespace Prefix: |
us-gaap_ |
| Data Type: |
xbrli:sharesItemType |
| Balance Type: |
na |
| Period Type: |
instant |
|
| X |
- DefinitionAmount of equity (deficit) attributable to parent. Excludes temporary equity and equity attributable to noncontrolling interest. Reference 1: http://www.xbrl.org/2003/role/exampleRef
-Topic 852
-SubTopic 10
-Name Accounting Standards Codification
-Section 55
-Paragraph 10
-Publisher FASB
-URI https://asc.fasb.org//1943274/2147481372/852-10-55-10
Reference 2: http://www.xbrl.org/2003/role/exampleRef
-Topic 946
-SubTopic 830
-Name Accounting Standards Codification
-Section 55
-Paragraph 12
-Publisher FASB
-URI https://asc.fasb.org//1943274/2147480167/946-830-55-12
Reference 3: http://www.xbrl.org/2003/role/disclosureRef
-Topic 946
-SubTopic 210
-Name Accounting Standards Codification
-Section S99
-Paragraph 1
-Subparagraph (SX 210.6-04(19))
-Publisher FASB
-URI https://asc.fasb.org//1943274/2147479617/946-210-S99-1
Reference 4: http://www.xbrl.org/2003/role/disclosureRef
-Topic 946
-SubTopic 210
-Name Accounting Standards Codification
-Section S99
-Paragraph 2
-Subparagraph (SX 210.6-05(4))
-Publisher FASB
-URI https://asc.fasb.org//1943274/2147479617/946-210-S99-2
Reference 5: http://www.xbrl.org/2009/role/commonPracticeRef
-Topic 946
-SubTopic 220
-Name Accounting Standards Codification
-Section S99
-Paragraph 3
-Subparagraph (SX 210.6-09(4)(b))
-Publisher FASB
-URI https://asc.fasb.org//1943274/2147483575/946-220-S99-3
Reference 6: http://www.xbrl.org/2003/role/disclosureRef
-Topic 946
-SubTopic 220
-Name Accounting Standards Codification
-Section S99
-Paragraph 3
-Subparagraph (SX 210.6-09(6))
-Publisher FASB
-URI https://asc.fasb.org//1943274/2147483575/946-220-S99-3
Reference 7: http://www.xbrl.org/2003/role/disclosureRef
-Topic 946
-SubTopic 220
-Name Accounting Standards Codification
-Section S99
-Paragraph 3
-Subparagraph (SX 210.6-09(7))
-Publisher FASB
-URI https://asc.fasb.org//1943274/2147483575/946-220-S99-3
Reference 8: http://www.xbrl.org/2009/role/commonPracticeRef
-Topic 235
-SubTopic 10
-Name Accounting Standards Codification
-Section S99
-Paragraph 1
-Subparagraph (SX 210.4-08(g)(1)(ii))
-Publisher FASB
-URI https://asc.fasb.org//1943274/2147480678/235-10-S99-1
Reference 9: http://www.xbrl.org/2009/role/commonPracticeRef
-Topic 323
-SubTopic 10
-Name Accounting Standards Codification
-Section 50
-Paragraph 3
-Subparagraph (c)
-Publisher FASB
-URI https://asc.fasb.org//1943274/2147481687/323-10-50-3
Reference 10: http://www.xbrl.org/2009/role/commonPracticeRef
-Topic 825
-SubTopic 10
-Name Accounting Standards Codification
-Section 50
-Paragraph 28
-Subparagraph (f)
-Publisher FASB
-URI https://asc.fasb.org//1943274/2147482907/825-10-50-28
Reference 11: http://fasb.org/us-gaap/role/ref/legacyRef
-Topic 210
-SubTopic 10
-Name Accounting Standards Codification
-Section S99
-Paragraph 1
-Subparagraph (SX 210.5-02(29))
-Publisher FASB
-URI https://asc.fasb.org//1943274/2147480566/210-10-S99-1
Reference 12: http://fasb.org/us-gaap/role/ref/legacyRef
-Topic 210
-SubTopic 10
-Name Accounting Standards Codification
-Section S99
-Paragraph 1
-Subparagraph (SX 210.5-02(31))
-Publisher FASB
-URI https://asc.fasb.org//1943274/2147480566/210-10-S99-1
Reference 13: http://fasb.org/us-gaap/role/ref/legacyRef
-Topic 210
-SubTopic 10
-Name Accounting Standards Codification
-Section S99
-Paragraph 1
-Subparagraph (SX 210.5-02(30))
-Publisher FASB
-URI https://asc.fasb.org//1943274/2147480566/210-10-S99-1
Reference 14: http://fasb.org/us-gaap/role/ref/legacyRef
-Topic 310
-SubTopic 10
-Name Accounting Standards Codification
-Section S99
-Paragraph 2
-Subparagraph (SAB Topic 4.E)
-Publisher FASB
-URI https://asc.fasb.org//1943274/2147480418/310-10-S99-2
| Name: |
us-gaap_StockholdersEquity |
| Namespace Prefix: |
us-gaap_ |
| Data Type: |
xbrli:monetaryItemType |
| Balance Type: |
credit |
| Period Type: |
instant |
|
v3.23.2
Condensed Consolidated Statements of Cash Flows (Unaudited) - USD ($)
|
3 Months Ended |
Jun. 30, 2023 |
Jun. 30, 2022 |
| CASH FLOWS FROM OPERATING ACTIVITIES: |
|
|
| Net loss |
$ (46,813)
|
$ (143,597)
|
| Adjustments to reconcile net loss to net cash used in operating activities |
|
|
| Depreciation and amortization expenses |
2,027
|
31,882
|
| Write off of other receivables |
|
699
|
| Changes in operating assets and liabilities: |
|
|
| Increase in accounts receivable |
|
(740)
|
| Increase in inventories |
|
(3,664)
|
| Decrease/(Increase) in prepaid expenses and deposit |
6,370
|
(642)
|
| Decrease in accounts payable |
|
(57)
|
| Decrease in accrued liabilities and other payables |
(9,893)
|
(15,365)
|
| Change in operating lease liability |
|
(15,413)
|
| Net cash flows used in operating activities |
(48,309)
|
(146,897)
|
| CASH FLOWS FROM INVESTING ACTIVITY: |
|
|
| Purchase of plant and equipment |
|
(10,209)
|
| Net cash flows used in investing activity |
|
(10,209)
|
| CASH FLOWS FROM FINANCING ACTIVITIES: |
|
|
| Advance from directors |
15,050
|
126,075
|
| Principal repayments of bank loan |
(4,134)
|
(3,938)
|
| Net cash flows provided by financing activities |
10,916
|
122,137
|
| Effect of exchange rate changes |
31,205
|
26,602
|
| Net changes in cash and cash equivalents |
(6,188)
|
(8,367)
|
| Cash and cash equivalents, beginning of year |
9,868
|
18,561
|
| CASH AND CASH EQUIVALENTS, END OF YEAR |
3,680
|
10,194
|
| SUPPLEMENTAL CASH FLOWS INFORMATION |
|
|
| Income taxes paid |
|
|
| Interest paid |
$ 123
|
$ 514
|
| X |
- References
+ Details
| Name: |
us-gaap_AdjustmentsToReconcileNetIncomeLossToCashProvidedByUsedInOperatingActivitiesAbstract |
| Namespace Prefix: |
us-gaap_ |
| Data Type: |
xbrli:stringItemType |
| Balance Type: |
na |
| Period Type: |
duration |
|
| X |
- DefinitionAmount of cash and cash equivalents, and cash and cash equivalents restricted to withdrawal or usage; including, but not limited to, disposal group and discontinued operations. Cash includes, but is not limited to, currency on hand, demand deposits with banks or financial institutions, and other accounts with general characteristics of demand deposits. Cash equivalents include, but are not limited to, short-term, highly liquid investments that are both readily convertible to known amounts of cash and so near their maturity that they present insignificant risk of changes in value because of changes in interest rates. Reference 1: http://www.xbrl.org/2003/role/disclosureRef
-Topic 230
-SubTopic 10
-Name Accounting Standards Codification
-Section 50
-Paragraph 8
-Publisher FASB
-URI https://asc.fasb.org//1943274/2147482913/230-10-50-8
Reference 2: http://fasb.org/us-gaap/role/ref/legacyRef
-Topic 230
-SubTopic 10
-Name Accounting Standards Codification
-Section 45
-Paragraph 24
-Publisher FASB
-URI https://asc.fasb.org//1943274/2147482740/230-10-45-24
Reference 3: http://fasb.org/us-gaap/role/ref/legacyRef
-Name Accounting Standards Codification
-Topic 230
-SubTopic 10
-Section 45
-Paragraph 4
-Publisher FASB
-URI https://asc.fasb.org//1943274/2147482740/230-10-45-4
| Name: |
us-gaap_CashCashEquivalentsRestrictedCashAndRestrictedCashEquivalentsIncludingDisposalGroupAndDiscontinuedOperations |
| Namespace Prefix: |
us-gaap_ |
| Data Type: |
xbrli:monetaryItemType |
| Balance Type: |
debit |
| Period Type: |
instant |
|
| X |
- DefinitionAmount of increase (decrease) in cash, cash equivalents, and cash and cash equivalents restricted to withdrawal or usage; including effect from exchange rate change. Cash includes, but is not limited to, currency on hand, demand deposits with banks or financial institutions, and other accounts with general characteristics of demand deposits. Cash equivalents include, but are not limited to, short-term, highly liquid investments that are both readily convertible to known amounts of cash and so near their maturity that they present insignificant risk of changes in value because of changes in interest rates. Reference 1: http://fasb.org/us-gaap/role/ref/legacyRef
-Topic 230
-SubTopic 10
-Name Accounting Standards Codification
-Section 45
-Paragraph 24
-Publisher FASB
-URI https://asc.fasb.org//1943274/2147482740/230-10-45-24
Reference 2: http://fasb.org/us-gaap/role/ref/legacyRef
-Name Accounting Standards Codification
-Section 45
-Paragraph 1
-SubTopic 230
-Topic 830
-Publisher FASB
-URI https://asc.fasb.org//1943274/2147481877/830-230-45-1
| Name: |
us-gaap_CashCashEquivalentsRestrictedCashAndRestrictedCashEquivalentsPeriodIncreaseDecreaseIncludingExchangeRateEffect |
| Namespace Prefix: |
us-gaap_ |
| Data Type: |
xbrli:monetaryItemType |
| Balance Type: |
debit |
| Period Type: |
duration |
|
| X |
- DefinitionThe current period expense charged against earnings on long-lived, physical assets not used in production, and which are not intended for resale, to allocate or recognize the cost of such assets over their useful lives; or to record the reduction in book value of an intangible asset over the benefit period of such asset; or to reflect consumption during the period of an asset that is not used in production. Reference 1: http://fasb.org/us-gaap/role/ref/legacyRef
-Name Accounting Standards Codification
-Section 45
-Paragraph 28
-Subparagraph (b)
-SubTopic 10
-Topic 230
-Publisher FASB
-URI https://asc.fasb.org//1943274/2147482740/230-10-45-28
Reference 2: http://fasb.org/us-gaap/role/ref/legacyRef
-Name Accounting Standards Codification
-Topic 360
-SubTopic 10
-Section 50
-Paragraph 1
-Subparagraph (a)
-Publisher FASB
-URI https://asc.fasb.org//1943274/2147482099/360-10-50-1
| Name: |
us-gaap_DepreciationAndAmortization |
| Namespace Prefix: |
us-gaap_ |
| Data Type: |
xbrli:monetaryItemType |
| Balance Type: |
debit |
| Period Type: |
duration |
|
| X |
- DefinitionAmount of increase (decrease) from effect of exchange rate changes on cash and cash equivalents, and cash and cash equivalents restricted to withdrawal or usage; held in foreign currencies; including, but not limited to, disposal group and discontinued operations. Cash includes, but is not limited to, currency on hand, demand deposits with banks or financial institutions, and other accounts with general characteristics of demand deposits. Cash equivalents include, but are not limited to, short-term, highly liquid investments that are both readily convertible to known amounts of cash and so near their maturity that they present insignificant risk of changes in value because of changes in interest rates. Reference 1: http://www.xbrl.org/2009/role/commonPracticeRef
-Topic 830
-SubTopic 230
-Name Accounting Standards Codification
-Section 45
-Paragraph 1
-Publisher FASB
-URI https://asc.fasb.org//1943274/2147481877/830-230-45-1
| Name: |
us-gaap_EffectOfExchangeRateOnCashCashEquivalentsRestrictedCashAndRestrictedCashEquivalentsIncludingDisposalGroupAndDiscontinuedOperations |
| Namespace Prefix: |
us-gaap_ |
| Data Type: |
xbrli:monetaryItemType |
| Balance Type: |
debit |
| Period Type: |
duration |
|
| X |
- DefinitionThe increase (decrease) during the reporting period in the aggregate amount of liabilities incurred (and for which invoices have typically been received) and payable to vendors for goods and services received that are used in an entity's business. Reference 1: http://fasb.org/us-gaap/role/ref/legacyRef
-Name Accounting Standards Codification
-Section 45
-Paragraph 28
-Subparagraph (a)
-SubTopic 10
-Topic 230
-Publisher FASB
-URI https://asc.fasb.org//1943274/2147482740/230-10-45-28
| Name: |
us-gaap_IncreaseDecreaseInAccountsPayable |
| Namespace Prefix: |
us-gaap_ |
| Data Type: |
xbrli:monetaryItemType |
| Balance Type: |
debit |
| Period Type: |
duration |
|
| X |
- DefinitionThe increase (decrease) during the reporting period in amount due within one year (or one business cycle) from customers for the credit sale of goods and services. Reference 1: http://fasb.org/us-gaap/role/ref/legacyRef
-Name Accounting Standards Codification
-Section 45
-Paragraph 28
-Subparagraph (a)
-SubTopic 10
-Topic 230
-Publisher FASB
-URI https://asc.fasb.org//1943274/2147482740/230-10-45-28
| Name: |
us-gaap_IncreaseDecreaseInAccountsReceivable |
| Namespace Prefix: |
us-gaap_ |
| Data Type: |
xbrli:monetaryItemType |
| Balance Type: |
credit |
| Period Type: |
duration |
|
| X |
- DefinitionThe increase (decrease) during the reporting period in the aggregate value of all inventory held by the reporting entity, associated with underlying transactions that are classified as operating activities. Reference 1: http://fasb.org/us-gaap/role/ref/legacyRef
-Name Accounting Standards Codification
-Section 45
-Paragraph 28
-Subparagraph (a)
-SubTopic 10
-Topic 230
-Publisher FASB
-URI https://asc.fasb.org//1943274/2147482740/230-10-45-28
| Name: |
us-gaap_IncreaseDecreaseInInventories |
| Namespace Prefix: |
us-gaap_ |
| Data Type: |
xbrli:monetaryItemType |
| Balance Type: |
credit |
| Period Type: |
duration |
|
| X |
- References
+ Details
| Name: |
us-gaap_IncreaseDecreaseInOperatingCapitalAbstract |
| Namespace Prefix: |
us-gaap_ |
| Data Type: |
xbrli:stringItemType |
| Balance Type: |
na |
| Period Type: |
duration |
|
| X |
- DefinitionAmount of increase (decrease) in obligation for operating lease. Reference 1: http://www.xbrl.org/2009/role/commonPracticeRef
-Topic 230
-SubTopic 10
-Name Accounting Standards Codification
-Section 45
-Paragraph 28
-Subparagraph (a)
-Publisher FASB
-URI https://asc.fasb.org//1943274/2147482740/230-10-45-28
Reference 2: http://www.xbrl.org/2009/role/commonPracticeRef
-Name Accounting Standards Codification
-Section 50
-Paragraph 4
-Subparagraph (g)(1)
-SubTopic 20
-Topic 842
-Publisher FASB
-URI https://asc.fasb.org//1943274/2147478964/842-20-50-4
| Name: |
us-gaap_IncreaseDecreaseInOperatingLeaseLiability |
| Namespace Prefix: |
us-gaap_ |
| Data Type: |
xbrli:monetaryItemType |
| Balance Type: |
debit |
| Period Type: |
duration |
|
| X |
- DefinitionThe increase (decrease) during the reporting period in other obligations or expenses incurred but not yet paid. Reference 1: http://fasb.org/us-gaap/role/ref/legacyRef
-Name Accounting Standards Codification
-Section 45
-Paragraph 28
-Subparagraph (a)
-SubTopic 10
-Topic 230
-Publisher FASB
-URI https://asc.fasb.org//1943274/2147482740/230-10-45-28
| Name: |
us-gaap_IncreaseDecreaseInOtherAccountsPayableAndAccruedLiabilities |
| Namespace Prefix: |
us-gaap_ |
| Data Type: |
xbrli:monetaryItemType |
| Balance Type: |
debit |
| Period Type: |
duration |
|
| X |
- DefinitionAmount of increase (decrease) in prepaid expenses, and assets classified as other. Reference 1: http://fasb.org/us-gaap/role/ref/legacyRef
-Name Accounting Standards Codification
-Section 45
-Paragraph 28
-Subparagraph (a)
-SubTopic 10
-Topic 230
-Publisher FASB
-URI https://asc.fasb.org//1943274/2147482740/230-10-45-28
| Name: |
us-gaap_IncreaseDecreaseInPrepaidDeferredExpenseAndOtherAssets |
| Namespace Prefix: |
us-gaap_ |
| Data Type: |
xbrli:monetaryItemType |
| Balance Type: |
credit |
| Period Type: |
duration |
|
| X |
- DefinitionAmount of cash paid for interest, excluding capitalized interest, classified as operating activity. Includes, but is not limited to, payment to settle zero-coupon bond for accreted interest of debt discount and debt instrument with insignificant coupon interest rate in relation to effective interest rate of borrowing attributable to accreted interest of debt discount. Reference 1: http://www.xbrl.org/2003/role/disclosureRef
-Topic 230
-SubTopic 10
-Name Accounting Standards Codification
-Section 45
-Paragraph 17
-Subparagraph (d)
-Publisher FASB
-URI https://asc.fasb.org//1943274/2147482740/230-10-45-17
Reference 2: http://www.xbrl.org/2003/role/disclosureRef
-Topic 230
-SubTopic 10
-Name Accounting Standards Codification
-Section 45
-Paragraph 25
-Subparagraph (e)
-Publisher FASB
-URI https://asc.fasb.org//1943274/2147482740/230-10-45-25
Reference 3: http://www.xbrl.org/2003/role/disclosureRef
-Topic 230
-SubTopic 10
-Name Accounting Standards Codification
-Section 50
-Paragraph 2
-Publisher FASB
-URI https://asc.fasb.org//1943274/2147482913/230-10-50-2
| Name: |
us-gaap_InterestPaidNet |
| Namespace Prefix: |
us-gaap_ |
| Data Type: |
xbrli:monetaryItemType |
| Balance Type: |
credit |
| Period Type: |
duration |
|
| X |
- DefinitionAmount of cash inflow (outflow) from financing activities, including discontinued operations. Financing activity cash flows include obtaining resources from owners and providing them with a return on, and a return of, their investment; borrowing money and repaying amounts borrowed, or settling the obligation; and obtaining and paying for other resources obtained from creditors on long-term credit. Reference 1: http://www.xbrl.org/2003/role/disclosureRef
-Topic 230
-SubTopic 10
-Name Accounting Standards Codification
-Section 45
-Paragraph 24
-Publisher FASB
-URI https://asc.fasb.org//1943274/2147482740/230-10-45-24
| Name: |
us-gaap_NetCashProvidedByUsedInFinancingActivities |
| Namespace Prefix: |
us-gaap_ |
| Data Type: |
xbrli:monetaryItemType |
| Balance Type: |
debit |
| Period Type: |
duration |
|
| X |
- References
+ Details
| Name: |
us-gaap_NetCashProvidedByUsedInFinancingActivitiesAbstract |
| Namespace Prefix: |
us-gaap_ |
| Data Type: |
xbrli:stringItemType |
| Balance Type: |
na |
| Period Type: |
duration |
|
| X |
- DefinitionAmount of cash inflow (outflow) from investing activities, including discontinued operations. Investing activity cash flows include making and collecting loans and acquiring and disposing of debt or equity instruments and property, plant, and equipment and other productive assets. Reference 1: http://www.xbrl.org/2003/role/disclosureRef
-Topic 230
-SubTopic 10
-Name Accounting Standards Codification
-Section 45
-Paragraph 24
-Publisher FASB
-URI https://asc.fasb.org//1943274/2147482740/230-10-45-24
| Name: |
us-gaap_NetCashProvidedByUsedInInvestingActivities |
| Namespace Prefix: |
us-gaap_ |
| Data Type: |
xbrli:monetaryItemType |
| Balance Type: |
debit |
| Period Type: |
duration |
|
| X |
- References
+ Details
| Name: |
us-gaap_NetCashProvidedByUsedInInvestingActivitiesAbstract |
| Namespace Prefix: |
us-gaap_ |
| Data Type: |
xbrli:stringItemType |
| Balance Type: |
na |
| Period Type: |
duration |
|
| X |
- DefinitionAmount of cash inflow (outflow) from operating activities, including discontinued operations. Operating activity cash flows include transactions, adjustments, and changes in value not defined as investing or financing activities. Reference 1: http://fasb.org/us-gaap/role/ref/legacyRef
-Topic 230
-SubTopic 10
-Name Accounting Standards Codification
-Section 45
-Paragraph 28
-Publisher FASB
-URI https://asc.fasb.org//1943274/2147482740/230-10-45-28
Reference 2: http://fasb.org/us-gaap/role/ref/legacyRef
-Topic 230
-SubTopic 10
-Name Accounting Standards Codification
-Section 45
-Paragraph 24
-Publisher FASB
-URI https://asc.fasb.org//1943274/2147482740/230-10-45-24
Reference 3: http://fasb.org/us-gaap/role/ref/legacyRef
-Topic 230
-SubTopic 10
-Name Accounting Standards Codification
-Section 45
-Paragraph 25
-Publisher FASB
-URI https://asc.fasb.org//1943274/2147482740/230-10-45-25
| Name: |
us-gaap_NetCashProvidedByUsedInOperatingActivities |
| Namespace Prefix: |
us-gaap_ |
| Data Type: |
xbrli:monetaryItemType |
| Balance Type: |
na |
| Period Type: |
duration |
|
| X |
- References
+ Details
| Name: |
us-gaap_NetCashProvidedByUsedInOperatingActivitiesAbstract |
| Namespace Prefix: |
us-gaap_ |
| Data Type: |
xbrli:stringItemType |
| Balance Type: |
na |
| Period Type: |
duration |
|
| X |
- DefinitionThe portion of profit or loss for the period, net of income taxes, which is attributable to the parent. Reference 1: http://www.xbrl.org/2003/role/disclosureRef
-Topic 235
-SubTopic 10
-Name Accounting Standards Codification
-Section S99
-Paragraph 1
-Subparagraph (SX 210.4-08(g)(1)(ii))
-Publisher FASB
-URI https://asc.fasb.org//1943274/2147480678/235-10-S99-1
Reference 2: http://www.xbrl.org/2003/role/disclosureRef
-Topic 323
-SubTopic 10
-Name Accounting Standards Codification
-Section 50
-Paragraph 3
-Subparagraph (c)
-Publisher FASB
-URI https://asc.fasb.org//1943274/2147481687/323-10-50-3
Reference 3: http://www.xbrl.org/2003/role/disclosureRef
-Topic 825
-SubTopic 10
-Name Accounting Standards Codification
-Section 50
-Paragraph 28
-Subparagraph (f)
-Publisher FASB
-URI https://asc.fasb.org//1943274/2147482907/825-10-50-28
Reference 4: http://www.xbrl.org/2003/role/disclosureRef
-Topic 220
-SubTopic 10
-Name Accounting Standards Codification
-Section 50
-Paragraph 6
-Publisher FASB
-URI https://asc.fasb.org//1943274/2147482765/220-10-50-6
Reference 5: http://www.xbrl.org/2003/role/disclosureRef
-Topic 250
-SubTopic 10
-Name Accounting Standards Codification
-Section 50
-Paragraph 3
-Publisher FASB
-URI https://asc.fasb.org//1943274/2147483443/250-10-50-3
Reference 6: http://www.xbrl.org/2003/role/disclosureRef
-Topic 250
-SubTopic 10
-Name Accounting Standards Codification
-Section 50
-Paragraph 1
-Subparagraph (b)(2)
-Publisher FASB
-URI https://asc.fasb.org//1943274/2147483443/250-10-50-1
Reference 7: http://www.xbrl.org/2003/role/disclosureRef
-Topic 815
-SubTopic 40
-Name Accounting Standards Codification
-Section 65
-Paragraph 1
-Subparagraph (f)
-Publisher FASB
-URI https://asc.fasb.org//1943274/2147480175/815-40-65-1
Reference 8: http://www.xbrl.org/2003/role/disclosureRef
-Topic 250
-SubTopic 10
-Name Accounting Standards Codification
-Section 50
-Paragraph 8
-Publisher FASB
-URI https://asc.fasb.org//1943274/2147483443/250-10-50-8
Reference 9: http://www.xbrl.org/2003/role/disclosureRef
-Topic 250
-SubTopic 10
-Name Accounting Standards Codification
-Section 50
-Paragraph 9
-Publisher FASB
-URI https://asc.fasb.org//1943274/2147483443/250-10-50-9
Reference 10: http://www.xbrl.org/2003/role/disclosureRef
-Topic 250
-SubTopic 10
-Name Accounting Standards Codification
-Section 50
-Paragraph 11
-Subparagraph (a)
-Publisher FASB
-URI https://asc.fasb.org//1943274/2147483443/250-10-50-11
Reference 11: http://www.xbrl.org/2003/role/disclosureRef
-Topic 250
-SubTopic 10
-Name Accounting Standards Codification
-Section 50
-Paragraph 11
-Subparagraph (b)
-Publisher FASB
-URI https://asc.fasb.org//1943274/2147483443/250-10-50-11
Reference 12: http://www.xbrl.org/2003/role/disclosureRef
-Topic 250
-SubTopic 10
-Name Accounting Standards Codification
-Section 50
-Paragraph 4
-Publisher FASB
-URI https://asc.fasb.org//1943274/2147483443/250-10-50-4
Reference 13: http://www.xbrl.org/2003/role/exampleRef
-Topic 946
-SubTopic 830
-Name Accounting Standards Codification
-Section 55
-Paragraph 10
-Publisher FASB
-URI https://asc.fasb.org//1943274/2147480167/946-830-55-10
Reference 14: http://www.xbrl.org/2003/role/disclosureRef
-Topic 946
-SubTopic 220
-Name Accounting Standards Codification
-Section 45
-Paragraph 7
-Publisher FASB
-URI https://asc.fasb.org//1943274/2147483581/946-220-45-7
Reference 15: http://www.xbrl.org/2003/role/disclosureRef
-Topic 944
-SubTopic 220
-Name Accounting Standards Codification
-Section S99
-Paragraph 1
-Subparagraph (SX 210.7-04(18))
-Publisher FASB
-URI https://asc.fasb.org//1943274/2147483586/944-220-S99-1
Reference 16: http://www.xbrl.org/2003/role/disclosureRef
-Topic 280
-SubTopic 10
-Name Accounting Standards Codification
-Section 50
-Paragraph 22
-Publisher FASB
-URI https://asc.fasb.org//1943274/2147482810/280-10-50-22
Reference 17: http://www.xbrl.org/2003/role/disclosureRef
-Topic 946
-SubTopic 220
-Name Accounting Standards Codification
-Section S99
-Paragraph 1
-Subparagraph (SX 210.6-07(9))
-Publisher FASB
-URI https://asc.fasb.org//1943274/2147483575/946-220-S99-1
Reference 18: http://www.xbrl.org/2003/role/disclosureRef
-Topic 946
-SubTopic 220
-Name Accounting Standards Codification
-Section S99
-Paragraph 3
-Subparagraph (SX 210.6-09(1)(d))
-Publisher FASB
-URI https://asc.fasb.org//1943274/2147483575/946-220-S99-3
Reference 19: http://www.xbrl.org/2003/role/disclosureRef
-Topic 470
-SubTopic 10
-Name Accounting Standards Codification
-Section S99
-Paragraph 1A
-Subparagraph (SX 210.13-01(a)(4)(i))
-Publisher FASB
-URI https://asc.fasb.org//1943274/2147480097/470-10-S99-1A
Reference 20: http://www.xbrl.org/2009/role/commonPracticeRef
-Topic 470
-SubTopic 10
-Name Accounting Standards Codification
-Section S99
-Paragraph 1A
-Subparagraph (SX 210.13-01(a)(4)(ii))
-Publisher FASB
-URI https://asc.fasb.org//1943274/2147480097/470-10-S99-1A
Reference 21: http://www.xbrl.org/2003/role/disclosureRef
-Topic 470
-SubTopic 10
-Name Accounting Standards Codification
-Section S99
-Paragraph 1A
-Subparagraph (SX 210.13-01(a)(4)(iii)(A))
-Publisher FASB
-URI https://asc.fasb.org//1943274/2147480097/470-10-S99-1A
Reference 22: http://www.xbrl.org/2003/role/disclosureRef
-Topic 470
-SubTopic 10
-Name Accounting Standards Codification
-Section S99
-Paragraph 1A
-Subparagraph (SX 210.13-01(a)(4)(iv))
-Publisher FASB
-URI https://asc.fasb.org//1943274/2147480097/470-10-S99-1A
Reference 23: http://www.xbrl.org/2003/role/disclosureRef
-Topic 470
-SubTopic 10
-Name Accounting Standards Codification
-Section S99
-Paragraph 1A
-Subparagraph (SX 210.13-01(a)(5))
-Publisher FASB
-URI https://asc.fasb.org//1943274/2147480097/470-10-S99-1A
Reference 24: http://www.xbrl.org/2003/role/disclosureRef
-Topic 470
-SubTopic 10
-Name Accounting Standards Codification
-Section S99
-Paragraph 1B
-Subparagraph (SX 210.13-02(a)(4)(i))
-Publisher FASB
-URI https://asc.fasb.org//1943274/2147480097/470-10-S99-1B
Reference 25: http://www.xbrl.org/2003/role/disclosureRef
-Topic 470
-SubTopic 10
-Name Accounting Standards Codification
-Section S99
-Paragraph 1B
-Subparagraph (SX 210.13-02(a)(4)(iii)(A))
-Publisher FASB
-URI https://asc.fasb.org//1943274/2147480097/470-10-S99-1B
Reference 26: http://www.xbrl.org/2003/role/disclosureRef
-Topic 470
-SubTopic 10
-Name Accounting Standards Codification
-Section S99
-Paragraph 1B
-Subparagraph (SX 210.13-02(a)(4)(iii)(B))
-Publisher FASB
-URI https://asc.fasb.org//1943274/2147480097/470-10-S99-1B
Reference 27: http://www.xbrl.org/2003/role/disclosureRef
-Topic 470
-SubTopic 10
-Name Accounting Standards Codification
-Section S99
-Paragraph 1B
-Subparagraph (SX 210.13-02(a)(4)(iv))
-Publisher FASB
-URI https://asc.fasb.org//1943274/2147480097/470-10-S99-1B
Reference 28: http://www.xbrl.org/2003/role/disclosureRef
-Topic 470
-SubTopic 10
-Name Accounting Standards Codification
-Section S99
-Paragraph 1B
-Subparagraph (SX 210.13-02(a)(5))
-Publisher FASB
-URI https://asc.fasb.org//1943274/2147480097/470-10-S99-1B
Reference 29: http://www.xbrl.org/2003/role/disclosureRef
-Topic 280
-SubTopic 10
-Name Accounting Standards Codification
-Section 50
-Paragraph 30
-Subparagraph (b)
-Publisher FASB
-URI https://asc.fasb.org//1943274/2147482810/280-10-50-30
Reference 30: http://www.xbrl.org/2003/role/disclosureRef
-Topic 280
-SubTopic 10
-Name Accounting Standards Codification
-Section 50
-Paragraph 32
-Subparagraph (f)
-Publisher FASB
-URI https://asc.fasb.org//1943274/2147482810/280-10-50-32
Reference 31: http://www.xbrl.org/2003/role/disclosureRef
-Topic 260
-SubTopic 10
-Name Accounting Standards Codification
-Section 45
-Paragraph 60B
-Subparagraph (a)
-Publisher FASB
-URI https://asc.fasb.org//1943274/2147482689/260-10-45-60B
Reference 32: http://www.xbrl.org/2003/role/exampleRef
-Topic 280
-SubTopic 10
-Name Accounting Standards Codification
-Section 50
-Paragraph 31
-Publisher FASB
-URI https://asc.fasb.org//1943274/2147482810/280-10-50-31
Reference 33: http://www.xbrl.org/2003/role/disclosureRef
-Topic 280
-SubTopic 10
-Name Accounting Standards Codification
-Section 50
-Paragraph 32
-Subparagraph (c)
-Publisher FASB
-URI https://asc.fasb.org//1943274/2147482810/280-10-50-32
Reference 34: http://www.xbrl.org/2003/role/disclosureRef
-Topic 205
-SubTopic 20
-Name Accounting Standards Codification
-Section 50
-Paragraph 7
-Publisher FASB
-URI https://asc.fasb.org//1943274/2147483499/205-20-50-7
Reference 35: http://fasb.org/us-gaap/role/ref/legacyRef
-Topic 230
-SubTopic 10
-Name Accounting Standards Codification
-Section 45
-Paragraph 28
-Publisher FASB
-URI https://asc.fasb.org//1943274/2147482740/230-10-45-28
Reference 36: http://www.xbrl.org/2003/role/disclosureRef
-Topic 220
-SubTopic 10
-Name Accounting Standards Codification
-Section 45
-Paragraph 1A
-Subparagraph (a)
-Publisher FASB
-URI https://asc.fasb.org//1943274/2147482790/220-10-45-1A
Reference 37: http://www.xbrl.org/2003/role/disclosureRef
-Topic 220
-SubTopic 10
-Name Accounting Standards Codification
-Section 45
-Paragraph 1B
-Subparagraph (a)
-Publisher FASB
-URI https://asc.fasb.org//1943274/2147482790/220-10-45-1B
Reference 38: http://fasb.org/us-gaap/role/ref/legacyRef
-Topic 220
-SubTopic 10
-Name Accounting Standards Codification
-Section S99
-Paragraph 2
-Subparagraph (SX 210.5-03(20))
-Publisher FASB
-URI https://asc.fasb.org//1943274/2147483621/220-10-S99-2
Reference 39: http://fasb.org/us-gaap/role/ref/legacyRef
-Topic 942
-SubTopic 220
-Name Accounting Standards Codification
-Section S99
-Paragraph 1
-Subparagraph (SX 210.9-04(22))
-Publisher FASB
-URI https://asc.fasb.org//1943274/2147483589/942-220-S99-1
| Name: |
us-gaap_NetIncomeLoss |
| Namespace Prefix: |
us-gaap_ |
| Data Type: |
xbrli:monetaryItemType |
| Balance Type: |
credit |
| Period Type: |
duration |
|
| X |
- DefinitionThe cash outflow associated with the acquisition of long-lived, physical assets that are used in the normal conduct of business to produce goods and services and not intended for resale; includes cash outflows to pay for construction of self-constructed assets. Reference 1: http://fasb.org/us-gaap/role/ref/legacyRef
-Topic 230
-SubTopic 10
-Name Accounting Standards Codification
-Section 45
-Paragraph 13
-Subparagraph (c)
-Publisher FASB
-URI https://asc.fasb.org//1943274/2147482740/230-10-45-13
| Name: |
us-gaap_PaymentsToAcquirePropertyPlantAndEquipment |
| Namespace Prefix: |
us-gaap_ |
| Data Type: |
xbrli:monetaryItemType |
| Balance Type: |
credit |
| Period Type: |
duration |
|
| X |
- DefinitionAmount of expense related to credit loss from transactions other than loan and lease transactions. Reference 1: http://fasb.org/us-gaap/role/ref/legacyRef
-Name Accounting Standards Codification
-Section 45
-Paragraph 28
-Subparagraph (a)
-SubTopic 10
-Topic 230
-Publisher FASB
-URI https://asc.fasb.org//1943274/2147482740/230-10-45-28
Reference 2: http://fasb.org/us-gaap/role/ref/legacyRef
-Topic 942
-SubTopic 220
-Name Accounting Standards Codification
-Section S99
-Paragraph 1
-Subparagraph (SX 210.9-04(11))
-Publisher FASB
-URI https://asc.fasb.org//1943274/2147483589/942-220-S99-1
| Name: |
us-gaap_ProvisionForOtherCreditLosses |
| Namespace Prefix: |
us-gaap_ |
| Data Type: |
xbrli:monetaryItemType |
| Balance Type: |
debit |
| Period Type: |
duration |
|
| X |
- DefinitionThe cash outflow to settle a bank borrowing during the year. Reference 1: http://fasb.org/us-gaap/role/ref/legacyRef
-Name Accounting Standards Codification
-Topic 230
-SubTopic 10
-Section 45
-Paragraph 15
-Subparagraph (b)
-Publisher FASB
-URI https://asc.fasb.org//1943274/2147482740/230-10-45-15
| Name: |
us-gaap_RepaymentsOfBankDebt |
| Namespace Prefix: |
us-gaap_ |
| Data Type: |
xbrli:monetaryItemType |
| Balance Type: |
credit |
| Period Type: |
duration |
|
v3.23.2
ORGANIZATION AND BUSINESS BACKGROUND
|
3 Months Ended |
Jun. 30, 2023 |
|---|
| Organization, Consolidation and Presentation of Financial Statements [Abstract] |
|
| ORGANIZATION AND BUSINESS BACKGROUND |
1. ORGANIZATION AND BUSINESS BACKGROUND
Synergy
Empire Limited (“the Company”) was incorporated under the laws of the State of Nevada on October 17, 2018. We have historically
conducted our business through Lucky Star F&B Sdn. Bhd. and SH Dessert Sdn. Bhd, both are private limited liability company, incorporated
in Malaysia.
On
January 16, 2019, the Company acquired 100% of the equity interests of Synergy Empire Holding Limited, a company incorporated in Republic
of the Marshall Islands (“Synergy Empire Marshall”).
On
December 31, 2018, Synergy Empire Marshall acquired 100% of Synergy Empire Limited, a limited liability company incorporated in Hong
Kong (“Synergy Empire HK”).
On
February 21, 2019, Synergy Empire HK acquired 100% of the equity interests of Lucky Star F&B Sdn. Bhd., a limited liability company
incorporated in Malaysia (“Lucky Star”).
Lucky
Star acquired 100% of the equity interests of SH Dessert Sdn. Bhd., a limited liability company incorporated in Malaysia (“SH Dessert”)
by Lucky Star on February 19, 2016.
On
February 26, 2021, Synergy Empire Marshall acquired 100% of Lucky Star F&B Sdn. Bhd from Synergy Empire HK. Subsequently on March
31, 2021, Mr. Leong Will Liam acquired 100% of Synergy Empire HK, as such Synergy Empire HK is no longer a subsidiary of the Company.
Mr.
Leong Will Liam is the common director and major shareholder of the Company, Synergy Empire Marshall and Synergy Empire HK.
On
July 29, 2022, the Company approved the resignation of Mr. Leong Will Liam concurrently with the appointment of Mr. Vicknesya Naayaker
A/L Punosamy as the director of Lucky Star F&B Sdn. Bhd.
On
July 29, 2022, the Company approved the resignation of Mr. Leong Will Liam concurrently with the appointment of Mr. Praveen A/L Ravichandran
as the director of SH Dessert Sdn. Bhd.
The
Company, through its wholly owned subsidiaries, produce and distribute high quality dessert through Lucky Star and operate two restaurants
through SH Dessert. Details of the Company’s subsidiaries:
SCHEDULE
OF COMPANY'S SUBSIDIARIES
| No. | |
Company Name | |
Domicile and Date of
Incorporation | |
Particulars of Issued
Capital | |
Principal Activities |
| 1 | |
Synergy Empire Holding Limited | |
Marshall Islands, October 22, 2018 | |
1 Share of Ordinary Share, US$1 each | |
Investment Holding |
| | |
| |
| |
| |
|
| 2 | |
Lucky Star F&B Sdn. Bhd. | |
Malaysia, February 9, 2010 | |
100,000 Share of Ordinary Share, MYR1 each | |
Food and Beverage Assets Leasing |
| | |
| |
| |
| |
|
| 3 | |
SH Dessert Sdn. Bhd. | |
Malaysia, February 19, 2016 | |
100 Share of Ordinary Share, MYR1 each | |
Food and Beverage Assets Leasing |
On
October 31, 2022, the Company terminated all the tenancy agreements before the due date of the agreements.
On
November 30, 2022, the Company has entered into a lease agreement with a third party, Sweet Bakery & Dessert Café Sdn Bhd
to lease their assets to the third party. The leasing period is commencing from January 1, 2023 to December 31, 2023. The Company did
not cease its business operation nor sell the operating assets. The Company is looking for a new strategic location to continue their
business while leasing out their assets to the third party.
|
| X |
- References
+ Details
| Name: |
us-gaap_OrganizationConsolidationAndPresentationOfFinancialStatementsAbstract |
| Namespace Prefix: |
us-gaap_ |
| Data Type: |
xbrli:stringItemType |
| Balance Type: |
na |
| Period Type: |
duration |
|
| X |
- DefinitionThe entire disclosure for organization, consolidation and basis of presentation of financial statements disclosure. Reference 1: http://www.xbrl.org/2003/role/disclosureRef
-Topic 946
-SubTopic 10
-Name Accounting Standards Codification
-Section 50
-Paragraph 1
-Publisher FASB
-URI https://asc.fasb.org//1943274/2147480424/946-10-50-1
Reference 2: http://www.xbrl.org/2003/role/disclosureRef
-Topic 946
-SubTopic 10
-Name Accounting Standards Codification
-Section 50
-Paragraph 2
-Publisher FASB
-URI https://asc.fasb.org//1943274/2147480424/946-10-50-2
Reference 3: http://fasb.org/us-gaap/role/ref/legacyRef
-Topic 810
-Name Accounting Standards Codification
-Publisher FASB
-URI https://asc.fasb.org//810/tableOfContent
Reference 4: http://fasb.org/us-gaap/role/ref/legacyRef
-Topic 205
-Name Accounting Standards Codification
-Publisher FASB
-URI https://asc.fasb.org//205/tableOfContent
| Name: |
us-gaap_OrganizationConsolidationAndPresentationOfFinancialStatementsDisclosureTextBlock |
| Namespace Prefix: |
us-gaap_ |
| Data Type: |
dtr-types:textBlockItemType |
| Balance Type: |
na |
| Period Type: |
duration |
|
v3.23.2
SUMMARY OF SIGNIFICANT ACCOUNTING POLICIES
|
3 Months Ended |
Jun. 30, 2023 |
|---|
| Accounting Policies [Abstract] |
|
| SUMMARY OF SIGNIFICANT ACCOUNTING POLICIES |
2.
SUMMARY OF SIGNIFICANT ACCOUNTING POLICIES
Basis
of Presentation
These
accompanying financial statements have been prepared in accordance with generally accepted accounting principles in the United States
of America (“US GAAP”).
The
accompanying financial statements include the accounts of the Company and its wholly-owned subsidiaries. Intercompany transactions and
balances were eliminated in consolidation.
Below
is the organization chart of the Group.
Use
of Estimates
In
preparing these financial statements, management makes estimates and assumptions that affect the reported amounts of assets and liabilities
in the balance sheets and revenues and expenses during the years reported. Actual results may differ from these estimates.
Cash
and Cash Equivalents
The
Company considers short-term, highly liquid investments with an original maturity of 90 days or less to be cash equivalents.
Our
deposit in Malaysia is currently deposit in Public Bank Berhad and Standard Chartered Bank (Malaysia) Berhad, and there is a Perbadanan
Insurans Deposit Malaysia protects our eligible deposits held with bank in Malaysia which is members of the Scheme. The scheme will pay
a compensation up to a limit of Malaysia Ringgit (“MYR”) 250,000 per deposit per member bank, which is equivalent to $53,557,
if the aforementioned banks fail.
Plant
and Equipment
Plant
and equipment are stated at cost, with depreciation provided using the straight-line method over the following periods:
SCHEDULE
OF DEPRECIATION AND AMORTIZATION PERIODS OF PLANT AND EQUIPMENT
| Asset Categories | |
Depreciation Periods |
| Office and kitchen equipment | |
10 years |
| Motor vehicle | |
5 years |
Intangible
Asset
Intangible
assets are stated at cost, with amortization provided using the straight-line method over the following periods:
SCHEDULE
OF AMORTIZATION PERIOD OF INTANGIBLE ASSET
| Asset
Categories |
|
Amortization
Periods |
| Trademark |
|
10 years |
Inventories
Inventories
consisting of products available for sell, are stated at the lower of cost or market value. Cost of inventory is determined using the
first-in, first-out (FIFO) method. Inventory reserve is recorded to write down the cost of inventory to the estimated market value due
to slow-moving merchandise and damaged goods, which is dependent upon factors such as historical and forecasted consumer demand, and
promotional environment. The Company takes ownership, risks and rewards of the products purchased. Write downs are recorded in cost of
revenue in the consolidated statements of operations and comprehensive income (loss).
Revenue
recognition
Revenue
is generated through sale of goods and delivery services. Revenue is recognized when a customer obtains control of promised goods or
services and is recognized in an amount that reflects the consideration that the Company expects to receive in exchange for those goods
or services. In addition, the standard requires disclosure of the nature, amount, timing, and uncertainty of revenue and cash flows arising
from contracts with customers. The amount of revenue that is recorded reflects the consideration that the Company expects to receive
in exchange for those goods and services. The Company applies the following five-step model in order to determine this amount:
| (i) | identification
of the promised goods and services in the contract; |
(ii)
determination of whether the promised goods and services are performance obligations, including whether they are distinct in the context
of the contract;
(iii)
measurement of the transaction price, including the constraint on variable consideration;
(iv)
allocation of the transaction price to the performance obligations; and
(v)
recognition of revenue when (or as) the Company satisfies each performance obligation.
The
Company adopted ASU 2014-09, Revenue from Contracts with Customers (Topic 606). Under Topic 606, the Company records revenue when persuasive
evidence of an arrangement exists, delivery has occurred, the fee is fixed or determinable and collectability is probable. The Company
records revenue from the sale of product upon shipment or delivery of the products to the customer. The Company doesn’t allow return
of the products purchased or refund unless the food delivered is spoilt.
Cost
of revenue
Cost
of revenue includes the purchase cost of raw material for manufacturing and distribute to customers and packing materials. It includes
purchasing and receiving costs, internal transfer costs, other costs of distribution network, opening and closing inventory net off discount
received and return outwards in cost of revenue.
Income
tax expense
Income
taxes are determined in accordance with the provisions of ASC Topic 740, “Income Taxes” (“ASC Topic 740”). Under
this method, deferred tax assets and liabilities are recognized for the future tax consequences attributable to differences between the
financial statement carrying amounts of existing assets and liabilities and their respective tax basis. Deferred tax assets and liabilities
are measured using enacted income tax rates expected to apply to taxable income in the years in which those temporary differences are
expected to be recovered or settled. Any effect on deferred tax assets and liabilities of a change in tax rates is recognized in income
in the period that includes the enactment date.
ASC
740 prescribes a comprehensive model for how companies should recognize, measure, present, and disclosed in their financial statements
uncertain tax positions taken or expected to be taken on a tax return. Under ASC 740, tax positions must initially be recognized in the
financial statements when it is more likely than not the position will be sustained upon examination by the tax authorities. Such tax
positions must initially and subsequently be measured as the largest amount of tax benefit that has a greater than 50% likelihood of
being realized upon ultimate settlement with the tax authority assuming full knowledge of the position and relevant facts.
The
Company conducts major businesses in Malaysia and is subject to tax in their own jurisdictions. As a result of its business activities,
the Company will file separate tax returns that are subject to examination by the foreign tax authorities.
Foreign
currencies translation
Transactions
denominated in currencies other than the functional currency are translated into the functional currency at the exchange rates prevailing
at the dates of the transaction. Monetary assets and liabilities denominated in currencies other than the functional currency are translated
into the functional currency using the applicable exchange rates at the balance sheet dates. The resulting exchange differences are recorded
in the statement of operations and comprehensive income (loss).
The
functional currency of the Company is the United States Dollars (“US$”) and the accompanying financial statements have been
expressed in US$. In addition, the Company’s subsidiary maintains its books and record in Malaysian Ringgits (“MYR”)
and United States Dollars (“US$”), which is the respective functional currency as being the primary currency of the economic
environment in which the entity operates.
In
general, for consolidation purposes, assets and liabilities of its subsidiaries whose functional currency is not US$ are translated into
US$, in accordance with ASC Topic 830-30, “Translation of Financial Statement”, using the exchange rate on the balance sheet
date. Revenues and expenses are translated at average rates prevailing during the period. The gains and losses resulting from translation
of financial statements of foreign subsidiary are recorded as a separate component of accumulated other comprehensive income.
Translation
of amounts from the local currency of the Company into US$1 has been made at the following exchange rates for the respective periods:
SCHEDULE OF EXCHANGE RATE TRANSLATION OF AMOUNTS FROM LOCAL CURRENCY
| | |
For the three months ended
June 30 | |
| | |
2023 | | |
2022 | |
| Period-end MYR : US$1 exchange rate | |
| 4.67 | | |
| 4.41 | |
| Period-average MYR : US$1 exchange rate | |
| 4.58 | | |
| 4.38 | |
Related
parties
Parties,
which can be a corporation or individual, are considered to be related if the Company has the ability, directly or indirectly, to control
the other party or exercise significant influence over the other party in making financial and operating decisions. Companies are also
considered to be related if they are subject to common control or common significant influence.
Fair
value of financial instruments
The carrying value of the Company’s financial instruments: cash and
cash equivalents, account receivable, deposits and other receivables, account payable and accrued expenses and other payable approximate
at their fair values because of the short-term nature of these financial instruments.
The
Company also follows the guidance of the ASC Topic 820-10, “Fair Value Measurements and Disclosures” (“ASC 820-10”),
with respect to financial assets and liabilities that are measured at fair value. ASC 820-10 establishes a three-tier fair value hierarchy
that prioritizes the inputs used in measuring fair value as follows:
Level
1 : Observable inputs such as quoted prices in active markets;
Level
2 : Inputs, other than the quoted prices in active markets, that are observable either directly or indirectly; and
Level
3 : Unobservable inputs in which there is little or no market data, which require the reporting entity to develop its own assumptions.
As
of June 30, 2023 and 2022, the Company did not have any nonfinancial assets and liabilities that are recognized or disclosed at fair
value in the financial statements, at least annually, on a recurring basis, nor did the Company have any assets or liabilities measured
at fair value on a non-recurring basis.
Net
Income/(Loss) per Share
The
Company calculates net income/(loss) per share in accordance with ASC Topic 260, “Earnings per Share.” Basic income/(loss)
per share is computed by dividing the net income/(loss) by the weighted-average number of common shares outstanding during the period.
Diluted income per share is computed similar to basic income/(loss) per share except that the denominator is increased to include the
number of additional common shares that would have been outstanding if the potential common stock equivalents had been issued and if
the additional common shares were dilutive.
Lease
The
Company adopted the ASU No. 2016-02, on April 1, 2019 (date of inception). The Company leases central kitchen and restaurants for fixed
periods pre-emptive extension options. The Company recognizes lease payments for its short-term lease on a straight-line basis over the
lease term.
As
of June 30, 2023, the Company have no operating lease of which lease liability is initially and subsequently measured at the present
value of the unpaid lease payments at the lease commencement date. The right-of-use asset is initially measured at cost, which comprises
the initial amount of the lease liability adjusted for lease payments made at or before the lease commencement date, plus any initial
direct costs incurred less any lease incentives received. Costs associated with operating lease assets are recognized on a straight-line
basis within operating expenses over the term of the lease.
In
determining the present value of the unpaid lease payments, ASC 842 requires a lessee to discount its unpaid lease payments using the
interest rate implicit in the lease or, if that rate cannot be readily determined, its incremental borrowing rate. As most of the Company
leases do not provide an implicit rate, the Company uses its incremental borrowing rate as the discount rate for the lease. The Company
incremental borrowing rate is estimated to approximate the interest rate on a collateralized basis with similar terms and payments.
Accounts Receivable
Financial instruments that
potentially subject the Company to concentrations of credit risk consist primarily of accounts receivable. The Company extends credit
to its customers in the normal course of business and generally does not require collateral. The Company’s credit terms are dependent
upon the segment, and the customer. The Company assesses the probability of collection from each customer at the outset of the arrangement
based on a number of factors, including the customer’s payment history and its current creditworthiness. If in management’s
judgment collection is not probable, the Company does not record revenue until the uncertainty is removed.
Management performs ongoing
credit evaluations, and the Company maintains an allowance for potential credit losses based upon its loss history and its aging analysis.
The allowance for doubtful accounts is the Company’s best estimate of the amount of credit losses in existing accounts receivable.
Management reviews the allowance for doubtful accounts each reporting period based on a detailed analysis of trade receivables. In the
analysis, management primarily considers the age of the customer’s receivable, and also considers the creditworthiness of the customer,
the economic conditions of the customer’s industry, general economic conditions and trends, and the business relationship and history
with its customers, among other factors. If any of these factors change, the Company may also change its original estimates, which could
impact the level of the Company’s future allowance for doubtful accounts. If judgments regarding the collectability of receivables
were incorrect, adjustments to the allowance may be required, which would reduce profitability.
Accounts receivable are recognized and carried at the original invoice
amount less an allowance for any uncollectible amounts. An estimate for doubtful accounts receivable is made when collection of the full
amount is no longer probable. Bad debts are written off as identified. For the quarter ended
June 30, 2023, the Company makes an allowance for expected credit loss of $7,859.
Recently
Issued Accounting Standards
In
June 2016, the FASB issued Accounting Standards Update No. 2016-13, Financial Instruments—Credit Losses (Topic 326): Measurement
of Credit Losses on Financial Instruments, which introduced the expected credit losses methodology for the measurement of credit losses
on financial assets measured at amortized cost basis, replacing the previous incurred loss methodology. In November 2019, the FASB issued
ASU 2019-10 highlighted the adoption timeline. For smaller reporting entities, Topic 326 is effective for annual periods beginning after
December 15, 2022, including interim periods within those fiscal years, of which is effective for the Company on April 1, 2023. An analysis
of receivables, including credit losses, was conducted during the first quarter of fiscal 2023. The Company does not anticipate that
the adoption of the new guidance will have a material impact on our consolidated financial statements.
Other
recent accounting pronouncements issued by the FASB, including its Emerging Issues Task Force, the American Institute of Certified Public
Accountants, and the Securities and Exchange Commission did not or are not believed by management to have a material impact on the Company’s
present or future financial statements.
|
| X |
- References
+ Details
| Name: |
us-gaap_AccountingPoliciesAbstract |
| Namespace Prefix: |
us-gaap_ |
| Data Type: |
xbrli:stringItemType |
| Balance Type: |
na |
| Period Type: |
duration |
|
| X |
- DefinitionThe entire disclosure for all significant accounting policies of the reporting entity. Reference 1: http://www.xbrl.org/2003/role/disclosureRef
-Topic 235
-SubTopic 10
-Name Accounting Standards Codification
-Section 50
-Paragraph 1
-Publisher FASB
-URI https://asc.fasb.org//1943274/2147483426/235-10-50-1
Reference 2: http://fasb.org/us-gaap/role/ref/legacyRef
-Topic 235
-Name Accounting Standards Codification
-Publisher FASB
-URI https://asc.fasb.org//235/tableOfContent
| Name: |
us-gaap_SignificantAccountingPoliciesTextBlock |
| Namespace Prefix: |
us-gaap_ |
| Data Type: |
dtr-types:textBlockItemType |
| Balance Type: |
na |
| Period Type: |
duration |
|
v3.23.2
GOING CONCERN UNCERTAINTIES
|
3 Months Ended |
Jun. 30, 2023 |
|---|
| Organization, Consolidation and Presentation of Financial Statements [Abstract] |
|
| GOING CONCERN UNCERTAINTIES |
3.
GOING CONCERN UNCERTAINTIES
The
accompanying financial statements have been prepared assuming that the Company will continue as a going concern. The company having accumulated
deficit of $2,181,020 and $2,134,207 as of June 30, 2023 and March 31, 2023 respectively.
For
the three months ended June 30, 2023 and 2022, the Company suffered from a net loss of $46,813 and $143,597 respectively.
Furthermore,
the Company recorded a negative working capital of $1,345,640 and $1,384,526 as of June 30, 2023 and March 31, 2023 respectively.
The
Company’s cash position is not sufficient to support the Company’s daily operations. While the Company believes in the viability
of its strategy and in its ability to raise additional funds, there can be no assurances to that effect. The Company’s ability
to continue as a going concern is dependent upon its ability to improve profitability and the ability to acquire financial support from
its shareholder.
These
and other factors raise substantial doubt about the Company’s ability to continue as a going concern within one year after the
date that financial statements are issued. These financial statements do not include any adjustments to reflect the possible future effects
on the recoverability and classification of assets or the amounts and classification of liabilities that may result in the Company not
being able to continue as a going concern.
|
| X |
- References
+ Details
| Name: |
us-gaap_OrganizationConsolidationAndPresentationOfFinancialStatementsAbstract |
| Namespace Prefix: |
us-gaap_ |
| Data Type: |
xbrli:stringItemType |
| Balance Type: |
na |
| Period Type: |
duration |
|
| X |
- DefinitionThe entire disclosure when substantial doubt is raised about the ability to continue as a going concern. Includes, but is not limited to, principal conditions or events that raised substantial doubt about the ability to continue as a going concern, management's evaluation of the significance of those conditions or events in relation to the ability to meet its obligations, and management's plans that alleviated or are intended to mitigate the conditions or events that raise substantial doubt about the ability to continue as a going concern. Reference 1: http://fasb.org/us-gaap/role/ref/legacyRef
-Topic 205
-SubTopic 40
-Name Accounting Standards Codification
-Publisher FASB
-URI https://asc.fasb.org//205-40/tableOfContent
| Name: |
us-gaap_SubstantialDoubtAboutGoingConcernTextBlock |
| Namespace Prefix: |
us-gaap_ |
| Data Type: |
dtr-types:textBlockItemType |
| Balance Type: |
na |
| Period Type: |
duration |
|
v3.23.2
ACCOUNTS RECEIVABLE, NET
|
3 Months Ended |
Jun. 30, 2023 |
|---|
| Receivables [Abstract] |
|
| ACCOUNTS RECEIVABLE, NET |
4. ACCOUNTS RECEIVABLE, NET
SCHEDULE
OF ACCOUNTS RECEIVABLE NET
| | |
As of June 30, 2023 | | |
As of March 31, 2023 | |
| Accounts receivable, gross | |
$ | 7,859 | | |
$ | - | |
| Allowance for expected credit loss | |
| (7,859 | ) | |
| - | |
| Accounts receivable, net | |
$ | - | | |
$ | - | |
|
| X |
- DefinitionThe entire disclosure for claims held for amounts due a entity, excluding financing receivables. Examples include, but are not limited to, trade accounts receivables, notes receivables, loans receivables. Includes disclosure for allowance for credit losses. Reference 1: http://www.xbrl.org/2009/role/commonPracticeRef
-Topic 310
-SubTopic 10
-Name Accounting Standards Codification
-Publisher FASB
-URI https://asc.fasb.org//310-10/tableOfContent
| Name: |
us-gaap_LoansNotesTradeAndOtherReceivablesDisclosureTextBlock |
| Namespace Prefix: |
us-gaap_ |
| Data Type: |
dtr-types:textBlockItemType |
| Balance Type: |
na |
| Period Type: |
duration |
|
| X |
- References
+ Details
| Name: |
us-gaap_ReceivablesAbstract |
| Namespace Prefix: |
us-gaap_ |
| Data Type: |
xbrli:stringItemType |
| Balance Type: |
na |
| Period Type: |
duration |
|
v3.23.2
PREPAID EXPENSES AND DEPOSITS
|
3 Months Ended |
Jun. 30, 2023 |
|---|
| Prepaid Expenses And Deposits |
|
| PREPAID EXPENSES AND DEPOSITS |
5.
PREPAID EXPENSES AND DEPOSITS
SCHEDULE
OF PREPAID EXPENSES AND DEPOSITS
| | |
As of
June 30, 2023 | | |
As of
March 31, 2023 | |
| Prepaid expenses | |
| 8,750 | | |
| 12,500 | |
| Other receivables | |
| 443 | | |
| 3,181 | |
| Total | |
$ | 9,193 | | |
$ | 15,681 | |
Prepaid
expenses represent OTCQB annual fee.
Other
receivables consist of overpayment to supplier.
|
| X |
- References
+ Details
| Name: |
SHMY_DisclosurePrepaidExpensesAndDepositsAbstract |
| Namespace Prefix: |
SHMY_ |
| Data Type: |
xbrli:stringItemType |
| Balance Type: |
na |
| Period Type: |
duration |
|
| X |
- DefinitionPrepaid expenses deposits [Text Block]
| Name: |
SHMY_PrepaidExpensesDepositsTextBlock |
| Namespace Prefix: |
SHMY_ |
| Data Type: |
dtr-types:textBlockItemType |
| Balance Type: |
na |
| Period Type: |
duration |
|
v3.23.2
PLANT AND EQUIPMENT
|
3 Months Ended |
Jun. 30, 2023 |
|---|
| Property, Plant and Equipment [Abstract] |
|
| PLANT AND EQUIPMENT |
6.
PLANT AND EQUIPMENT
SCHEDULE OF PLANT AND EQUIPMENT
| | |
As of
June 30, 2023 | | |
As of March
31, 2023 | |
| Office equipment | |
| 37,223 | | |
| 39,285 | |
| Kitchen equipment | |
| 40,953 | | |
| 43,222 | |
| Motor vehicle | |
| 10,497 | | |
| 11,078 | |
| Total plant and equipment | |
$ | 88,673 | | |
$ | 93,585 | |
| Less: Accumulated depreciation | |
| (27,917 | ) | |
| (27,401 | ) |
| Total plant and equipment | |
$ | 60,756 | | |
$ | 66,184 | |
For
the three months ended June 30, 2023, the Company does not invest in plant and equipment.
For
the three months ended June 30, 2022, the Company has invested $10,076 in kitchen equipment and $134 in office equipment respectively.
Depreciation
expenses for the three months ended June 30, 2023 and 2022 amounted to $1,992 and $16,157 respectively.
|
| X |
- References
+ Details
| Name: |
us-gaap_PropertyPlantAndEquipmentAbstract |
| Namespace Prefix: |
us-gaap_ |
| Data Type: |
xbrli:stringItemType |
| Balance Type: |
na |
| Period Type: |
duration |
|
| X |
- DefinitionThe entire disclosure for long-lived, physical asset used in normal conduct of business and not intended for resale. Includes, but is not limited to, work of art, historical treasure, and similar asset classified as collections. Reference 1: http://fasb.org/us-gaap/role/ref/legacyRef
-Topic 360
-Name Accounting Standards Codification
-Publisher FASB
-URI https://asc.fasb.org//360/tableOfContent
Reference 2: http://www.xbrl.org/2003/role/disclosureRef
-Name Accounting Standards Codification
-Section 50
-Paragraph 6
-SubTopic 360
-Topic 958
-Publisher FASB
-URI https://asc.fasb.org//1943274/2147480321/958-360-50-6
Reference 3: http://www.xbrl.org/2003/role/disclosureRef
-Name Accounting Standards Codification
-Section 50
-Paragraph 1
-Subparagraph (d)
-SubTopic 360
-Topic 958
-Publisher FASB
-URI https://asc.fasb.org//1943274/2147480321/958-360-50-1
Reference 4: http://www.xbrl.org/2003/role/disclosureRef
-Name Accounting Standards Codification
-Section 50
-Paragraph 7
-SubTopic 360
-Topic 958
-Publisher FASB
-URI https://asc.fasb.org//1943274/2147480321/958-360-50-7
| Name: |
us-gaap_PropertyPlantAndEquipmentDisclosureTextBlock |
| Namespace Prefix: |
us-gaap_ |
| Data Type: |
dtr-types:textBlockItemType |
| Balance Type: |
na |
| Period Type: |
duration |
|
v3.23.2
ACCRUED EXPENSES AND OTHER PAYABLES
|
3 Months Ended |
Jun. 30, 2023 |
|---|
| Payables and Accruals [Abstract] |
|
| ACCRUED EXPENSES AND OTHER PAYABLES |
7.
ACCRUED EXPENSES AND OTHER PAYABLES
SCHEDULE
OF ACCRUED EXPENSES AND OTHER PAYABLES
| | |
As of
June 30, 2023 | | |
As of
March 31, 2023 | |
| Accrued expenses | |
$ | 24,685 | | |
$ | 31,322 | |
| Other payables | |
| 33,394 | | |
| 39,111 | |
| Deposit received | |
| 428 | | |
| 452 | |
| Total | |
$ | 58,507 | | |
$ | 70,885 | |
Accrued
expenses consist of accrued salary and professional fee.
Other payable consist of payables to suppliers and sales and service tax
payable.
Deposit
received consist of deposit from lease agreement.
|
| X |
- DefinitionThe entire disclosure for accounts payable and accrued liabilities at the end of the reporting period. Reference 1: http://fasb.org/us-gaap/role/ref/legacyRef
-Name Accounting Standards Codification
-Topic 210
-SubTopic 10
-Section S99
-Paragraph 1
-Subparagraph (SX 210.5-02.19(a),20,24)
-Publisher FASB
-URI https://asc.fasb.org//1943274/2147480566/210-10-S99-1
| Name: |
us-gaap_AccountsPayableAndAccruedLiabilitiesDisclosureTextBlock |
| Namespace Prefix: |
us-gaap_ |
| Data Type: |
dtr-types:textBlockItemType |
| Balance Type: |
na |
| Period Type: |
duration |
|
| X |
- References
+ Details
| Name: |
us-gaap_PayablesAndAccrualsAbstract |
| Namespace Prefix: |
us-gaap_ |
| Data Type: |
xbrli:stringItemType |
| Balance Type: |
na |
| Period Type: |
duration |
|
v3.23.2
AMOUNT DUE TO A DIRECTOR
|
3 Months Ended |
Jun. 30, 2023 |
|---|
| Related Party Transactions [Abstract] |
|
| AMOUNT DUE TO A DIRECTOR |
8.
AMOUNT DUE TO A DIRECTOR
As
of March 31, 2023, the Company has an outstanding loan payable to Mr. Leong Will Liam amounted $1,325,308,
of which including an amount due to Synergy Empire HK, amounted $24,822.
For the three months ended June 30, 2023, Mr. Leong Will Liam has further advanced $15,050
to the Company for working capital purpose.
Both
aforementioned loans are unsecured, non-interest bearing and payable on demand.
SCHEDULE
OF AMOUNT DUE TO A DIRECTOR
| Amount due to director, Mr. Leong Will Liam | |
| |
| Balance as of March 31, 2023 | |
$ | 1,300,486 | |
| Loan from Director | |
| 15,050 | |
| Foreign currency translation | |
| (49,449 | ) |
| Balance as of June 30, 2023 | |
$ | 1,266,087 | |
| Balance as of June 30, 2023 – Amount due to Synergy Empire HK | |
| 24,822 | |
| Balance as of June 30, 2023 – Total amount due to director | |
$ | 1,290,909 | |
|
| X |
- DefinitionThe entire disclosure for related party transactions. Examples of related party transactions include transactions between (a) a parent company and its subsidiary; (b) subsidiaries of a common parent; (c) and entity and its principal owners; and (d) affiliates. Reference 1: http://www.xbrl.org/2003/role/disclosureRef
-Topic 946
-SubTopic 20
-Name Accounting Standards Codification
-Section 50
-Paragraph 2
-Publisher FASB
-URI https://asc.fasb.org//1943274/2147480990/946-20-50-2
Reference 2: http://www.xbrl.org/2003/role/disclosureRef
-Topic 946
-SubTopic 20
-Name Accounting Standards Codification
-Section 50
-Paragraph 5
-Publisher FASB
-URI https://asc.fasb.org//1943274/2147480990/946-20-50-5
Reference 3: http://www.xbrl.org/2003/role/disclosureRef
-Topic 946
-SubTopic 20
-Name Accounting Standards Codification
-Section 50
-Paragraph 6
-Publisher FASB
-URI https://asc.fasb.org//1943274/2147480990/946-20-50-6
Reference 4: http://www.xbrl.org/2003/role/disclosureRef
-Topic 946
-SubTopic 235
-Name Accounting Standards Codification
-Section 50
-Paragraph 2
-Subparagraph (c)
-Publisher FASB
-URI https://asc.fasb.org//1943274/2147481062/946-235-50-2
Reference 5: http://www.xbrl.org/2003/role/disclosureRef
-Topic 946
-SubTopic 235
-Name Accounting Standards Codification
-Section 50
-Paragraph 2
-Subparagraph (e)
-Publisher FASB
-URI https://asc.fasb.org//1943274/2147481062/946-235-50-2
Reference 6: http://www.xbrl.org/2003/role/disclosureRef
-Topic 850
-SubTopic 10
-Name Accounting Standards Codification
-Section 50
-Paragraph 1
-Subparagraph (d)
-Publisher FASB
-URI https://asc.fasb.org//1943274/2147483326/850-10-50-1
Reference 7: http://www.xbrl.org/2003/role/disclosureRef
-Topic 946
-SubTopic 220
-Name Accounting Standards Codification
-Section S99
-Paragraph 1
-Subparagraph (SX 210.6-07(2)(g)(3))
-Publisher FASB
-URI https://asc.fasb.org//1943274/2147483575/946-220-S99-1
Reference 8: http://www.xbrl.org/2003/role/disclosureRef
-Topic 946
-SubTopic 220
-Name Accounting Standards Codification
-Section S99
-Paragraph 1
-Subparagraph (SX 210.6-07(2)(c))
-Publisher FASB
-URI https://asc.fasb.org//1943274/2147483575/946-220-S99-1
Reference 9: http://www.xbrl.org/2003/role/disclosureRef
-Topic 946
-SubTopic 220
-Name Accounting Standards Codification
-Section S99
-Paragraph 1
-Subparagraph (SX 210.6-07(2)(e))
-Publisher FASB
-URI https://asc.fasb.org//1943274/2147483575/946-220-S99-1
Reference 10: http://www.xbrl.org/2003/role/disclosureRef
-Topic 850
-Name Accounting Standards Codification
-Publisher FASB
-URI https://asc.fasb.org//850/tableOfContent
Reference 11: http://www.xbrl.org/2003/role/disclosureRef
-Topic 850
-SubTopic 10
-Name Accounting Standards Codification
-Section 50
-Paragraph 6
-Publisher FASB
-URI https://asc.fasb.org//1943274/2147483326/850-10-50-6
Reference 12: http://www.xbrl.org/2003/role/disclosureRef
-Topic 850
-SubTopic 10
-Name Accounting Standards Codification
-Section 50
-Paragraph 1
-Subparagraph (a)
-Publisher FASB
-URI https://asc.fasb.org//1943274/2147483326/850-10-50-1
Reference 13: http://www.xbrl.org/2003/role/disclosureRef
-Topic 850
-SubTopic 10
-Name Accounting Standards Codification
-Section 50
-Paragraph 1
-Subparagraph (b)
-Publisher FASB
-URI https://asc.fasb.org//1943274/2147483326/850-10-50-1
| Name: |
us-gaap_RelatedPartyTransactionsDisclosureTextBlock |
| Namespace Prefix: |
us-gaap_ |
| Data Type: |
dtr-types:textBlockItemType |
| Balance Type: |
na |
| Period Type: |
duration |
|
v3.23.2
BANK BORROWING
|
3 Months Ended |
Jun. 30, 2023 |
|---|
| Debt Disclosure [Abstract] |
|
| BANK BORROWING |
9.
BANK BORROWING
On
January 25, 2017, Lucky Star F&B Sdn. Bhd., a wholly owned subsidiary of the Company has acquired a business loan from Standard Chartered
Saadiq Berhad, a bank incorporated in Malaysia, amounted to MYR342,834 (approximately $83,972) at annual interest of 6.00% accrued in
arrear, for a repayment period of 72 months with interest bearing monthly installment of MYR6,473 (approximately $1,585) which is the
sole bank borrowing by the Company.
The
outstanding balance of business loan as of June 30 and March 31, 2023 can be summarized as follow:
SUMMARY
OF OUTSTANDING BALANCE OF BUSINESS LOANS
| | |
As of
June 30, 2022 | | |
As of
March 31, 2023 | |
| Bank borrowing (Current portion) | |
$ | 3,480 | | |
$ | 7,954 | |
| Bank borrowing (Non-current portion) | |
| - | | |
| - | |
| Total | |
$ | 3,480 | | |
$ | 7,954 | |
On
April 1, 2020, Standard Chartered Saadiq Berhad announced to provide loan deferment to borrower for a period 6 months in supporting of
Malaysia National Bank to ease financial pressure as a result of movement control order promulgated by Malaysia Government to contain
the outbreak of COVID- 19. Pursuant to the announcement, no instalment is required, and no penalty will be imposed during the 6 months
period however additional non-compounding interest will continue to accrue. As such, the Company has incurred additional interest of
$2,141 interest expenses. The last repayment is expected on August 2023.
For
the three months ended June 30, 2023, the Company repaid $4,134 in bank borrowings.
For
the three months ended June 30, 2022, the Company repaid $3,938 in bank borrowings.
Maturities
of the loan for each of the three years and thereafter are as follows:
SCHEDULE
OF MATURITIES OF LOAN
| Year ending March 31 | | |
| |
| | | |
| |
| 2023 | | |
$ | 3,480 | |
| Total | | |
$ | 3,480 | |
|
| X |
- References
+ Details
| Name: |
us-gaap_DebtDisclosureAbstract |
| Namespace Prefix: |
us-gaap_ |
| Data Type: |
xbrli:stringItemType |
| Balance Type: |
na |
| Period Type: |
duration |
|
| X |
- DefinitionThe entire disclosure for information about short-term and long-term debt arrangements, which includes amounts of borrowings under each line of credit, note payable, commercial paper issue, bonds indenture, debenture issue, own-share lending arrangements and any other contractual agreement to repay funds, and about the underlying arrangements, rationale for a classification as long-term, including repayment terms, interest rates, collateral provided, restrictions on use of assets and activities, whether or not in compliance with debt covenants, and other matters important to users of the financial statements, such as the effects of refinancing and noncompliance with debt covenants. Reference 1: http://www.xbrl.org/2003/role/disclosureRef
-Topic 470
-SubTopic 20
-Name Accounting Standards Codification
-Section 50
-Paragraph 1B
-Subparagraph (h)
-Publisher FASB
-URI https://asc.fasb.org//1943274/2147481139/470-20-50-1B
Reference 2: http://www.xbrl.org/2003/role/disclosureRef
-Topic 235
-SubTopic 10
-Name Accounting Standards Codification
-Section S99
-Paragraph 1
-Subparagraph (SX 210.4-08(c))
-Publisher FASB
-URI https://asc.fasb.org//1943274/2147480678/235-10-S99-1
Reference 3: http://fasb.org/us-gaap/role/ref/legacyRef
-Topic 470
-Name Accounting Standards Codification
-Publisher FASB
-URI https://asc.fasb.org//470/tableOfContent
Reference 4: http://www.xbrl.org/2003/role/disclosureRef
-Topic 470
-SubTopic 20
-Name Accounting Standards Codification
-Section 50
-Paragraph 1B
-Publisher FASB
-URI https://asc.fasb.org//1943274/2147481139/470-20-50-1B
Reference 5: http://www.xbrl.org/2003/role/disclosureRef
-Topic 470
-SubTopic 20
-Name Accounting Standards Codification
-Section 50
-Paragraph 1B
-Subparagraph (g)
-Publisher FASB
-URI https://asc.fasb.org//1943274/2147481139/470-20-50-1B
Reference 6: http://www.xbrl.org/2003/role/disclosureRef
-Topic 470
-SubTopic 20
-Name Accounting Standards Codification
-Section 50
-Paragraph 1B
-Subparagraph (i)
-Publisher FASB
-URI https://asc.fasb.org//1943274/2147481139/470-20-50-1B
Reference 7: http://www.xbrl.org/2003/role/disclosureRef
-Topic 470
-SubTopic 20
-Name Accounting Standards Codification
-Section 50
-Paragraph 1C
-Subparagraph (a)
-Publisher FASB
-URI https://asc.fasb.org//1943274/2147481139/470-20-50-1C
Reference 8: http://www.xbrl.org/2003/role/disclosureRef
-Topic 470
-SubTopic 20
-Name Accounting Standards Codification
-Section 50
-Paragraph 1C
-Subparagraph (b)
-Publisher FASB
-URI https://asc.fasb.org//1943274/2147481139/470-20-50-1C
Reference 9: http://www.xbrl.org/2003/role/disclosureRef
-Topic 470
-SubTopic 20
-Name Accounting Standards Codification
-Section 50
-Paragraph 1C
-Subparagraph (c)
-Publisher FASB
-URI https://asc.fasb.org//1943274/2147481139/470-20-50-1C
Reference 10: http://www.xbrl.org/2003/role/disclosureRef
-Topic 470
-SubTopic 20
-Name Accounting Standards Codification
-Section 50
-Paragraph 1E
-Subparagraph (b)
-Publisher FASB
-URI https://asc.fasb.org//1943274/2147481139/470-20-50-1E
Reference 11: http://www.xbrl.org/2003/role/disclosureRef
-Topic 470
-SubTopic 20
-Name Accounting Standards Codification
-Section 50
-Paragraph 1I
-Subparagraph (a)
-Publisher FASB
-URI https://asc.fasb.org//1943274/2147481139/470-20-50-1I
Reference 12: http://www.xbrl.org/2003/role/disclosureRef
-Topic 470
-SubTopic 20
-Name Accounting Standards Codification
-Section 50
-Paragraph 1I
-Subparagraph (b)
-Publisher FASB
-URI https://asc.fasb.org//1943274/2147481139/470-20-50-1I
Reference 13: http://www.xbrl.org/2003/role/disclosureRef
-Topic 470
-SubTopic 20
-Name Accounting Standards Codification
-Section 50
-Paragraph 1I
-Subparagraph (d)
-Publisher FASB
-URI https://asc.fasb.org//1943274/2147481139/470-20-50-1I
| Name: |
us-gaap_DebtDisclosureTextBlock |
| Namespace Prefix: |
us-gaap_ |
| Data Type: |
dtr-types:textBlockItemType |
| Balance Type: |
na |
| Period Type: |
duration |
|
v3.23.2
CONCENTRATION OF RISK
|
3 Months Ended |
Jun. 30, 2023 |
|---|
| Risks and Uncertainties [Abstract] |
|
| CONCENTRATION OF RISK |
10.
CONCENTRATION OF RISK
(a) Major Customers
For
the three months ended June 30, 2023, there was one customer who accounted for 100% of the Company’s revenues with significant
outstanding receivables.
For
the three months ended June 30, 2022, there was no customer who accounted for 10% or more of the Company’s revenues nor with significant
outstanding receivables.
(b) Major Suppliers
For
the three months ended June 30, 2023 and 2022, there was no supplier who accounted for 10% or more of the Company’s purchases nor
with significant outstanding payables.
|
| X |
- DefinitionThe entire disclosure for any concentrations existing at the date of the financial statements that make an entity vulnerable to a reasonably possible, near-term, severe impact. This disclosure informs financial statement users about the general nature of the risk associated with the concentration, and may indicate the percentage of concentration risk as of the balance sheet date. Reference 1: http://fasb.org/us-gaap/role/ref/legacyRef
-Topic 275
-Name Accounting Standards Codification
-Publisher FASB
-URI https://asc.fasb.org//275/tableOfContent
| Name: |
us-gaap_ConcentrationRiskDisclosureTextBlock |
| Namespace Prefix: |
us-gaap_ |
| Data Type: |
dtr-types:textBlockItemType |
| Balance Type: |
na |
| Period Type: |
duration |
|
| X |
- References
+ Details
| Name: |
us-gaap_RisksAndUncertaintiesAbstract |
| Namespace Prefix: |
us-gaap_ |
| Data Type: |
xbrli:stringItemType |
| Balance Type: |
na |
| Period Type: |
duration |
|
v3.23.2
INCOME TAXES
|
3 Months Ended |
Jun. 30, 2023 |
|---|
| Income Tax Disclosure [Abstract] |
|
| INCOME TAXES |
11.
INCOME TAXES
The
loss before income taxes of the Company for the three months ended June 30, 2023 and 2022 were comprised of the following:
SCHEDULE
OF INCOME (LOSS) BEFORE INCOME TAXES
| | |
For the three months ended
June 30 | |
| | |
2023 | | |
2022 | |
| Tax jurisdictions from: | |
| | | |
| | |
| – Local | |
$ | (43,854 | ) | |
$ | (40,188 | ) |
| | |
| | | |
| | |
| – Foreign, representing: | |
| | | |
| | |
| Marshall Islands (non-taxable jurisdiction) | |
| - | | |
| - | |
| Hong Kong | |
| - | | |
| - | |
| Malaysia | |
| (2,959 | ) | |
| (103,409 | ) |
| Loss before income taxes | |
$ | ) | |
$ | ) |
Provision
for income taxes consisted of the following:
SUMMARY
OF PROVISION FOR INCOME TAX
| | |
| For the three months ended
June 30 | |
| | |
| 2023 | | |
| 2022 | |
| Current: | |
| | | |
| | |
| – Local | |
$ | - | | |
$ | - | |
| – Foreign: | |
| | | |
| | |
| Marshall Islands (non-taxable jurisdiction) | |
| - | | |
| - | |
| Malaysia | |
| - | | |
| - | |
| | |
| | | |
| | |
| Deferred: | |
| | | |
| | |
| – Local | |
| - | | |
| - | |
| – Foreign | |
| - | | |
| - | |
| | |
$ | - | | |
$ | - | |
The
effective tax rate in the periods presented is the result of the mix of income earned in various tax jurisdictions that apply a broad
range of income tax rates. During the periods presented, the Company has a number of subsidiaries that operates in different countries
and is subject to tax in the jurisdictions in which its subsidiaries operate, as follows:
United
States of America
The
Tax Act reduces the U.S. statutory corporate tax rate from 35% to 21% for our tax years beginning in 2018. The Company is registered
in the State of Nevada and is subject to United States of America tax law. As of June 30, 2023, the operations in the United States of
America incurred $331,658 of cumulative net operating losses (NOL’s) which can be carried forward to offset future taxable income.
The NOL carry forwards begin to expire in 2043, if unutilized. The Company has provided for a full valuation allowance of approximately
$69,648 against the deferred tax assets on the expected future tax benefits from the net operating loss carry forwards as the management
believes it is more likely than not that these assets will not be realized in the future.
Malaysia
Lucky
Star F&B Sdn. Bhd. and SH Desserts Sdn. Bhd. are subject to the Malaysia Corporate Tax Laws at a two-tier corporate income tax rate
based on amount of paid-up capital. The 2023 tax rate for company with paid-up capital of MYR 2,500,000 (approximately $535,573) or less
and that are not part of a group containing a company exceeding this capitalization threshold is 17% on the first MYR 600,000 (approximately
$128,537) taxable profit with the remaining balance being taxed at 24%.
For
the three months ended June 30, 2023, Lucky Star F&B Sdn. Bhd.and SH Desserts Sdn. Bhd. incurred a loss of $1,483 and $1,476 respectively,
which can be carried forward for seven years to offset its taxable income.
As
of June 30, 2023, the operations in Malaysia generated $1,844,318 of cumulative net operating losses which can be carried forward to
offset future taxable income. The net operating loss can be carried forward for seven years. The Company has provided for a full valuation
allowance against the deferred tax assets of $313,534 on the expected future tax benefits from the net operating loss carry forwards
as the management believes it is more likely than not that these assets will not be realized in the future.
The
following table sets forth the significant components of the aggregate deferred tax assets of the Company as of June 30 and March 31,
2023:
SCHEDULE
OF DEFERRED TAX ASSETS AND LIABILITIES
| | |
As of
June 30, 2023 | | |
As of
March 31, 2023 |
| Deferred tax assets: | |
| | |
|
|
|
|
| | |
| | |
|
|
|
|
| Net operating loss carryforwards | |
$ | | | |
$ |
|
|
| – United States of America | |
| 69,648 | | |
|
60,439 |
|
| – Marshall Islands | |
| - | | |
|
- |
|
| – Malaysia | |
| 313,534 | | |
|
313,031 |
|
| | |
| 383,182 | | |
|
373,470 |
|
| Less: valuation allowance | |
| (383,182 | ) | |
|
(373,470 |
) |
| Deferred tax assets | |
$ | - | | |
$ |
- |
|
Management
believes that it is more likely than not that the deferred tax assets will not be fully realizable in the future. Accordingly, the Company
provided for a full valuation allowance against its deferred tax assets of $383,182 as of June 30, 2023. For three months ended June
30, 2023, the valuation allowance increased by $9,712, primarily relating to the loss incurred by the Company, Lucky Star F&B Sdn. Bhd. and SH Desserts Shd. Bhd.
|
| X |
- DefinitionThe entire disclosure for income taxes. Disclosures may include net deferred tax liability or asset recognized in an enterprise's statement of financial position, net change during the year in the total valuation allowance, approximate tax effect of each type of temporary difference and carryforward that gives rise to a significant portion of deferred tax liabilities and deferred tax assets, utilization of a tax carryback, and tax uncertainties information. Reference 1: http://www.xbrl.org/2003/role/disclosureRef
-Topic 946
-SubTopic 20
-Name Accounting Standards Codification
-Section 50
-Paragraph 13
-Publisher FASB
-URI https://asc.fasb.org//1943274/2147480990/946-20-50-13
Reference 2: http://www.xbrl.org/2003/role/disclosureRef
-Topic 235
-SubTopic 10
-Name Accounting Standards Codification
-Section S99
-Paragraph 1
-Subparagraph (SX 210.4-08(h)(2))
-Publisher FASB
-URI https://asc.fasb.org//1943274/2147480678/235-10-S99-1
Reference 3: http://www.xbrl.org/2003/role/disclosureRef
-Topic 740
-Name Accounting Standards Codification
-Publisher FASB
-URI https://asc.fasb.org//740/tableOfContent
Reference 4: http://www.xbrl.org/2003/role/disclosureRef
-Topic 740
-SubTopic 10
-Name Accounting Standards Codification
-Section 50
-Paragraph 14
-Publisher FASB
-URI https://asc.fasb.org//1943274/2147482685/740-10-50-14
Reference 5: http://www.xbrl.org/2003/role/disclosureRef
-Topic 740
-SubTopic 10
-Name Accounting Standards Codification
-Section 50
-Paragraph 21
-Publisher FASB
-URI https://asc.fasb.org//1943274/2147482685/740-10-50-21
Reference 6: http://www.xbrl.org/2003/role/disclosureRef
-Topic 740
-SubTopic 270
-Name Accounting Standards Codification
-Section 50
-Paragraph 1
-Publisher FASB
-URI https://asc.fasb.org//1943274/2147482526/740-270-50-1
Reference 7: http://www.xbrl.org/2003/role/disclosureRef
-Topic 740
-SubTopic 10
-Name Accounting Standards Codification
-Section 50
-Paragraph 17
-Subparagraph (b)
-Publisher FASB
-URI https://asc.fasb.org//1943274/2147482685/740-10-50-17
Reference 8: http://www.xbrl.org/2003/role/disclosureRef
-Topic 740
-SubTopic 10
-Name Accounting Standards Codification
-Section S99
-Paragraph 1
-Subparagraph (SAB TOPIC 6.I.5.Q1)
-Publisher FASB
-URI https://asc.fasb.org//1943274/2147479360/740-10-S99-1
Reference 9: http://www.xbrl.org/2003/role/disclosureRef
-Topic 740
-SubTopic 10
-Name Accounting Standards Codification
-Section S99
-Paragraph 2
-Subparagraph (SAB Topic 11.C)
-Publisher FASB
-URI https://asc.fasb.org//1943274/2147479360/740-10-S99-2
Reference 10: http://www.xbrl.org/2003/role/disclosureRef
-Topic 740
-SubTopic 30
-Name Accounting Standards Codification
-Section 50
-Paragraph 2
-Subparagraph (a)
-Publisher FASB
-URI https://asc.fasb.org//1943274/2147482603/740-30-50-2
| Name: |
us-gaap_IncomeTaxDisclosureTextBlock |
| Namespace Prefix: |
us-gaap_ |
| Data Type: |
dtr-types:textBlockItemType |
| Balance Type: |
na |
| Period Type: |
duration |
|
v3.23.2
STOCKHOLDERS’ EQUITY
|
3 Months Ended |
Jun. 30, 2023 |
|---|
| Equity [Abstract] |
|
| STOCKHOLDERS’ EQUITY |
12.
STOCKHOLDERS’ EQUITY
On
October 17, 2018, the founder of the Company, Mr. Leong Will Liam purchased 900,000 shares of restricted common stock of the Company
at $0.03 per share for the Company’s initial working capital. Each share was with a par value of $0.0001. All proceeds received
are used for the Company’s working capital.
On
January 21, 2019, CBA Capital Holdings Sdn. Bhd. waived an interest-free loan of $257,183 in Lucky Star F&B Sdn. Bhd., our wholly
own subsidiary, as contribution and recorded in additional paid in capital. CBA Capital Holdings Sdn. Bhd. is wholly owned by our Director,
Mr. Leong Will Liam.
On
December 30, 2020, the Company resolved to close the offering from the registration statement on Form S-1/A, dated February 25, 2020,
that had been declared effective by the Securities and Exchange Commission on March 10, 2020. The Offering resulting in 100,000 shares
of common stock being sold at $5.00 per share for a total of $500,000. The proceed of $500,000 will become the capital for our expansion,
pursuant to the use of proceed stated in the aforementioned Form S-1/A.
As
of March 31, 2021, the Company have an issued and outstanding share of common stock of 1,000,000 with an authorized share of common stock
of 450,000,000 with a par value of $0.0001. In addition, the Company have an authorized share of preference stock of 50,000,000 with
a par value of $0.0001, however no share of preference stock was issued and outstanding as of March 31, 2021.
During
the year ended March 31, 2022, the Company reduce authorized share capital for both common stock of 450,000,000 to 5,000,000 and preferred
stock of 50,000,000 to 500,000, while par value remains the same for both common and preferred stock. As of June 30, 2023, the Company
have an issued and outstanding share of common stock of 1,000,000 while no preferred share was issued and outstanding.
|
| X |
- References
+ Details
| Name: |
us-gaap_EquityAbstract |
| Namespace Prefix: |
us-gaap_ |
| Data Type: |
xbrli:stringItemType |
| Balance Type: |
na |
| Period Type: |
duration |
|
| X |
- DefinitionThe entire disclosure for equity. Reference 1: http://www.xbrl.org/2003/role/disclosureRef
-Topic 505
-SubTopic 10
-Name Accounting Standards Codification
-Section 50
-Paragraph 13
-Subparagraph (b)
-Publisher FASB
-URI https://asc.fasb.org//1943274/2147481112/505-10-50-13
Reference 2: http://www.xbrl.org/2003/role/disclosureRef
-Topic 505
-SubTopic 10
-Name Accounting Standards Codification
-Section 50
-Paragraph 13
-Subparagraph (h)
-Publisher FASB
-URI https://asc.fasb.org//1943274/2147481112/505-10-50-13
Reference 3: http://www.xbrl.org/2003/role/disclosureRef
-Topic 505
-SubTopic 10
-Name Accounting Standards Codification
-Section 50
-Paragraph 14
-Subparagraph (b)
-Publisher FASB
-URI https://asc.fasb.org//1943274/2147481112/505-10-50-14
Reference 4: http://www.xbrl.org/2003/role/disclosureRef
-Topic 946
-SubTopic 235
-Name Accounting Standards Codification
-Section 50
-Paragraph 2
-Subparagraph (a)
-Publisher FASB
-URI https://asc.fasb.org//1943274/2147481062/946-235-50-2
Reference 5: http://www.xbrl.org/2003/role/disclosureRef
-Topic 946
-SubTopic 235
-Name Accounting Standards Codification
-Section 50
-Paragraph 2
-Subparagraph (d)
-Publisher FASB
-URI https://asc.fasb.org//1943274/2147481062/946-235-50-2
Reference 6: http://www.xbrl.org/2003/role/disclosureRef
-Topic 946
-SubTopic 505
-Name Accounting Standards Codification
-Section 50
-Paragraph 6
-Publisher FASB
-URI https://asc.fasb.org//1943274/2147481004/946-505-50-6
Reference 7: http://www.xbrl.org/2003/role/disclosureRef
-Topic 815
-SubTopic 40
-Name Accounting Standards Codification
-Section 50
-Paragraph 6
-Subparagraph (a)
-Publisher FASB
-URI https://asc.fasb.org//1943274/2147480237/815-40-50-6
Reference 8: http://www.xbrl.org/2003/role/disclosureRef
-Topic 505
-SubTopic 10
-Name Accounting Standards Codification
-Section S99
-Paragraph 1
-Subparagraph (SX 210.3-04)
-Publisher FASB
-URI https://asc.fasb.org//1943274/2147480008/505-10-S99-1
Reference 9: http://www.xbrl.org/2003/role/disclosureRef
-Topic 235
-SubTopic 10
-Name Accounting Standards Codification
-Section S99
-Paragraph 1
-Subparagraph (SX 210.4-08(e)(1))
-Publisher FASB
-URI https://asc.fasb.org//1943274/2147480678/235-10-S99-1
Reference 10: http://fasb.org/us-gaap/role/ref/legacyRef
-Topic 505
-Name Accounting Standards Codification
-Publisher FASB
-URI https://asc.fasb.org//505/tableOfContent
Reference 11: http://www.xbrl.org/2003/role/disclosureRef
-Topic 505
-SubTopic 10
-Name Accounting Standards Codification
-Section 50
-Paragraph 13
-Publisher FASB
-URI https://asc.fasb.org//1943274/2147481112/505-10-50-13
Reference 12: http://www.xbrl.org/2003/role/disclosureRef
-Topic 505
-SubTopic 10
-Name Accounting Standards Codification
-Section 50
-Paragraph 13
-Subparagraph (g)
-Publisher FASB
-URI https://asc.fasb.org//1943274/2147481112/505-10-50-13
Reference 13: http://www.xbrl.org/2003/role/disclosureRef
-Topic 505
-SubTopic 10
-Name Accounting Standards Codification
-Section 50
-Paragraph 13
-Subparagraph (i)
-Publisher FASB
-URI https://asc.fasb.org//1943274/2147481112/505-10-50-13
Reference 14: http://www.xbrl.org/2003/role/disclosureRef
-Topic 505
-SubTopic 10
-Name Accounting Standards Codification
-Section 50
-Paragraph 14
-Subparagraph (a)
-Publisher FASB
-URI https://asc.fasb.org//1943274/2147481112/505-10-50-14
Reference 15: http://www.xbrl.org/2003/role/disclosureRef
-Topic 505
-SubTopic 10
-Name Accounting Standards Codification
-Section 50
-Paragraph 14
-Subparagraph (c)
-Publisher FASB
-URI https://asc.fasb.org//1943274/2147481112/505-10-50-14
Reference 16: http://www.xbrl.org/2003/role/disclosureRef
-Topic 505
-SubTopic 10
-Name Accounting Standards Codification
-Section 50
-Paragraph 16
-Subparagraph (b)
-Publisher FASB
-URI https://asc.fasb.org//1943274/2147481112/505-10-50-16
Reference 17: http://www.xbrl.org/2003/role/disclosureRef
-Topic 505
-SubTopic 10
-Name Accounting Standards Codification
-Section 50
-Paragraph 18
-Subparagraph (a)
-Publisher FASB
-URI https://asc.fasb.org//1943274/2147481112/505-10-50-18
Reference 18: http://www.xbrl.org/2003/role/disclosureRef
-Topic 505
-SubTopic 10
-Name Accounting Standards Codification
-Section 50
-Paragraph 18
-Subparagraph (b)
-Publisher FASB
-URI https://asc.fasb.org//1943274/2147481112/505-10-50-18
Reference 19: http://www.xbrl.org/2003/role/disclosureRef
-Topic 505
-SubTopic 10
-Name Accounting Standards Codification
-Section 50
-Paragraph 18
-Subparagraph (d)
-Publisher FASB
-URI https://asc.fasb.org//1943274/2147481112/505-10-50-18
| Name: |
us-gaap_StockholdersEquityNoteDisclosureTextBlock |
| Namespace Prefix: |
us-gaap_ |
| Data Type: |
dtr-types:textBlockItemType |
| Balance Type: |
na |
| Period Type: |
duration |
|
v3.23.2
FOREIGN CURRENCY EXCHANGE RATE
|
3 Months Ended |
Jun. 30, 2023 |
|---|
| Foreign Currency [Abstract] |
|
| FOREIGN CURRENCY EXCHANGE RATE |
13.
FOREIGN CURRENCY EXCHANGE RATE
The
Company cannot guarantee that the current exchange rate will remain stable, therefore there is a possibility that the Company could post
the same amount of income for two comparable periods and because of the fluctuating exchange rate post higher or lower income depending
on exchange rate converted into US$ at the end of the financial year. The exchange rate could fluctuate depending on changes in political
and economic environments without notice.
|
| X |
- References
+ Details
| Name: |
us-gaap_ForeignCurrencyAbstract |
| Namespace Prefix: |
us-gaap_ |
| Data Type: |
xbrli:stringItemType |
| Balance Type: |
na |
| Period Type: |
duration |
|
| X |
- DefinitionThe entire disclosure for foreign currency transactions and translation. This may include description of foreign currency transactions, foreign currency gains and losses, explanation of change in cumulative translation adjustment, description of effect of subsequent foreign currency exchange rate change, cumulative translation adjustment movement, foreign currency translation adjustment by component movement, translation adjustment for net investment hedge movement, adjustment for long-term intercompany transactions, schedule of long-term intercompany balances and any other foreign currency transactions and translation related items. Reference 1: http://www.xbrl.org/2003/role/exampleRef
-Topic 946
-SubTopic 830
-Name Accounting Standards Codification
-Section 55
-Paragraph 14
-Publisher FASB
-URI https://asc.fasb.org//1943274/2147480167/946-830-55-14
Reference 2: http://www.xbrl.org/2003/role/exampleRef
-Topic 946
-SubTopic 830
-Name Accounting Standards Codification
-Section 55
-Paragraph 15
-Publisher FASB
-URI https://asc.fasb.org//1943274/2147480167/946-830-55-15
Reference 3: http://www.xbrl.org/2003/role/exampleRef
-Topic 946
-SubTopic 830
-Name Accounting Standards Codification
-Section 55
-Paragraph 13
-Publisher FASB
-URI https://asc.fasb.org//1943274/2147480167/946-830-55-13
Reference 4: http://www.xbrl.org/2003/role/exampleRef
-Topic 946
-SubTopic 830
-Name Accounting Standards Codification
-Section 55
-Paragraph 16
-Publisher FASB
-URI https://asc.fasb.org//1943274/2147480167/946-830-55-16
Reference 5: http://www.xbrl.org/2003/role/disclosureRef
-Topic 830
-SubTopic 30
-Name Accounting Standards Codification
-Section S99
-Paragraph 1
-Publisher FASB
-URI https://asc.fasb.org//1943274/2147479424/830-30-S99-1
Reference 6: http://www.xbrl.org/2003/role/disclosureRef
-Topic 830
-Name Accounting Standards Codification
-Publisher FASB
-URI https://asc.fasb.org//830/tableOfContent
Reference 7: http://www.xbrl.org/2003/role/recommendedDisclosureRef
-Topic 830
-SubTopic 20
-Name Accounting Standards Codification
-Section 50
-Paragraph 3
-Publisher FASB
-URI https://asc.fasb.org//1943274/2147481926/830-20-50-3
| Name: |
us-gaap_ForeignCurrencyDisclosureTextBlock |
| Namespace Prefix: |
us-gaap_ |
| Data Type: |
dtr-types:textBlockItemType |
| Balance Type: |
na |
| Period Type: |
duration |
|
v3.23.2
SEGMENT REPORTING
|
3 Months Ended |
Jun. 30, 2023 |
|---|
| Segment Reporting [Abstract] |
|
| SEGMENT REPORTING |
14.
SEGMENT REPORTING
ASC
280, “Segment Reporting” establishes standards for reporting information about operating segments on a basis consistent with
the Company’s internal organization structure as well as information about services categories, business segments and major customers
in financial statements. The Company has two reportable segments based on business unit, food and beverage business and asset leasing
business and three reportable segments based on country, United States, Marshall and Malaysia.
In
accordance with the “Segment Reporting” Topic of the ASC, the Company’s chief operating decision maker has been identified
as the Chief Executive Officer and President, who reviews operating results to make decisions about allocating resources and assessing
performance for the entire Company. Existing guidance, which is based on a management approach to segment reporting, establishes requirements
to report selected segment information quarterly and to report annually entity-wide disclosures about products and services, major customers,
and the countries in which the entity holds material assets and reports revenue. All material operating units qualify for aggregation
under “Segment Reporting” due to their similar customer base and similarities in economic characteristics; nature of products
and services; and procurement, manufacturing and distribution processes.
SCHEDULE
OF SEGMENT REPORTING INFORMATION BY BUSINESS UNIT
| | |
| | |
|
|
|
| |
| | |
| | |
For the Three Months Ended and As of June 30, 2023 | |
| By Business Unit | |
Assets Leasing Business | | |
Food & Beverage Business | | |
Total | |
| Revenue | |
$ | 7,859 | | |
$ | - | | |
$ | 7,859 | |
| | |
| | | |
| | | |
| | |
| Cost of revenue | |
| - | | |
| - | | |
| - | |
| General and administrative expenses | |
| (54,549 | ) | |
| - | | |
| (54,549 | ) |
| | |
| | | |
| | | |
| | |
| Loss from operations | |
| (46,690 | ) | |
| - | | |
| (46,690 | ) |
| | |
| | | |
| | | |
| | |
| Total assets | |
$ | 74,730 | | |
$ | - | | |
$ | 74,730 | |
| Capital expenditure | |
$ | - | | |
$ | - | | |
$ | - | |
| | |
|
|
|
|
| | | |
| | |
| | |
For the Three Months Ended and As of June 30, 2022 | |
| By Business Unit | |
Assets Leasing Business | | |
Food & Beverage Business | | |
Total | |
| Revenue | |
$ | - | | |
$ | 44,909 | | |
$ | 44,909 | |
| | |
| | | |
| | | |
| | |
| Cost of revenue | |
| - | | |
| (20,963 | ) | |
| (20,963 | ) |
| General and administrative expenses | |
| - | | |
| (167,029 | ) | |
| (167,029 | ) |
| | |
| | | |
| | | |
| | |
| Loss from operations | |
| - | | |
| (143,083 | ) | |
| (143,083 | ) |
| | |
| | | |
| | | |
| | |
| Total assets | |
$ | - | | |
$ | 604,353 | | |
$ | 604,353 | |
| Capital expenditure | |
$ | - | | |
$ | 10,209 | | |
$ | 10,209 | |
SCHEDULE
OF SEGMENT REPORTING INFORMATION BY COUNTRY
| | |
| | | |
| | | |
| | | |
| | |
| | |
For the Three Months Ended and As of June 30, 2023 | |
| By Country | |
United States | | |
Marshall | | |
Malaysia | | |
Total | |
| Revenue | |
$ | - | | |
$ | - | | |
$ | 7,859 | | |
$ | 7,859 | |
| | |
| | | |
| | | |
| | | |
| | |
| Cost of revenue | |
| - | | |
| - | | |
| - | | |
| - | |
| General and administrative expenses | |
| (43,854 | ) | |
| - | | |
| (10,695 | ) | |
| (54,549 | ) |
| | |
| | | |
| | | |
| | | |
| | |
| Loss from operations | |
| (43,854 | ) | |
| - | | |
| (2,836 | ) | |
| (46,690 | ) |
| | |
| | | |
| | | |
| | | |
| | |
| Total assets | |
$ | 8,834 | | |
$ | - | | |
$ | 65,896 | | |
$ | 74,730 | |
| Capital expenditure | |
$ | - | | |
$ | - | | |
$ | - | | |
$ | - | |
| | |
| | |
|
|
|
| |
| | | |
| | |
| | |
For the Three Months Ended and As of June 30, 2022 | |
| By Country | |
United States | | |
Marshall | | |
Malaysia | | |
Total | |
| Revenue | |
$ | - | | |
$ | - | | |
$ | 44,909 | | |
$ | 44,909 | |
| | |
| | | |
| | | |
| | | |
| | |
| Cost of revenue | |
| - | | |
| - | | |
| (20,963 | ) | |
| (20,963 | ) |
| General and administrative expenses | |
| - | | |
| - | | |
| (167,029 | ) | |
| (167,029 | ) |
| | |
| | | |
| | | |
| | | |
| | |
| Loss from operations | |
| - | | |
| - | | |
| (143,083 | ) | |
| (143,083 | ) |
| | |
| | | |
| | | |
| | | |
| | |
| Total assets | |
$ | 7,310 | | |
$ | - | | |
$ | 597,043 | | |
$ | 604,353 | |
| Capital expenditure | |
$ | - | | |
$ | - | | |
$ | 10,209 | | |
$ | 10,209 | |
|
| X |
- References
+ Details
| Name: |
us-gaap_SegmentReportingAbstract |
| Namespace Prefix: |
us-gaap_ |
| Data Type: |
xbrli:stringItemType |
| Balance Type: |
na |
| Period Type: |
duration |
|
| X |
- DefinitionThe entire disclosure for reporting segments including data and tables. Reportable segments include those that meet any of the following quantitative thresholds a) it's reported revenue, including sales to external customers and intersegment sales or transfers is 10 percent or more of the combined revenue, internal and external, of all operating segments b) the absolute amount of its reported profit or loss is 10 percent or more of the greater, in absolute amount of 1) the combined reported profit of all operating segments that did not report a loss or 2) the combined reported loss of all operating segments that did report a loss c) its assets are 10 percent or more of the combined assets of all operating segments. Reference 1: http://www.xbrl.org/2003/role/disclosureRef
-Topic 280
-SubTopic 10
-Name Accounting Standards Codification
-Section 50
-Paragraph 22
-Publisher FASB
-URI https://asc.fasb.org//1943274/2147482810/280-10-50-22
Reference 2: http://www.xbrl.org/2003/role/disclosureRef
-Topic 280
-SubTopic 10
-Name Accounting Standards Codification
-Section 50
-Paragraph 15
-Publisher FASB
-URI https://asc.fasb.org//1943274/2147482810/280-10-50-15
Reference 3: http://www.xbrl.org/2003/role/disclosureRef
-Topic 280
-SubTopic 10
-Name Accounting Standards Codification
-Section 50
-Paragraph 31
-Publisher FASB
-URI https://asc.fasb.org//1943274/2147482810/280-10-50-31
Reference 4: http://www.xbrl.org/2003/role/disclosureRef
-Topic 280
-SubTopic 10
-Name Accounting Standards Codification
-Section 50
-Paragraph 32
-Subparagraph (d)
-Publisher FASB
-URI https://asc.fasb.org//1943274/2147482810/280-10-50-32
Reference 5: http://www.xbrl.org/2003/role/disclosureRef
-Topic 280
-SubTopic 10
-Name Accounting Standards Codification
-Section 50
-Paragraph 42
-Publisher FASB
-URI https://asc.fasb.org//1943274/2147482810/280-10-50-42
Reference 6: http://www.xbrl.org/2003/role/disclosureRef
-Topic 280
-SubTopic 10
-Name Accounting Standards Codification
-Section 50
-Paragraph 32
-Subparagraph (f)
-Publisher FASB
-URI https://asc.fasb.org//1943274/2147482810/280-10-50-32
Reference 7: http://www.xbrl.org/2003/role/disclosureRef
-Topic 280
-SubTopic 10
-Name Accounting Standards Codification
-Section 50
-Paragraph 40
-Publisher FASB
-URI https://asc.fasb.org//1943274/2147482810/280-10-50-40
Reference 8: http://www.xbrl.org/2003/role/disclosureRef
-Topic 280
-Name Accounting Standards Codification
-Publisher FASB
-URI https://asc.fasb.org//280/tableOfContent
Reference 9: http://www.xbrl.org/2003/role/disclosureRef
-Topic 280
-SubTopic 10
-Name Accounting Standards Codification
-Section 50
-Paragraph 26
-Publisher FASB
-URI https://asc.fasb.org//1943274/2147482810/280-10-50-26
Reference 10: http://www.xbrl.org/2003/role/disclosureRef
-Topic 280
-SubTopic 10
-Name Accounting Standards Codification
-Section 50
-Paragraph 34
-Publisher FASB
-URI https://asc.fasb.org//1943274/2147482810/280-10-50-34
Reference 11: http://www.xbrl.org/2003/role/disclosureRef
-Topic 280
-SubTopic 10
-Name Accounting Standards Codification
-Section 50
-Paragraph 41
-Publisher FASB
-URI https://asc.fasb.org//1943274/2147482810/280-10-50-41
Reference 12: http://www.xbrl.org/2003/role/disclosureRef
-Topic 280
-SubTopic 10
-Name Accounting Standards Codification
-Section 50
-Paragraph 21
-Subparagraph (a)
-Publisher FASB
-URI https://asc.fasb.org//1943274/2147482810/280-10-50-21
Reference 13: http://www.xbrl.org/2003/role/disclosureRef
-Topic 280
-SubTopic 10
-Name Accounting Standards Codification
-Section 50
-Paragraph 21
-Subparagraph (b)
-Publisher FASB
-URI https://asc.fasb.org//1943274/2147482810/280-10-50-21
Reference 14: http://www.xbrl.org/2003/role/disclosureRef
-Topic 280
-SubTopic 10
-Name Accounting Standards Codification
-Section 50
-Paragraph 32
-Subparagraph (e)
-Publisher FASB
-URI https://asc.fasb.org//1943274/2147482810/280-10-50-32
| Name: |
us-gaap_SegmentReportingDisclosureTextBlock |
| Namespace Prefix: |
us-gaap_ |
| Data Type: |
dtr-types:textBlockItemType |
| Balance Type: |
na |
| Period Type: |
duration |
|
v3.23.2
SUBSEQUENT EVENTS
|
3 Months Ended |
Jun. 30, 2023 |
|---|
| Subsequent Events [Abstract] |
|
| SUBSEQUENT EVENTS |
15.
SUBSEQUENT EVENTS
In
accordance with ASC Topic 855, “Subsequent Events”, which establishes general standards of accounting for and disclosure
of events that occur after the balance sheet date but before financial statements are issued, the Company has evaluated all events or
transactions that occurred after June 30, 2023 up through the date the Company presented these audited financial statements.
|
| X |
- References
+ Details
| Name: |
us-gaap_SubsequentEventsAbstract |
| Namespace Prefix: |
us-gaap_ |
| Data Type: |
xbrli:stringItemType |
| Balance Type: |
na |
| Period Type: |
duration |
|
| X |
- DefinitionThe entire disclosure for significant events or transactions that occurred after the balance sheet date through the date the financial statements were issued or the date the financial statements were available to be issued. Examples include: the sale of a capital stock issue, purchase of a business, settlement of litigation, catastrophic loss, significant foreign exchange rate changes, loans to insiders or affiliates, and transactions not in the ordinary course of business. Reference 1: http://www.xbrl.org/2003/role/disclosureRef
-Topic 855
-Name Accounting Standards Codification
-Publisher FASB
-URI https://asc.fasb.org//855/tableOfContent
Reference 2: http://www.xbrl.org/2003/role/disclosureRef
-Topic 855
-SubTopic 10
-Name Accounting Standards Codification
-Section 50
-Paragraph 2
-Subparagraph (a)
-Publisher FASB
-URI https://asc.fasb.org//1943274/2147483399/855-10-50-2
| Name: |
us-gaap_SubsequentEventsTextBlock |
| Namespace Prefix: |
us-gaap_ |
| Data Type: |
dtr-types:textBlockItemType |
| Balance Type: |
na |
| Period Type: |
duration |
|
v3.23.2
SUMMARY OF SIGNIFICANT ACCOUNTING POLICIES (Policies)
|
3 Months Ended |
Jun. 30, 2023 |
|---|
| Accounting Policies [Abstract] |
|
| Basis of Presentation |
Basis
of Presentation
These
accompanying financial statements have been prepared in accordance with generally accepted accounting principles in the United States
of America (“US GAAP”).
The
accompanying financial statements include the accounts of the Company and its wholly-owned subsidiaries. Intercompany transactions and
balances were eliminated in consolidation.
Below
is the organization chart of the Group.
|
| Use of Estimates |
Use
of Estimates
In
preparing these financial statements, management makes estimates and assumptions that affect the reported amounts of assets and liabilities
in the balance sheets and revenues and expenses during the years reported. Actual results may differ from these estimates.
|
| Cash and Cash Equivalents |
Cash
and Cash Equivalents
The
Company considers short-term, highly liquid investments with an original maturity of 90 days or less to be cash equivalents.
Our
deposit in Malaysia is currently deposit in Public Bank Berhad and Standard Chartered Bank (Malaysia) Berhad, and there is a Perbadanan
Insurans Deposit Malaysia protects our eligible deposits held with bank in Malaysia which is members of the Scheme. The scheme will pay
a compensation up to a limit of Malaysia Ringgit (“MYR”) 250,000 per deposit per member bank, which is equivalent to $53,557,
if the aforementioned banks fail.
|
| Plant and Equipment |
Plant
and Equipment
Plant
and equipment are stated at cost, with depreciation provided using the straight-line method over the following periods:
SCHEDULE
OF DEPRECIATION AND AMORTIZATION PERIODS OF PLANT AND EQUIPMENT
| Asset Categories | |
Depreciation Periods |
| Office and kitchen equipment | |
10 years |
| Motor vehicle | |
5 years |
|
| Intangible Asset |
Intangible
Asset
Intangible
assets are stated at cost, with amortization provided using the straight-line method over the following periods:
SCHEDULE
OF AMORTIZATION PERIOD OF INTANGIBLE ASSET
| Asset
Categories |
|
Amortization
Periods |
| Trademark |
|
10 years |
|
| Inventories |
Inventories
Inventories
consisting of products available for sell, are stated at the lower of cost or market value. Cost of inventory is determined using the
first-in, first-out (FIFO) method. Inventory reserve is recorded to write down the cost of inventory to the estimated market value due
to slow-moving merchandise and damaged goods, which is dependent upon factors such as historical and forecasted consumer demand, and
promotional environment. The Company takes ownership, risks and rewards of the products purchased. Write downs are recorded in cost of
revenue in the consolidated statements of operations and comprehensive income (loss).
|
| Revenue recognition |
Revenue
recognition
Revenue
is generated through sale of goods and delivery services. Revenue is recognized when a customer obtains control of promised goods or
services and is recognized in an amount that reflects the consideration that the Company expects to receive in exchange for those goods
or services. In addition, the standard requires disclosure of the nature, amount, timing, and uncertainty of revenue and cash flows arising
from contracts with customers. The amount of revenue that is recorded reflects the consideration that the Company expects to receive
in exchange for those goods and services. The Company applies the following five-step model in order to determine this amount:
| (i) | identification
of the promised goods and services in the contract; |
(ii)
determination of whether the promised goods and services are performance obligations, including whether they are distinct in the context
of the contract;
(iii)
measurement of the transaction price, including the constraint on variable consideration;
(iv)
allocation of the transaction price to the performance obligations; and
(v)
recognition of revenue when (or as) the Company satisfies each performance obligation.
The
Company adopted ASU 2014-09, Revenue from Contracts with Customers (Topic 606). Under Topic 606, the Company records revenue when persuasive
evidence of an arrangement exists, delivery has occurred, the fee is fixed or determinable and collectability is probable. The Company
records revenue from the sale of product upon shipment or delivery of the products to the customer. The Company doesn’t allow return
of the products purchased or refund unless the food delivered is spoilt.
|
| Cost of revenue |
Cost
of revenue
Cost
of revenue includes the purchase cost of raw material for manufacturing and distribute to customers and packing materials. It includes
purchasing and receiving costs, internal transfer costs, other costs of distribution network, opening and closing inventory net off discount
received and return outwards in cost of revenue.
|
| Income tax expense |
Income
tax expense
Income
taxes are determined in accordance with the provisions of ASC Topic 740, “Income Taxes” (“ASC Topic 740”). Under
this method, deferred tax assets and liabilities are recognized for the future tax consequences attributable to differences between the
financial statement carrying amounts of existing assets and liabilities and their respective tax basis. Deferred tax assets and liabilities
are measured using enacted income tax rates expected to apply to taxable income in the years in which those temporary differences are
expected to be recovered or settled. Any effect on deferred tax assets and liabilities of a change in tax rates is recognized in income
in the period that includes the enactment date.
ASC
740 prescribes a comprehensive model for how companies should recognize, measure, present, and disclosed in their financial statements
uncertain tax positions taken or expected to be taken on a tax return. Under ASC 740, tax positions must initially be recognized in the
financial statements when it is more likely than not the position will be sustained upon examination by the tax authorities. Such tax
positions must initially and subsequently be measured as the largest amount of tax benefit that has a greater than 50% likelihood of
being realized upon ultimate settlement with the tax authority assuming full knowledge of the position and relevant facts.
The
Company conducts major businesses in Malaysia and is subject to tax in their own jurisdictions. As a result of its business activities,
the Company will file separate tax returns that are subject to examination by the foreign tax authorities.
|
| Foreign currencies translation |
Foreign
currencies translation
Transactions
denominated in currencies other than the functional currency are translated into the functional currency at the exchange rates prevailing
at the dates of the transaction. Monetary assets and liabilities denominated in currencies other than the functional currency are translated
into the functional currency using the applicable exchange rates at the balance sheet dates. The resulting exchange differences are recorded
in the statement of operations and comprehensive income (loss).
The
functional currency of the Company is the United States Dollars (“US$”) and the accompanying financial statements have been
expressed in US$. In addition, the Company’s subsidiary maintains its books and record in Malaysian Ringgits (“MYR”)
and United States Dollars (“US$”), which is the respective functional currency as being the primary currency of the economic
environment in which the entity operates.
In
general, for consolidation purposes, assets and liabilities of its subsidiaries whose functional currency is not US$ are translated into
US$, in accordance with ASC Topic 830-30, “Translation of Financial Statement”, using the exchange rate on the balance sheet
date. Revenues and expenses are translated at average rates prevailing during the period. The gains and losses resulting from translation
of financial statements of foreign subsidiary are recorded as a separate component of accumulated other comprehensive income.
Translation
of amounts from the local currency of the Company into US$1 has been made at the following exchange rates for the respective periods:
SCHEDULE OF EXCHANGE RATE TRANSLATION OF AMOUNTS FROM LOCAL CURRENCY
| | |
For the three months ended
June 30 | |
| | |
2023 | | |
2022 | |
| Period-end MYR : US$1 exchange rate | |
| 4.67 | | |
| 4.41 | |
| Period-average MYR : US$1 exchange rate | |
| 4.58 | | |
| 4.38 | |
|
| Related parties |
Related
parties
Parties,
which can be a corporation or individual, are considered to be related if the Company has the ability, directly or indirectly, to control
the other party or exercise significant influence over the other party in making financial and operating decisions. Companies are also
considered to be related if they are subject to common control or common significant influence.
|
| Fair value of financial instruments |
Fair
value of financial instruments
The carrying value of the Company’s financial instruments: cash and
cash equivalents, account receivable, deposits and other receivables, account payable and accrued expenses and other payable approximate
at their fair values because of the short-term nature of these financial instruments.
The
Company also follows the guidance of the ASC Topic 820-10, “Fair Value Measurements and Disclosures” (“ASC 820-10”),
with respect to financial assets and liabilities that are measured at fair value. ASC 820-10 establishes a three-tier fair value hierarchy
that prioritizes the inputs used in measuring fair value as follows:
Level
1 : Observable inputs such as quoted prices in active markets;
Level
2 : Inputs, other than the quoted prices in active markets, that are observable either directly or indirectly; and
Level
3 : Unobservable inputs in which there is little or no market data, which require the reporting entity to develop its own assumptions.
As
of June 30, 2023 and 2022, the Company did not have any nonfinancial assets and liabilities that are recognized or disclosed at fair
value in the financial statements, at least annually, on a recurring basis, nor did the Company have any assets or liabilities measured
at fair value on a non-recurring basis.
|
| Net Income/(Loss) per Share |
Net
Income/(Loss) per Share
The
Company calculates net income/(loss) per share in accordance with ASC Topic 260, “Earnings per Share.” Basic income/(loss)
per share is computed by dividing the net income/(loss) by the weighted-average number of common shares outstanding during the period.
Diluted income per share is computed similar to basic income/(loss) per share except that the denominator is increased to include the
number of additional common shares that would have been outstanding if the potential common stock equivalents had been issued and if
the additional common shares were dilutive.
|
| Lease |
Lease
The
Company adopted the ASU No. 2016-02, on April 1, 2019 (date of inception). The Company leases central kitchen and restaurants for fixed
periods pre-emptive extension options. The Company recognizes lease payments for its short-term lease on a straight-line basis over the
lease term.
As
of June 30, 2023, the Company have no operating lease of which lease liability is initially and subsequently measured at the present
value of the unpaid lease payments at the lease commencement date. The right-of-use asset is initially measured at cost, which comprises
the initial amount of the lease liability adjusted for lease payments made at or before the lease commencement date, plus any initial
direct costs incurred less any lease incentives received. Costs associated with operating lease assets are recognized on a straight-line
basis within operating expenses over the term of the lease.
In
determining the present value of the unpaid lease payments, ASC 842 requires a lessee to discount its unpaid lease payments using the
interest rate implicit in the lease or, if that rate cannot be readily determined, its incremental borrowing rate. As most of the Company
leases do not provide an implicit rate, the Company uses its incremental borrowing rate as the discount rate for the lease. The Company
incremental borrowing rate is estimated to approximate the interest rate on a collateralized basis with similar terms and payments.
|
| Accounts Receivable |
Accounts Receivable
Financial instruments that
potentially subject the Company to concentrations of credit risk consist primarily of accounts receivable. The Company extends credit
to its customers in the normal course of business and generally does not require collateral. The Company’s credit terms are dependent
upon the segment, and the customer. The Company assesses the probability of collection from each customer at the outset of the arrangement
based on a number of factors, including the customer’s payment history and its current creditworthiness. If in management’s
judgment collection is not probable, the Company does not record revenue until the uncertainty is removed.
Management performs ongoing
credit evaluations, and the Company maintains an allowance for potential credit losses based upon its loss history and its aging analysis.
The allowance for doubtful accounts is the Company’s best estimate of the amount of credit losses in existing accounts receivable.
Management reviews the allowance for doubtful accounts each reporting period based on a detailed analysis of trade receivables. In the
analysis, management primarily considers the age of the customer’s receivable, and also considers the creditworthiness of the customer,
the economic conditions of the customer’s industry, general economic conditions and trends, and the business relationship and history
with its customers, among other factors. If any of these factors change, the Company may also change its original estimates, which could
impact the level of the Company’s future allowance for doubtful accounts. If judgments regarding the collectability of receivables
were incorrect, adjustments to the allowance may be required, which would reduce profitability.
Accounts receivable are recognized and carried at the original invoice
amount less an allowance for any uncollectible amounts. An estimate for doubtful accounts receivable is made when collection of the full
amount is no longer probable. Bad debts are written off as identified. For the quarter ended
June 30, 2023, the Company makes an allowance for expected credit loss of $7,859.
|
| Recently Issued Accounting Standards |
Recently
Issued Accounting Standards
In
June 2016, the FASB issued Accounting Standards Update No. 2016-13, Financial Instruments—Credit Losses (Topic 326): Measurement
of Credit Losses on Financial Instruments, which introduced the expected credit losses methodology for the measurement of credit losses
on financial assets measured at amortized cost basis, replacing the previous incurred loss methodology. In November 2019, the FASB issued
ASU 2019-10 highlighted the adoption timeline. For smaller reporting entities, Topic 326 is effective for annual periods beginning after
December 15, 2022, including interim periods within those fiscal years, of which is effective for the Company on April 1, 2023. An analysis
of receivables, including credit losses, was conducted during the first quarter of fiscal 2023. The Company does not anticipate that
the adoption of the new guidance will have a material impact on our consolidated financial statements.
Other
recent accounting pronouncements issued by the FASB, including its Emerging Issues Task Force, the American Institute of Certified Public
Accountants, and the Securities and Exchange Commission did not or are not believed by management to have a material impact on the Company’s
present or future financial statements.
|
| X |
- DefinitionCost of revenue [Policy Text Block]
| Name: |
SHMY_CostOfRevenuePolicyTextBlock |
| Namespace Prefix: |
SHMY_ |
| Data Type: |
dtr-types:textBlockItemType |
| Balance Type: |
na |
| Period Type: |
duration |
|
| X |
- DefinitionRelated parties [Policy Text Block]
| Name: |
SHMY_RelatedPartiesPolicyTextBlock |
| Namespace Prefix: |
SHMY_ |
| Data Type: |
dtr-types:textBlockItemType |
| Balance Type: |
na |
| Period Type: |
duration |
|
| X |
- References
+ Details
| Name: |
us-gaap_AccountingPoliciesAbstract |
| Namespace Prefix: |
us-gaap_ |
| Data Type: |
xbrli:stringItemType |
| Balance Type: |
na |
| Period Type: |
duration |
|
| X |
- DefinitionDisclosure of accounting policy for basis of accounting, or basis of presentation, used to prepare the financial statements (for example, US Generally Accepted Accounting Principles, Other Comprehensive Basis of Accounting, IFRS).
| Name: |
us-gaap_BasisOfAccountingPolicyPolicyTextBlock |
| Namespace Prefix: |
us-gaap_ |
| Data Type: |
dtr-types:textBlockItemType |
| Balance Type: |
na |
| Period Type: |
duration |
|
| X |
- DefinitionDisclosure of accounting policy for cash and cash equivalents, including the policy for determining which items are treated as cash equivalents. Other information that may be disclosed includes (1) the nature of any restrictions on the entity's use of its cash and cash equivalents, (2) whether the entity's cash and cash equivalents are insured or expose the entity to credit risk, (3) the classification of any negative balance accounts (overdrafts), and (4) the carrying basis of cash equivalents (for example, at cost) and whether the carrying amount of cash equivalents approximates fair value. Reference 1: http://fasb.org/us-gaap/role/ref/legacyRef
-Name Accounting Standards Codification
-Topic 230
-SubTopic 10
-Section 50
-Paragraph 1
-Publisher FASB
-URI https://asc.fasb.org//1943274/2147482913/230-10-50-1
| Name: |
us-gaap_CashAndCashEquivalentsPolicyTextBlock |
| Namespace Prefix: |
us-gaap_ |
| Data Type: |
dtr-types:textBlockItemType |
| Balance Type: |
na |
| Period Type: |
duration |
|
| X |
- DefinitionDisclosure of accounting policy for computing basic and diluted earnings or loss per share for each class of common stock and participating security. Addresses all significant policy factors, including any antidilutive items that have been excluded from the computation and takes into account stock dividends, splits and reverse splits that occur after the balance sheet date of the latest reporting period but before the issuance of the financial statements. Reference 1: http://fasb.org/us-gaap/role/ref/legacyRef
-Name Accounting Standards Codification
-Topic 260
-SubTopic 10
-Section 50
-Paragraph 1
-Subparagraph (c)
-Publisher FASB
-URI https://asc.fasb.org//1943274/2147482662/260-10-50-1
Reference 2: http://fasb.org/us-gaap/role/ref/legacyRef
-Name Accounting Standards Codification
-Topic 260
-SubTopic 10
-Section 50
-Paragraph 2
-Publisher FASB
-URI https://asc.fasb.org//1943274/2147482662/260-10-50-2
| Name: |
us-gaap_EarningsPerSharePolicyTextBlock |
| Namespace Prefix: |
us-gaap_ |
| Data Type: |
dtr-types:textBlockItemType |
| Balance Type: |
na |
| Period Type: |
duration |
|
| X |
- DefinitionDisclosure of accounting policy for determining the fair value of financial instruments. Reference 1: http://fasb.org/us-gaap/role/ref/legacyRef
-Name Accounting Standards Codification
-Section 60
-Paragraph 1
-SubTopic 10
-Topic 820
-Publisher FASB
-URI https://asc.fasb.org//1943274/2147482053/820-10-60-1
Reference 2: http://fasb.org/us-gaap/role/ref/legacyRef
-Name Accounting Standards Codification
-Section 50
-Paragraph 1
-SubTopic 10
-Topic 825
-Publisher FASB
-URI https://asc.fasb.org//1943274/2147482907/825-10-50-1
| Name: |
us-gaap_FairValueOfFinancialInstrumentsPolicy |
| Namespace Prefix: |
us-gaap_ |
| Data Type: |
dtr-types:textBlockItemType |
| Balance Type: |
na |
| Period Type: |
duration |
|
| X |
- DefinitionDisclosure of accounting policy for (1) transactions denominated in a currency other than the reporting enterprise's functional currency, (2) translating foreign currency financial statements that are incorporated into the financial statements of the reporting enterprise by consolidation, combination, or the equity method of accounting, and (3) remeasurement of the financial statements of a foreign reporting enterprise in a hyperinflationary economy. Reference 1: http://www.xbrl.org/2003/role/disclosureRef
-Topic 830
-Name Accounting Standards Codification
-Publisher FASB
-URI https://asc.fasb.org//830/tableOfContent
| Name: |
us-gaap_ForeignCurrencyTransactionsAndTranslationsPolicyTextBlock |
| Namespace Prefix: |
us-gaap_ |
| Data Type: |
dtr-types:textBlockItemType |
| Balance Type: |
na |
| Period Type: |
duration |
|
| X |
- DefinitionDisclosure of accounting policy for income taxes, which may include its accounting policies for recognizing and measuring deferred tax assets and liabilities and related valuation allowances, recognizing investment tax credits, operating loss carryforwards, tax credit carryforwards, and other carryforwards, methodologies for determining its effective income tax rate and the characterization of interest and penalties in the financial statements. Reference 1: http://www.xbrl.org/2003/role/disclosureRef
-Topic 946
-SubTopic 10
-Name Accounting Standards Codification
-Section S99
-Paragraph 3
-Subparagraph (SX 210.6-03(h)(1))
-Publisher FASB
-URI https://asc.fasb.org//1943274/2147479886/946-10-S99-3
Reference 2: http://www.xbrl.org/2003/role/disclosureRef
-Topic 740
-SubTopic 10
-Name Accounting Standards Codification
-Section 50
-Paragraph 17
-Subparagraph (b)
-Publisher FASB
-URI https://asc.fasb.org//1943274/2147482685/740-10-50-17
Reference 3: http://www.xbrl.org/2003/role/disclosureRef
-Topic 740
-SubTopic 10
-Name Accounting Standards Codification
-Section 50
-Paragraph 9
-Publisher FASB
-URI https://asc.fasb.org//1943274/2147482685/740-10-50-9
Reference 4: http://www.xbrl.org/2003/role/disclosureRef
-Topic 740
-SubTopic 10
-Name Accounting Standards Codification
-Section 45
-Paragraph 25
-Publisher FASB
-URI https://asc.fasb.org//1943274/2147482525/740-10-45-25
Reference 5: http://www.xbrl.org/2003/role/disclosureRef
-Topic 740
-SubTopic 10
-Name Accounting Standards Codification
-Section 45
-Paragraph 28
-Publisher FASB
-URI https://asc.fasb.org//1943274/2147482525/740-10-45-28
Reference 6: http://www.xbrl.org/2003/role/disclosureRef
-Topic 740
-SubTopic 10
-Name Accounting Standards Codification
-Section 50
-Paragraph 19
-Publisher FASB
-URI https://asc.fasb.org//1943274/2147482685/740-10-50-19
Reference 7: http://www.xbrl.org/2003/role/disclosureRef
-Topic 220
-SubTopic 10
-Name Accounting Standards Codification
-Section 50
-Paragraph 1
-Publisher FASB
-URI https://asc.fasb.org//1943274/2147482765/220-10-50-1
Reference 8: http://www.xbrl.org/2003/role/disclosureRef
-Topic 740
-SubTopic 10
-Name Accounting Standards Codification
-Section 50
-Paragraph 20
-Publisher FASB
-URI https://asc.fasb.org//1943274/2147482685/740-10-50-20
| Name: |
us-gaap_IncomeTaxPolicyTextBlock |
| Namespace Prefix: |
us-gaap_ |
| Data Type: |
dtr-types:textBlockItemType |
| Balance Type: |
na |
| Period Type: |
duration |
|
| X |
- DefinitionDisclosure of accounting policy for finite-lived intangible assets. This accounting policy also might address: (1) the amortization method used; (2) the useful lives of such assets; and (3) how the entity assesses and measures impairment of such assets. Reference 1: http://www.xbrl.org/2003/role/disclosureRef
-Topic 926
-SubTopic 20
-Name Accounting Standards Codification
-Section 50
-Paragraph 5
-Publisher FASB
-URI https://asc.fasb.org//1943274/2147483154/926-20-50-5
Reference 2: http://www.xbrl.org/2003/role/exampleRef
-Topic 235
-SubTopic 10
-Name Accounting Standards Codification
-Section 50
-Paragraph 4
-Subparagraph (c)
-Publisher FASB
-URI https://asc.fasb.org//1943274/2147483426/235-10-50-4
Reference 3: http://www.xbrl.org/2003/role/disclosureRef
-Topic 920
-SubTopic 350
-Name Accounting Standards Codification
-Section 50
-Paragraph 1
-Subparagraph (a)
-Publisher FASB
-URI https://asc.fasb.org//1943274/2147483256/920-350-50-1
Reference 4: http://www.xbrl.org/2003/role/disclosureRef
-Topic 920
-SubTopic 350
-Name Accounting Standards Codification
-Section 50
-Paragraph 1
-Subparagraph (b)
-Publisher FASB
-URI https://asc.fasb.org//1943274/2147483256/920-350-50-1
Reference 5: http://www.xbrl.org/2003/role/disclosureRef
-Topic 920
-SubTopic 350
-Name Accounting Standards Codification
-Section 50
-Paragraph 4
-Subparagraph (a)
-Publisher FASB
-URI https://asc.fasb.org//1943274/2147483256/920-350-50-4
Reference 6: http://fasb.org/us-gaap/role/ref/legacyRef
-Name Accounting Standards Codification
-Topic 350
-SubTopic 30
-Section 50
-Paragraph 2
-Subparagraph (a)
-Publisher FASB
-URI https://asc.fasb.org//1943274/2147482665/350-30-50-2
| Name: |
us-gaap_IntangibleAssetsFiniteLivedPolicy |
| Namespace Prefix: |
us-gaap_ |
| Data Type: |
dtr-types:textBlockItemType |
| Balance Type: |
na |
| Period Type: |
duration |
|
| X |
- DefinitionDisclosure of inventory accounting policy for inventory classes, including, but not limited to, basis for determining inventory amounts, methods by which amounts are added and removed from inventory classes, loss recognition on impairment of inventories, and situations in which inventories are stated above cost. Reference 1: http://www.xbrl.org/2003/role/disclosureRef
-Topic 210
-SubTopic 10
-Name Accounting Standards Codification
-Section 50
-Paragraph 1
-Publisher FASB
-URI https://asc.fasb.org//1943274/2147483489/210-10-50-1
Reference 2: http://www.xbrl.org/2003/role/disclosureRef
-Topic 210
-SubTopic 10
-Name Accounting Standards Codification
-Section S99
-Paragraph 1
-Subparagraph (SX 210.5-02(6)(b))
-Publisher FASB
-URI https://asc.fasb.org//1943274/2147480566/210-10-S99-1
Reference 3: http://www.xbrl.org/2003/role/exampleRef
-Topic 235
-SubTopic 10
-Name Accounting Standards Codification
-Section 50
-Paragraph 4
-Subparagraph (d)
-Publisher FASB
-URI https://asc.fasb.org//1943274/2147483426/235-10-50-4
Reference 4: http://www.xbrl.org/2003/role/disclosureRef
-Topic 912
-SubTopic 330
-Name Accounting Standards Codification
-Section 50
-Paragraph 1
-Publisher FASB
-URI https://asc.fasb.org//1943274/2147482105/912-330-50-1
Reference 5: http://www.xbrl.org/2003/role/disclosureRef
-Topic 330
-Name Accounting Standards Codification
-Publisher FASB
-URI https://asc.fasb.org//330/tableOfContent
Reference 6: http://www.xbrl.org/2003/role/disclosureRef
-Topic 330
-SubTopic 10
-Name Accounting Standards Codification
-Section 50
-Paragraph 1
-Publisher FASB
-URI https://asc.fasb.org//1943274/2147483080/330-10-50-1
Reference 7: http://www.xbrl.org/2003/role/disclosureRef
-Topic 330
-SubTopic 10
-Name Accounting Standards Codification
-Section 50
-Paragraph 4
-Publisher FASB
-URI https://asc.fasb.org//1943274/2147483080/330-10-50-4
Reference 8: http://www.xbrl.org/2003/role/disclosureRef
-Name Accounting Standards Codification
-Section 45
-Paragraph 6
-Subparagraph (a)
-SubTopic 10
-Topic 270
-Publisher FASB
-URI https://asc.fasb.org//1943274/2147482989/270-10-45-6
| Name: |
us-gaap_InventoryPolicyTextBlock |
| Namespace Prefix: |
us-gaap_ |
| Data Type: |
dtr-types:textBlockItemType |
| Balance Type: |
na |
| Period Type: |
duration |
|
| X |
- DefinitionDisclosure of accounting policy for leasing arrangement entered into by lessee. Reference 1: http://www.xbrl.org/2003/role/disclosureRef
-Topic 842
-SubTopic 20
-Name Accounting Standards Codification
-Section 50
-Paragraph 1
-Subparagraph (b)
-Publisher FASB
-URI https://asc.fasb.org//1943274/2147478964/842-20-50-1
| Name: |
us-gaap_LesseeLeasesPolicyTextBlock |
| Namespace Prefix: |
us-gaap_ |
| Data Type: |
dtr-types:textBlockItemType |
| Balance Type: |
na |
| Period Type: |
duration |
|
| X |
- DefinitionDisclosure of accounting policy pertaining to new accounting pronouncements that may impact the entity's financial reporting. Includes, but is not limited to, quantification of the expected or actual impact.
| Name: |
us-gaap_NewAccountingPronouncementsPolicyPolicyTextBlock |
| Namespace Prefix: |
us-gaap_ |
| Data Type: |
dtr-types:textBlockItemType |
| Balance Type: |
na |
| Period Type: |
duration |
|
| X |
- DefinitionDisclosure of accounting policy for long-lived, physical asset used in normal conduct of business and not intended for resale. Includes, but is not limited to, work of art, historical treasure, and similar asset classified as collections. Reference 1: http://fasb.org/us-gaap/role/ref/legacyRef
-Name Accounting Standards Codification
-Section 50
-Paragraph 1
-SubTopic 10
-Topic 360
-Publisher FASB
-URI https://asc.fasb.org//1943274/2147482099/360-10-50-1
Reference 2: http://www.xbrl.org/2003/role/disclosureRef
-Topic 944
-SubTopic 210
-Name Accounting Standards Codification
-Section S99
-Paragraph 1
-Subparagraph (SX 210.7-03(a)(8)(a))
-Publisher FASB
-URI https://asc.fasb.org//1943274/2147479440/944-210-S99-1
Reference 3: http://www.xbrl.org/2003/role/disclosureRef
-Name Accounting Standards Codification
-Section 50
-Paragraph 6
-SubTopic 360
-Topic 958
-Publisher FASB
-URI https://asc.fasb.org//1943274/2147480321/958-360-50-6
Reference 4: http://www.xbrl.org/2003/role/disclosureRef
-Name Accounting Standards Codification
-Section 50
-Paragraph 1
-Subparagraph (d)
-SubTopic 360
-Topic 958
-Publisher FASB
-URI https://asc.fasb.org//1943274/2147480321/958-360-50-1
| Name: |
us-gaap_PropertyPlantAndEquipmentPolicyTextBlock |
| Namespace Prefix: |
us-gaap_ |
| Data Type: |
dtr-types:textBlockItemType |
| Balance Type: |
na |
| Period Type: |
duration |
|
| X |
- DefinitionDisclosure of accounting policy for revenue from contract with customer. Reference 1: http://www.xbrl.org/2003/role/disclosureRef
-Topic 606
-SubTopic 10
-Name Accounting Standards Codification
-Section 50
-Paragraph 17
-Publisher FASB
-URI https://asc.fasb.org//1943274/2147479806/606-10-50-17
Reference 2: http://www.xbrl.org/2003/role/disclosureRef
-Topic 606
-SubTopic 10
-Name Accounting Standards Codification
-Section 50
-Paragraph 19
-Publisher FASB
-URI https://asc.fasb.org//1943274/2147479806/606-10-50-19
Reference 3: http://www.xbrl.org/2003/role/disclosureRef
-Topic 606
-SubTopic 10
-Name Accounting Standards Codification
-Section 50
-Paragraph 18
-Subparagraph (a)
-Publisher FASB
-URI https://asc.fasb.org//1943274/2147479806/606-10-50-18
Reference 4: http://www.xbrl.org/2003/role/disclosureRef
-Topic 606
-SubTopic 10
-Name Accounting Standards Codification
-Section 50
-Paragraph 18
-Subparagraph (b)
-Publisher FASB
-URI https://asc.fasb.org//1943274/2147479806/606-10-50-18
Reference 5: http://www.xbrl.org/2003/role/disclosureRef
-Topic 606
-SubTopic 10
-Name Accounting Standards Codification
-Section 50
-Paragraph 20
-Subparagraph (a)
-Publisher FASB
-URI https://asc.fasb.org//1943274/2147479806/606-10-50-20
Reference 6: http://www.xbrl.org/2003/role/disclosureRef
-Topic 606
-SubTopic 10
-Name Accounting Standards Codification
-Section 50
-Paragraph 20
-Subparagraph (b)
-Publisher FASB
-URI https://asc.fasb.org//1943274/2147479806/606-10-50-20
Reference 7: http://www.xbrl.org/2003/role/disclosureRef
-Topic 606
-SubTopic 10
-Name Accounting Standards Codification
-Section 50
-Paragraph 20
-Subparagraph (c)
-Publisher FASB
-URI https://asc.fasb.org//1943274/2147479806/606-10-50-20
Reference 8: http://www.xbrl.org/2003/role/disclosureRef
-Topic 606
-SubTopic 10
-Name Accounting Standards Codification
-Section 50
-Paragraph 20
-Subparagraph (d)
-Publisher FASB
-URI https://asc.fasb.org//1943274/2147479806/606-10-50-20
Reference 9: http://www.xbrl.org/2003/role/exampleRef
-Name Accounting Standards Codification
-Section 50
-Paragraph 4
-Subparagraph (e)
-SubTopic 10
-Topic 235
-Publisher FASB
-URI https://asc.fasb.org//1943274/2147483426/235-10-50-4
Reference 10: http://www.xbrl.org/2003/role/disclosureRef
-Name Accounting Standards Codification
-Topic 606
-Publisher FASB
-URI https://asc.fasb.org//606/tableOfContent
| Name: |
us-gaap_RevenueFromContractWithCustomerPolicyTextBlock |
| Namespace Prefix: |
us-gaap_ |
| Data Type: |
dtr-types:textBlockItemType |
| Balance Type: |
na |
| Period Type: |
duration |
|
| X |
- DefinitionDisclosure of accounting policy for accounts receivable. Reference 1: http://www.xbrl.org/2003/role/disclosureRef
-Topic 310
-SubTopic 10
-Name Accounting Standards Codification
-Section 50
-Paragraph 2
-Publisher FASB
-URI https://asc.fasb.org//1943274/2147481962/310-10-50-2
Reference 2: http://www.xbrl.org/2003/role/disclosureRef
-Topic 310
-SubTopic 20
-Name Accounting Standards Codification
-Section 50
-Paragraph 1
-Publisher FASB
-URI https://asc.fasb.org//1943274/2147481569/310-20-50-1
Reference 3: http://fasb.org/us-gaap/role/ref/otherTransitionRef
-Name Accounting Standards Codification
-Section 50
-Paragraph 11B
-Subparagraph (b)
-SubTopic 10
-Topic 310
-Publisher FASB
-URI https://asc.fasb.org//1943274/2147481962/310-10-50-11B
Reference 4: http://www.xbrl.org/2003/role/disclosureRef
-Topic 310
-SubTopic 10
-Name Accounting Standards Codification
-Section 50
-Paragraph 1
-Subparagraph (a)
-Publisher FASB
-URI https://asc.fasb.org//1943274/2147481962/310-10-50-1
Reference 5: http://fasb.org/us-gaap/role/ref/otherTransitionRef
-Name Accounting Standards Codification
-Section 50
-Paragraph 6
-SubTopic 10
-Topic 310
-Publisher FASB
-URI https://asc.fasb.org//1943274/2147481962/310-10-50-6
Reference 6: http://fasb.org/us-gaap/role/ref/otherTransitionRef
-Name Accounting Standards Codification
-Section 50
-Paragraph 15
-Subparagraph (d)
-SubTopic 10
-Topic 310
-Publisher FASB
-URI https://asc.fasb.org//1943274/2147481962/310-10-50-15
| Name: |
us-gaap_TradeAndOtherAccountsReceivablePolicy |
| Namespace Prefix: |
us-gaap_ |
| Data Type: |
dtr-types:textBlockItemType |
| Balance Type: |
na |
| Period Type: |
duration |
|
| X |
- DefinitionDisclosure of accounting policy for the use of estimates in the preparation of financial statements in conformity with generally accepted accounting principles. Reference 1: http://fasb.org/us-gaap/role/ref/legacyRef
-Name Accounting Standards Codification
-Topic 275
-SubTopic 10
-Section 50
-Paragraph 9
-Publisher FASB
-URI https://asc.fasb.org//1943274/2147482861/275-10-50-9
Reference 2: http://fasb.org/us-gaap/role/ref/legacyRef
-Name Accounting Standards Codification
-Topic 275
-SubTopic 10
-Section 50
-Paragraph 4
-Publisher FASB
-URI https://asc.fasb.org//1943274/2147482861/275-10-50-4
Reference 3: http://www.xbrl.org/2003/role/disclosureRef
-Name Accounting Standards Codification
-Section 50
-Paragraph 1
-Subparagraph (b)
-SubTopic 10
-Topic 275
-Publisher FASB
-URI https://asc.fasb.org//1943274/2147482861/275-10-50-1
Reference 4: http://www.xbrl.org/2003/role/disclosureRef
-Name Accounting Standards Codification
-Section 50
-Paragraph 1
-Subparagraph (c)
-SubTopic 10
-Topic 275
-Publisher FASB
-URI https://asc.fasb.org//1943274/2147482861/275-10-50-1
Reference 5: http://www.xbrl.org/2003/role/disclosureRef
-Name Accounting Standards Codification
-Section 50
-Paragraph 11
-SubTopic 10
-Topic 275
-Publisher FASB
-URI https://asc.fasb.org//1943274/2147482861/275-10-50-11
Reference 6: http://www.xbrl.org/2003/role/disclosureRef
-Name Accounting Standards Codification
-Section 50
-Paragraph 12
-SubTopic 10
-Topic 275
-Publisher FASB
-URI https://asc.fasb.org//1943274/2147482861/275-10-50-12
Reference 7: http://fasb.org/us-gaap/role/ref/legacyRef
-Name Accounting Standards Codification
-Topic 275
-SubTopic 10
-Section 50
-Paragraph 8
-Publisher FASB
-URI https://asc.fasb.org//1943274/2147482861/275-10-50-8
| Name: |
us-gaap_UseOfEstimates |
| Namespace Prefix: |
us-gaap_ |
| Data Type: |
dtr-types:textBlockItemType |
| Balance Type: |
na |
| Period Type: |
duration |
|
v3.23.2
ORGANIZATION AND BUSINESS BACKGROUND (Tables)
|
3 Months Ended |
Jun. 30, 2023 |
|---|
| Organization, Consolidation and Presentation of Financial Statements [Abstract] |
|
| SCHEDULE OF COMPANY'S SUBSIDIARIES |
The
Company, through its wholly owned subsidiaries, produce and distribute high quality dessert through Lucky Star and operate two restaurants
through SH Dessert. Details of the Company’s subsidiaries:
SCHEDULE
OF COMPANY'S SUBSIDIARIES
| No. | |
Company Name | |
Domicile and Date of
Incorporation | |
Particulars of Issued
Capital | |
Principal Activities |
| 1 | |
Synergy Empire Holding Limited | |
Marshall Islands, October 22, 2018 | |
1 Share of Ordinary Share, US$1 each | |
Investment Holding |
| | |
| |
| |
| |
|
| 2 | |
Lucky Star F&B Sdn. Bhd. | |
Malaysia, February 9, 2010 | |
100,000 Share of Ordinary Share, MYR1 each | |
Food and Beverage Assets Leasing |
| | |
| |
| |
| |
|
| 3 | |
SH Dessert Sdn. Bhd. | |
Malaysia, February 19, 2016 | |
100 Share of Ordinary Share, MYR1 each | |
Food and Beverage Assets Leasing |
|
| X |
- References
+ Details
| Name: |
us-gaap_OrganizationConsolidationAndPresentationOfFinancialStatementsAbstract |
| Namespace Prefix: |
us-gaap_ |
| Data Type: |
xbrli:stringItemType |
| Balance Type: |
na |
| Period Type: |
duration |
|
| X |
- DefinitionTabular disclosure of sales of stock or previously unissued stock made by subsidiary or equity method investee to investors outside the consolidated group. This includes stock issued in a business combination in exchange for shares of an acquired entity.
| Name: |
us-gaap_ScheduleOfSaleOfStockBySubsidiaryOrEquityMethodInvesteeDisclosureTextBlock |
| Namespace Prefix: |
us-gaap_ |
| Data Type: |
dtr-types:textBlockItemType |
| Balance Type: |
na |
| Period Type: |
duration |
|
v3.23.2
SUMMARY OF SIGNIFICANT ACCOUNTING POLICIES (Tables)
|
3 Months Ended |
Jun. 30, 2023 |
|---|
| Accounting Policies [Abstract] |
|
| SCHEDULE OF DEPRECIATION AND AMORTIZATION PERIODS OF PLANT AND EQUIPMENT |
Plant
and equipment are stated at cost, with depreciation provided using the straight-line method over the following periods:
SCHEDULE
OF DEPRECIATION AND AMORTIZATION PERIODS OF PLANT AND EQUIPMENT
| Asset Categories | |
Depreciation Periods |
| Office and kitchen equipment | |
10 years |
| Motor vehicle | |
5 years |
|
| SCHEDULE OF AMORTIZATION PERIOD OF INTANGIBLE ASSET |
Intangible
assets are stated at cost, with amortization provided using the straight-line method over the following periods:
SCHEDULE
OF AMORTIZATION PERIOD OF INTANGIBLE ASSET
| Asset
Categories |
|
Amortization
Periods |
| Trademark |
|
10 years |
|
| SCHEDULE OF EXCHANGE RATE TRANSLATION OF AMOUNTS FROM LOCAL CURRENCY |
Translation
of amounts from the local currency of the Company into US$1 has been made at the following exchange rates for the respective periods:
SCHEDULE OF EXCHANGE RATE TRANSLATION OF AMOUNTS FROM LOCAL CURRENCY
| | |
For the three months ended
June 30 | |
| | |
2023 | | |
2022 | |
| Period-end MYR : US$1 exchange rate | |
| 4.67 | | |
| 4.41 | |
| Period-average MYR : US$1 exchange rate | |
| 4.58 | | |
| 4.38 | |
|
| X |
- DefinitionSchedule of depreciation and amortization periods of plant and eqiupment [Table Text Block]
| Name: |
SHMY_ScheduleOfDepreciationAndAmortizationPeriodsOfPlantAndEquipmentTableTextBlock |
| Namespace Prefix: |
SHMY_ |
| Data Type: |
dtr-types:textBlockItemType |
| Balance Type: |
na |
| Period Type: |
duration |
|
| X |
- References
+ Details
| Name: |
us-gaap_AccountingPoliciesAbstract |
| Namespace Prefix: |
us-gaap_ |
| Data Type: |
xbrli:stringItemType |
| Balance Type: |
na |
| Period Type: |
duration |
|
| X |
- DefinitionTabular disclosure of assets, excluding financial assets and goodwill, lacking physical substance with a finite life, by either major class or business segment. Reference 1: http://fasb.org/us-gaap/role/ref/legacyRef
-Name Accounting Standards Codification
-Topic 350
-SubTopic 30
-Section 50
-Paragraph 1
-Subparagraph (a)
-Publisher FASB
-URI https://asc.fasb.org//1943274/2147482665/350-30-50-1
Reference 2: http://fasb.org/us-gaap/role/ref/legacyRef
-Name Accounting Standards Codification
-Topic 350
-SubTopic 30
-Section 50
-Paragraph 2
-Subparagraph (a)
-Publisher FASB
-URI https://asc.fasb.org//1943274/2147482665/350-30-50-2
| Name: |
us-gaap_ScheduleOfFiniteLivedIntangibleAssetsTableTextBlock |
| Namespace Prefix: |
us-gaap_ |
| Data Type: |
dtr-types:textBlockItemType |
| Balance Type: |
na |
| Period Type: |
duration |
|
| X |
- DefinitionTabular disclosure of long-term intercompany foreign balances, including related intercompany entity, underlying foreign currencies and amounts of intercompany foreign currency transactions that are of a long-term investment nature (that is settlement is not planned or anticipated in the foreseeable future), as of the balance sheet date. Reference 1: http://fasb.org/us-gaap/role/ref/legacyRef
-Name Accounting Standards Codification
-Topic 830
-SubTopic 30
-Section 45
-Paragraph 20
-Subparagraph (b)
-Publisher FASB
-URI https://asc.fasb.org//1943274/2147481694/830-30-45-20
| Name: |
us-gaap_ScheduleOfIntercompanyForeignCurrencyBalancesTextBlock |
| Namespace Prefix: |
us-gaap_ |
| Data Type: |
dtr-types:textBlockItemType |
| Balance Type: |
na |
| Period Type: |
duration |
|
v3.23.2
ACCOUNTS RECEIVABLE, NET (Tables)
|
3 Months Ended |
Jun. 30, 2023 |
|---|
| Receivables [Abstract] |
|
| SCHEDULE OF ACCOUNTS RECEIVABLE NET |
SCHEDULE
OF ACCOUNTS RECEIVABLE NET
| | |
As of June 30, 2023 | | |
As of March 31, 2023 | |
| Accounts receivable, gross | |
$ | 7,859 | | |
$ | - | |
| Allowance for expected credit loss | |
| (7,859 | ) | |
| - | |
| Accounts receivable, net | |
$ | - | | |
$ | - | |
|
| X |
- DefinitionTabular disclosure of allowance for credit loss on accounts receivable. Reference 1: http://www.xbrl.org/2009/role/commonPracticeRef
-Topic 326
-SubTopic 20
-Name Accounting Standards Codification
-Section 50
-Paragraph 13
-Publisher FASB
-URI https://asc.fasb.org//1943274/2147479319/326-20-50-13
| Name: |
us-gaap_AccountsReceivableAllowanceForCreditLossTableTextBlock |
| Namespace Prefix: |
us-gaap_ |
| Data Type: |
dtr-types:textBlockItemType |
| Balance Type: |
na |
| Period Type: |
duration |
|
| X |
- References
+ Details
| Name: |
us-gaap_ReceivablesAbstract |
| Namespace Prefix: |
us-gaap_ |
| Data Type: |
xbrli:stringItemType |
| Balance Type: |
na |
| Period Type: |
duration |
|
v3.23.2
| X |
- References
+ Details
| Name: |
SHMY_DisclosurePrepaidExpensesAndDepositsAbstract |
| Namespace Prefix: |
SHMY_ |
| Data Type: |
xbrli:stringItemType |
| Balance Type: |
na |
| Period Type: |
duration |
|
| X |
- DefinitionTabular disclosure of the amounts paid in advance for capitalized costs that will be expensed with the passage of time or the occurrence of a triggering event, and will be charged against earnings within one year or the normal operating cycle, if longer; the aggregate carrying amount of current assets, not separately presented elsewhere in the balance sheet; and other deferred costs.
| Name: |
us-gaap_DeferredCostsCapitalizedPrepaidAndOtherAssetsDisclosureTextBlock |
| Namespace Prefix: |
us-gaap_ |
| Data Type: |
dtr-types:textBlockItemType |
| Balance Type: |
na |
| Period Type: |
duration |
|
v3.23.2
PLANT AND EQUIPMENT (Tables)
|
3 Months Ended |
Jun. 30, 2023 |
|---|
| Property, Plant and Equipment [Abstract] |
|
| SCHEDULE OF PLANT AND EQUIPMENT |
SCHEDULE OF PLANT AND EQUIPMENT
| | |
As of
June 30, 2023 | | |
As of March
31, 2023 | |
| Office equipment | |
| 37,223 | | |
| 39,285 | |
| Kitchen equipment | |
| 40,953 | | |
| 43,222 | |
| Motor vehicle | |
| 10,497 | | |
| 11,078 | |
| Total plant and equipment | |
$ | 88,673 | | |
$ | 93,585 | |
| Less: Accumulated depreciation | |
| (27,917 | ) | |
| (27,401 | ) |
| Total plant and equipment | |
$ | 60,756 | | |
$ | 66,184 | |
|
| X |
- References
+ Details
| Name: |
us-gaap_PropertyPlantAndEquipmentAbstract |
| Namespace Prefix: |
us-gaap_ |
| Data Type: |
xbrli:stringItemType |
| Balance Type: |
na |
| Period Type: |
duration |
|
| X |
- DefinitionTabular disclosure of physical assets used in the normal conduct of business and not intended for resale. Includes, but is not limited to, balances by class of assets, depreciation and depletion expense and method used, including composite depreciation, and accumulated deprecation. Reference 1: http://fasb.org/us-gaap/role/ref/legacyRef
-Name Accounting Standards Codification
-Section 50
-Paragraph 1
-SubTopic 10
-Topic 360
-Publisher FASB
-URI https://asc.fasb.org//1943274/2147482099/360-10-50-1
| Name: |
us-gaap_PropertyPlantAndEquipmentTextBlock |
| Namespace Prefix: |
us-gaap_ |
| Data Type: |
dtr-types:textBlockItemType |
| Balance Type: |
na |
| Period Type: |
duration |
|
v3.23.2
| X |
- References
+ Details
| Name: |
us-gaap_PayablesAndAccrualsAbstract |
| Namespace Prefix: |
us-gaap_ |
| Data Type: |
xbrli:stringItemType |
| Balance Type: |
na |
| Period Type: |
duration |
|
| X |
- DefinitionTabular disclosure of the (a) carrying value as of the balance sheet date of liabilities incurred (and for which invoices have typically been received) and payable to vendors for goods and services received that are used in an entity's business (accounts payable); (b) other payables; and (c) accrued liabilities. Examples include taxes, interest, rent and utilities. Used to reflect the current portion of the liabilities (due within one year or within the normal operating cycle if longer). An alternative caption includes accrued expenses.
| Name: |
us-gaap_ScheduleOfAccountsPayableAndAccruedLiabilitiesTableTextBlock |
| Namespace Prefix: |
us-gaap_ |
| Data Type: |
dtr-types:textBlockItemType |
| Balance Type: |
na |
| Period Type: |
duration |
|
v3.23.2
AMOUNT DUE TO A DIRECTOR (Tables)
|
3 Months Ended |
Jun. 30, 2023 |
|---|
| Related Party Transactions [Abstract] |
|
| SCHEDULE OF AMOUNT DUE TO A DIRECTOR |
Both
aforementioned loans are unsecured, non-interest bearing and payable on demand.
SCHEDULE
OF AMOUNT DUE TO A DIRECTOR
| Amount due to director, Mr. Leong Will Liam | |
| |
| Balance as of March 31, 2023 | |
$ | 1,300,486 | |
| Loan from Director | |
| 15,050 | |
| Foreign currency translation | |
| (49,449 | ) |
| Balance as of June 30, 2023 | |
$ | 1,266,087 | |
| Balance as of June 30, 2023 – Amount due to Synergy Empire HK | |
| 24,822 | |
| Balance as of June 30, 2023 – Total amount due to director | |
$ | 1,290,909 | |
|
| X |
- DefinitionTabular disclosure of related party transactions. Examples of related party transactions include, but are not limited to, transactions between (a) a parent company and its subsidiary; (b) subsidiaries of a common parent; (c) and entity and its principal owners and (d) affiliates.
| Name: |
us-gaap_ScheduleOfRelatedPartyTransactionsTableTextBlock |
| Namespace Prefix: |
us-gaap_ |
| Data Type: |
dtr-types:textBlockItemType |
| Balance Type: |
na |
| Period Type: |
duration |
|
v3.23.2
BANK BORROWING (Tables)
|
3 Months Ended |
Jun. 30, 2023 |
|---|
| Debt Disclosure [Abstract] |
|
| SUMMARY OF OUTSTANDING BALANCE OF BUSINESS LOANS |
The
outstanding balance of business loan as of June 30 and March 31, 2023 can be summarized as follow:
SUMMARY
OF OUTSTANDING BALANCE OF BUSINESS LOANS
| | |
As of
June 30, 2022 | | |
As of
March 31, 2023 | |
| Bank borrowing (Current portion) | |
$ | 3,480 | | |
$ | 7,954 | |
| Bank borrowing (Non-current portion) | |
| - | | |
| - | |
| Total | |
$ | 3,480 | | |
$ | 7,954 | |
|
| SCHEDULE OF MATURITIES OF LOAN |
Maturities
of the loan for each of the three years and thereafter are as follows:
SCHEDULE
OF MATURITIES OF LOAN
| Year ending March 31 | | |
| |
| | | |
| |
| 2023 | | |
$ | 3,480 | |
| Total | | |
$ | 3,480 | |
|
| X |
- References
+ Details
| Name: |
us-gaap_DebtDisclosureAbstract |
| Namespace Prefix: |
us-gaap_ |
| Data Type: |
xbrli:stringItemType |
| Balance Type: |
na |
| Period Type: |
duration |
|
| X |
- DefinitionTabular disclosure of information pertaining to short-term and long-debt instruments or arrangements, including but not limited to identification of terms, features, collateral requirements and other information necessary to a fair presentation.
| Name: |
us-gaap_ScheduleOfDebtTableTextBlock |
| Namespace Prefix: |
us-gaap_ |
| Data Type: |
dtr-types:textBlockItemType |
| Balance Type: |
na |
| Period Type: |
duration |
|
| X |
- DefinitionTabular disclosure of maturity and sinking fund requirement for long-term debt. Reference 1: http://fasb.org/us-gaap/role/ref/legacyRef
-Name Accounting Standards Codification
-Section 50
-Paragraph 1
-SubTopic 10
-Topic 470
-Publisher FASB
-URI https://asc.fasb.org//1943274/2147481544/470-10-50-1
| Name: |
us-gaap_ScheduleOfMaturitiesOfLongTermDebtTableTextBlock |
| Namespace Prefix: |
us-gaap_ |
| Data Type: |
dtr-types:textBlockItemType |
| Balance Type: |
na |
| Period Type: |
duration |
|
v3.23.2
INCOME TAXES (Tables)
|
3 Months Ended |
Jun. 30, 2023 |
|---|
| Income Tax Disclosure [Abstract] |
|
| SCHEDULE OF INCOME (LOSS) BEFORE INCOME TAXES |
The
loss before income taxes of the Company for the three months ended June 30, 2023 and 2022 were comprised of the following:
SCHEDULE
OF INCOME (LOSS) BEFORE INCOME TAXES
| | |
For the three months ended
June 30 | |
| | |
2023 | | |
2022 | |
| Tax jurisdictions from: | |
| | | |
| | |
| – Local | |
$ | (43,854 | ) | |
$ | (40,188 | ) |
| | |
| | | |
| | |
| – Foreign, representing: | |
| | | |
| | |
| Marshall Islands (non-taxable jurisdiction) | |
| - | | |
| - | |
| Hong Kong | |
| - | | |
| - | |
| Malaysia | |
| (2,959 | ) | |
| (103,409 | ) |
| Loss before income taxes | |
$ | ) | |
$ | ) |
|
| SUMMARY OF PROVISION FOR INCOME TAX |
Provision
for income taxes consisted of the following:
SUMMARY
OF PROVISION FOR INCOME TAX
| | |
| For the three months ended
June 30 | |
| | |
| 2023 | | |
| 2022 | |
| Current: | |
| | | |
| | |
| – Local | |
$ | - | | |
$ | - | |
| – Foreign: | |
| | | |
| | |
| Marshall Islands (non-taxable jurisdiction) | |
| - | | |
| - | |
| Malaysia | |
| - | | |
| - | |
| | |
| | | |
| | |
| Deferred: | |
| | | |
| | |
| – Local | |
| - | | |
| - | |
| – Foreign | |
| - | | |
| - | |
| | |
$ | - | | |
$ | - | |
|
| SCHEDULE OF DEFERRED TAX ASSETS AND LIABILITIES |
The
following table sets forth the significant components of the aggregate deferred tax assets of the Company as of June 30 and March 31,
2023:
SCHEDULE
OF DEFERRED TAX ASSETS AND LIABILITIES
| | |
As of
June 30, 2023 | | |
As of
March 31, 2023 |
| Deferred tax assets: | |
| | |
|
|
|
|
| | |
| | |
|
|
|
|
| Net operating loss carryforwards | |
$ | | | |
$ |
|
|
| – United States of America | |
| 69,648 | | |
|
60,439 |
|
| – Marshall Islands | |
| - | | |
|
- |
|
| – Malaysia | |
| 313,534 | | |
|
313,031 |
|
| | |
| 383,182 | | |
|
373,470 |
|
| Less: valuation allowance | |
| (383,182 | ) | |
|
(373,470 |
) |
| Deferred tax assets | |
$ | - | | |
$ |
- |
|
|
| X |
- DefinitionTabular disclosure of the components of income tax expense attributable to continuing operations for each year presented including, but not limited to: current tax expense (benefit), deferred tax expense (benefit), investment tax credits, government grants, the benefits of operating loss carryforwards, tax expense that results from allocating certain tax benefits either directly to contributed capital or to reduce goodwill or other noncurrent intangible assets of an acquired entity, adjustments of a deferred tax liability or asset for enacted changes in tax laws or rates or a change in the tax status of the entity, and adjustments of the beginning-of-the-year balances of a valuation allowance because of a change in circumstances that causes a change in judgment about the realizability of the related deferred tax asset in future years. Reference 1: http://fasb.org/us-gaap/role/ref/legacyRef
-Topic 740
-SubTopic 10
-Name Accounting Standards Codification
-Paragraph 9
-Section 50
-Publisher FASB
-URI https://asc.fasb.org//1943274/2147482685/740-10-50-9
| Name: |
us-gaap_ScheduleOfComponentsOfIncomeTaxExpenseBenefitTableTextBlock |
| Namespace Prefix: |
us-gaap_ |
| Data Type: |
dtr-types:textBlockItemType |
| Balance Type: |
na |
| Period Type: |
duration |
|
| X |
- DefinitionTabular disclosure of the components of net deferred tax asset or liability recognized in an entity's statement of financial position, including the following: the total of all deferred tax liabilities, the total of all deferred tax assets, the total valuation allowance recognized for deferred tax assets. Reference 1: http://fasb.org/us-gaap/role/ref/legacyRef
-Topic 740
-SubTopic 10
-Name Accounting Standards Codification
-Paragraph 2
-Section 50
-Publisher FASB
-URI https://asc.fasb.org//1943274/2147482685/740-10-50-2
| Name: |
us-gaap_ScheduleOfDeferredTaxAssetsAndLiabilitiesTableTextBlock |
| Namespace Prefix: |
us-gaap_ |
| Data Type: |
dtr-types:textBlockItemType |
| Balance Type: |
na |
| Period Type: |
duration |
|
| X |
- DefinitionTabular disclosure of income before income tax between domestic and foreign jurisdictions. Reference 1: http://www.xbrl.org/2009/role/commonPracticeRef
-Topic 235
-SubTopic 10
-Name Accounting Standards Codification
-Section S99
-Paragraph 1
-Subparagraph (SX 210.4-08(h)(1)(Note 1))
-Publisher FASB
-URI https://asc.fasb.org//1943274/2147480678/235-10-S99-1
| Name: |
us-gaap_ScheduleOfIncomeBeforeIncomeTaxDomesticAndForeignTableTextBlock |
| Namespace Prefix: |
us-gaap_ |
| Data Type: |
dtr-types:textBlockItemType |
| Balance Type: |
na |
| Period Type: |
duration |
|
v3.23.2
SEGMENT REPORTING (Tables)
|
3 Months Ended |
Jun. 30, 2023 |
|---|
| Segment Reporting [Abstract] |
|
| SCHEDULE OF SEGMENT REPORTING INFORMATION BY BUSINESS UNIT |
SCHEDULE
OF SEGMENT REPORTING INFORMATION BY BUSINESS UNIT
| | |
| | |
|
|
|
| |
| | |
| | |
For the Three Months Ended and As of June 30, 2023 | |
| By Business Unit | |
Assets Leasing Business | | |
Food & Beverage Business | | |
Total | |
| Revenue | |
$ | 7,859 | | |
$ | - | | |
$ | 7,859 | |
| | |
| | | |
| | | |
| | |
| Cost of revenue | |
| - | | |
| - | | |
| - | |
| General and administrative expenses | |
| (54,549 | ) | |
| - | | |
| (54,549 | ) |
| | |
| | | |
| | | |
| | |
| Loss from operations | |
| (46,690 | ) | |
| - | | |
| (46,690 | ) |
| | |
| | | |
| | | |
| | |
| Total assets | |
$ | 74,730 | | |
$ | - | | |
$ | 74,730 | |
| Capital expenditure | |
$ | - | | |
$ | - | | |
$ | - | |
| | |
|
|
|
|
| | | |
| | |
| | |
For the Three Months Ended and As of June 30, 2022 | |
| By Business Unit | |
Assets Leasing Business | | |
Food & Beverage Business | | |
Total | |
| Revenue | |
$ | - | | |
$ | 44,909 | | |
$ | 44,909 | |
| | |
| | | |
| | | |
| | |
| Cost of revenue | |
| - | | |
| (20,963 | ) | |
| (20,963 | ) |
| General and administrative expenses | |
| - | | |
| (167,029 | ) | |
| (167,029 | ) |
| | |
| | | |
| | | |
| | |
| Loss from operations | |
| - | | |
| (143,083 | ) | |
| (143,083 | ) |
| | |
| | | |
| | | |
| | |
| Total assets | |
$ | - | | |
$ | 604,353 | | |
$ | 604,353 | |
| Capital expenditure | |
$ | - | | |
$ | 10,209 | | |
$ | 10,209 | |
|
| SCHEDULE OF SEGMENT REPORTING INFORMATION BY COUNTRY |
SCHEDULE
OF SEGMENT REPORTING INFORMATION BY COUNTRY
| | |
| | | |
| | | |
| | | |
| | |
| | |
For the Three Months Ended and As of June 30, 2023 | |
| By Country | |
United States | | |
Marshall | | |
Malaysia | | |
Total | |
| Revenue | |
$ | - | | |
$ | - | | |
$ | 7,859 | | |
$ | 7,859 | |
| | |
| | | |
| | | |
| | | |
| | |
| Cost of revenue | |
| - | | |
| - | | |
| - | | |
| - | |
| General and administrative expenses | |
| (43,854 | ) | |
| - | | |
| (10,695 | ) | |
| (54,549 | ) |
| | |
| | | |
| | | |
| | | |
| | |
| Loss from operations | |
| (43,854 | ) | |
| - | | |
| (2,836 | ) | |
| (46,690 | ) |
| | |
| | | |
| | | |
| | | |
| | |
| Total assets | |
$ | 8,834 | | |
$ | - | | |
$ | 65,896 | | |
$ | 74,730 | |
| Capital expenditure | |
$ | - | | |
$ | - | | |
$ | - | | |
$ | - | |
| | |
| | |
|
|
|
| |
| | | |
| | |
| | |
For the Three Months Ended and As of June 30, 2022 | |
| By Country | |
United States | | |
Marshall | | |
Malaysia | | |
Total | |
| Revenue | |
$ | - | | |
$ | - | | |
$ | 44,909 | | |
$ | 44,909 | |
| | |
| | | |
| | | |
| | | |
| | |
| Cost of revenue | |
| - | | |
| - | | |
| (20,963 | ) | |
| (20,963 | ) |
| General and administrative expenses | |
| - | | |
| - | | |
| (167,029 | ) | |
| (167,029 | ) |
| | |
| | | |
| | | |
| | | |
| | |
| Loss from operations | |
| - | | |
| - | | |
| (143,083 | ) | |
| (143,083 | ) |
| | |
| | | |
| | | |
| | | |
| | |
| Total assets | |
$ | 7,310 | | |
$ | - | | |
$ | 597,043 | | |
$ | 604,353 | |
| Capital expenditure | |
$ | - | | |
$ | - | | |
$ | 10,209 | | |
$ | 10,209 | |
|
| X |
- DefinitionTabular disclosure of information concerning material long-lived assets (excluding financial instruments, customer relationships with financial institutions, mortgage and other servicing rights, deferred policy acquisition costs, and deferred taxes assets) located in identified geographic areas and/or the amount of revenue from external customers attributed to that country from which revenue is material. An entity may also provide subtotals of geographic information about groups of countries. Reference 1: http://fasb.org/us-gaap/role/ref/legacyRef
-Name Accounting Standards Codification
-Topic 280
-SubTopic 10
-Section 50
-Paragraph 41
-Publisher FASB
-URI https://asc.fasb.org//1943274/2147482810/280-10-50-41
Reference 2: http://fasb.org/us-gaap/role/ref/legacyRef
-Topic 220
-SubTopic 10
-Name Accounting Standards Codification
-Section S99
-Paragraph 2
-Subparagraph (SX 210.5-03.1)
-Publisher FASB
-URI https://asc.fasb.org//1943274/2147483621/220-10-S99-2
| Name: |
us-gaap_ScheduleOfRevenuesFromExternalCustomersAndLongLivedAssetsByGeographicalAreasTableTextBlock |
| Namespace Prefix: |
us-gaap_ |
| Data Type: |
dtr-types:textBlockItemType |
| Balance Type: |
na |
| Period Type: |
duration |
|
| X |
- DefinitionTabular disclosure of the profit or loss and total assets for each reportable segment. An entity discloses certain information on each reportable segment if the amounts (a) are included in the measure of segment profit or loss reviewed by the chief operating decision maker or (b) are otherwise regularly provided to the chief operating decision maker, even if not included in that measure of segment profit or loss. Reference 1: http://fasb.org/us-gaap/role/ref/legacyRef
-Name Accounting Standards Codification
-Topic 350
-SubTopic 20
-Section 50
-Paragraph 1
-Publisher FASB
-URI https://asc.fasb.org//1943274/2147482573/350-20-50-1
Reference 2: http://fasb.org/us-gaap/role/ref/legacyRef
-Name Accounting Standards Codification
-Topic 280
-SubTopic 10
-Section 50
-Paragraph 25
-Publisher FASB
-URI https://asc.fasb.org//1943274/2147482810/280-10-50-25
Reference 3: http://fasb.org/us-gaap/role/ref/legacyRef
-Name Accounting Standards Codification
-Topic 280
-SubTopic 10
-Section 50
-Paragraph 22
-Publisher FASB
-URI https://asc.fasb.org//1943274/2147482810/280-10-50-22
Reference 4: http://fasb.org/us-gaap/role/ref/legacyRef
-Name Accounting Standards Codification
-Topic 280
-SubTopic 10
-Section 50
-Paragraph 30
-Publisher FASB
-URI https://asc.fasb.org//1943274/2147482810/280-10-50-30
| Name: |
us-gaap_ScheduleOfSegmentReportingInformationBySegmentTextBlock |
| Namespace Prefix: |
us-gaap_ |
| Data Type: |
dtr-types:textBlockItemType |
| Balance Type: |
na |
| Period Type: |
duration |
|
| X |
- References
+ Details
| Name: |
us-gaap_SegmentReportingAbstract |
| Namespace Prefix: |
us-gaap_ |
| Data Type: |
xbrli:stringItemType |
| Balance Type: |
na |
| Period Type: |
duration |
|
v3.23.2
SCHEDULE OF COMPANY'S SUBSIDIARIES (Details) - 3 months ended Jun. 30, 2023
|
USD ($)
shares
|
MYR (RM)
shares
|
| Subsidiary Company One [Member] |
|
|
| Consolidation, Less than Wholly Owned Subsidiary, Parent Ownership Interest, Effects of Changes, Net [Line Items] |
|
|
| Company Name |
Synergy Empire Holding Limited
|
Synergy Empire Holding Limited
|
| Domicile and Date of Incorporation |
Marshall Islands, October 22, 2018
|
Marshall Islands, October 22, 2018
|
| Particulars of Issued Capital |
1 Share of Ordinary Share, US$1 each
|
1 Share of Ordinary Share, US$1 each
|
| Number of shares issued, shares |
1
|
1
|
| Number of shares issued, value | $ |
$ 1
|
|
| Principal Activities |
Investment Holding
|
Investment Holding
|
| Subsidiary Company Two [Member] |
|
|
| Consolidation, Less than Wholly Owned Subsidiary, Parent Ownership Interest, Effects of Changes, Net [Line Items] |
|
|
| Company Name |
Lucky Star F&B Sdn. Bhd
|
Lucky Star F&B Sdn. Bhd
|
| Domicile and Date of Incorporation |
Malaysia, February 9, 2010
|
Malaysia, February 9, 2010
|
| Particulars of Issued Capital |
100,000 Share of Ordinary Share, MYR1 each
|
100,000 Share of Ordinary Share, MYR1 each
|
| Number of shares issued, shares |
100,000
|
100,000
|
| Number of shares issued, value | RM |
|
RM 1
|
| Principal Activities |
Food and Beverage Assets Leasing
|
Food and Beverage Assets Leasing
|
| Subsidiary Company Three [Member] |
|
|
| Consolidation, Less than Wholly Owned Subsidiary, Parent Ownership Interest, Effects of Changes, Net [Line Items] |
|
|
| Company Name |
SH Dessert Sdn. Bhd
|
SH Dessert Sdn. Bhd
|
| Domicile and Date of Incorporation |
Malaysia, February 19, 2016
|
Malaysia, February 19, 2016
|
| Particulars of Issued Capital |
100 Share of Ordinary Share, MYR1 each
|
100 Share of Ordinary Share, MYR1 each
|
| Number of shares issued, shares |
100
|
100
|
| Number of shares issued, value | RM |
|
RM 1
|
| Principal Activities |
Food and Beverage Assets Leasing
|
Food and Beverage Assets Leasing
|
| X |
- DefinitionDomicile and Date of Incorporation.
| Name: |
SHMY_DomicileAndDateOfIncorporation |
| Namespace Prefix: |
SHMY_ |
| Data Type: |
xbrli:stringItemType |
| Balance Type: |
na |
| Period Type: |
duration |
|
| X |
- DefinitionParticulars of Issued Capital.
| Name: |
SHMY_ParticularsOfIssuedCapital |
| Namespace Prefix: |
SHMY_ |
| Data Type: |
xbrli:stringItemType |
| Balance Type: |
na |
| Period Type: |
duration |
|
| X |
- DefinitionLine items represent financial concepts included in a table. These concepts are used to disclose reportable information associated with domain members defined in one or many axes to the table.
| Name: |
us-gaap_ConsolidationLessThanWhollyOwnedSubsidiaryParentOwnershipInterestEffectsOfChangesNetLineItems |
| Namespace Prefix: |
us-gaap_ |
| Data Type: |
xbrli:stringItemType |
| Balance Type: |
na |
| Period Type: |
duration |
|
| X |
- DefinitionNumber of new stock issued during the period. Reference 1: http://fasb.org/us-gaap/role/ref/legacyRef
-Name Accounting Standards Codification
-Section 50
-Paragraph 2
-SubTopic 10
-Topic 505
-Publisher FASB
-URI https://asc.fasb.org//1943274/2147481112/505-10-50-2
Reference 2: http://www.xbrl.org/2003/role/disclosureRef
-Topic 946
-SubTopic 505
-Name Accounting Standards Codification
-Section 50
-Paragraph 2
-Subparagraph (a)
-Publisher FASB
-URI https://asc.fasb.org//1943274/2147481004/946-505-50-2
Reference 3: http://www.xbrl.org/2003/role/disclosureRef
-Topic 946
-SubTopic 220
-Name Accounting Standards Codification
-Section S99
-Paragraph 3
-Subparagraph (SX 210.6-09(4)(b))
-Publisher FASB
-URI https://asc.fasb.org//1943274/2147483575/946-220-S99-3
Reference 4: http://www.xbrl.org/2003/role/disclosureRef
-Topic 946
-SubTopic 10
-Name Accounting Standards Codification
-Section S99
-Paragraph 3
-Subparagraph (SX 210.6-03(i)(1))
-Publisher FASB
-URI https://asc.fasb.org//1943274/2147479886/946-10-S99-3
Reference 5: http://fasb.org/us-gaap/role/ref/legacyRef
-Topic 210
-SubTopic 10
-Name Accounting Standards Codification
-Section S99
-Paragraph 1
-Subparagraph (SX 210.5-02(28))
-Publisher FASB
-URI https://asc.fasb.org//1943274/2147480566/210-10-S99-1
Reference 6: http://fasb.org/us-gaap/role/ref/legacyRef
-Topic 505
-SubTopic 10
-Name Accounting Standards Codification
-Section S99
-Paragraph 1
-Subparagraph (SX 210.3-04)
-Publisher FASB
-URI https://asc.fasb.org//1943274/2147480008/505-10-S99-1
Reference 7: http://fasb.org/us-gaap/role/ref/legacyRef
-Topic 210
-SubTopic 10
-Name Accounting Standards Codification
-Section S99
-Paragraph 1
-Subparagraph (SX 210.5-02(29))
-Publisher FASB
-URI https://asc.fasb.org//1943274/2147480566/210-10-S99-1
| Name: |
us-gaap_StockIssuedDuringPeriodSharesNewIssues |
| Namespace Prefix: |
us-gaap_ |
| Data Type: |
xbrli:sharesItemType |
| Balance Type: |
na |
| Period Type: |
duration |
|
| X |
- DefinitionEquity impact of the value of new stock issued during the period. Includes shares issued in an initial public offering or a secondary public offering. Reference 1: http://fasb.org/us-gaap/role/ref/legacyRef
-Name Accounting Standards Codification
-Section 50
-Paragraph 2
-SubTopic 10
-Topic 505
-Publisher FASB
-URI https://asc.fasb.org//1943274/2147481112/505-10-50-2
Reference 2: http://www.xbrl.org/2003/role/exampleRef
-Topic 946
-SubTopic 830
-Name Accounting Standards Codification
-Section 55
-Paragraph 11
-Publisher FASB
-URI https://asc.fasb.org//1943274/2147480167/946-830-55-11
Reference 3: http://www.xbrl.org/2003/role/disclosureRef
-Topic 946
-SubTopic 205
-Name Accounting Standards Codification
-Section 45
-Paragraph 4
-Subparagraph (a)
-Publisher FASB
-URI https://asc.fasb.org//1943274/2147480767/946-205-45-4
Reference 4: http://www.xbrl.org/2003/role/disclosureRef
-Topic 946
-SubTopic 505
-Name Accounting Standards Codification
-Section 50
-Paragraph 2
-Subparagraph (a)
-Publisher FASB
-URI https://asc.fasb.org//1943274/2147481004/946-505-50-2
Reference 5: http://www.xbrl.org/2003/role/disclosureRef
-Topic 946
-SubTopic 220
-Name Accounting Standards Codification
-Section S99
-Paragraph 3
-Subparagraph (SX 210.6-09(4)(b))
-Publisher FASB
-URI https://asc.fasb.org//1943274/2147483575/946-220-S99-3
Reference 6: http://fasb.org/us-gaap/role/ref/legacyRef
-Topic 210
-SubTopic 10
-Name Accounting Standards Codification
-Section S99
-Paragraph 1
-Subparagraph (SX 210.5-02(28))
-Publisher FASB
-URI https://asc.fasb.org//1943274/2147480566/210-10-S99-1
Reference 7: http://fasb.org/us-gaap/role/ref/legacyRef
-Topic 505
-SubTopic 10
-Name Accounting Standards Codification
-Section S99
-Paragraph 1
-Subparagraph (SX 210.3-04)
-Publisher FASB
-URI https://asc.fasb.org//1943274/2147480008/505-10-S99-1
Reference 8: http://fasb.org/us-gaap/role/ref/legacyRef
-Topic 210
-SubTopic 10
-Name Accounting Standards Codification
-Section S99
-Paragraph 1
-Subparagraph (SX 210.5-02(29))
-Publisher FASB
-URI https://asc.fasb.org//1943274/2147480566/210-10-S99-1
| Name: |
us-gaap_StockIssuedDuringPeriodValueNewIssues |
| Namespace Prefix: |
us-gaap_ |
| Data Type: |
xbrli:monetaryItemType |
| Balance Type: |
credit |
| Period Type: |
duration |
|
| X |
- DefinitionStructure or legal form of Variable Interest Entity (VIE). In general, a VIE is a corporation, partnership, trust, or any other legal structure used for business purposes that either (a) does not have equity investors with voting rights or (b) has equity investors that do not provide sufficient financial resources for the entity to support its activities. Reference 1: http://fasb.org/us-gaap/role/ref/legacyRef
-Name Accounting Standards Codification
-Topic 810
-SubTopic 10
-Section 50
-Paragraph 5A
-Subparagraph (d)
-Publisher FASB
-URI https://asc.fasb.org//1943274/2147481203/810-10-50-5A
| Name: |
us-gaap_VariableInterestEntityTypeOfEntity |
| Namespace Prefix: |
us-gaap_ |
| Data Type: |
xbrli:stringItemType |
| Balance Type: |
na |
| Period Type: |
duration |
|
| X |
- DefinitionDescription of the transactions or business conducted by the Variable Interest Entity (VIE), including how the VIE is financed. Reference 1: http://fasb.org/us-gaap/role/ref/legacyRef
-Name Accounting Standards Codification
-Topic 810
-SubTopic 10
-Section 50
-Paragraph 5A
-Subparagraph (d)
-Publisher FASB
-URI https://asc.fasb.org//1943274/2147481203/810-10-50-5A
Reference 2: http://fasb.org/us-gaap/role/ref/legacyRef
-Name Accounting Standards Codification
-Topic 810
-SubTopic 10
-Section 50
-Paragraph 6
-Subparagraph (b)
-Publisher FASB
-URI https://asc.fasb.org//1943274/2147481203/810-10-50-6
Reference 3: http://fasb.org/us-gaap/role/ref/legacyRef
-Name Accounting Standards Codification
-Topic 810
-SubTopic 10
-Section 50
-Paragraph 16
-Subparagraph (c,d)
-Publisher FASB
-URI https://asc.fasb.org//1943274/2147481203/810-10-50-16
Reference 4: http://fasb.org/us-gaap/role/ref/legacyRef
-Name Accounting Standards Codification
-Topic 810
-SubTopic 10
-Section 50
-Paragraph 4
-Subparagraph (b)
-Publisher FASB
-URI https://asc.fasb.org//1943274/2147481203/810-10-50-4
| Name: |
us-gaap_VariableInterestEntityVIEActivitiesOfVIE |
| Namespace Prefix: |
us-gaap_ |
| Data Type: |
xbrli:stringItemType |
| Balance Type: |
na |
| Period Type: |
duration |
|
| X |
- Details
| Name: |
srt_ConsolidatedEntitiesAxis=SHMY_SubsidiaryCompanyOneMember |
| Namespace Prefix: |
|
| Data Type: |
na |
| Balance Type: |
|
| Period Type: |
|
|
| X |
- Details
| Name: |
srt_ConsolidatedEntitiesAxis=SHMY_SubsidiaryCompanyTwoMember |
| Namespace Prefix: |
|
| Data Type: |
na |
| Balance Type: |
|
| Period Type: |
|
|
| X |
- Details
| Name: |
srt_ConsolidatedEntitiesAxis=SHMY_SubsidiaryCompanyThreeMember |
| Namespace Prefix: |
|
| Data Type: |
na |
| Balance Type: |
|
| Period Type: |
|
|
v3.23.2
ORGANIZATION AND BUSINESS BACKGROUND (Details Narrative)
|
Mar. 31, 2021 |
Feb. 26, 2021 |
Feb. 21, 2019 |
Jan. 16, 2019 |
Dec. 31, 2018 |
Feb. 19, 2016 |
| Lucky Star [Member] | Mr. Leong Will Liam [Member] |
|
|
|
|
|
|
| Consolidation, Less than Wholly Owned Subsidiary, Parent Ownership Interest, Effects of Changes, Net [Line Items] |
|
|
|
|
|
|
| Equity ownership interest rate percentage |
100.00%
|
|
|
|
|
|
| Synergy Empire Holding Limited [Member] | Synergy Empire Marshall [Member] |
|
|
|
|
|
|
| Consolidation, Less than Wholly Owned Subsidiary, Parent Ownership Interest, Effects of Changes, Net [Line Items] |
|
|
|
|
|
|
| Equity ownership interest rate percentage |
|
|
|
100.00%
|
|
|
| Synergy Empire HK [Member] | Synergy Empire Marshall [Member] |
|
|
|
|
|
|
| Consolidation, Less than Wholly Owned Subsidiary, Parent Ownership Interest, Effects of Changes, Net [Line Items] |
|
|
|
|
|
|
| Equity ownership interest rate percentage |
|
|
|
|
100.00%
|
|
| Synergy Empire HK [Member] | Lucky Star [Member] |
|
|
|
|
|
|
| Consolidation, Less than Wholly Owned Subsidiary, Parent Ownership Interest, Effects of Changes, Net [Line Items] |
|
|
|
|
|
|
| Equity ownership interest rate percentage |
|
|
100.00%
|
|
|
|
| Lucky Star [Member] | SH Dessert [Member] |
|
|
|
|
|
|
| Consolidation, Less than Wholly Owned Subsidiary, Parent Ownership Interest, Effects of Changes, Net [Line Items] |
|
|
|
|
|
|
| Equity ownership interest rate percentage |
|
|
|
|
|
100.00%
|
| Synergy Empire Marshall [Member] | Lucky Star [Member] |
|
|
|
|
|
|
| Consolidation, Less than Wholly Owned Subsidiary, Parent Ownership Interest, Effects of Changes, Net [Line Items] |
|
|
|
|
|
|
| Equity ownership interest rate percentage |
|
100.00%
|
|
|
|
|
| X |
- DefinitionLine items represent financial concepts included in a table. These concepts are used to disclose reportable information associated with domain members defined in one or many axes to the table.
| Name: |
us-gaap_ConsolidationLessThanWhollyOwnedSubsidiaryParentOwnershipInterestEffectsOfChangesNetLineItems |
| Namespace Prefix: |
us-gaap_ |
| Data Type: |
xbrli:stringItemType |
| Balance Type: |
na |
| Period Type: |
duration |
|
| X |
- DefinitionThe percentage of ownership of common stock or equity participation in the investee accounted for under the equity method of accounting. Reference 1: http://www.xbrl.org/2003/role/disclosureRef
-Topic 323
-SubTopic 10
-Name Accounting Standards Codification
-Section 50
-Paragraph 3
-Subparagraph (a)(1)
-Publisher FASB
-URI https://asc.fasb.org//1943274/2147481687/323-10-50-3
| Name: |
us-gaap_EquityMethodInvestmentOwnershipPercentage |
| Namespace Prefix: |
us-gaap_ |
| Data Type: |
dtr-types:percentItemType |
| Balance Type: |
na |
| Period Type: |
instant |
|
| X |
- Details
| Name: |
srt_ScheduleOfEquityMethodInvestmentEquityMethodInvesteeNameAxis=SHMY_LuckyStarMember |
| Namespace Prefix: |
|
| Data Type: |
na |
| Balance Type: |
|
| Period Type: |
|
|
| X |
- Details
| Name: |
srt_TitleOfIndividualAxis=SHMY_LeongWillLiamMember |
| Namespace Prefix: |
|
| Data Type: |
na |
| Balance Type: |
|
| Period Type: |
|
|
| X |
- Details
| Name: |
srt_ConsolidatedEntitiesAxis=SHMY_SynergyEmpireHoldingLimitedMember |
| Namespace Prefix: |
|
| Data Type: |
na |
| Balance Type: |
|
| Period Type: |
|
|
| X |
- Details
| Name: |
srt_ScheduleOfEquityMethodInvestmentEquityMethodInvesteeNameAxis=SHMY_SynergyEmpireMarshallMember |
| Namespace Prefix: |
|
| Data Type: |
na |
| Balance Type: |
|
| Period Type: |
|
|
| X |
- Details
| Name: |
srt_ConsolidatedEntitiesAxis=SHMY_SynergyEmpireHKMember |
| Namespace Prefix: |
|
| Data Type: |
na |
| Balance Type: |
|
| Period Type: |
|
|
| X |
- Details
| Name: |
srt_ConsolidatedEntitiesAxis=SHMY_LuckyStarMember |
| Namespace Prefix: |
|
| Data Type: |
na |
| Balance Type: |
|
| Period Type: |
|
|
| X |
- Details
| Name: |
srt_ScheduleOfEquityMethodInvestmentEquityMethodInvesteeNameAxis=SHMY_SHDessertMember |
| Namespace Prefix: |
|
| Data Type: |
na |
| Balance Type: |
|
| Period Type: |
|
|
| X |
- Details
| Name: |
srt_ConsolidatedEntitiesAxis=SHMY_SynergyEmpireMarshallMember |
| Namespace Prefix: |
|
| Data Type: |
na |
| Balance Type: |
|
| Period Type: |
|
|
v3.23.2
| X |
- DefinitionLine items represent financial concepts included in a table. These concepts are used to disclose reportable information associated with domain members defined in one or many axes to the table.
| Name: |
us-gaap_PropertyPlantAndEquipmentLineItems |
| Namespace Prefix: |
us-gaap_ |
| Data Type: |
xbrli:stringItemType |
| Balance Type: |
na |
| Period Type: |
duration |
|
| X |
- DefinitionUseful life of long lived, physical assets used in the normal conduct of business and not intended for resale, in 'PnYnMnDTnHnMnS' format, for example, 'P1Y5M13D' represents the reported fact of one year, five months, and thirteen days. Examples include, but not limited to, land, buildings, machinery and equipment, office equipment, furniture and fixtures, and computer equipment.
| Name: |
us-gaap_PropertyPlantAndEquipmentUsefulLife |
| Namespace Prefix: |
us-gaap_ |
| Data Type: |
xbrli:durationItemType |
| Balance Type: |
na |
| Period Type: |
instant |
|
| X |
- Details
| Name: |
us-gaap_PropertyPlantAndEquipmentByTypeAxis=SHMY_OfficeAndKitchenEquipmentMember |
| Namespace Prefix: |
|
| Data Type: |
na |
| Balance Type: |
|
| Period Type: |
|
|
| X |
- Details
| Name: |
us-gaap_PropertyPlantAndEquipmentByTypeAxis=us-gaap_VehiclesMember |
| Namespace Prefix: |
|
| Data Type: |
na |
| Balance Type: |
|
| Period Type: |
|
|
v3.23.2
| X |
- DefinitionUseful life of finite-lived intangible assets, in 'PnYnMnDTnHnMnS' format, for example, 'P1Y5M13D' represents the reported fact of one year, five months, and thirteen days.
| Name: |
us-gaap_FiniteLivedIntangibleAssetUsefulLife |
| Namespace Prefix: |
us-gaap_ |
| Data Type: |
xbrli:durationItemType |
| Balance Type: |
na |
| Period Type: |
instant |
|
| X |
- DefinitionLine items represent financial concepts included in a table. These concepts are used to disclose reportable information associated with domain members defined in one or many axes to the table. Reference 1: http://www.xbrl.org/2003/role/disclosureRef
-Topic 926
-SubTopic 20
-Name Accounting Standards Codification
-Section 50
-Paragraph 5
-Publisher FASB
-URI https://asc.fasb.org//1943274/2147483154/926-20-50-5
| Name: |
us-gaap_FiniteLivedIntangibleAssetsLineItems |
| Namespace Prefix: |
us-gaap_ |
| Data Type: |
xbrli:stringItemType |
| Balance Type: |
na |
| Period Type: |
duration |
|
| X |
- Details
| Name: |
us-gaap_FiniteLivedIntangibleAssetsByMajorClassAxis=us-gaap_TrademarksMember |
| Namespace Prefix: |
|
| Data Type: |
na |
| Balance Type: |
|
| Period Type: |
|
|
v3.23.2
| X |
- DefinitionForeign exchange rate used to translate amounts denominated in functional currency to reporting currency. Reference 1: http://www.xbrl.org/2003/role/disclosureRef
-Topic 830
-SubTopic 30
-Name Accounting Standards Codification
-Section 50
-Paragraph 2
-Publisher FASB
-URI https://asc.fasb.org//1943274/2147481674/830-30-50-2
Reference 2: http://www.xbrl.org/2003/role/disclosureRef
-Topic 830
-SubTopic 30
-Name Accounting Standards Codification
-Section S99
-Paragraph 1
-Publisher FASB
-URI https://asc.fasb.org//1943274/2147479424/830-30-S99-1
| Name: |
us-gaap_ForeignCurrencyExchangeRateTranslation1 |
| Namespace Prefix: |
us-gaap_ |
| Data Type: |
xbrli:pureItemType |
| Balance Type: |
na |
| Period Type: |
instant |
|
| X |
- DefinitionLine items represent financial concepts included in a table. These concepts are used to disclose reportable information associated with domain members defined in one or many axes to the table. Reference 1: http://www.xbrl.org/2003/role/disclosureRef
-Topic 718
-SubTopic 10
-Name Accounting Standards Codification
-Section 35
-Paragraph 1D
-Publisher FASB
-URI https://asc.fasb.org//1943274/2147480483/718-10-35-1D
Reference 2: http://www.xbrl.org/2003/role/disclosureRef
-Topic 718
-SubTopic 10
-Name Accounting Standards Codification
-Section 35
-Paragraph 3
-Publisher FASB
-URI https://asc.fasb.org//1943274/2147480483/718-10-35-3
Reference 3: http://www.xbrl.org/2003/role/disclosureRef
-Topic 718
-SubTopic 10
-Name Accounting Standards Codification
-Section 50
-Paragraph 2
-Subparagraph (a)(1)
-Publisher FASB
-URI https://asc.fasb.org//1943274/2147480429/718-10-50-2
Reference 4: http://www.xbrl.org/2003/role/disclosureRef
-Topic 718
-SubTopic 10
-Name Accounting Standards Codification
-Section 50
-Paragraph 2
-Subparagraph (a)(2)
-Publisher FASB
-URI https://asc.fasb.org//1943274/2147480429/718-10-50-2
Reference 5: http://www.xbrl.org/2003/role/disclosureRef
-Topic 718
-SubTopic 10
-Name Accounting Standards Codification
-Section 50
-Paragraph 2
-Subparagraph (a)(3)
-Publisher FASB
-URI https://asc.fasb.org//1943274/2147480429/718-10-50-2
Reference 6: http://www.xbrl.org/2003/role/disclosureRef
-Topic 718
-SubTopic 10
-Name Accounting Standards Codification
-Section 50
-Paragraph 2
-Subparagraph (c)(1)(i)
-Publisher FASB
-URI https://asc.fasb.org//1943274/2147480429/718-10-50-2
Reference 7: http://www.xbrl.org/2003/role/disclosureRef
-Topic 718
-SubTopic 10
-Name Accounting Standards Codification
-Section 50
-Paragraph 2
-Subparagraph (c)(1)(ii)
-Publisher FASB
-URI https://asc.fasb.org//1943274/2147480429/718-10-50-2
Reference 8: http://www.xbrl.org/2003/role/disclosureRef
-Topic 718
-SubTopic 10
-Name Accounting Standards Codification
-Section 50
-Paragraph 2
-Subparagraph (c)(1)(iii)
-Publisher FASB
-URI https://asc.fasb.org//1943274/2147480429/718-10-50-2
Reference 9: http://www.xbrl.org/2003/role/disclosureRef
-Topic 718
-SubTopic 10
-Name Accounting Standards Codification
-Section 50
-Paragraph 2
-Subparagraph (c)(1)(iv)
-Publisher FASB
-URI https://asc.fasb.org//1943274/2147480429/718-10-50-2
Reference 10: http://www.xbrl.org/2003/role/disclosureRef
-Topic 718
-SubTopic 10
-Name Accounting Standards Codification
-Section 50
-Paragraph 2
-Subparagraph (c)(1)(iv)(01)
-Publisher FASB
-URI https://asc.fasb.org//1943274/2147480429/718-10-50-2
Reference 11: http://www.xbrl.org/2003/role/disclosureRef
-Topic 718
-SubTopic 10
-Name Accounting Standards Codification
-Section 50
-Paragraph 2
-Subparagraph (c)(1)(iv)(02)
-Publisher FASB
-URI https://asc.fasb.org//1943274/2147480429/718-10-50-2
Reference 12: http://www.xbrl.org/2003/role/disclosureRef
-Topic 718
-SubTopic 10
-Name Accounting Standards Codification
-Section 50
-Paragraph 2
-Subparagraph (c)(1)(iv)(03)
-Publisher FASB
-URI https://asc.fasb.org//1943274/2147480429/718-10-50-2
Reference 13: http://www.xbrl.org/2003/role/disclosureRef
-Topic 718
-SubTopic 10
-Name Accounting Standards Codification
-Section 50
-Paragraph 2
-Subparagraph (c)(1)(iv)(04)
-Publisher FASB
-URI https://asc.fasb.org//1943274/2147480429/718-10-50-2
Reference 14: http://www.xbrl.org/2003/role/disclosureRef
-Topic 718
-SubTopic 10
-Name Accounting Standards Codification
-Section 50
-Paragraph 2
-Subparagraph (c)(2)(i)
-Publisher FASB
-URI https://asc.fasb.org//1943274/2147480429/718-10-50-2
Reference 15: http://www.xbrl.org/2003/role/disclosureRef
-Topic 718
-SubTopic 10
-Name Accounting Standards Codification
-Section 50
-Paragraph 2
-Subparagraph (c)(2)(ii)
-Publisher FASB
-URI https://asc.fasb.org//1943274/2147480429/718-10-50-2
Reference 16: http://www.xbrl.org/2003/role/disclosureRef
-Topic 718
-SubTopic 10
-Name Accounting Standards Codification
-Section 50
-Paragraph 2
-Subparagraph (c)(2)(iii)
-Publisher FASB
-URI https://asc.fasb.org//1943274/2147480429/718-10-50-2
Reference 17: http://www.xbrl.org/2003/role/disclosureRef
-Topic 718
-SubTopic 10
-Name Accounting Standards Codification
-Section 50
-Paragraph 2
-Subparagraph (c)(2)(iii)(01)
-Publisher FASB
-URI https://asc.fasb.org//1943274/2147480429/718-10-50-2
Reference 18: http://www.xbrl.org/2003/role/disclosureRef
-Topic 718
-SubTopic 10
-Name Accounting Standards Codification
-Section 50
-Paragraph 2
-Subparagraph (c)(2)(iii)(02)
-Publisher FASB
-URI https://asc.fasb.org//1943274/2147480429/718-10-50-2
Reference 19: http://www.xbrl.org/2003/role/disclosureRef
-Topic 718
-SubTopic 10
-Name Accounting Standards Codification
-Section 50
-Paragraph 2
-Subparagraph (c)(2)(iii)(03)
-Publisher FASB
-URI https://asc.fasb.org//1943274/2147480429/718-10-50-2
Reference 20: http://www.xbrl.org/2003/role/disclosureRef
-Topic 718
-SubTopic 10
-Name Accounting Standards Codification
-Section 50
-Paragraph 2
-Subparagraph (d)(1)
-Publisher FASB
-URI https://asc.fasb.org//1943274/2147480429/718-10-50-2
Reference 21: http://www.xbrl.org/2003/role/disclosureRef
-Topic 718
-SubTopic 10
-Name Accounting Standards Codification
-Section 50
-Paragraph 2
-Subparagraph (d)(2)
-Publisher FASB
-URI https://asc.fasb.org//1943274/2147480429/718-10-50-2
Reference 22: http://www.xbrl.org/2003/role/disclosureRef
-Topic 718
-SubTopic 10
-Name Accounting Standards Codification
-Section 50
-Paragraph 2
-Subparagraph (e)(1)
-Publisher FASB
-URI https://asc.fasb.org//1943274/2147480429/718-10-50-2
Reference 23: http://www.xbrl.org/2003/role/disclosureRef
-Topic 718
-SubTopic 10
-Name Accounting Standards Codification
-Section 50
-Paragraph 2
-Subparagraph (e)(2)
-Publisher FASB
-URI https://asc.fasb.org//1943274/2147480429/718-10-50-2
Reference 24: http://www.xbrl.org/2003/role/disclosureRef
-Topic 718
-SubTopic 10
-Name Accounting Standards Codification
-Section 50
-Paragraph 2
-Subparagraph (f)(2)(i)
-Publisher FASB
-URI https://asc.fasb.org//1943274/2147480429/718-10-50-2
Reference 25: http://www.xbrl.org/2003/role/disclosureRef
-Topic 718
-SubTopic 10
-Name Accounting Standards Codification
-Section 50
-Paragraph 2
-Subparagraph (f)(2)(ii)
-Publisher FASB
-URI https://asc.fasb.org//1943274/2147480429/718-10-50-2
Reference 26: http://www.xbrl.org/2003/role/disclosureRef
-Topic 718
-SubTopic 10
-Name Accounting Standards Codification
-Section 50
-Paragraph 2
-Subparagraph (f)(2)(iii)
-Publisher FASB
-URI https://asc.fasb.org//1943274/2147480429/718-10-50-2
Reference 27: http://www.xbrl.org/2003/role/disclosureRef
-Topic 718
-SubTopic 10
-Name Accounting Standards Codification
-Section 50
-Paragraph 2
-Subparagraph (f)(2)(iv)
-Publisher FASB
-URI https://asc.fasb.org//1943274/2147480429/718-10-50-2
Reference 28: http://www.xbrl.org/2003/role/disclosureRef
-Topic 718
-SubTopic 10
-Name Accounting Standards Codification
-Section 50
-Paragraph 2
-Subparagraph (f)(2)(v)
-Publisher FASB
-URI https://asc.fasb.org//1943274/2147480429/718-10-50-2
| Name: |
us-gaap_ShareBasedCompensationArrangementByShareBasedPaymentAwardLineItems |
| Namespace Prefix: |
us-gaap_ |
| Data Type: |
xbrli:stringItemType |
| Balance Type: |
na |
| Period Type: |
duration |
|
| X |
- Details
| Name: |
us-gaap_AwardTypeAxis=SHMY_PeriodEndMYRMember |
| Namespace Prefix: |
|
| Data Type: |
na |
| Balance Type: |
|
| Period Type: |
|
|
| X |
- Details
| Name: |
us-gaap_AwardTypeAxis=SHMY_PeriodEndPeriodAverageHKMember |
| Namespace Prefix: |
|
| Data Type: |
na |
| Balance Type: |
|
| Period Type: |
|
|
v3.23.2
SUMMARY OF SIGNIFICANT ACCOUNTING POLICIES (Details Narrative)
|
3 Months Ended |
|
|
|
Jun. 30, 2023
USD ($)
|
Jun. 30, 2023
MYR (RM)
|
Mar. 31, 2023
USD ($)
|
| Accounting Policies [Abstract] |
|
|
|
| Cash insurance deposit |
$ 53,557
|
RM 250,000
|
|
| Income tax description |
tax positions must initially be recognized in the
financial statements when it is more likely than not the position will be sustained upon examination by the tax authorities. Such tax
positions must initially and subsequently be measured as the largest amount of tax benefit that has a greater than 50% likelihood of
being realized upon ultimate settlement with the tax authority assuming full knowledge of the position and relevant facts.
|
|
|
| Accounts Receivable, Allowance for Credit Loss |
$ 7,859
|
|
|
| X |
- References
+ Details
| Name: |
us-gaap_AccountingPoliciesAbstract |
| Namespace Prefix: |
us-gaap_ |
| Data Type: |
xbrli:stringItemType |
| Balance Type: |
na |
| Period Type: |
duration |
|
| X |
- DefinitionAmount of allowance for credit loss on accounts receivable. Reference 1: http://www.xbrl.org/2009/role/commonPracticeRef
-Topic 944
-SubTopic 210
-Name Accounting Standards Codification
-Section S99
-Paragraph 1
-Subparagraph (SX 210.7-03(a)(5))
-Publisher FASB
-URI https://asc.fasb.org//1943274/2147479440/944-210-S99-1
Reference 2: http://www.xbrl.org/2003/role/disclosureRef
-Topic 210
-SubTopic 10
-Name Accounting Standards Codification
-Section S99
-Paragraph 1
-Subparagraph (SX 210.5-02(4))
-Publisher FASB
-URI https://asc.fasb.org//1943274/2147480566/210-10-S99-1
Reference 3: http://www.xbrl.org/2003/role/disclosureRef
-Topic 326
-SubTopic 20
-Name Accounting Standards Codification
-Section 45
-Paragraph 1
-Publisher FASB
-URI https://asc.fasb.org//1943274/2147479344/326-20-45-1
Reference 4: http://www.xbrl.org/2003/role/disclosureRef
-Topic 310
-SubTopic 10
-Name Accounting Standards Codification
-Section 50
-Paragraph 4
-Publisher FASB
-URI https://asc.fasb.org//1943274/2147481962/310-10-50-4
Reference 5: http://www.xbrl.org/2003/role/disclosureRef
-Topic 326
-SubTopic 20
-Name Accounting Standards Codification
-Section 50
-Paragraph 13
-Subparagraph (a)
-Publisher FASB
-URI https://asc.fasb.org//1943274/2147479319/326-20-50-13
Reference 6: http://www.xbrl.org/2003/role/disclosureRef
-Topic 326
-SubTopic 20
-Name Accounting Standards Codification
-Section 50
-Paragraph 13
-Subparagraph (f)
-Publisher FASB
-URI https://asc.fasb.org//1943274/2147479319/326-20-50-13
| Name: |
us-gaap_AllowanceForDoubtfulAccountsReceivable |
| Namespace Prefix: |
us-gaap_ |
| Data Type: |
xbrli:monetaryItemType |
| Balance Type: |
credit |
| Period Type: |
instant |
|
| X |
- DefinitionThe amount of cash deposited in financial institutions as of the balance sheet date that is insured by the Federal Deposit Insurance Corporation.
| Name: |
us-gaap_CashFDICInsuredAmount |
| Namespace Prefix: |
us-gaap_ |
| Data Type: |
xbrli:monetaryItemType |
| Balance Type: |
debit |
| Period Type: |
instant |
|
v3.23.2
GOING CONCERN UNCERTAINTIES (Details Narrative) - USD ($)
|
3 Months Ended |
|
Jun. 30, 2023 |
Jun. 30, 2022 |
Mar. 31, 2023 |
| Organization, Consolidation and Presentation of Financial Statements [Abstract] |
|
|
|
| Accumulated deficit |
$ 2,181,020
|
|
$ 2,134,207
|
| Net loss |
46,813
|
$ 143,597
|
|
| Working capital |
$ 1,345,640
|
|
$ 1,384,526
|
| X |
- DefinitionThe portion of profit or loss for the period, net of income taxes, which is attributable to the parent. Reference 1: http://www.xbrl.org/2003/role/disclosureRef
-Topic 235
-SubTopic 10
-Name Accounting Standards Codification
-Section S99
-Paragraph 1
-Subparagraph (SX 210.4-08(g)(1)(ii))
-Publisher FASB
-URI https://asc.fasb.org//1943274/2147480678/235-10-S99-1
Reference 2: http://www.xbrl.org/2003/role/disclosureRef
-Topic 323
-SubTopic 10
-Name Accounting Standards Codification
-Section 50
-Paragraph 3
-Subparagraph (c)
-Publisher FASB
-URI https://asc.fasb.org//1943274/2147481687/323-10-50-3
Reference 3: http://www.xbrl.org/2003/role/disclosureRef
-Topic 825
-SubTopic 10
-Name Accounting Standards Codification
-Section 50
-Paragraph 28
-Subparagraph (f)
-Publisher FASB
-URI https://asc.fasb.org//1943274/2147482907/825-10-50-28
Reference 4: http://www.xbrl.org/2003/role/disclosureRef
-Topic 220
-SubTopic 10
-Name Accounting Standards Codification
-Section 50
-Paragraph 6
-Publisher FASB
-URI https://asc.fasb.org//1943274/2147482765/220-10-50-6
Reference 5: http://www.xbrl.org/2003/role/disclosureRef
-Topic 250
-SubTopic 10
-Name Accounting Standards Codification
-Section 50
-Paragraph 3
-Publisher FASB
-URI https://asc.fasb.org//1943274/2147483443/250-10-50-3
Reference 6: http://www.xbrl.org/2003/role/disclosureRef
-Topic 250
-SubTopic 10
-Name Accounting Standards Codification
-Section 50
-Paragraph 1
-Subparagraph (b)(2)
-Publisher FASB
-URI https://asc.fasb.org//1943274/2147483443/250-10-50-1
Reference 7: http://www.xbrl.org/2003/role/disclosureRef
-Topic 815
-SubTopic 40
-Name Accounting Standards Codification
-Section 65
-Paragraph 1
-Subparagraph (f)
-Publisher FASB
-URI https://asc.fasb.org//1943274/2147480175/815-40-65-1
Reference 8: http://www.xbrl.org/2003/role/disclosureRef
-Topic 250
-SubTopic 10
-Name Accounting Standards Codification
-Section 50
-Paragraph 8
-Publisher FASB
-URI https://asc.fasb.org//1943274/2147483443/250-10-50-8
Reference 9: http://www.xbrl.org/2003/role/disclosureRef
-Topic 250
-SubTopic 10
-Name Accounting Standards Codification
-Section 50
-Paragraph 9
-Publisher FASB
-URI https://asc.fasb.org//1943274/2147483443/250-10-50-9
Reference 10: http://www.xbrl.org/2003/role/disclosureRef
-Topic 250
-SubTopic 10
-Name Accounting Standards Codification
-Section 50
-Paragraph 11
-Subparagraph (a)
-Publisher FASB
-URI https://asc.fasb.org//1943274/2147483443/250-10-50-11
Reference 11: http://www.xbrl.org/2003/role/disclosureRef
-Topic 250
-SubTopic 10
-Name Accounting Standards Codification
-Section 50
-Paragraph 11
-Subparagraph (b)
-Publisher FASB
-URI https://asc.fasb.org//1943274/2147483443/250-10-50-11
Reference 12: http://www.xbrl.org/2003/role/disclosureRef
-Topic 250
-SubTopic 10
-Name Accounting Standards Codification
-Section 50
-Paragraph 4
-Publisher FASB
-URI https://asc.fasb.org//1943274/2147483443/250-10-50-4
Reference 13: http://www.xbrl.org/2003/role/exampleRef
-Topic 946
-SubTopic 830
-Name Accounting Standards Codification
-Section 55
-Paragraph 10
-Publisher FASB
-URI https://asc.fasb.org//1943274/2147480167/946-830-55-10
Reference 14: http://www.xbrl.org/2003/role/disclosureRef
-Topic 946
-SubTopic 220
-Name Accounting Standards Codification
-Section 45
-Paragraph 7
-Publisher FASB
-URI https://asc.fasb.org//1943274/2147483581/946-220-45-7
Reference 15: http://www.xbrl.org/2003/role/disclosureRef
-Topic 944
-SubTopic 220
-Name Accounting Standards Codification
-Section S99
-Paragraph 1
-Subparagraph (SX 210.7-04(18))
-Publisher FASB
-URI https://asc.fasb.org//1943274/2147483586/944-220-S99-1
Reference 16: http://www.xbrl.org/2003/role/disclosureRef
-Topic 280
-SubTopic 10
-Name Accounting Standards Codification
-Section 50
-Paragraph 22
-Publisher FASB
-URI https://asc.fasb.org//1943274/2147482810/280-10-50-22
Reference 17: http://www.xbrl.org/2003/role/disclosureRef
-Topic 946
-SubTopic 220
-Name Accounting Standards Codification
-Section S99
-Paragraph 1
-Subparagraph (SX 210.6-07(9))
-Publisher FASB
-URI https://asc.fasb.org//1943274/2147483575/946-220-S99-1
Reference 18: http://www.xbrl.org/2003/role/disclosureRef
-Topic 946
-SubTopic 220
-Name Accounting Standards Codification
-Section S99
-Paragraph 3
-Subparagraph (SX 210.6-09(1)(d))
-Publisher FASB
-URI https://asc.fasb.org//1943274/2147483575/946-220-S99-3
Reference 19: http://www.xbrl.org/2003/role/disclosureRef
-Topic 470
-SubTopic 10
-Name Accounting Standards Codification
-Section S99
-Paragraph 1A
-Subparagraph (SX 210.13-01(a)(4)(i))
-Publisher FASB
-URI https://asc.fasb.org//1943274/2147480097/470-10-S99-1A
Reference 20: http://www.xbrl.org/2009/role/commonPracticeRef
-Topic 470
-SubTopic 10
-Name Accounting Standards Codification
-Section S99
-Paragraph 1A
-Subparagraph (SX 210.13-01(a)(4)(ii))
-Publisher FASB
-URI https://asc.fasb.org//1943274/2147480097/470-10-S99-1A
Reference 21: http://www.xbrl.org/2003/role/disclosureRef
-Topic 470
-SubTopic 10
-Name Accounting Standards Codification
-Section S99
-Paragraph 1A
-Subparagraph (SX 210.13-01(a)(4)(iii)(A))
-Publisher FASB
-URI https://asc.fasb.org//1943274/2147480097/470-10-S99-1A
Reference 22: http://www.xbrl.org/2003/role/disclosureRef
-Topic 470
-SubTopic 10
-Name Accounting Standards Codification
-Section S99
-Paragraph 1A
-Subparagraph (SX 210.13-01(a)(4)(iv))
-Publisher FASB
-URI https://asc.fasb.org//1943274/2147480097/470-10-S99-1A
Reference 23: http://www.xbrl.org/2003/role/disclosureRef
-Topic 470
-SubTopic 10
-Name Accounting Standards Codification
-Section S99
-Paragraph 1A
-Subparagraph (SX 210.13-01(a)(5))
-Publisher FASB
-URI https://asc.fasb.org//1943274/2147480097/470-10-S99-1A
Reference 24: http://www.xbrl.org/2003/role/disclosureRef
-Topic 470
-SubTopic 10
-Name Accounting Standards Codification
-Section S99
-Paragraph 1B
-Subparagraph (SX 210.13-02(a)(4)(i))
-Publisher FASB
-URI https://asc.fasb.org//1943274/2147480097/470-10-S99-1B
Reference 25: http://www.xbrl.org/2003/role/disclosureRef
-Topic 470
-SubTopic 10
-Name Accounting Standards Codification
-Section S99
-Paragraph 1B
-Subparagraph (SX 210.13-02(a)(4)(iii)(A))
-Publisher FASB
-URI https://asc.fasb.org//1943274/2147480097/470-10-S99-1B
Reference 26: http://www.xbrl.org/2003/role/disclosureRef
-Topic 470
-SubTopic 10
-Name Accounting Standards Codification
-Section S99
-Paragraph 1B
-Subparagraph (SX 210.13-02(a)(4)(iii)(B))
-Publisher FASB
-URI https://asc.fasb.org//1943274/2147480097/470-10-S99-1B
Reference 27: http://www.xbrl.org/2003/role/disclosureRef
-Topic 470
-SubTopic 10
-Name Accounting Standards Codification
-Section S99
-Paragraph 1B
-Subparagraph (SX 210.13-02(a)(4)(iv))
-Publisher FASB
-URI https://asc.fasb.org//1943274/2147480097/470-10-S99-1B
Reference 28: http://www.xbrl.org/2003/role/disclosureRef
-Topic 470
-SubTopic 10
-Name Accounting Standards Codification
-Section S99
-Paragraph 1B
-Subparagraph (SX 210.13-02(a)(5))
-Publisher FASB
-URI https://asc.fasb.org//1943274/2147480097/470-10-S99-1B
Reference 29: http://www.xbrl.org/2003/role/disclosureRef
-Topic 280
-SubTopic 10
-Name Accounting Standards Codification
-Section 50
-Paragraph 30
-Subparagraph (b)
-Publisher FASB
-URI https://asc.fasb.org//1943274/2147482810/280-10-50-30
Reference 30: http://www.xbrl.org/2003/role/disclosureRef
-Topic 280
-SubTopic 10
-Name Accounting Standards Codification
-Section 50
-Paragraph 32
-Subparagraph (f)
-Publisher FASB
-URI https://asc.fasb.org//1943274/2147482810/280-10-50-32
Reference 31: http://www.xbrl.org/2003/role/disclosureRef
-Topic 260
-SubTopic 10
-Name Accounting Standards Codification
-Section 45
-Paragraph 60B
-Subparagraph (a)
-Publisher FASB
-URI https://asc.fasb.org//1943274/2147482689/260-10-45-60B
Reference 32: http://www.xbrl.org/2003/role/exampleRef
-Topic 280
-SubTopic 10
-Name Accounting Standards Codification
-Section 50
-Paragraph 31
-Publisher FASB
-URI https://asc.fasb.org//1943274/2147482810/280-10-50-31
Reference 33: http://www.xbrl.org/2003/role/disclosureRef
-Topic 280
-SubTopic 10
-Name Accounting Standards Codification
-Section 50
-Paragraph 32
-Subparagraph (c)
-Publisher FASB
-URI https://asc.fasb.org//1943274/2147482810/280-10-50-32
Reference 34: http://www.xbrl.org/2003/role/disclosureRef
-Topic 205
-SubTopic 20
-Name Accounting Standards Codification
-Section 50
-Paragraph 7
-Publisher FASB
-URI https://asc.fasb.org//1943274/2147483499/205-20-50-7
Reference 35: http://fasb.org/us-gaap/role/ref/legacyRef
-Topic 230
-SubTopic 10
-Name Accounting Standards Codification
-Section 45
-Paragraph 28
-Publisher FASB
-URI https://asc.fasb.org//1943274/2147482740/230-10-45-28
Reference 36: http://www.xbrl.org/2003/role/disclosureRef
-Topic 220
-SubTopic 10
-Name Accounting Standards Codification
-Section 45
-Paragraph 1A
-Subparagraph (a)
-Publisher FASB
-URI https://asc.fasb.org//1943274/2147482790/220-10-45-1A
Reference 37: http://www.xbrl.org/2003/role/disclosureRef
-Topic 220
-SubTopic 10
-Name Accounting Standards Codification
-Section 45
-Paragraph 1B
-Subparagraph (a)
-Publisher FASB
-URI https://asc.fasb.org//1943274/2147482790/220-10-45-1B
Reference 38: http://fasb.org/us-gaap/role/ref/legacyRef
-Topic 220
-SubTopic 10
-Name Accounting Standards Codification
-Section S99
-Paragraph 2
-Subparagraph (SX 210.5-03(20))
-Publisher FASB
-URI https://asc.fasb.org//1943274/2147483621/220-10-S99-2
Reference 39: http://fasb.org/us-gaap/role/ref/legacyRef
-Topic 942
-SubTopic 220
-Name Accounting Standards Codification
-Section S99
-Paragraph 1
-Subparagraph (SX 210.9-04(22))
-Publisher FASB
-URI https://asc.fasb.org//1943274/2147483589/942-220-S99-1
| Name: |
us-gaap_NetIncomeLoss |
| Namespace Prefix: |
us-gaap_ |
| Data Type: |
xbrli:monetaryItemType |
| Balance Type: |
credit |
| Period Type: |
duration |
|
| X |
- References
+ Details
| Name: |
us-gaap_OrganizationConsolidationAndPresentationOfFinancialStatementsAbstract |
| Namespace Prefix: |
us-gaap_ |
| Data Type: |
xbrli:stringItemType |
| Balance Type: |
na |
| Period Type: |
duration |
|
| X |
- DefinitionAmount of accumulated undistributed earnings (deficit). Reference 1: http://www.xbrl.org/2003/role/exampleRef
-Topic 852
-SubTopic 10
-Name Accounting Standards Codification
-Section 55
-Paragraph 10
-Publisher FASB
-URI https://asc.fasb.org//1943274/2147481372/852-10-55-10
Reference 2: http://www.xbrl.org/2003/role/disclosureRef
-Topic 944
-SubTopic 40
-Name Accounting Standards Codification
-Section 65
-Paragraph 2
-Subparagraph (g)(2)(i)
-Publisher FASB
-URI https://asc.fasb.org//1943274/2147480016/944-40-65-2
Reference 3: http://www.xbrl.org/2003/role/disclosureRef
-Topic 944
-SubTopic 40
-Name Accounting Standards Codification
-Section 65
-Paragraph 2
-Subparagraph (h)(2)
-Publisher FASB
-URI https://asc.fasb.org//1943274/2147480016/944-40-65-2
Reference 4: http://www.xbrl.org/2003/role/disclosureRef
-Topic 946
-SubTopic 20
-Name Accounting Standards Codification
-Section 50
-Paragraph 11
-Publisher FASB
-URI https://asc.fasb.org//1943274/2147480990/946-20-50-11
Reference 5: http://www.xbrl.org/2003/role/disclosureRef
-Topic 944
-SubTopic 210
-Name Accounting Standards Codification
-Section S99
-Paragraph 1
-Subparagraph (SX 210.7-03(a)(23)(a)(4))
-Publisher FASB
-URI https://asc.fasb.org//1943274/2147479440/944-210-S99-1
Reference 6: http://www.xbrl.org/2003/role/disclosureRef
-Topic 946
-SubTopic 210
-Name Accounting Standards Codification
-Section S99
-Paragraph 1
-Subparagraph (SX 210.6-04(17))
-Publisher FASB
-URI https://asc.fasb.org//1943274/2147479617/946-210-S99-1
Reference 7: http://fasb.org/us-gaap/role/ref/legacyRef
-Topic 505
-SubTopic 10
-Name Accounting Standards Codification
-Section S99
-Paragraph 1
-Subparagraph (SX 210.3-04)
-Publisher FASB
-URI https://asc.fasb.org//1943274/2147480008/505-10-S99-1
Reference 8: http://fasb.org/us-gaap/role/ref/legacyRef
-Topic 210
-SubTopic 10
-Name Accounting Standards Codification
-Section S99
-Paragraph 1
-Subparagraph (SX 210.5-02(30)(a)(3))
-Publisher FASB
-URI https://asc.fasb.org//1943274/2147480566/210-10-S99-1
| Name: |
us-gaap_RetainedEarningsAccumulatedDeficit |
| Namespace Prefix: |
us-gaap_ |
| Data Type: |
xbrli:monetaryItemType |
| Balance Type: |
credit |
| Period Type: |
instant |
|
v3.23.2
| X |
- DefinitionAmount, before allowance for credit loss, of right to consideration from customer for product sold and service rendered in normal course of business. Reference 1: http://www.xbrl.org/2009/role/commonPracticeRef
-Topic 944
-SubTopic 210
-Name Accounting Standards Codification
-Section S99
-Paragraph 1
-Subparagraph (SX 210.7-03(a)(5))
-Publisher FASB
-URI https://asc.fasb.org//1943274/2147479440/944-210-S99-1
Reference 2: http://www.xbrl.org/2003/role/disclosureRef
-Topic 210
-SubTopic 10
-Name Accounting Standards Codification
-Section S99
-Paragraph 1
-Subparagraph (SX 210.5-02(3)(a)(1))
-Publisher FASB
-URI https://asc.fasb.org//1943274/2147480566/210-10-S99-1
Reference 3: http://www.xbrl.org/2003/role/disclosureRef
-Topic 310
-SubTopic 10
-Name Accounting Standards Codification
-Section 45
-Paragraph 2
-Publisher FASB
-URI https://asc.fasb.org//1943274/2147481990/310-10-45-2
| Name: |
us-gaap_AccountsReceivableGross |
| Namespace Prefix: |
us-gaap_ |
| Data Type: |
xbrli:monetaryItemType |
| Balance Type: |
debit |
| Period Type: |
instant |
|
| X |
- DefinitionAmount, after allowance for credit loss, of right to consideration from customer for product sold and service rendered in normal course of business. Reference 1: http://www.xbrl.org/2003/role/exampleRef
-Topic 946
-SubTopic 310
-Name Accounting Standards Codification
-Section 45
-Paragraph 1
-Subparagraph (d)
-Publisher FASB
-URI https://asc.fasb.org//1943274/2147480833/946-310-45-1
Reference 2: http://www.xbrl.org/2009/role/commonPracticeRef
-Topic 944
-SubTopic 210
-Name Accounting Standards Codification
-Section S99
-Paragraph 1
-Subparagraph (SX 210.7-03(a)(5))
-Publisher FASB
-URI https://asc.fasb.org//1943274/2147479440/944-210-S99-1
Reference 3: http://www.xbrl.org/2003/role/disclosureRef
-Topic 946
-SubTopic 210
-Name Accounting Standards Codification
-Section S99
-Paragraph 1
-Subparagraph (SX 210.6-04(5)(b))
-Publisher FASB
-URI https://asc.fasb.org//1943274/2147479617/946-210-S99-1
Reference 4: http://www.xbrl.org/2003/role/disclosureRef
-Topic 954
-SubTopic 310
-Name Accounting Standards Codification
-Section 45
-Paragraph 1
-Publisher FASB
-URI https://asc.fasb.org//1943274/2147481058/954-310-45-1
| Name: |
us-gaap_AccountsReceivableNet |
| Namespace Prefix: |
us-gaap_ |
| Data Type: |
xbrli:monetaryItemType |
| Balance Type: |
debit |
| Period Type: |
instant |
|
| X |
- DefinitionAmount of allowance for credit loss on accounts receivable. Reference 1: http://www.xbrl.org/2009/role/commonPracticeRef
-Topic 944
-SubTopic 210
-Name Accounting Standards Codification
-Section S99
-Paragraph 1
-Subparagraph (SX 210.7-03(a)(5))
-Publisher FASB
-URI https://asc.fasb.org//1943274/2147479440/944-210-S99-1
Reference 2: http://www.xbrl.org/2003/role/disclosureRef
-Topic 210
-SubTopic 10
-Name Accounting Standards Codification
-Section S99
-Paragraph 1
-Subparagraph (SX 210.5-02(4))
-Publisher FASB
-URI https://asc.fasb.org//1943274/2147480566/210-10-S99-1
Reference 3: http://www.xbrl.org/2003/role/disclosureRef
-Topic 326
-SubTopic 20
-Name Accounting Standards Codification
-Section 45
-Paragraph 1
-Publisher FASB
-URI https://asc.fasb.org//1943274/2147479344/326-20-45-1
Reference 4: http://www.xbrl.org/2003/role/disclosureRef
-Topic 310
-SubTopic 10
-Name Accounting Standards Codification
-Section 50
-Paragraph 4
-Publisher FASB
-URI https://asc.fasb.org//1943274/2147481962/310-10-50-4
Reference 5: http://www.xbrl.org/2003/role/disclosureRef
-Topic 326
-SubTopic 20
-Name Accounting Standards Codification
-Section 50
-Paragraph 13
-Subparagraph (a)
-Publisher FASB
-URI https://asc.fasb.org//1943274/2147479319/326-20-50-13
Reference 6: http://www.xbrl.org/2003/role/disclosureRef
-Topic 326
-SubTopic 20
-Name Accounting Standards Codification
-Section 50
-Paragraph 13
-Subparagraph (f)
-Publisher FASB
-URI https://asc.fasb.org//1943274/2147479319/326-20-50-13
| Name: |
us-gaap_AllowanceForDoubtfulAccountsReceivable |
| Namespace Prefix: |
us-gaap_ |
| Data Type: |
xbrli:monetaryItemType |
| Balance Type: |
credit |
| Period Type: |
instant |
|
| X |
- References
+ Details
| Name: |
us-gaap_ReceivablesAbstract |
| Namespace Prefix: |
us-gaap_ |
| Data Type: |
xbrli:stringItemType |
| Balance Type: |
na |
| Period Type: |
duration |
|
v3.23.2
| X |
- References
+ Details
| Name: |
SHMY_DisclosurePrepaidExpensesAndDepositsAbstract |
| Namespace Prefix: |
SHMY_ |
| Data Type: |
xbrli:stringItemType |
| Balance Type: |
na |
| Period Type: |
duration |
|
| X |
- DefinitionAmount, after allowance, of receivables classified as other, due within one year or the operating cycle, if longer.
| Name: |
us-gaap_OtherReceivablesNetCurrent |
| Namespace Prefix: |
us-gaap_ |
| Data Type: |
xbrli:monetaryItemType |
| Balance Type: |
debit |
| Period Type: |
instant |
|
| X |
- DefinitionAmount of asset related to consideration paid in advance for costs that provide economic benefits in future periods, and amount of other assets that are expected to be realized or consumed within one year or the normal operating cycle, if longer. Reference 1: http://www.xbrl.org/2009/role/commonPracticeRef
-Topic 210
-SubTopic 10
-Name Accounting Standards Codification
-Section S99
-Paragraph 1
-Subparagraph (SX 210.5-02(9))
-Publisher FASB
-URI https://asc.fasb.org//1943274/2147480566/210-10-S99-1
| Name: |
us-gaap_PrepaidExpenseAndOtherAssetsCurrent |
| Namespace Prefix: |
us-gaap_ |
| Data Type: |
xbrli:monetaryItemType |
| Balance Type: |
debit |
| Period Type: |
instant |
|
| X |
- DefinitionAmount of asset related to consideration paid in advance for costs that provide economic benefits within a future period of one year or the normal operating cycle, if longer. Reference 1: http://www.xbrl.org/2003/role/exampleRef
-Topic 210
-SubTopic 10
-Name Accounting Standards Codification
-Section 45
-Paragraph 1
-Subparagraph (g)
-Publisher FASB
-URI https://asc.fasb.org//1943274/2147483467/210-10-45-1
Reference 2: http://www.xbrl.org/2003/role/disclosureRef
-Topic 210
-SubTopic 10
-Name Accounting Standards Codification
-Section S99
-Paragraph 1
-Subparagraph (SX 210.5-02(7))
-Publisher FASB
-URI https://asc.fasb.org//1943274/2147480566/210-10-S99-1
Reference 3: http://www.xbrl.org/2003/role/disclosureRef
-Topic 340
-SubTopic 10
-Name Accounting Standards Codification
-Section 05
-Paragraph 5
-Publisher FASB
-URI https://asc.fasb.org//1943274/2147482955/340-10-05-5
Reference 4: http://www.xbrl.org/2003/role/disclosureRef
-Topic 340
-SubTopic 10
-Name Accounting Standards Codification
-Section 45
-Paragraph 1
-Publisher FASB
-URI https://asc.fasb.org//1943274/2147483032/340-10-45-1
| Name: |
us-gaap_PrepaidExpenseCurrent |
| Namespace Prefix: |
us-gaap_ |
| Data Type: |
xbrli:monetaryItemType |
| Balance Type: |
debit |
| Period Type: |
instant |
|
v3.23.2
SCHEDULE OF PLANT AND EQUIPMENT (Details) - USD ($)
|
Jun. 30, 2023 |
Mar. 31, 2023 |
| Property, Plant and Equipment [Line Items] |
|
|
| Total plant and equipment |
$ 88,673
|
$ 93,585
|
| Less: Accumulated depreciation |
(27,917)
|
(27,401)
|
| Total plant and equipment |
60,756
|
66,184
|
| Office Equipment [Member] |
|
|
| Property, Plant and Equipment [Line Items] |
|
|
| Total plant and equipment |
37,223
|
39,285
|
| Kitchen Equipment [Member] |
|
|
| Property, Plant and Equipment [Line Items] |
|
|
| Total plant and equipment |
40,953
|
43,222
|
| Vehicles [Member] |
|
|
| Property, Plant and Equipment [Line Items] |
|
|
| Total plant and equipment |
$ 10,497
|
$ 11,078
|
| X |
- DefinitionAmount of accumulated depreciation, depletion and amortization for physical assets used in the normal conduct of business to produce goods and services. Reference 1: http://www.xbrl.org/2003/role/disclosureRef
-Topic 944
-SubTopic 210
-Name Accounting Standards Codification
-Section S99
-Paragraph 1
-Subparagraph (SX 210.7-03(a)(8)(b))
-Publisher FASB
-URI https://asc.fasb.org//1943274/2147479440/944-210-S99-1
Reference 2: http://www.xbrl.org/2003/role/disclosureRef
-Topic 210
-SubTopic 10
-Name Accounting Standards Codification
-Section S99
-Paragraph 1
-Subparagraph (SX 210.5-02(14))
-Publisher FASB
-URI https://asc.fasb.org//1943274/2147480566/210-10-S99-1
Reference 3: http://fasb.org/us-gaap/role/ref/legacyRef
-Name Accounting Standards Codification
-Topic 360
-SubTopic 10
-Section 50
-Paragraph 1
-Subparagraph (c)
-Publisher FASB
-URI https://asc.fasb.org//1943274/2147482099/360-10-50-1
| Name: |
us-gaap_AccumulatedDepreciationDepletionAndAmortizationPropertyPlantAndEquipment |
| Namespace Prefix: |
us-gaap_ |
| Data Type: |
xbrli:monetaryItemType |
| Balance Type: |
credit |
| Period Type: |
instant |
|
| X |
- DefinitionAmount before accumulated depreciation, depletion and amortization of physical assets used in the normal conduct of business and not intended for resale. Examples include, but are not limited to, land, buildings, machinery and equipment, office equipment, and furniture and fixtures. Reference 1: http://www.xbrl.org/2003/role/disclosureRef
-Topic 944
-SubTopic 210
-Name Accounting Standards Codification
-Section S99
-Paragraph 1
-Subparagraph (SX 210.7-03(a)(8))
-Publisher FASB
-URI https://asc.fasb.org//1943274/2147479440/944-210-S99-1
Reference 2: http://www.xbrl.org/2003/role/disclosureRef
-Topic 210
-SubTopic 10
-Name Accounting Standards Codification
-Section S99
-Paragraph 1
-Subparagraph (SX 210.5-02(13))
-Publisher FASB
-URI https://asc.fasb.org//1943274/2147480566/210-10-S99-1
Reference 3: http://fasb.org/us-gaap/role/ref/legacyRef
-Topic 360
-SubTopic 10
-Name Accounting Standards Codification
-Section 50
-Paragraph 1
-Subparagraph (b)
-Publisher FASB
-URI https://asc.fasb.org//1943274/2147482099/360-10-50-1
| Name: |
us-gaap_PropertyPlantAndEquipmentGross |
| Namespace Prefix: |
us-gaap_ |
| Data Type: |
xbrli:monetaryItemType |
| Balance Type: |
debit |
| Period Type: |
instant |
|
| X |
- DefinitionLine items represent financial concepts included in a table. These concepts are used to disclose reportable information associated with domain members defined in one or many axes to the table.
| Name: |
us-gaap_PropertyPlantAndEquipmentLineItems |
| Namespace Prefix: |
us-gaap_ |
| Data Type: |
xbrli:stringItemType |
| Balance Type: |
na |
| Period Type: |
duration |
|
| X |
- DefinitionAmount after accumulated depreciation, depletion and amortization of physical assets used in the normal conduct of business to produce goods and services and not intended for resale. Examples include, but are not limited to, land, buildings, machinery and equipment, office equipment, and furniture and fixtures. Reference 1: http://fasb.org/us-gaap/role/ref/legacyRef
-Name Accounting Standards Codification
-Section 50
-Paragraph 1
-SubTopic 10
-Topic 360
-Publisher FASB
-URI https://asc.fasb.org//1943274/2147482099/360-10-50-1
Reference 2: http://www.xbrl.org/2003/role/exampleRef
-Topic 852
-SubTopic 10
-Name Accounting Standards Codification
-Section 55
-Paragraph 10
-Publisher FASB
-URI https://asc.fasb.org//1943274/2147481372/852-10-55-10
Reference 3: http://www.xbrl.org/2003/role/disclosureRef
-Topic 944
-SubTopic 210
-Name Accounting Standards Codification
-Section S99
-Paragraph 1
-Subparagraph (SX 210.7-03(a)(8))
-Publisher FASB
-URI https://asc.fasb.org//1943274/2147479440/944-210-S99-1
Reference 4: http://www.xbrl.org/2003/role/disclosureRef
-Topic 942
-SubTopic 360
-Name Accounting Standards Codification
-Section 50
-Paragraph 1
-Publisher FASB
-URI https://asc.fasb.org//1943274/2147480842/942-360-50-1
| Name: |
us-gaap_PropertyPlantAndEquipmentNet |
| Namespace Prefix: |
us-gaap_ |
| Data Type: |
xbrli:monetaryItemType |
| Balance Type: |
debit |
| Period Type: |
instant |
|
| X |
- Details
| Name: |
us-gaap_PropertyPlantAndEquipmentByTypeAxis=us-gaap_OfficeEquipmentMember |
| Namespace Prefix: |
|
| Data Type: |
na |
| Balance Type: |
|
| Period Type: |
|
|
| X |
- Details
| Name: |
us-gaap_PropertyPlantAndEquipmentByTypeAxis=SHMY_KitchenEquipmentMember |
| Namespace Prefix: |
|
| Data Type: |
na |
| Balance Type: |
|
| Period Type: |
|
|
| X |
- Details
| Name: |
us-gaap_PropertyPlantAndEquipmentByTypeAxis=us-gaap_VehiclesMember |
| Namespace Prefix: |
|
| Data Type: |
na |
| Balance Type: |
|
| Period Type: |
|
|
v3.23.2
| X |
- DefinitionThe aggregate expense recognized in the current period that allocates the cost of tangible assets, intangible assets, or depleting assets to periods that benefit from use of the assets. Reference 1: http://fasb.org/us-gaap/role/ref/legacyRef
-Name Accounting Standards Codification
-Section 45
-Paragraph 28
-Subparagraph (b)
-SubTopic 10
-Topic 230
-Publisher FASB
-URI https://asc.fasb.org//1943274/2147482740/230-10-45-28
Reference 2: http://www.xbrl.org/2003/role/disclosureRef
-Topic 280
-SubTopic 10
-Name Accounting Standards Codification
-Section 50
-Paragraph 22
-Subparagraph (e)
-Publisher FASB
-URI https://asc.fasb.org//1943274/2147482810/280-10-50-22
| Name: |
us-gaap_DepreciationDepletionAndAmortization |
| Namespace Prefix: |
us-gaap_ |
| Data Type: |
xbrli:monetaryItemType |
| Balance Type: |
debit |
| Period Type: |
duration |
|
| X |
- DefinitionThe cash outflow associated with the acquisition of long-lived, physical assets that are used in the normal conduct of business to produce goods and services and not intended for resale; includes cash outflows to pay for construction of self-constructed assets. Reference 1: http://fasb.org/us-gaap/role/ref/legacyRef
-Topic 230
-SubTopic 10
-Name Accounting Standards Codification
-Section 45
-Paragraph 13
-Subparagraph (c)
-Publisher FASB
-URI https://asc.fasb.org//1943274/2147482740/230-10-45-13
| Name: |
us-gaap_PaymentsToAcquirePropertyPlantAndEquipment |
| Namespace Prefix: |
us-gaap_ |
| Data Type: |
xbrli:monetaryItemType |
| Balance Type: |
credit |
| Period Type: |
duration |
|
| X |
- DefinitionLine items represent financial concepts included in a table. These concepts are used to disclose reportable information associated with domain members defined in one or many axes to the table.
| Name: |
us-gaap_PropertyPlantAndEquipmentLineItems |
| Namespace Prefix: |
us-gaap_ |
| Data Type: |
xbrli:stringItemType |
| Balance Type: |
na |
| Period Type: |
duration |
|
| X |
- Details
| Name: |
us-gaap_PropertyPlantAndEquipmentByTypeAxis=SHMY_KitchenEquipmentMember |
| Namespace Prefix: |
|
| Data Type: |
na |
| Balance Type: |
|
| Period Type: |
|
|
| X |
- Details
| Name: |
us-gaap_PropertyPlantAndEquipmentByTypeAxis=us-gaap_OfficeEquipmentMember |
| Namespace Prefix: |
|
| Data Type: |
na |
| Balance Type: |
|
| Period Type: |
|
|
v3.23.2
| X |
- DefinitionAmount of liabilities incurred to vendors for goods and services received, and accrued liabilities classified as other, payable within one year or the normal operating cycle, if longer.
| Name: |
us-gaap_AccountsPayableAndOtherAccruedLiabilitiesCurrent |
| Namespace Prefix: |
us-gaap_ |
| Data Type: |
xbrli:monetaryItemType |
| Balance Type: |
credit |
| Period Type: |
instant |
|
| X |
- DefinitionAmount of obligations incurred classified as other, payable within one year or the normal operating cycle, if longer. Reference 1: http://fasb.org/us-gaap/role/ref/legacyRef
-Name Accounting Standards Codification
-Topic 210
-SubTopic 10
-Section S99
-Paragraph 1
-Subparagraph (SX 210.5-02.19(a))
-Publisher FASB
-URI https://asc.fasb.org//1943274/2147480566/210-10-S99-1
| Name: |
us-gaap_AccountsPayableOtherCurrent |
| Namespace Prefix: |
us-gaap_ |
| Data Type: |
xbrli:monetaryItemType |
| Balance Type: |
credit |
| Period Type: |
instant |
|
| X |
- DefinitionCarrying value as of the balance sheet date of obligations incurred and payable, pertaining to costs that are statutory in nature, are incurred on contractual obligations, or accumulate over time and for which invoices have not yet been received or will not be rendered. Examples include taxes, interest, rent and utilities. Used to reflect the current portion of the liabilities (due within one year or within the normal operating cycle if longer). Reference 1: http://fasb.org/us-gaap/role/ref/legacyRef
-Name Accounting Standards Codification
-Topic 210
-SubTopic 10
-Section S99
-Paragraph 1
-Subparagraph (SX 210.5-02.20)
-Publisher FASB
-URI https://asc.fasb.org//1943274/2147480566/210-10-S99-1
| Name: |
us-gaap_AccruedLiabilitiesCurrent |
| Namespace Prefix: |
us-gaap_ |
| Data Type: |
xbrli:monetaryItemType |
| Balance Type: |
credit |
| Period Type: |
instant |
|
| X |
- References
+ Details
| Name: |
us-gaap_PayablesAndAccrualsAbstract |
| Namespace Prefix: |
us-gaap_ |
| Data Type: |
xbrli:stringItemType |
| Balance Type: |
na |
| Period Type: |
duration |
|
v3.23.2
SCHEDULE OF AMOUNT DUE TO A DIRECTOR (Details)
|
3 Months Ended |
|
Jun. 30, 2023
USD ($)
|
|---|
| Director [Member] |
|
| Related Party Transaction [Line Items] |
|
| Total amount due to director |
$ 1,290,909
|
| Mr. Leong Will Liam [Member] |
|
| Related Party Transaction [Line Items] |
|
| Amount due to director, beginning balance |
1,325,308
|
| Mr. Leong Will Liam [Member] | Director [Member] |
|
| Related Party Transaction [Line Items] |
|
| Amount due to director, beginning balance |
1,300,486
|
| Loan from director |
15,050
|
| Foreign currency translation |
(49,449)
|
| Total amount due to director |
1,266,087
|
| Synergy Empire HK [Member] | Director [Member] |
|
| Related Party Transaction [Line Items] |
|
| Total amount due to director |
$ 24,822
|
| X |
- Definition
+ References
+ Details
| Name: |
SHMY_ProceedsFromLoanFromAffiliates |
| Namespace Prefix: |
SHMY_ |
| Data Type: |
xbrli:monetaryItemType |
| Balance Type: |
debit |
| Period Type: |
duration |
|
| X |
- DefinitionAmount, before tax, of realized and unrealized gain (loss) from foreign currency transaction. Reference 1: http://www.xbrl.org/2003/role/disclosureRef
-Topic 946
-SubTopic 220
-Name Accounting Standards Codification
-Section S99
-Paragraph 1
-Subparagraph (SX 210.6-07(7))
-Publisher FASB
-URI https://asc.fasb.org//1943274/2147483575/946-220-S99-1
Reference 2: http://www.xbrl.org/2003/role/disclosureRef
-Topic 830
-SubTopic 20
-Name Accounting Standards Codification
-Section 35
-Paragraph 1
-Publisher FASB
-URI https://asc.fasb.org//1943274/2147482014/830-20-35-1
Reference 3: http://www.xbrl.org/2003/role/disclosureRef
-Topic 830
-SubTopic 20
-Name Accounting Standards Codification
-Section 45
-Paragraph 1
-Publisher FASB
-URI https://asc.fasb.org//1943274/2147481956/830-20-45-1
Reference 4: http://www.xbrl.org/2003/role/disclosureRef
-Topic 830
-SubTopic 20
-Name Accounting Standards Codification
-Section 50
-Paragraph 1
-Publisher FASB
-URI https://asc.fasb.org//1943274/2147481926/830-20-50-1
Reference 5: http://www.xbrl.org/2003/role/disclosureRef
-Topic 830
-SubTopic 10
-Name Accounting Standards Codification
-Section 45
-Paragraph 17
-Publisher FASB
-URI https://asc.fasb.org//1943274/2147481839/830-10-45-17
| Name: |
us-gaap_ForeignCurrencyTransactionGainLossBeforeTax |
| Namespace Prefix: |
us-gaap_ |
| Data Type: |
xbrli:monetaryItemType |
| Balance Type: |
credit |
| Period Type: |
duration |
|
| X |
- DefinitionAmount of liabilities classified as other, due within one year or the normal operating cycle, if longer. Reference 1: http://www.xbrl.org/2003/role/exampleRef
-Topic 852
-SubTopic 10
-Name Accounting Standards Codification
-Section 55
-Paragraph 10
-Publisher FASB
-URI https://asc.fasb.org//1943274/2147481372/852-10-55-10
Reference 2: http://fasb.org/us-gaap/role/ref/legacyRef
-Name Accounting Standards Codification
-Topic 210
-SubTopic 10
-Section S99
-Paragraph 1
-Subparagraph (SX 210.5-02.20)
-Publisher FASB
-URI https://asc.fasb.org//1943274/2147480566/210-10-S99-1
| Name: |
us-gaap_OtherLiabilitiesCurrent |
| Namespace Prefix: |
us-gaap_ |
| Data Type: |
xbrli:monetaryItemType |
| Balance Type: |
credit |
| Period Type: |
instant |
|
| X |
- Details
| Name: |
srt_TitleOfIndividualAxis=srt_DirectorMember |
| Namespace Prefix: |
|
| Data Type: |
na |
| Balance Type: |
|
| Period Type: |
|
|
v3.23.2
AMOUNT DUE TO A DIRECTOR (Details Narrative) - USD ($)
|
3 Months Ended |
|
Jun. 30, 2023 |
Jun. 30, 2022 |
Mar. 31, 2023 |
| Related Party Transaction [Line Items] |
|
|
|
| Proceeds from Related Party Debt |
$ 15,050
|
$ 126,075
|
|
| Synergy Empire HK [Member] |
|
|
|
| Related Party Transaction [Line Items] |
|
|
|
| Other Liabilities, Current |
|
|
$ 24,822
|
| Mr. Leong Will Liam [Member] |
|
|
|
| Related Party Transaction [Line Items] |
|
|
|
| Other Liabilities, Current |
|
|
$ 1,325,308
|
| Proceeds from Related Party Debt |
$ 15,050
|
|
|
| X |
- DefinitionAmount of liabilities classified as other, due within one year or the normal operating cycle, if longer. Reference 1: http://www.xbrl.org/2003/role/exampleRef
-Topic 852
-SubTopic 10
-Name Accounting Standards Codification
-Section 55
-Paragraph 10
-Publisher FASB
-URI https://asc.fasb.org//1943274/2147481372/852-10-55-10
Reference 2: http://fasb.org/us-gaap/role/ref/legacyRef
-Name Accounting Standards Codification
-Topic 210
-SubTopic 10
-Section S99
-Paragraph 1
-Subparagraph (SX 210.5-02.20)
-Publisher FASB
-URI https://asc.fasb.org//1943274/2147480566/210-10-S99-1
| Name: |
us-gaap_OtherLiabilitiesCurrent |
| Namespace Prefix: |
us-gaap_ |
| Data Type: |
xbrli:monetaryItemType |
| Balance Type: |
credit |
| Period Type: |
instant |
|
| X |
- Details
| Name: |
dei_LegalEntityAxis=SHMY_SynergyEmpireHKMember |
| Namespace Prefix: |
|
| Data Type: |
na |
| Balance Type: |
|
| Period Type: |
|
|
v3.23.2
| X |
- References
+ Details
| Name: |
us-gaap_DebtDisclosureAbstract |
| Namespace Prefix: |
us-gaap_ |
| Data Type: |
xbrli:stringItemType |
| Balance Type: |
na |
| Period Type: |
duration |
|
| X |
- DefinitionIncluding the current and noncurrent portions, carrying value as of the balance sheet date of loans from a bank with maturities initially due after one year or beyond the normal operating cycle if longer. Reference 1: http://fasb.org/us-gaap/role/ref/legacyRef
-Name Accounting Standards Codification
-Section S99
-Paragraph 1
-Subparagraph (SX 210.5-02(22))
-SubTopic 10
-Topic 210
-Publisher FASB
-URI https://asc.fasb.org//1943274/2147480566/210-10-S99-1
Reference 2: http://www.xbrl.org/2009/role/commonPracticeRef
-Topic 944
-SubTopic 210
-Name Accounting Standards Codification
-Section S99
-Paragraph 1
-Subparagraph (SX 210.7-03(a)(16)(a)(2))
-Publisher FASB
-URI https://asc.fasb.org//1943274/2147479440/944-210-S99-1
Reference 3: http://fasb.org/us-gaap/role/ref/legacyRef
-Topic 942
-SubTopic 210
-Name Accounting Standards Codification
-Section S99
-Paragraph 1
-Subparagraph (SX 210.9-03(16))
-Publisher FASB
-URI https://asc.fasb.org//1943274/2147479853/942-210-S99-1
| Name: |
us-gaap_LoansPayableToBank |
| Namespace Prefix: |
us-gaap_ |
| Data Type: |
xbrli:monetaryItemType |
| Balance Type: |
credit |
| Period Type: |
instant |
|
| X |
- DefinitionCarrying value as of the balance sheet date of current portion of long-term loans payable to bank due within one year or the operating cycle if longer. Reference 1: http://www.xbrl.org/2003/role/disclosureRef
-Topic 946
-SubTopic 210
-Name Accounting Standards Codification
-Section S99
-Paragraph 1
-Subparagraph (SX 210.6-04(13)(a)(1))
-Publisher FASB
-URI https://asc.fasb.org//1943274/2147479617/946-210-S99-1
Reference 2: http://fasb.org/us-gaap/role/ref/legacyRef
-Topic 210
-SubTopic 10
-Name Accounting Standards Codification
-Section S99
-Paragraph 1
-Subparagraph (SX 210.5-02(19))
-Publisher FASB
-URI https://asc.fasb.org//1943274/2147480566/210-10-S99-1
| Name: |
us-gaap_LoansPayableToBankCurrent |
| Namespace Prefix: |
us-gaap_ |
| Data Type: |
xbrli:monetaryItemType |
| Balance Type: |
credit |
| Period Type: |
instant |
|
| X |
- DefinitionCarrying value as of the balance sheet date of loans from a bank with maturities initially due after one year or beyond the operating cycle if longer, excluding current portion. Reference 1: http://fasb.org/us-gaap/role/ref/legacyRef
-Name Accounting Standards Codification
-Section S99
-Paragraph 1
-Subparagraph (SX 210.5-02(22))
-SubTopic 10
-Topic 210
-Publisher FASB
-URI https://asc.fasb.org//1943274/2147480566/210-10-S99-1
Reference 2: http://www.xbrl.org/2003/role/disclosureRef
-Topic 946
-SubTopic 210
-Name Accounting Standards Codification
-Section S99
-Paragraph 1
-Subparagraph (SX 210.6-04(13)(a)(1))
-Publisher FASB
-URI https://asc.fasb.org//1943274/2147479617/946-210-S99-1
Reference 3: http://fasb.org/us-gaap/role/ref/legacyRef
-Topic 942
-SubTopic 210
-Name Accounting Standards Codification
-Section S99
-Paragraph 1
-Subparagraph (SX 210.9-03(16))
-Publisher FASB
-URI https://asc.fasb.org//1943274/2147479853/942-210-S99-1
| Name: |
us-gaap_LongTermLoansFromBank |
| Namespace Prefix: |
us-gaap_ |
| Data Type: |
xbrli:monetaryItemType |
| Balance Type: |
credit |
| Period Type: |
instant |
|
v3.23.2
| X |
- References
+ Details
| Name: |
us-gaap_DebtDisclosureAbstract |
| Namespace Prefix: |
us-gaap_ |
| Data Type: |
xbrli:stringItemType |
| Balance Type: |
na |
| Period Type: |
duration |
|
| X |
- DefinitionAmount, after deduction of unamortized premium (discount) and debt issuance cost, of long-term debt. Excludes lease obligation. Reference 1: http://fasb.org/us-gaap/role/ref/legacyRef
-Name Accounting Standards Codification
-Section S99
-Paragraph 1
-Subparagraph (SX 210.5-02(22))
-SubTopic 10
-Topic 210
-Publisher FASB
-URI https://asc.fasb.org//1943274/2147480566/210-10-S99-1
Reference 2: http://www.xbrl.org/2003/role/exampleRef
-Topic 470
-SubTopic 20
-Name Accounting Standards Codification
-Section 55
-Paragraph 69B
-Publisher FASB
-URI https://asc.fasb.org//1943274/2147481568/470-20-55-69B
Reference 3: http://www.xbrl.org/2003/role/exampleRef
-Topic 470
-SubTopic 20
-Name Accounting Standards Codification
-Section 55
-Paragraph 69C
-Publisher FASB
-URI https://asc.fasb.org//1943274/2147481568/470-20-55-69C
Reference 4: http://www.xbrl.org/2003/role/disclosureRef
-Topic 470
-SubTopic 20
-Name Accounting Standards Codification
-Section 50
-Paragraph 1D
-Subparagraph (b)
-Publisher FASB
-URI https://asc.fasb.org//1943274/2147481139/470-20-50-1D
Reference 5: http://www.xbrl.org/2009/role/commonPracticeRef
-Topic 944
-SubTopic 210
-Name Accounting Standards Codification
-Section S99
-Paragraph 1
-Subparagraph (SX 210.7-03(a)(16)(a)(2))
-Publisher FASB
-URI https://asc.fasb.org//1943274/2147479440/944-210-S99-1
Reference 6: http://fasb.org/us-gaap/role/ref/legacyRef
-Topic 942
-SubTopic 210
-Name Accounting Standards Codification
-Section S99
-Paragraph 1
-Subparagraph (SX 210.9-03(16))
-Publisher FASB
-URI https://asc.fasb.org//1943274/2147479853/942-210-S99-1
Reference 7: http://www.xbrl.org/2003/role/disclosureRef
-Topic 470
-SubTopic 20
-Name Accounting Standards Codification
-Section 50
-Paragraph 4
-Subparagraph (b)(3)
-Publisher FASB
-URI https://asc.fasb.org//1943274/2147481139/470-20-50-4
| Name: |
us-gaap_LongTermDebt |
| Namespace Prefix: |
us-gaap_ |
| Data Type: |
xbrli:monetaryItemType |
| Balance Type: |
credit |
| Period Type: |
instant |
|
| X |
- DefinitionAmount of long-term debt payable, sinking fund requirement, and other securities issued that are redeemable by holder at fixed or determinable price and date, maturing in next fiscal year following current fiscal year. Excludes interim and annual periods when interim periods are reported from current statement of financial position date (rolling approach). Reference 1: http://www.xbrl.org/2003/role/disclosureRef
-Topic 235
-SubTopic 10
-Name Accounting Standards Codification
-Section S99
-Paragraph 3
-Subparagraph (SX 210.12-04(a))
-Publisher FASB
-URI https://asc.fasb.org//1943274/2147480678/235-10-S99-3
Reference 2: http://www.xbrl.org/2003/role/disclosureRef
-Topic 470
-SubTopic 20
-Name Accounting Standards Codification
-Section 50
-Paragraph 1E
-Subparagraph (d)
-Publisher FASB
-URI https://asc.fasb.org//1943274/2147481139/470-20-50-1E
Reference 3: http://fasb.org/us-gaap/role/ref/legacyRef
-Name Accounting Standards Codification
-Section 50
-Paragraph 1
-SubTopic 10
-Topic 470
-Publisher FASB
-URI https://asc.fasb.org//1943274/2147481544/470-10-50-1
| Name: |
us-gaap_LongTermDebtMaturitiesRepaymentsOfPrincipalInNextTwelveMonths |
| Namespace Prefix: |
us-gaap_ |
| Data Type: |
xbrli:monetaryItemType |
| Balance Type: |
credit |
| Period Type: |
instant |
|
v3.23.2
BANK BORROWING (Details Narrative)
|
|
|
3 Months Ended |
|
|
Apr. 01, 2020
USD ($)
|
Jan. 25, 2017
USD ($)
|
Jan. 25, 2017
MYR (RM)
|
Jun. 30, 2023
USD ($)
|
Jun. 30, 2022
USD ($)
|
Jan. 25, 2017
MYR (RM)
|
| Line of Credit Facility [Line Items] |
|
|
|
|
|
|
| Interest expense |
|
|
|
$ 123
|
$ 514
|
|
| Repayments of bank debt |
|
|
|
$ 4,134
|
$ 3,938
|
|
| Lucky Star F&B Sdn. Bhd [Member] | Standard Chartered Saadiq Berhad [Member] |
|
|
|
|
|
|
| Line of Credit Facility [Line Items] |
|
|
|
|
|
|
| Debt instrument principal amount |
|
$ 83,972
|
|
|
|
RM 342,834
|
| Debt instrument interest rate percentage |
|
6.00%
|
|
|
|
6.00%
|
| Debt instrument repayment period |
|
repayment period of 72 months with interest
|
repayment period of 72 months with interest
|
|
|
|
| Debt instrument monthly installment |
|
$ 1,585
|
RM 6,473
|
|
|
|
| Interest expense |
$ 2,141
|
|
|
|
|
|
| X |
- DefinitionAmount, before unamortized (discount) premium and debt issuance costs, of long-term debt. Includes, but is not limited to, notes payable, bonds payable, commercial loans, mortgage loans, convertible debt, subordinated debt and other types of debt. Reference 1: http://fasb.org/us-gaap/role/ref/legacyRef
-Name Accounting Standards Codification
-Section S99
-Paragraph 1
-Subparagraph (SX 210.5-02(22))
-SubTopic 10
-Topic 210
-Publisher FASB
-URI https://asc.fasb.org//1943274/2147480566/210-10-S99-1
Reference 2: http://fasb.org/us-gaap/role/ref/legacyRef
-Topic 942
-SubTopic 210
-Name Accounting Standards Codification
-Section S99
-Paragraph 1
-Subparagraph (SX 210.9-03(16))
-Publisher FASB
-URI https://asc.fasb.org//1943274/2147479853/942-210-S99-1
Reference 3: http://www.xbrl.org/2003/role/disclosureRef
-Topic 470
-SubTopic 20
-Name Accounting Standards Codification
-Section 50
-Paragraph 4
-Subparagraph (b)(1)
-Publisher FASB
-URI https://asc.fasb.org//1943274/2147481139/470-20-50-4
| Name: |
us-gaap_DebtInstrumentCarryingAmount |
| Namespace Prefix: |
us-gaap_ |
| Data Type: |
xbrli:monetaryItemType |
| Balance Type: |
credit |
| Period Type: |
instant |
|
| X |
- DefinitionContractual interest rate for funds borrowed, under the debt agreement. Reference 1: http://www.xbrl.org/2003/role/disclosureRef
-Topic 470
-SubTopic 20
-Name Accounting Standards Codification
-Section 50
-Paragraph 1B
-Subparagraph (b)
-Publisher FASB
-URI https://asc.fasb.org//1943274/2147481139/470-20-50-1B
Reference 2: http://fasb.org/us-gaap/role/ref/legacyRef
-Name Accounting Standards Codification
-Topic 210
-SubTopic 10
-Section S99
-Paragraph 1
-Subparagraph (SX 210.5-02.22(a)(1))
-Publisher FASB
-URI https://asc.fasb.org//1943274/2147480566/210-10-S99-1
| Name: |
us-gaap_DebtInstrumentInterestRateStatedPercentage |
| Namespace Prefix: |
us-gaap_ |
| Data Type: |
dtr-types:percentItemType |
| Balance Type: |
na |
| Period Type: |
instant |
|
| X |
- DefinitionDescription of the payment terms of the debt instrument (for example, whether periodic payments include principal and frequency of payments) and discussion about any contingencies associated with the payment. Reference 1: http://fasb.org/us-gaap/role/ref/legacyRef
-Name Accounting Standards Codification
-Topic 942
-SubTopic 470
-Section 50
-Paragraph 3
-Subparagraph (c)
-Publisher FASB
-URI https://asc.fasb.org//1943274/2147480848/942-470-50-3
Reference 2: http://fasb.org/us-gaap/role/ref/legacyRef
-Name Accounting Standards Codification
-Topic 210
-SubTopic 10
-Section S99
-Paragraph 1
-Subparagraph (SX 210.5-02.22(a)(3))
-Publisher FASB
-URI https://asc.fasb.org//1943274/2147480566/210-10-S99-1
| Name: |
us-gaap_DebtInstrumentPaymentTerms |
| Namespace Prefix: |
us-gaap_ |
| Data Type: |
xbrli:stringItemType |
| Balance Type: |
na |
| Period Type: |
duration |
|
| X |
- DefinitionAmount of the required periodic payments including both interest and principal payments. Reference 1: http://fasb.org/us-gaap/role/ref/legacyRef
-Name Accounting Standards Codification
-Topic 210
-SubTopic 10
-Section S99
-Paragraph 1
-Subparagraph (SX 210.5-02.22)
-Publisher FASB
-URI https://asc.fasb.org//1943274/2147480566/210-10-S99-1
Reference 2: http://fasb.org/us-gaap/role/ref/legacyRef
-Name Accounting Standards Codification
-Topic 942
-SubTopic 470
-Section 50
-Paragraph 3
-Subparagraph (c)
-Publisher FASB
-URI https://asc.fasb.org//1943274/2147480848/942-470-50-3
| Name: |
us-gaap_DebtInstrumentPeriodicPayment |
| Namespace Prefix: |
us-gaap_ |
| Data Type: |
xbrli:monetaryItemType |
| Balance Type: |
debit |
| Period Type: |
duration |
|
| X |
- DefinitionAmount of the cost of borrowed funds accounted for as interest expense. Reference 1: http://www.xbrl.org/2003/role/exampleRef
-Topic 946
-SubTopic 830
-Name Accounting Standards Codification
-Section 55
-Paragraph 10
-Publisher FASB
-URI https://asc.fasb.org//1943274/2147480167/946-830-55-10
Reference 2: http://www.xbrl.org/2009/role/commonPracticeRef
-Topic 946
-SubTopic 220
-Name Accounting Standards Codification
-Section 45
-Paragraph 3
-Subparagraph (i)
-Publisher FASB
-URI https://asc.fasb.org//1943274/2147483581/946-220-45-3
Reference 3: http://www.xbrl.org/2003/role/disclosureRef
-Topic 946
-SubTopic 220
-Name Accounting Standards Codification
-Section S99
-Paragraph 1
-Subparagraph (SX 210.6-07(3))
-Publisher FASB
-URI https://asc.fasb.org//1943274/2147483575/946-220-S99-1
Reference 4: http://www.xbrl.org/2003/role/disclosureRef
-Topic 280
-SubTopic 10
-Name Accounting Standards Codification
-Section 50
-Paragraph 22
-Subparagraph (d)
-Publisher FASB
-URI https://asc.fasb.org//1943274/2147482810/280-10-50-22
Reference 5: http://fasb.org/us-gaap/role/ref/legacyRef
-Name Accounting Standards Codification
-Topic 835
-SubTopic 30
-Section 45
-Paragraph 3
-Publisher FASB
-URI https://asc.fasb.org//1943274/2147482925/835-30-45-3
Reference 6: http://fasb.org/us-gaap/role/ref/legacyRef
-Topic 942
-SubTopic 220
-Name Accounting Standards Codification
-Section S99
-Paragraph 1
-Subparagraph (SX 210.9-04.9)
-Publisher FASB
-URI https://asc.fasb.org//1943274/2147483589/942-220-S99-1
Reference 7: http://www.xbrl.org/2003/role/disclosureRef
-Topic 220
-SubTopic 10
-Name Accounting Standards Codification
-Section S99
-Paragraph 2
-Subparagraph (210.5-03(11))
-Publisher FASB
-URI https://asc.fasb.org//1943274/2147483621/220-10-S99-2
Reference 8: http://www.xbrl.org/2003/role/disclosureRef
-Topic 835
-SubTopic 20
-Name Accounting Standards Codification
-Section 50
-Paragraph 1
-Subparagraph (a)
-Publisher FASB
-URI https://asc.fasb.org//1943274/2147483013/835-20-50-1
| Name: |
us-gaap_InterestExpense |
| Namespace Prefix: |
us-gaap_ |
| Data Type: |
xbrli:monetaryItemType |
| Balance Type: |
debit |
| Period Type: |
duration |
|
| X |
- DefinitionLine items represent financial concepts included in a table. These concepts are used to disclose reportable information associated with domain members defined in one or many axes to the table. Reference 1: http://www.xbrl.org/2009/role/commonPracticeRef
-Topic 235
-SubTopic 10
-Name Accounting Standards Codification
-Section S99
-Paragraph 1
-Subparagraph (SX 210.4-08(f))
-Publisher FASB
-URI https://asc.fasb.org//1943274/2147480678/235-10-S99-1
| Name: |
us-gaap_LineOfCreditFacilityLineItems |
| Namespace Prefix: |
us-gaap_ |
| Data Type: |
xbrli:stringItemType |
| Balance Type: |
na |
| Period Type: |
duration |
|
| X |
- DefinitionThe cash outflow to settle a bank borrowing during the year. Reference 1: http://fasb.org/us-gaap/role/ref/legacyRef
-Name Accounting Standards Codification
-Topic 230
-SubTopic 10
-Section 45
-Paragraph 15
-Subparagraph (b)
-Publisher FASB
-URI https://asc.fasb.org//1943274/2147482740/230-10-45-15
| Name: |
us-gaap_RepaymentsOfBankDebt |
| Namespace Prefix: |
us-gaap_ |
| Data Type: |
xbrli:monetaryItemType |
| Balance Type: |
credit |
| Period Type: |
duration |
|
| X |
- Details
| Name: |
dei_LegalEntityAxis=SHMY_LuckyStarFAndBSdnBhdMember |
| Namespace Prefix: |
|
| Data Type: |
na |
| Balance Type: |
|
| Period Type: |
|
|
| X |
- Details
| Name: |
us-gaap_LineOfCreditFacilityAxis=SHMY_StandardCharteredSaadiqBerhadMember |
| Namespace Prefix: |
|
| Data Type: |
na |
| Balance Type: |
|
| Period Type: |
|
|
v3.23.2
| X |
- DefinitionLine items represent financial concepts included in a table. These concepts are used to disclose reportable information associated with domain members defined in one or many axes to the table. Reference 1: http://www.xbrl.org/2003/role/disclosureRef
-Topic 954
-SubTopic 310
-Name Accounting Standards Codification
-Section 50
-Paragraph 2
-Publisher FASB
-URI https://asc.fasb.org//1943274/2147481027/954-310-50-2
| Name: |
us-gaap_ConcentrationRiskLineItems |
| Namespace Prefix: |
us-gaap_ |
| Data Type: |
xbrli:stringItemType |
| Balance Type: |
na |
| Period Type: |
duration |
|
| X |
- DefinitionFor an entity that discloses a concentration risk in relation to quantitative amount, which serves as the "benchmark" (or denominator) in the equation, this concept represents the concentration percentage derived from the division. Reference 1: http://www.xbrl.org/2003/role/disclosureRef
-Topic 280
-SubTopic 10
-Name Accounting Standards Codification
-Section 50
-Paragraph 42
-Publisher FASB
-URI https://asc.fasb.org//1943274/2147482810/280-10-50-42
Reference 2: http://fasb.org/us-gaap/role/ref/legacyRef
-Name Accounting Standards Codification
-Topic 825
-SubTopic 10
-Section 50
-Paragraph 21
-Subparagraph (a)
-Publisher FASB
-URI https://asc.fasb.org//1943274/2147482907/825-10-50-21
Reference 3: http://fasb.org/us-gaap/role/ref/legacyRef
-Name Accounting Standards Codification
-Topic 825
-SubTopic 10
-Section 50
-Paragraph 20
-Publisher FASB
-URI https://asc.fasb.org//1943274/2147482907/825-10-50-20
Reference 4: http://fasb.org/us-gaap/role/ref/legacyRef
-Name Accounting Standards Codification
-Topic 275
-SubTopic 10
-Section 50
-Paragraph 18
-Publisher FASB
-URI https://asc.fasb.org//1943274/2147482861/275-10-50-18
Reference 5: http://fasb.org/us-gaap/role/ref/legacyRef
-Name Accounting Standards Codification
-Topic 275
-SubTopic 10
-Section 50
-Paragraph 20
-Publisher FASB
-URI https://asc.fasb.org//1943274/2147482861/275-10-50-20
| Name: |
us-gaap_ConcentrationRiskPercentage1 |
| Namespace Prefix: |
us-gaap_ |
| Data Type: |
dtr-types:percentItemType |
| Balance Type: |
na |
| Period Type: |
duration |
|
| X |
- Details
| Name: |
us-gaap_ConcentrationRiskByBenchmarkAxis=us-gaap_SalesRevenueNetMember |
| Namespace Prefix: |
|
| Data Type: |
na |
| Balance Type: |
|
| Period Type: |
|
|
| X |
- Details
| Name: |
us-gaap_ConcentrationRiskByTypeAxis=us-gaap_CustomerConcentrationRiskMember |
| Namespace Prefix: |
|
| Data Type: |
na |
| Balance Type: |
|
| Period Type: |
|
|
| X |
- Details
| Name: |
srt_MajorCustomersAxis=SHMY_OneCustomerMember |
| Namespace Prefix: |
|
| Data Type: |
na |
| Balance Type: |
|
| Period Type: |
|
|
| X |
- Details
| Name: |
srt_MajorCustomersAxis=SHMY_NoCustomerMember |
| Namespace Prefix: |
|
| Data Type: |
na |
| Balance Type: |
|
| Period Type: |
|
|
| X |
- Details
| Name: |
us-gaap_ConcentrationRiskByTypeAxis=us-gaap_SupplierConcentrationRiskMember |
| Namespace Prefix: |
|
| Data Type: |
na |
| Balance Type: |
|
| Period Type: |
|
|
| X |
- Details
| Name: |
srt_MajorCustomersAxis=SHMY_NoSupplierMember |
| Namespace Prefix: |
|
| Data Type: |
na |
| Balance Type: |
|
| Period Type: |
|
|
v3.23.2
| X |
- Details
| Name: |
srt_StatementGeographicalAxis=country_MH |
| Namespace Prefix: |
|
| Data Type: |
na |
| Balance Type: |
|
| Period Type: |
|
|
| X |
- Details
| Name: |
srt_StatementGeographicalAxis=country_HK |
| Namespace Prefix: |
|
| Data Type: |
na |
| Balance Type: |
|
| Period Type: |
|
|
| X |
- Details
| Name: |
srt_StatementGeographicalAxis=country_MY |
| Namespace Prefix: |
|
| Data Type: |
na |
| Balance Type: |
|
| Period Type: |
|
|
v3.23.2
| X |
- DefinitionAmount of current federal tax expense (benefit) attributable to income (loss) from continuing operations. Includes, but is not limited to, current national tax expense (benefit) for non-US (United States of America) jurisdiction. Reference 1: http://www.xbrl.org/2009/role/commonPracticeRef
-Topic 235
-SubTopic 10
-Name Accounting Standards Codification
-Section S99
-Paragraph 1
-Subparagraph (SX 210.4-08(h)(1)(Note 1))
-Publisher FASB
-URI https://asc.fasb.org//1943274/2147480678/235-10-S99-1
Reference 2: http://www.xbrl.org/2009/role/commonPracticeRef
-Name Accounting Standards Codification
-Section 50
-Paragraph 9
-Subparagraph (a)
-SubTopic 10
-Topic 740
-Publisher FASB
-URI https://asc.fasb.org//1943274/2147482685/740-10-50-9
Reference 3: http://www.xbrl.org/2009/role/commonPracticeRef
-Topic 740
-SubTopic 10
-Name Accounting Standards Codification
-Section S99
-Paragraph 1
-Subparagraph (SAB Topic 6.I.7)
-Publisher FASB
-URI https://asc.fasb.org//1943274/2147479360/740-10-S99-1
| Name: |
us-gaap_CurrentFederalTaxExpenseBenefit |
| Namespace Prefix: |
us-gaap_ |
| Data Type: |
xbrli:monetaryItemType |
| Balance Type: |
debit |
| Period Type: |
duration |
|
| X |
- DefinitionAmount of current foreign income tax expense (benefit) pertaining to income (loss) from continuing operations. Reference 1: http://www.xbrl.org/2009/role/commonPracticeRef
-Topic 235
-SubTopic 10
-Name Accounting Standards Codification
-Section S99
-Paragraph 1
-Subparagraph (SX 210.4-08(h)(1)(Note 1))
-Publisher FASB
-URI https://asc.fasb.org//1943274/2147480678/235-10-S99-1
Reference 2: http://www.xbrl.org/2009/role/commonPracticeRef
-Name Accounting Standards Codification
-Section 50
-Paragraph 9
-Subparagraph (a)
-SubTopic 10
-Topic 740
-Publisher FASB
-URI https://asc.fasb.org//1943274/2147482685/740-10-50-9
| Name: |
us-gaap_CurrentForeignTaxExpenseBenefit |
| Namespace Prefix: |
us-gaap_ |
| Data Type: |
xbrli:monetaryItemType |
| Balance Type: |
debit |
| Period Type: |
duration |
|
| X |
- Details
| Name: |
srt_StatementGeographicalAxis=country_MH |
| Namespace Prefix: |
|
| Data Type: |
na |
| Balance Type: |
|
| Period Type: |
|
|
| X |
- Details
| Name: |
srt_StatementGeographicalAxis=country_MY |
| Namespace Prefix: |
|
| Data Type: |
na |
| Balance Type: |
|
| Period Type: |
|
|
v3.23.2
SCHEDULE OF DEFERRED TAX ASSETS AND LIABILITIES (Details) - USD ($)
|
Jun. 30, 2023 |
Jun. 30, 2022 |
| Deferred tax assets: Net operating loss carryforwards |
$ 383,182
|
$ 373,470
|
| Less: valuation allowance |
(383,182)
|
(373,470)
|
| Deferred tax assets |
|
|
| UNITED STATES |
|
|
| Deferred tax assets: Net operating loss carryforwards |
69,648
|
60,439
|
| MARSHALL ISLANDS |
|
|
| Deferred tax assets: Net operating loss carryforwards |
|
|
| MALAYSIA |
|
|
| Deferred tax assets: Net operating loss carryforwards |
$ 313,534
|
$ 313,031
|
| X |
- DefinitionAmount after allocation of valuation allowances of deferred tax asset attributable to deductible temporary differences and carryforwards. Reference 1: http://www.xbrl.org/2009/role/commonPracticeRef
-Topic 740
-SubTopic 10
-Name Accounting Standards Codification
-Section 50
-Paragraph 2
-Publisher FASB
-URI https://asc.fasb.org//1943274/2147482685/740-10-50-2
| Name: |
us-gaap_DeferredTaxAssetsNet |
| Namespace Prefix: |
us-gaap_ |
| Data Type: |
xbrli:monetaryItemType |
| Balance Type: |
debit |
| Period Type: |
instant |
|
| X |
- DefinitionAmount before allocation of valuation allowances of deferred tax asset attributable to deductible operating loss carryforwards. Reference 1: http://www.xbrl.org/2009/role/commonPracticeRef
-Topic 740
-SubTopic 10
-Name Accounting Standards Codification
-Section 50
-Paragraph 6
-Publisher FASB
-URI https://asc.fasb.org//1943274/2147482685/740-10-50-6
Reference 2: http://fasb.org/us-gaap/role/ref/legacyRef
-Name Accounting Standards Codification
-Topic 740
-SubTopic 10
-Section 50
-Paragraph 8
-Publisher FASB
-URI https://asc.fasb.org//1943274/2147482685/740-10-50-8
| Name: |
us-gaap_DeferredTaxAssetsOperatingLossCarryforwards |
| Namespace Prefix: |
us-gaap_ |
| Data Type: |
xbrli:monetaryItemType |
| Balance Type: |
debit |
| Period Type: |
instant |
|
| X |
- DefinitionAmount of deferred tax assets for which it is more likely than not that a tax benefit will not be realized. Reference 1: http://www.xbrl.org/2003/role/disclosureRef
-Topic 740
-SubTopic 10
-Name Accounting Standards Codification
-Section 50
-Paragraph 2
-Subparagraph (c)
-Publisher FASB
-URI https://asc.fasb.org//1943274/2147482685/740-10-50-2
| Name: |
us-gaap_DeferredTaxAssetsValuationAllowance |
| Namespace Prefix: |
us-gaap_ |
| Data Type: |
xbrli:monetaryItemType |
| Balance Type: |
credit |
| Period Type: |
instant |
|
| X |
- Details
| Name: |
srt_StatementGeographicalAxis=country_US |
| Namespace Prefix: |
|
| Data Type: |
na |
| Balance Type: |
|
| Period Type: |
|
|
| X |
- Details
| Name: |
srt_StatementGeographicalAxis=country_MH |
| Namespace Prefix: |
|
| Data Type: |
na |
| Balance Type: |
|
| Period Type: |
|
|
| X |
- Details
| Name: |
srt_StatementGeographicalAxis=country_MY |
| Namespace Prefix: |
|
| Data Type: |
na |
| Balance Type: |
|
| Period Type: |
|
|
v3.23.2
INCOME TAXES (Details Narrative)
|
3 Months Ended |
|
|
Jun. 30, 2023
USD ($)
|
Jun. 30, 2023
MYR (RM)
|
Jun. 30, 2022
USD ($)
|
| Income tax description |
tax positions must initially be recognized in the
financial statements when it is more likely than not the position will be sustained upon examination by the tax authorities. Such tax
positions must initially and subsequently be measured as the largest amount of tax benefit that has a greater than 50% likelihood of
being realized upon ultimate settlement with the tax authority assuming full knowledge of the position and relevant facts.
|
|
| Deferred tax assets |
$ 383,182
|
|
$ 373,470
|
| Valuation allowance |
383,182
|
|
373,470
|
| Lucky Star F&B Sdn. Bhd [Member] |
|
|
|
| Net operating loss carry forwards |
$ 1,483
|
|
|
| Operating loss carry forwards expiration |
carried forward for seven years
|
carried forward for seven years
|
|
| SH Desserts Sdn Bhd [Member] |
|
|
|
| Net operating loss carry forwards |
$ 1,476
|
|
|
| Lucky Star F&B Sdn. Bhd and SH Desserts Shd. Bhd [Member] |
|
|
|
| Valuation allowance |
383,182
|
|
|
| Increase in valuation allowance |
$ 9,712
|
|
|
| UNITED STATES |
|
|
|
| Income tax description |
The
Tax Act reduces the U.S. statutory corporate tax rate from 35% to 21% for our tax years beginning in 2018
|
The
Tax Act reduces the U.S. statutory corporate tax rate from 35% to 21% for our tax years beginning in 2018
|
|
| Net operating loss carry forwards |
$ 331,658
|
|
|
| Operating loss carry forwards expiration |
expire in 2043
|
expire in 2043
|
|
| Deferred tax assets |
$ 69,648
|
|
60,439
|
| MALAYSIA |
|
|
|
| Income tax description |
Lucky
Star F&B Sdn. Bhd. and SH Desserts Sdn. Bhd. are subject to the Malaysia Corporate Tax Laws at a two-tier corporate income tax rate
based on amount of paid-up capital. The 2023 tax rate for company with paid-up capital of MYR 2,500,000 (approximately $535,573) or less
and that are not part of a group containing a company exceeding this capitalization threshold is 17% on the first MYR 600,000 (approximately
$128,537) taxable profit with the remaining balance being taxed at 24%.
|
|
| Net operating loss carry forwards |
$ 1,844,318
|
|
|
| Deferred tax assets |
313,534
|
|
$ 313,031
|
| Paid up capital tax amount |
$ 535,573
|
RM 2,500,000
|
|
| X |
- DefinitionOperating loss carry forwards expiration.
| Name: |
SHMY_OperatingLossCarryForwardsExpiration |
| Namespace Prefix: |
SHMY_ |
| Data Type: |
xbrli:stringItemType |
| Balance Type: |
na |
| Period Type: |
duration |
|
| X |
- DefinitionPaid up capital tax amount.
| Name: |
SHMY_PaidUpCapitalTaxAmount |
| Namespace Prefix: |
SHMY_ |
| Data Type: |
xbrli:monetaryItemType |
| Balance Type: |
credit |
| Period Type: |
duration |
|
| X |
- DefinitionAmount before allocation of valuation allowances of deferred tax asset attributable to deductible operating loss carryforwards. Reference 1: http://www.xbrl.org/2009/role/commonPracticeRef
-Topic 740
-SubTopic 10
-Name Accounting Standards Codification
-Section 50
-Paragraph 6
-Publisher FASB
-URI https://asc.fasb.org//1943274/2147482685/740-10-50-6
Reference 2: http://fasb.org/us-gaap/role/ref/legacyRef
-Name Accounting Standards Codification
-Topic 740
-SubTopic 10
-Section 50
-Paragraph 8
-Publisher FASB
-URI https://asc.fasb.org//1943274/2147482685/740-10-50-8
| Name: |
us-gaap_DeferredTaxAssetsOperatingLossCarryforwards |
| Namespace Prefix: |
us-gaap_ |
| Data Type: |
xbrli:monetaryItemType |
| Balance Type: |
debit |
| Period Type: |
instant |
|
| X |
- DefinitionAmount of deferred tax assets for which it is more likely than not that a tax benefit will not be realized. Reference 1: http://www.xbrl.org/2003/role/disclosureRef
-Topic 740
-SubTopic 10
-Name Accounting Standards Codification
-Section 50
-Paragraph 2
-Subparagraph (c)
-Publisher FASB
-URI https://asc.fasb.org//1943274/2147482685/740-10-50-2
| Name: |
us-gaap_DeferredTaxAssetsValuationAllowance |
| Namespace Prefix: |
us-gaap_ |
| Data Type: |
xbrli:monetaryItemType |
| Balance Type: |
credit |
| Period Type: |
instant |
|
| X |
- DefinitionAmount of operating loss carryforward, before tax effects, available to reduce future taxable income under enacted tax laws. Reference 1: http://fasb.org/us-gaap/role/ref/legacyRef
-Name Accounting Standards Codification
-Topic 740
-SubTopic 10
-Section 50
-Paragraph 3
-Subparagraph (a)
-Publisher FASB
-URI https://asc.fasb.org//1943274/2147482685/740-10-50-3
| Name: |
us-gaap_OperatingLossCarryforwards |
| Namespace Prefix: |
us-gaap_ |
| Data Type: |
xbrli:monetaryItemType |
| Balance Type: |
debit |
| Period Type: |
instant |
|
| X |
- Details
| Name: |
dei_LegalEntityAxis=SHMY_LuckyStarFAndBSdnBhdMember |
| Namespace Prefix: |
|
| Data Type: |
na |
| Balance Type: |
|
| Period Type: |
|
|
| X |
- Details
| Name: |
dei_LegalEntityAxis=SHMY_SHDessertsSdnBhdMember |
| Namespace Prefix: |
|
| Data Type: |
na |
| Balance Type: |
|
| Period Type: |
|
|
| X |
- Details
| Name: |
dei_LegalEntityAxis=SHMY_LuckyStarFAndBSdnBhdSHDessertsShdBhdMember |
| Namespace Prefix: |
|
| Data Type: |
na |
| Balance Type: |
|
| Period Type: |
|
|
| X |
- Details
| Name: |
srt_StatementGeographicalAxis=country_US |
| Namespace Prefix: |
|
| Data Type: |
na |
| Balance Type: |
|
| Period Type: |
|
|
| X |
- Details
| Name: |
srt_StatementGeographicalAxis=country_MY |
| Namespace Prefix: |
|
| Data Type: |
na |
| Balance Type: |
|
| Period Type: |
|
|
v3.23.2
STOCKHOLDERS’ EQUITY (Details Narrative) - USD ($)
|
Dec. 30, 2020 |
Jan. 21, 2019 |
Oct. 17, 2018 |
Jun. 30, 2023 |
Mar. 31, 2023 |
Mar. 31, 2022 |
Mar. 31, 2021 |
| Subsidiary or Equity Method Investee [Line Items] |
|
|
|
|
|
|
|
| Common stock, shares issued |
|
|
|
1,000,000
|
1,000,000
|
|
1,000,000
|
| Common stock, shares outstanding |
|
|
|
1,000,000
|
1,000,000
|
|
1,000,000
|
| Common stock, shares authorized |
|
|
|
5,000,000
|
5,000,000
|
5,000,000
|
450,000,000
|
| Common stock, par value |
|
|
|
$ 0.0001
|
$ 0.0001
|
|
$ 0.0001
|
| Preferred stock, shares authorized |
|
|
|
500,000
|
500,000
|
500,000
|
50,000,000
|
| Preferred stock, par value |
|
|
|
$ 0.0001
|
$ 0.0001
|
|
$ 0.0001
|
| Preferred stock, shares issued |
|
|
|
0
|
0
|
|
0
|
| Preferred stock, shares outstanding |
|
|
|
0
|
0
|
|
0
|
| Offering [Member] |
|
|
|
|
|
|
|
| Subsidiary or Equity Method Investee [Line Items] |
|
|
|
|
|
|
|
| Share price |
$ 5.00
|
|
|
|
|
|
|
| Number of sale of stock |
100,000
|
|
|
|
|
|
|
| Sale of stock value |
$ 500,000
|
|
|
|
|
|
|
| Lucky Star F&B Sdn. Bhd [Member] | CBA Capital Holdings Sdn. Bhd [Member] |
|
|
|
|
|
|
|
| Subsidiary or Equity Method Investee [Line Items] |
|
|
|
|
|
|
|
| Interest-free loan waived |
|
$ 257,183
|
|
|
|
|
|
| Mr. Leong Will Liam [Member] |
|
|
|
|
|
|
|
| Subsidiary or Equity Method Investee [Line Items] |
|
|
|
|
|
|
|
| Number of restricted common stock shares purchased |
|
|
900,000
|
|
|
|
|
| Share price |
|
|
$ 0.03
|
|
|
|
|
| Par value of restricted shares |
|
|
$ 0.0001
|
|
|
|
|
| X |
- DefinitionPar value of restricted shares.
| Name: |
SHMY_RestrictedCommonStockParValue |
| Namespace Prefix: |
SHMY_ |
| Data Type: |
dtr-types:perShareItemType |
| Balance Type: |
na |
| Period Type: |
instant |
|
| X |
- DefinitionFace amount or stated value per share of common stock. Reference 1: http://fasb.org/us-gaap/role/ref/legacyRef
-Topic 210
-SubTopic 10
-Name Accounting Standards Codification
-Section S99
-Paragraph 1
-Subparagraph (SX 210.5-02(29))
-Publisher FASB
-URI https://asc.fasb.org//1943274/2147480566/210-10-S99-1
| Name: |
us-gaap_CommonStockParOrStatedValuePerShare |
| Namespace Prefix: |
us-gaap_ |
| Data Type: |
dtr-types:perShareItemType |
| Balance Type: |
na |
| Period Type: |
instant |
|
| X |
- DefinitionThe maximum number of common shares permitted to be issued by an entity's charter and bylaws. Reference 1: http://www.xbrl.org/2003/role/disclosureRef
-Topic 946
-SubTopic 210
-Name Accounting Standards Codification
-Section S99
-Paragraph 1
-Subparagraph (SX 210.6-04(16)(a))
-Publisher FASB
-URI https://asc.fasb.org//1943274/2147479617/946-210-S99-1
Reference 2: http://fasb.org/us-gaap/role/ref/legacyRef
-Topic 210
-SubTopic 10
-Name Accounting Standards Codification
-Section S99
-Paragraph 1
-Subparagraph (SX 210.5-02(29))
-Publisher FASB
-URI https://asc.fasb.org//1943274/2147480566/210-10-S99-1
| Name: |
us-gaap_CommonStockSharesAuthorized |
| Namespace Prefix: |
us-gaap_ |
| Data Type: |
xbrli:sharesItemType |
| Balance Type: |
na |
| Period Type: |
instant |
|
| X |
- DefinitionTotal number of common shares of an entity that have been sold or granted to shareholders (includes common shares that were issued, repurchased and remain in the treasury). These shares represent capital invested by the firm's shareholders and owners, and may be all or only a portion of the number of shares authorized. Shares issued include shares outstanding and shares held in the treasury. Reference 1: http://fasb.org/us-gaap/role/ref/legacyRef
-Topic 210
-SubTopic 10
-Name Accounting Standards Codification
-Section S99
-Paragraph 1
-Subparagraph (SX 210.5-02(29))
-Publisher FASB
-URI https://asc.fasb.org//1943274/2147480566/210-10-S99-1
| Name: |
us-gaap_CommonStockSharesIssued |
| Namespace Prefix: |
us-gaap_ |
| Data Type: |
xbrli:sharesItemType |
| Balance Type: |
na |
| Period Type: |
instant |
|
| X |
- DefinitionNumber of shares of common stock outstanding. Common stock represent the ownership interest in a corporation. Reference 1: http://fasb.org/us-gaap/role/ref/legacyRef
-Name Accounting Standards Codification
-Section 50
-Paragraph 2
-SubTopic 10
-Topic 505
-Publisher FASB
-URI https://asc.fasb.org//1943274/2147481112/505-10-50-2
Reference 2: http://www.xbrl.org/2003/role/disclosureRef
-Topic 946
-SubTopic 210
-Name Accounting Standards Codification
-Section S99
-Paragraph 2
-Subparagraph (SX 210.6-05(4))
-Publisher FASB
-URI https://asc.fasb.org//1943274/2147479617/946-210-S99-2
Reference 3: http://www.xbrl.org/2009/role/commonPracticeRef
-Topic 946
-SubTopic 220
-Name Accounting Standards Codification
-Section S99
-Paragraph 3
-Subparagraph (SX 210.6-09(4)(b))
-Publisher FASB
-URI https://asc.fasb.org//1943274/2147483575/946-220-S99-3
Reference 4: http://www.xbrl.org/2003/role/disclosureRef
-Topic 946
-SubTopic 210
-Name Accounting Standards Codification
-Section S99
-Paragraph 1
-Subparagraph (SX 210.6-04(16)(a))
-Publisher FASB
-URI https://asc.fasb.org//1943274/2147479617/946-210-S99-1
Reference 5: http://www.xbrl.org/2009/role/commonPracticeRef
-Topic 946
-SubTopic 220
-Name Accounting Standards Codification
-Section S99
-Paragraph 3
-Subparagraph (SX 210.6-09(7))
-Publisher FASB
-URI https://asc.fasb.org//1943274/2147483575/946-220-S99-3
Reference 6: http://fasb.org/us-gaap/role/ref/legacyRef
-Topic 210
-SubTopic 10
-Name Accounting Standards Codification
-Section S99
-Paragraph 1
-Subparagraph (SX 210.5-02(29))
-Publisher FASB
-URI https://asc.fasb.org//1943274/2147480566/210-10-S99-1
| Name: |
us-gaap_CommonStockSharesOutstanding |
| Namespace Prefix: |
us-gaap_ |
| Data Type: |
xbrli:sharesItemType |
| Balance Type: |
na |
| Period Type: |
instant |
|
| X |
- DefinitionFace amount or stated value per share of preferred stock nonredeemable or redeemable solely at the option of the issuer. Reference 1: http://www.xbrl.org/2003/role/disclosureRef
-Topic 505
-SubTopic 10
-Name Accounting Standards Codification
-Section 50
-Paragraph 13
-Subparagraph (a)
-Publisher FASB
-URI https://asc.fasb.org//1943274/2147481112/505-10-50-13
Reference 2: http://fasb.org/us-gaap/role/ref/legacyRef
-Topic 210
-SubTopic 10
-Name Accounting Standards Codification
-Section S99
-Paragraph 1
-Subparagraph (SX 210.5-02(28))
-Publisher FASB
-URI https://asc.fasb.org//1943274/2147480566/210-10-S99-1
| Name: |
us-gaap_PreferredStockParOrStatedValuePerShare |
| Namespace Prefix: |
us-gaap_ |
| Data Type: |
dtr-types:perShareItemType |
| Balance Type: |
na |
| Period Type: |
instant |
|
| X |
- DefinitionThe maximum number of nonredeemable preferred shares (or preferred stock redeemable solely at the option of the issuer) permitted to be issued by an entity's charter and bylaws. Reference 1: http://www.xbrl.org/2003/role/disclosureRef
-Topic 946
-SubTopic 210
-Name Accounting Standards Codification
-Section S99
-Paragraph 1
-Subparagraph (SX 210.6-04(16)(a))
-Publisher FASB
-URI https://asc.fasb.org//1943274/2147479617/946-210-S99-1
Reference 2: http://fasb.org/us-gaap/role/ref/legacyRef
-Topic 210
-SubTopic 10
-Name Accounting Standards Codification
-Section S99
-Paragraph 1
-Subparagraph (SX 210.5-02(28))
-Publisher FASB
-URI https://asc.fasb.org//1943274/2147480566/210-10-S99-1
| Name: |
us-gaap_PreferredStockSharesAuthorized |
| Namespace Prefix: |
us-gaap_ |
| Data Type: |
xbrli:sharesItemType |
| Balance Type: |
na |
| Period Type: |
instant |
|
| X |
- DefinitionTotal number of nonredeemable preferred shares (or preferred stock redeemable solely at the option of the issuer) issued to shareholders (includes related preferred shares that were issued, repurchased, and remain in the treasury). May be all or portion of the number of preferred shares authorized. Excludes preferred shares that are classified as debt. Reference 1: http://www.xbrl.org/2003/role/disclosureRef
-Topic 505
-SubTopic 10
-Name Accounting Standards Codification
-Section 50
-Paragraph 13
-Subparagraph (a)
-Publisher FASB
-URI https://asc.fasb.org//1943274/2147481112/505-10-50-13
Reference 2: http://fasb.org/us-gaap/role/ref/legacyRef
-Topic 210
-SubTopic 10
-Name Accounting Standards Codification
-Section S99
-Paragraph 1
-Subparagraph (SX 210.5-02(28))
-Publisher FASB
-URI https://asc.fasb.org//1943274/2147480566/210-10-S99-1
| Name: |
us-gaap_PreferredStockSharesIssued |
| Namespace Prefix: |
us-gaap_ |
| Data Type: |
xbrli:sharesItemType |
| Balance Type: |
na |
| Period Type: |
instant |
|
| X |
- DefinitionAggregate share number for all nonredeemable preferred stock (or preferred stock redeemable solely at the option of the issuer) held by stockholders. Does not include preferred shares that have been repurchased. Reference 1: http://www.xbrl.org/2003/role/disclosureRef
-Topic 946
-SubTopic 210
-Name Accounting Standards Codification
-Section S99
-Paragraph 2
-Subparagraph (SX 210.6-05(4))
-Publisher FASB
-URI https://asc.fasb.org//1943274/2147479617/946-210-S99-2
Reference 2: http://www.xbrl.org/2009/role/commonPracticeRef
-Topic 946
-SubTopic 220
-Name Accounting Standards Codification
-Section S99
-Paragraph 3
-Subparagraph (SX 210.6-09(4)(b))
-Publisher FASB
-URI https://asc.fasb.org//1943274/2147483575/946-220-S99-3
Reference 3: http://www.xbrl.org/2003/role/disclosureRef
-Topic 946
-SubTopic 210
-Name Accounting Standards Codification
-Section S99
-Paragraph 1
-Subparagraph (SX 210.6-04(16)(a))
-Publisher FASB
-URI https://asc.fasb.org//1943274/2147479617/946-210-S99-1
Reference 4: http://www.xbrl.org/2009/role/commonPracticeRef
-Topic 946
-SubTopic 220
-Name Accounting Standards Codification
-Section S99
-Paragraph 3
-Subparagraph (SX 210.6-09(7))
-Publisher FASB
-URI https://asc.fasb.org//1943274/2147483575/946-220-S99-3
Reference 5: http://fasb.org/us-gaap/role/ref/legacyRef
-Topic 210
-SubTopic 10
-Name Accounting Standards Codification
-Section S99
-Paragraph 1
-Subparagraph (SX 210.5-02(28))
-Publisher FASB
-URI https://asc.fasb.org//1943274/2147480566/210-10-S99-1
| Name: |
us-gaap_PreferredStockSharesOutstanding |
| Namespace Prefix: |
us-gaap_ |
| Data Type: |
xbrli:sharesItemType |
| Balance Type: |
na |
| Period Type: |
instant |
|
| X |
- DefinitionCash received from principal payments made on loans related to operating activities. Reference 1: http://fasb.org/us-gaap/role/ref/legacyRef
-Name Accounting Standards Codification
-Topic 230
-SubTopic 10
-Section 45
-Paragraph 25
-Subparagraph (c)
-Publisher FASB
-URI https://asc.fasb.org//1943274/2147482740/230-10-45-25
| Name: |
us-gaap_ProceedsFromLoans |
| Namespace Prefix: |
us-gaap_ |
| Data Type: |
xbrli:monetaryItemType |
| Balance Type: |
debit |
| Period Type: |
duration |
|
| X |
- DefinitionCash received on stock transaction after deduction of issuance costs.
| Name: |
us-gaap_SaleOfStockConsiderationReceivedOnTransaction |
| Namespace Prefix: |
us-gaap_ |
| Data Type: |
xbrli:monetaryItemType |
| Balance Type: |
debit |
| Period Type: |
duration |
|
| X |
- DefinitionThe number of shares issued or sold by the subsidiary or equity method investee per stock transaction.
| Name: |
us-gaap_SaleOfStockNumberOfSharesIssuedInTransaction |
| Namespace Prefix: |
us-gaap_ |
| Data Type: |
xbrli:sharesItemType |
| Balance Type: |
na |
| Period Type: |
duration |
|
| X |
- DefinitionPer share or per unit amount of equity securities issued.
| Name: |
us-gaap_SharesIssuedPricePerShare |
| Namespace Prefix: |
us-gaap_ |
| Data Type: |
dtr-types:perShareItemType |
| Balance Type: |
na |
| Period Type: |
instant |
|
| X |
- DefinitionTotal number of shares issued during the period, including shares forfeited, as a result of Restricted Stock Awards. Reference 1: http://fasb.org/us-gaap/role/ref/legacyRef
-Name Accounting Standards Codification
-Section 50
-Paragraph 2
-SubTopic 10
-Topic 505
-Publisher FASB
-URI https://asc.fasb.org//1943274/2147481112/505-10-50-2
Reference 2: http://fasb.org/us-gaap/role/ref/legacyRef
-Topic 505
-SubTopic 10
-Name Accounting Standards Codification
-Section S99
-Paragraph 1
-Subparagraph (SX 210.3-04)
-Publisher FASB
-URI https://asc.fasb.org//1943274/2147480008/505-10-S99-1
| Name: |
us-gaap_StockIssuedDuringPeriodSharesRestrictedStockAwardGross |
| Namespace Prefix: |
us-gaap_ |
| Data Type: |
xbrli:sharesItemType |
| Balance Type: |
na |
| Period Type: |
duration |
|
| X |
- DefinitionLine items represent financial concepts included in a table. These concepts are used to disclose reportable information associated with domain members defined in one or many axes to the table.
| Name: |
us-gaap_SubsidiaryOrEquityMethodInvesteeLineItems |
| Namespace Prefix: |
us-gaap_ |
| Data Type: |
xbrli:stringItemType |
| Balance Type: |
na |
| Period Type: |
duration |
|
| X |
- Details
| Name: |
us-gaap_SubsidiarySaleOfStockAxis=SHMY_OfferingMember |
| Namespace Prefix: |
|
| Data Type: |
na |
| Balance Type: |
|
| Period Type: |
|
|
| X |
- Details
| Name: |
srt_ConsolidatedEntitiesAxis=SHMY_LuckyStarFAndBSdnBhdMember |
| Namespace Prefix: |
|
| Data Type: |
na |
| Balance Type: |
|
| Period Type: |
|
|
| X |
- Details
| Name: |
srt_TitleOfIndividualAxis=SHMY_LeongWillLiamMember |
| Namespace Prefix: |
|
| Data Type: |
na |
| Balance Type: |
|
| Period Type: |
|
|
v3.23.2
SCHEDULE OF SEGMENT REPORTING INFORMATION BY BUSINESS UNIT (Details) - USD ($)
|
3 Months Ended |
|
Jun. 30, 2023 |
Jun. 30, 2022 |
Mar. 31, 2023 |
| Segment Reporting Information [Line Items] |
|
|
|
| Revenue |
$ 7,859
|
$ 44,909
|
|
| Cost of revenue |
|
(20,963)
|
|
| General and administrative expenses |
(54,549)
|
(167,029)
|
|
| Loss from operations |
(46,690)
|
(143,083)
|
|
| Total assets |
74,730
|
604,353
|
$ 92,932
|
| Capital expenditure |
|
10,209
|
|
| Assets Leasing Business [Member] |
|
|
|
| Segment Reporting Information [Line Items] |
|
|
|
| Revenue |
7,859
|
|
|
| Cost of revenue |
|
|
|
| General and administrative expenses |
(54,549)
|
|
|
| Loss from operations |
(46,690)
|
|
|
| Total assets |
74,730
|
|
|
| Capital expenditure |
|
|
|
| Food and Beverage Business [Member] |
|
|
|
| Segment Reporting Information [Line Items] |
|
|
|
| Revenue |
|
44,909
|
|
| Cost of revenue |
|
(20,963)
|
|
| General and administrative expenses |
|
(167,029)
|
|
| Loss from operations |
|
(143,083)
|
|
| Total assets |
|
604,353
|
|
| Capital expenditure |
|
$ 10,209
|
|
| X |
- DefinitionSum of the carrying amounts as of the balance sheet date of all assets that are recognized. Assets are probable future economic benefits obtained or controlled by an entity as a result of past transactions or events. Reference 1: http://www.xbrl.org/2003/role/disclosureRef
-Topic 810
-SubTopic 10
-Name Accounting Standards Codification
-Section 50
-Paragraph 3
-Subparagraph (bb)
-Publisher FASB
-URI https://asc.fasb.org//1943274/2147481203/810-10-50-3
Reference 2: http://www.xbrl.org/2003/role/disclosureRef
-Topic 810
-SubTopic 10
-Name Accounting Standards Codification
-Section 45
-Paragraph 25
-Subparagraph (a)
-Publisher FASB
-URI https://asc.fasb.org//1943274/2147481231/810-10-45-25
Reference 3: http://www.xbrl.org/2003/role/disclosureRef
-Topic 235
-SubTopic 10
-Name Accounting Standards Codification
-Section S99
-Paragraph 1
-Subparagraph (SX 210.4-08(g)(1)(ii))
-Publisher FASB
-URI https://asc.fasb.org//1943274/2147480678/235-10-S99-1
Reference 4: http://www.xbrl.org/2003/role/disclosureRef
-Topic 323
-SubTopic 10
-Name Accounting Standards Codification
-Section 50
-Paragraph 3
-Subparagraph (c)
-Publisher FASB
-URI https://asc.fasb.org//1943274/2147481687/323-10-50-3
Reference 5: http://www.xbrl.org/2003/role/disclosureRef
-Topic 825
-SubTopic 10
-Name Accounting Standards Codification
-Section 50
-Paragraph 28
-Subparagraph (f)
-Publisher FASB
-URI https://asc.fasb.org//1943274/2147482907/825-10-50-28
Reference 6: http://www.xbrl.org/2003/role/exampleRef
-Topic 852
-SubTopic 10
-Name Accounting Standards Codification
-Section 55
-Paragraph 10
-Publisher FASB
-URI https://asc.fasb.org//1943274/2147481372/852-10-55-10
Reference 7: http://www.xbrl.org/2003/role/exampleRef
-Topic 946
-SubTopic 830
-Name Accounting Standards Codification
-Section 55
-Paragraph 12
-Publisher FASB
-URI https://asc.fasb.org//1943274/2147480167/946-830-55-12
Reference 8: http://www.xbrl.org/2003/role/disclosureRef
-Topic 944
-SubTopic 210
-Name Accounting Standards Codification
-Section S99
-Paragraph 1
-Subparagraph (SX 210.7-03(a)(12))
-Publisher FASB
-URI https://asc.fasb.org//1943274/2147479440/944-210-S99-1
Reference 9: http://www.xbrl.org/2003/role/disclosureRef
-Topic 280
-SubTopic 10
-Name Accounting Standards Codification
-Section 50
-Paragraph 22
-Publisher FASB
-URI https://asc.fasb.org//1943274/2147482810/280-10-50-22
Reference 10: http://www.xbrl.org/2003/role/disclosureRef
-Topic 946
-SubTopic 210
-Name Accounting Standards Codification
-Section S99
-Paragraph 1
-Subparagraph (SX 210.6-04(8))
-Publisher FASB
-URI https://asc.fasb.org//1943274/2147479617/946-210-S99-1
Reference 11: http://www.xbrl.org/2003/role/disclosureRef
-Topic 210
-SubTopic 10
-Name Accounting Standards Codification
-Section S99
-Paragraph 1
-Subparagraph (SX 210.5-02(18))
-Publisher FASB
-URI https://asc.fasb.org//1943274/2147480566/210-10-S99-1
Reference 12: http://www.xbrl.org/2003/role/disclosureRef
-Topic 470
-SubTopic 10
-Name Accounting Standards Codification
-Section S99
-Paragraph 1A
-Subparagraph (SX 210.13-01(a)(4)(i))
-Publisher FASB
-URI https://asc.fasb.org//1943274/2147480097/470-10-S99-1A
Reference 13: http://www.xbrl.org/2009/role/commonPracticeRef
-Topic 470
-SubTopic 10
-Name Accounting Standards Codification
-Section S99
-Paragraph 1A
-Subparagraph (SX 210.13-01(a)(4)(ii))
-Publisher FASB
-URI https://asc.fasb.org//1943274/2147480097/470-10-S99-1A
Reference 14: http://www.xbrl.org/2009/role/commonPracticeRef
-Topic 470
-SubTopic 10
-Name Accounting Standards Codification
-Section S99
-Paragraph 1A
-Subparagraph (SX 210.13-01(a)(4)(iii))
-Publisher FASB
-URI https://asc.fasb.org//1943274/2147480097/470-10-S99-1A
Reference 15: http://www.xbrl.org/2003/role/disclosureRef
-Topic 470
-SubTopic 10
-Name Accounting Standards Codification
-Section S99
-Paragraph 1A
-Subparagraph (SX 210.13-01(a)(4)(iii)(A))
-Publisher FASB
-URI https://asc.fasb.org//1943274/2147480097/470-10-S99-1A
Reference 16: http://www.xbrl.org/2003/role/disclosureRef
-Topic 470
-SubTopic 10
-Name Accounting Standards Codification
-Section S99
-Paragraph 1A
-Subparagraph (SX 210.13-01(a)(4)(iv))
-Publisher FASB
-URI https://asc.fasb.org//1943274/2147480097/470-10-S99-1A
Reference 17: http://www.xbrl.org/2003/role/disclosureRef
-Topic 470
-SubTopic 10
-Name Accounting Standards Codification
-Section S99
-Paragraph 1A
-Subparagraph (SX 210.13-01(a)(5))
-Publisher FASB
-URI https://asc.fasb.org//1943274/2147480097/470-10-S99-1A
Reference 18: http://www.xbrl.org/2003/role/disclosureRef
-Topic 470
-SubTopic 10
-Name Accounting Standards Codification
-Section S99
-Paragraph 1B
-Subparagraph (SX 210.13-02(a)(4)(i))
-Publisher FASB
-URI https://asc.fasb.org//1943274/2147480097/470-10-S99-1B
Reference 19: http://www.xbrl.org/2003/role/disclosureRef
-Topic 470
-SubTopic 10
-Name Accounting Standards Codification
-Section S99
-Paragraph 1B
-Subparagraph (SX 210.13-02(a)(4)(iii)(A))
-Publisher FASB
-URI https://asc.fasb.org//1943274/2147480097/470-10-S99-1B
Reference 20: http://www.xbrl.org/2003/role/disclosureRef
-Topic 470
-SubTopic 10
-Name Accounting Standards Codification
-Section S99
-Paragraph 1B
-Subparagraph (SX 210.13-02(a)(4)(iii)(B))
-Publisher FASB
-URI https://asc.fasb.org//1943274/2147480097/470-10-S99-1B
Reference 21: http://www.xbrl.org/2003/role/disclosureRef
-Topic 470
-SubTopic 10
-Name Accounting Standards Codification
-Section S99
-Paragraph 1B
-Subparagraph (SX 210.13-02(a)(4)(iv))
-Publisher FASB
-URI https://asc.fasb.org//1943274/2147480097/470-10-S99-1B
Reference 22: http://www.xbrl.org/2003/role/disclosureRef
-Topic 470
-SubTopic 10
-Name Accounting Standards Codification
-Section S99
-Paragraph 1B
-Subparagraph (SX 210.13-02(a)(5))
-Publisher FASB
-URI https://asc.fasb.org//1943274/2147480097/470-10-S99-1B
Reference 23: http://www.xbrl.org/2009/role/commonPracticeRef
-Topic 852
-SubTopic 10
-Name Accounting Standards Codification
-Section 50
-Paragraph 7
-Subparagraph (a)
-Publisher FASB
-URI https://asc.fasb.org//1943274/2147481404/852-10-50-7
Reference 24: http://www.xbrl.org/2003/role/disclosureRef
-Topic 280
-SubTopic 10
-Name Accounting Standards Codification
-Section 50
-Paragraph 30
-Subparagraph (c)
-Publisher FASB
-URI https://asc.fasb.org//1943274/2147482810/280-10-50-30
Reference 25: http://www.xbrl.org/2003/role/disclosureRef
-Topic 280
-SubTopic 10
-Name Accounting Standards Codification
-Section 50
-Paragraph 32
-Subparagraph (d)
-Publisher FASB
-URI https://asc.fasb.org//1943274/2147482810/280-10-50-32
Reference 26: http://fasb.org/us-gaap/role/ref/legacyRef
-Topic 942
-SubTopic 210
-Name Accounting Standards Codification
-Section S99
-Paragraph 1
-Subparagraph (SX 210.9-03(11))
-Publisher FASB
-URI https://asc.fasb.org//1943274/2147479853/942-210-S99-1
| Name: |
us-gaap_Assets |
| Namespace Prefix: |
us-gaap_ |
| Data Type: |
xbrli:monetaryItemType |
| Balance Type: |
debit |
| Period Type: |
instant |
|
| X |
- DefinitionThe aggregate cost of goods produced and sold and services rendered during the reporting period. Reference 1: http://www.xbrl.org/2003/role/disclosureRef
-Topic 235
-SubTopic 10
-Name Accounting Standards Codification
-Section S99
-Paragraph 1
-Subparagraph (SX 210.4-08(g)(1)(ii))
-Publisher FASB
-URI https://asc.fasb.org//1943274/2147480678/235-10-S99-1
Reference 2: http://www.xbrl.org/2003/role/disclosureRef
-Topic 323
-SubTopic 10
-Name Accounting Standards Codification
-Section 50
-Paragraph 3
-Subparagraph (c)
-Publisher FASB
-URI https://asc.fasb.org//1943274/2147481687/323-10-50-3
Reference 3: http://www.xbrl.org/2003/role/disclosureRef
-Topic 825
-SubTopic 10
-Name Accounting Standards Codification
-Section 50
-Paragraph 28
-Subparagraph (f)
-Publisher FASB
-URI https://asc.fasb.org//1943274/2147482907/825-10-50-28
Reference 4: http://www.xbrl.org/2003/role/disclosureRef
-Topic 470
-SubTopic 10
-Name Accounting Standards Codification
-Section S99
-Paragraph 1A
-Subparagraph (SX 210.13-01(a)(4)(i))
-Publisher FASB
-URI https://asc.fasb.org//1943274/2147480097/470-10-S99-1A
Reference 5: http://www.xbrl.org/2009/role/commonPracticeRef
-Topic 470
-SubTopic 10
-Name Accounting Standards Codification
-Section S99
-Paragraph 1A
-Subparagraph (SX 210.13-01(a)(4)(ii))
-Publisher FASB
-URI https://asc.fasb.org//1943274/2147480097/470-10-S99-1A
Reference 6: http://www.xbrl.org/2003/role/disclosureRef
-Topic 470
-SubTopic 10
-Name Accounting Standards Codification
-Section S99
-Paragraph 1A
-Subparagraph (SX 210.13-01(a)(4)(iii)(A))
-Publisher FASB
-URI https://asc.fasb.org//1943274/2147480097/470-10-S99-1A
Reference 7: http://www.xbrl.org/2003/role/disclosureRef
-Topic 470
-SubTopic 10
-Name Accounting Standards Codification
-Section S99
-Paragraph 1A
-Subparagraph (SX 210.13-01(a)(4)(iv))
-Publisher FASB
-URI https://asc.fasb.org//1943274/2147480097/470-10-S99-1A
Reference 8: http://www.xbrl.org/2003/role/disclosureRef
-Topic 470
-SubTopic 10
-Name Accounting Standards Codification
-Section S99
-Paragraph 1A
-Subparagraph (SX 210.13-01(a)(5))
-Publisher FASB
-URI https://asc.fasb.org//1943274/2147480097/470-10-S99-1A
Reference 9: http://www.xbrl.org/2003/role/disclosureRef
-Topic 470
-SubTopic 10
-Name Accounting Standards Codification
-Section S99
-Paragraph 1B
-Subparagraph (SX 210.13-02(a)(4)(i))
-Publisher FASB
-URI https://asc.fasb.org//1943274/2147480097/470-10-S99-1B
Reference 10: http://www.xbrl.org/2003/role/disclosureRef
-Topic 470
-SubTopic 10
-Name Accounting Standards Codification
-Section S99
-Paragraph 1B
-Subparagraph (SX 210.13-02(a)(4)(iii)(A))
-Publisher FASB
-URI https://asc.fasb.org//1943274/2147480097/470-10-S99-1B
Reference 11: http://www.xbrl.org/2003/role/disclosureRef
-Topic 470
-SubTopic 10
-Name Accounting Standards Codification
-Section S99
-Paragraph 1B
-Subparagraph (SX 210.13-02(a)(4)(iii)(B))
-Publisher FASB
-URI https://asc.fasb.org//1943274/2147480097/470-10-S99-1B
Reference 12: http://www.xbrl.org/2003/role/disclosureRef
-Topic 470
-SubTopic 10
-Name Accounting Standards Codification
-Section S99
-Paragraph 1B
-Subparagraph (SX 210.13-02(a)(4)(iv))
-Publisher FASB
-URI https://asc.fasb.org//1943274/2147480097/470-10-S99-1B
Reference 13: http://www.xbrl.org/2003/role/disclosureRef
-Topic 470
-SubTopic 10
-Name Accounting Standards Codification
-Section S99
-Paragraph 1B
-Subparagraph (SX 210.13-02(a)(5))
-Publisher FASB
-URI https://asc.fasb.org//1943274/2147480097/470-10-S99-1B
Reference 14: http://fasb.org/us-gaap/role/ref/legacyRef
-Topic 220
-SubTopic 10
-Name Accounting Standards Codification
-Section S99
-Paragraph 2
-Subparagraph (SX 210.5-03.2)
-Publisher FASB
-URI https://asc.fasb.org//1943274/2147483621/220-10-S99-2
| Name: |
us-gaap_CostOfRevenue |
| Namespace Prefix: |
us-gaap_ |
| Data Type: |
xbrli:monetaryItemType |
| Balance Type: |
debit |
| Period Type: |
duration |
|
| X |
- DefinitionThe aggregate total of expenses of managing and administering the affairs of an entity, including affiliates of the reporting entity, which are not directly or indirectly associated with the manufacture, sale or creation of a product or product line. Reference 1: http://www.xbrl.org/2003/role/disclosureRef
-Topic 946
-SubTopic 220
-Name Accounting Standards Codification
-Section S99
-Paragraph 1
-Subparagraph (SX 210.6-07(2)(a))
-Publisher FASB
-URI https://asc.fasb.org//1943274/2147483575/946-220-S99-1
Reference 2: http://fasb.org/us-gaap/role/ref/legacyRef
-Topic 220
-SubTopic 10
-Name Accounting Standards Codification
-Section S99
-Paragraph 2
-Subparagraph (SX 210.5-03.4)
-Publisher FASB
-URI https://asc.fasb.org//1943274/2147483621/220-10-S99-2
| Name: |
us-gaap_GeneralAndAdministrativeExpense |
| Namespace Prefix: |
us-gaap_ |
| Data Type: |
xbrli:monetaryItemType |
| Balance Type: |
debit |
| Period Type: |
duration |
|
| X |
- DefinitionThe net result for the period of deducting operating expenses from operating revenues. Reference 1: http://www.xbrl.org/2003/role/disclosureRef
-Topic 280
-SubTopic 10
-Name Accounting Standards Codification
-Section 50
-Paragraph 22
-Publisher FASB
-URI https://asc.fasb.org//1943274/2147482810/280-10-50-22
Reference 2: http://www.xbrl.org/2003/role/disclosureRef
-Topic 280
-SubTopic 10
-Name Accounting Standards Codification
-Section 50
-Paragraph 30
-Subparagraph (b)
-Publisher FASB
-URI https://asc.fasb.org//1943274/2147482810/280-10-50-30
Reference 3: http://www.xbrl.org/2003/role/disclosureRef
-Topic 280
-SubTopic 10
-Name Accounting Standards Codification
-Section 50
-Paragraph 32
-Subparagraph (f)
-Publisher FASB
-URI https://asc.fasb.org//1943274/2147482810/280-10-50-32
Reference 4: http://www.xbrl.org/2003/role/exampleRef
-Topic 280
-SubTopic 10
-Name Accounting Standards Codification
-Section 50
-Paragraph 31
-Publisher FASB
-URI https://asc.fasb.org//1943274/2147482810/280-10-50-31
Reference 5: http://www.xbrl.org/2003/role/disclosureRef
-Topic 280
-SubTopic 10
-Name Accounting Standards Codification
-Section 50
-Paragraph 32
-Subparagraph (c)
-Publisher FASB
-URI https://asc.fasb.org//1943274/2147482810/280-10-50-32
| Name: |
us-gaap_OperatingIncomeLoss |
| Namespace Prefix: |
us-gaap_ |
| Data Type: |
xbrli:monetaryItemType |
| Balance Type: |
credit |
| Period Type: |
duration |
|
| X |
- DefinitionThe cash outflow associated with the acquisition of long-lived, physical assets that are used in the normal conduct of business to produce goods and services and not intended for resale; includes cash outflows to pay for construction of self-constructed assets. Reference 1: http://fasb.org/us-gaap/role/ref/legacyRef
-Topic 230
-SubTopic 10
-Name Accounting Standards Codification
-Section 45
-Paragraph 13
-Subparagraph (c)
-Publisher FASB
-URI https://asc.fasb.org//1943274/2147482740/230-10-45-13
| Name: |
us-gaap_PaymentsToAcquirePropertyPlantAndEquipment |
| Namespace Prefix: |
us-gaap_ |
| Data Type: |
xbrli:monetaryItemType |
| Balance Type: |
credit |
| Period Type: |
duration |
|
| X |
- DefinitionAmount, excluding tax collected from customer, of revenue from satisfaction of performance obligation by transferring promised good or service to customer. Tax collected from customer is tax assessed by governmental authority that is both imposed on and concurrent with specific revenue-producing transaction, including, but not limited to, sales, use, value added and excise. Reference 1: http://www.xbrl.org/2003/role/disclosureRef
-Topic 924
-SubTopic 10
-Name Accounting Standards Codification
-Section S99
-Paragraph 1
-Subparagraph (SAB Topic 11.L)
-Publisher FASB
-URI https://asc.fasb.org//1943274/2147479941/924-10-S99-1
Reference 2: http://www.xbrl.org/2003/role/disclosureRef
-Topic 606
-SubTopic 10
-Name Accounting Standards Codification
-Section 50
-Paragraph 5
-Publisher FASB
-URI https://asc.fasb.org//1943274/2147479806/606-10-50-5
Reference 3: http://www.xbrl.org/2003/role/disclosureRef
-Topic 280
-SubTopic 10
-Name Accounting Standards Codification
-Section 50
-Paragraph 30
-Subparagraph (a)
-Publisher FASB
-URI https://asc.fasb.org//1943274/2147482810/280-10-50-30
Reference 4: http://www.xbrl.org/2003/role/disclosureRef
-Topic 280
-SubTopic 10
-Name Accounting Standards Codification
-Section 50
-Paragraph 42
-Publisher FASB
-URI https://asc.fasb.org//1943274/2147482810/280-10-50-42
Reference 5: http://www.xbrl.org/2003/role/disclosureRef
-Topic 280
-SubTopic 10
-Name Accounting Standards Codification
-Section 50
-Paragraph 22
-Subparagraph (b)
-Publisher FASB
-URI https://asc.fasb.org//1943274/2147482810/280-10-50-22
Reference 6: http://www.xbrl.org/2003/role/disclosureRef
-Topic 280
-SubTopic 10
-Name Accounting Standards Codification
-Section 50
-Paragraph 32
-Subparagraph (b)
-Publisher FASB
-URI https://asc.fasb.org//1943274/2147482810/280-10-50-32
Reference 7: http://www.xbrl.org/2003/role/disclosureRef
-Topic 280
-SubTopic 10
-Name Accounting Standards Codification
-Section 50
-Paragraph 40
-Publisher FASB
-URI https://asc.fasb.org//1943274/2147482810/280-10-50-40
Reference 8: http://www.xbrl.org/2003/role/disclosureRef
-Topic 280
-SubTopic 10
-Name Accounting Standards Codification
-Section 50
-Paragraph 22
-Subparagraph (a)
-Publisher FASB
-URI https://asc.fasb.org//1943274/2147482810/280-10-50-22
Reference 9: http://www.xbrl.org/2003/role/disclosureRef
-Topic 280
-SubTopic 10
-Name Accounting Standards Codification
-Section 50
-Paragraph 32
-Subparagraph (a)
-Publisher FASB
-URI https://asc.fasb.org//1943274/2147482810/280-10-50-32
Reference 10: http://www.xbrl.org/2003/role/disclosureRef
-Topic 280
-SubTopic 10
-Name Accounting Standards Codification
-Section 50
-Paragraph 41
-Subparagraph (a)
-Publisher FASB
-URI https://asc.fasb.org//1943274/2147482810/280-10-50-41
Reference 11: http://www.xbrl.org/2003/role/disclosureRef
-Topic 606
-SubTopic 10
-Name Accounting Standards Codification
-Section 50
-Paragraph 4
-Subparagraph (a)
-Publisher FASB
-URI https://asc.fasb.org//1943274/2147479806/606-10-50-4
| Name: |
us-gaap_RevenueFromContractWithCustomerExcludingAssessedTax |
| Namespace Prefix: |
us-gaap_ |
| Data Type: |
xbrli:monetaryItemType |
| Balance Type: |
credit |
| Period Type: |
duration |
|
| X |
- Details
| Name: |
us-gaap_StatementBusinessSegmentsAxis=SHMY_AssetsLeasingBusinessMember |
| Namespace Prefix: |
|
| Data Type: |
na |
| Balance Type: |
|
| Period Type: |
|
|
| X |
- Details
| Name: |
us-gaap_StatementBusinessSegmentsAxis=SHMY_FoodAndBeverageBusinessMember |
| Namespace Prefix: |
|
| Data Type: |
na |
| Balance Type: |
|
| Period Type: |
|
|
v3.23.2
SCHEDULE OF SEGMENT REPORTING INFORMATION BY COUNTRY (Details) - USD ($)
|
3 Months Ended |
|
Jun. 30, 2023 |
Jun. 30, 2022 |
Mar. 31, 2023 |
| Revenues from External Customers and Long-Lived Assets [Line Items] |
|
|
|
| Revenue |
$ 7,859
|
$ 44,909
|
|
| Cost of revenue |
|
(20,963)
|
|
| General and administrative expenses |
(54,549)
|
(167,029)
|
|
| Loss from operations |
(46,690)
|
(143,083)
|
|
| Total assets |
74,730
|
604,353
|
$ 92,932
|
| Capital expenditure |
|
10,209
|
|
| UNITED STATES |
|
|
|
| Revenues from External Customers and Long-Lived Assets [Line Items] |
|
|
|
| Revenue |
|
|
|
| Cost of revenue |
|
|
|
| General and administrative expenses |
(43,854)
|
|
|
| Loss from operations |
(43,854)
|
|
|
| Total assets |
8,834
|
7,310
|
|
| Capital expenditure |
|
|
|
| MARSHALL ISLANDS |
|
|
|
| Revenues from External Customers and Long-Lived Assets [Line Items] |
|
|
|
| Revenue |
|
|
|
| Cost of revenue |
|
|
|
| General and administrative expenses |
|
|
|
| Loss from operations |
|
|
|
| Total assets |
|
|
|
| Capital expenditure |
|
|
|
| MALAYSIA |
|
|
|
| Revenues from External Customers and Long-Lived Assets [Line Items] |
|
|
|
| Revenue |
7,859
|
44,909
|
|
| Cost of revenue |
|
(20,963)
|
|
| General and administrative expenses |
(10,695)
|
(167,029)
|
|
| Loss from operations |
(2,836)
|
(143,083)
|
|
| Total assets |
65,896
|
597,043
|
|
| Capital expenditure |
|
$ 10,209
|
|
| X |
- DefinitionSum of the carrying amounts as of the balance sheet date of all assets that are recognized. Assets are probable future economic benefits obtained or controlled by an entity as a result of past transactions or events. Reference 1: http://www.xbrl.org/2003/role/disclosureRef
-Topic 810
-SubTopic 10
-Name Accounting Standards Codification
-Section 50
-Paragraph 3
-Subparagraph (bb)
-Publisher FASB
-URI https://asc.fasb.org//1943274/2147481203/810-10-50-3
Reference 2: http://www.xbrl.org/2003/role/disclosureRef
-Topic 810
-SubTopic 10
-Name Accounting Standards Codification
-Section 45
-Paragraph 25
-Subparagraph (a)
-Publisher FASB
-URI https://asc.fasb.org//1943274/2147481231/810-10-45-25
Reference 3: http://www.xbrl.org/2003/role/disclosureRef
-Topic 235
-SubTopic 10
-Name Accounting Standards Codification
-Section S99
-Paragraph 1
-Subparagraph (SX 210.4-08(g)(1)(ii))
-Publisher FASB
-URI https://asc.fasb.org//1943274/2147480678/235-10-S99-1
Reference 4: http://www.xbrl.org/2003/role/disclosureRef
-Topic 323
-SubTopic 10
-Name Accounting Standards Codification
-Section 50
-Paragraph 3
-Subparagraph (c)
-Publisher FASB
-URI https://asc.fasb.org//1943274/2147481687/323-10-50-3
Reference 5: http://www.xbrl.org/2003/role/disclosureRef
-Topic 825
-SubTopic 10
-Name Accounting Standards Codification
-Section 50
-Paragraph 28
-Subparagraph (f)
-Publisher FASB
-URI https://asc.fasb.org//1943274/2147482907/825-10-50-28
Reference 6: http://www.xbrl.org/2003/role/exampleRef
-Topic 852
-SubTopic 10
-Name Accounting Standards Codification
-Section 55
-Paragraph 10
-Publisher FASB
-URI https://asc.fasb.org//1943274/2147481372/852-10-55-10
Reference 7: http://www.xbrl.org/2003/role/exampleRef
-Topic 946
-SubTopic 830
-Name Accounting Standards Codification
-Section 55
-Paragraph 12
-Publisher FASB
-URI https://asc.fasb.org//1943274/2147480167/946-830-55-12
Reference 8: http://www.xbrl.org/2003/role/disclosureRef
-Topic 944
-SubTopic 210
-Name Accounting Standards Codification
-Section S99
-Paragraph 1
-Subparagraph (SX 210.7-03(a)(12))
-Publisher FASB
-URI https://asc.fasb.org//1943274/2147479440/944-210-S99-1
Reference 9: http://www.xbrl.org/2003/role/disclosureRef
-Topic 280
-SubTopic 10
-Name Accounting Standards Codification
-Section 50
-Paragraph 22
-Publisher FASB
-URI https://asc.fasb.org//1943274/2147482810/280-10-50-22
Reference 10: http://www.xbrl.org/2003/role/disclosureRef
-Topic 946
-SubTopic 210
-Name Accounting Standards Codification
-Section S99
-Paragraph 1
-Subparagraph (SX 210.6-04(8))
-Publisher FASB
-URI https://asc.fasb.org//1943274/2147479617/946-210-S99-1
Reference 11: http://www.xbrl.org/2003/role/disclosureRef
-Topic 210
-SubTopic 10
-Name Accounting Standards Codification
-Section S99
-Paragraph 1
-Subparagraph (SX 210.5-02(18))
-Publisher FASB
-URI https://asc.fasb.org//1943274/2147480566/210-10-S99-1
Reference 12: http://www.xbrl.org/2003/role/disclosureRef
-Topic 470
-SubTopic 10
-Name Accounting Standards Codification
-Section S99
-Paragraph 1A
-Subparagraph (SX 210.13-01(a)(4)(i))
-Publisher FASB
-URI https://asc.fasb.org//1943274/2147480097/470-10-S99-1A
Reference 13: http://www.xbrl.org/2009/role/commonPracticeRef
-Topic 470
-SubTopic 10
-Name Accounting Standards Codification
-Section S99
-Paragraph 1A
-Subparagraph (SX 210.13-01(a)(4)(ii))
-Publisher FASB
-URI https://asc.fasb.org//1943274/2147480097/470-10-S99-1A
Reference 14: http://www.xbrl.org/2009/role/commonPracticeRef
-Topic 470
-SubTopic 10
-Name Accounting Standards Codification
-Section S99
-Paragraph 1A
-Subparagraph (SX 210.13-01(a)(4)(iii))
-Publisher FASB
-URI https://asc.fasb.org//1943274/2147480097/470-10-S99-1A
Reference 15: http://www.xbrl.org/2003/role/disclosureRef
-Topic 470
-SubTopic 10
-Name Accounting Standards Codification
-Section S99
-Paragraph 1A
-Subparagraph (SX 210.13-01(a)(4)(iii)(A))
-Publisher FASB
-URI https://asc.fasb.org//1943274/2147480097/470-10-S99-1A
Reference 16: http://www.xbrl.org/2003/role/disclosureRef
-Topic 470
-SubTopic 10
-Name Accounting Standards Codification
-Section S99
-Paragraph 1A
-Subparagraph (SX 210.13-01(a)(4)(iv))
-Publisher FASB
-URI https://asc.fasb.org//1943274/2147480097/470-10-S99-1A
Reference 17: http://www.xbrl.org/2003/role/disclosureRef
-Topic 470
-SubTopic 10
-Name Accounting Standards Codification
-Section S99
-Paragraph 1A
-Subparagraph (SX 210.13-01(a)(5))
-Publisher FASB
-URI https://asc.fasb.org//1943274/2147480097/470-10-S99-1A
Reference 18: http://www.xbrl.org/2003/role/disclosureRef
-Topic 470
-SubTopic 10
-Name Accounting Standards Codification
-Section S99
-Paragraph 1B
-Subparagraph (SX 210.13-02(a)(4)(i))
-Publisher FASB
-URI https://asc.fasb.org//1943274/2147480097/470-10-S99-1B
Reference 19: http://www.xbrl.org/2003/role/disclosureRef
-Topic 470
-SubTopic 10
-Name Accounting Standards Codification
-Section S99
-Paragraph 1B
-Subparagraph (SX 210.13-02(a)(4)(iii)(A))
-Publisher FASB
-URI https://asc.fasb.org//1943274/2147480097/470-10-S99-1B
Reference 20: http://www.xbrl.org/2003/role/disclosureRef
-Topic 470
-SubTopic 10
-Name Accounting Standards Codification
-Section S99
-Paragraph 1B
-Subparagraph (SX 210.13-02(a)(4)(iii)(B))
-Publisher FASB
-URI https://asc.fasb.org//1943274/2147480097/470-10-S99-1B
Reference 21: http://www.xbrl.org/2003/role/disclosureRef
-Topic 470
-SubTopic 10
-Name Accounting Standards Codification
-Section S99
-Paragraph 1B
-Subparagraph (SX 210.13-02(a)(4)(iv))
-Publisher FASB
-URI https://asc.fasb.org//1943274/2147480097/470-10-S99-1B
Reference 22: http://www.xbrl.org/2003/role/disclosureRef
-Topic 470
-SubTopic 10
-Name Accounting Standards Codification
-Section S99
-Paragraph 1B
-Subparagraph (SX 210.13-02(a)(5))
-Publisher FASB
-URI https://asc.fasb.org//1943274/2147480097/470-10-S99-1B
Reference 23: http://www.xbrl.org/2009/role/commonPracticeRef
-Topic 852
-SubTopic 10
-Name Accounting Standards Codification
-Section 50
-Paragraph 7
-Subparagraph (a)
-Publisher FASB
-URI https://asc.fasb.org//1943274/2147481404/852-10-50-7
Reference 24: http://www.xbrl.org/2003/role/disclosureRef
-Topic 280
-SubTopic 10
-Name Accounting Standards Codification
-Section 50
-Paragraph 30
-Subparagraph (c)
-Publisher FASB
-URI https://asc.fasb.org//1943274/2147482810/280-10-50-30
Reference 25: http://www.xbrl.org/2003/role/disclosureRef
-Topic 280
-SubTopic 10
-Name Accounting Standards Codification
-Section 50
-Paragraph 32
-Subparagraph (d)
-Publisher FASB
-URI https://asc.fasb.org//1943274/2147482810/280-10-50-32
Reference 26: http://fasb.org/us-gaap/role/ref/legacyRef
-Topic 942
-SubTopic 210
-Name Accounting Standards Codification
-Section S99
-Paragraph 1
-Subparagraph (SX 210.9-03(11))
-Publisher FASB
-URI https://asc.fasb.org//1943274/2147479853/942-210-S99-1
| Name: |
us-gaap_Assets |
| Namespace Prefix: |
us-gaap_ |
| Data Type: |
xbrli:monetaryItemType |
| Balance Type: |
debit |
| Period Type: |
instant |
|
| X |
- DefinitionThe aggregate cost of goods produced and sold and services rendered during the reporting period. Reference 1: http://www.xbrl.org/2003/role/disclosureRef
-Topic 235
-SubTopic 10
-Name Accounting Standards Codification
-Section S99
-Paragraph 1
-Subparagraph (SX 210.4-08(g)(1)(ii))
-Publisher FASB
-URI https://asc.fasb.org//1943274/2147480678/235-10-S99-1
Reference 2: http://www.xbrl.org/2003/role/disclosureRef
-Topic 323
-SubTopic 10
-Name Accounting Standards Codification
-Section 50
-Paragraph 3
-Subparagraph (c)
-Publisher FASB
-URI https://asc.fasb.org//1943274/2147481687/323-10-50-3
Reference 3: http://www.xbrl.org/2003/role/disclosureRef
-Topic 825
-SubTopic 10
-Name Accounting Standards Codification
-Section 50
-Paragraph 28
-Subparagraph (f)
-Publisher FASB
-URI https://asc.fasb.org//1943274/2147482907/825-10-50-28
Reference 4: http://www.xbrl.org/2003/role/disclosureRef
-Topic 470
-SubTopic 10
-Name Accounting Standards Codification
-Section S99
-Paragraph 1A
-Subparagraph (SX 210.13-01(a)(4)(i))
-Publisher FASB
-URI https://asc.fasb.org//1943274/2147480097/470-10-S99-1A
Reference 5: http://www.xbrl.org/2009/role/commonPracticeRef
-Topic 470
-SubTopic 10
-Name Accounting Standards Codification
-Section S99
-Paragraph 1A
-Subparagraph (SX 210.13-01(a)(4)(ii))
-Publisher FASB
-URI https://asc.fasb.org//1943274/2147480097/470-10-S99-1A
Reference 6: http://www.xbrl.org/2003/role/disclosureRef
-Topic 470
-SubTopic 10
-Name Accounting Standards Codification
-Section S99
-Paragraph 1A
-Subparagraph (SX 210.13-01(a)(4)(iii)(A))
-Publisher FASB
-URI https://asc.fasb.org//1943274/2147480097/470-10-S99-1A
Reference 7: http://www.xbrl.org/2003/role/disclosureRef
-Topic 470
-SubTopic 10
-Name Accounting Standards Codification
-Section S99
-Paragraph 1A
-Subparagraph (SX 210.13-01(a)(4)(iv))
-Publisher FASB
-URI https://asc.fasb.org//1943274/2147480097/470-10-S99-1A
Reference 8: http://www.xbrl.org/2003/role/disclosureRef
-Topic 470
-SubTopic 10
-Name Accounting Standards Codification
-Section S99
-Paragraph 1A
-Subparagraph (SX 210.13-01(a)(5))
-Publisher FASB
-URI https://asc.fasb.org//1943274/2147480097/470-10-S99-1A
Reference 9: http://www.xbrl.org/2003/role/disclosureRef
-Topic 470
-SubTopic 10
-Name Accounting Standards Codification
-Section S99
-Paragraph 1B
-Subparagraph (SX 210.13-02(a)(4)(i))
-Publisher FASB
-URI https://asc.fasb.org//1943274/2147480097/470-10-S99-1B
Reference 10: http://www.xbrl.org/2003/role/disclosureRef
-Topic 470
-SubTopic 10
-Name Accounting Standards Codification
-Section S99
-Paragraph 1B
-Subparagraph (SX 210.13-02(a)(4)(iii)(A))
-Publisher FASB
-URI https://asc.fasb.org//1943274/2147480097/470-10-S99-1B
Reference 11: http://www.xbrl.org/2003/role/disclosureRef
-Topic 470
-SubTopic 10
-Name Accounting Standards Codification
-Section S99
-Paragraph 1B
-Subparagraph (SX 210.13-02(a)(4)(iii)(B))
-Publisher FASB
-URI https://asc.fasb.org//1943274/2147480097/470-10-S99-1B
Reference 12: http://www.xbrl.org/2003/role/disclosureRef
-Topic 470
-SubTopic 10
-Name Accounting Standards Codification
-Section S99
-Paragraph 1B
-Subparagraph (SX 210.13-02(a)(4)(iv))
-Publisher FASB
-URI https://asc.fasb.org//1943274/2147480097/470-10-S99-1B
Reference 13: http://www.xbrl.org/2003/role/disclosureRef
-Topic 470
-SubTopic 10
-Name Accounting Standards Codification
-Section S99
-Paragraph 1B
-Subparagraph (SX 210.13-02(a)(5))
-Publisher FASB
-URI https://asc.fasb.org//1943274/2147480097/470-10-S99-1B
Reference 14: http://fasb.org/us-gaap/role/ref/legacyRef
-Topic 220
-SubTopic 10
-Name Accounting Standards Codification
-Section S99
-Paragraph 2
-Subparagraph (SX 210.5-03.2)
-Publisher FASB
-URI https://asc.fasb.org//1943274/2147483621/220-10-S99-2
| Name: |
us-gaap_CostOfRevenue |
| Namespace Prefix: |
us-gaap_ |
| Data Type: |
xbrli:monetaryItemType |
| Balance Type: |
debit |
| Period Type: |
duration |
|
| X |
- DefinitionThe aggregate total of expenses of managing and administering the affairs of an entity, including affiliates of the reporting entity, which are not directly or indirectly associated with the manufacture, sale or creation of a product or product line. Reference 1: http://www.xbrl.org/2003/role/disclosureRef
-Topic 946
-SubTopic 220
-Name Accounting Standards Codification
-Section S99
-Paragraph 1
-Subparagraph (SX 210.6-07(2)(a))
-Publisher FASB
-URI https://asc.fasb.org//1943274/2147483575/946-220-S99-1
Reference 2: http://fasb.org/us-gaap/role/ref/legacyRef
-Topic 220
-SubTopic 10
-Name Accounting Standards Codification
-Section S99
-Paragraph 2
-Subparagraph (SX 210.5-03.4)
-Publisher FASB
-URI https://asc.fasb.org//1943274/2147483621/220-10-S99-2
| Name: |
us-gaap_GeneralAndAdministrativeExpense |
| Namespace Prefix: |
us-gaap_ |
| Data Type: |
xbrli:monetaryItemType |
| Balance Type: |
debit |
| Period Type: |
duration |
|
| X |
- DefinitionThe net result for the period of deducting operating expenses from operating revenues. Reference 1: http://www.xbrl.org/2003/role/disclosureRef
-Topic 280
-SubTopic 10
-Name Accounting Standards Codification
-Section 50
-Paragraph 22
-Publisher FASB
-URI https://asc.fasb.org//1943274/2147482810/280-10-50-22
Reference 2: http://www.xbrl.org/2003/role/disclosureRef
-Topic 280
-SubTopic 10
-Name Accounting Standards Codification
-Section 50
-Paragraph 30
-Subparagraph (b)
-Publisher FASB
-URI https://asc.fasb.org//1943274/2147482810/280-10-50-30
Reference 3: http://www.xbrl.org/2003/role/disclosureRef
-Topic 280
-SubTopic 10
-Name Accounting Standards Codification
-Section 50
-Paragraph 32
-Subparagraph (f)
-Publisher FASB
-URI https://asc.fasb.org//1943274/2147482810/280-10-50-32
Reference 4: http://www.xbrl.org/2003/role/exampleRef
-Topic 280
-SubTopic 10
-Name Accounting Standards Codification
-Section 50
-Paragraph 31
-Publisher FASB
-URI https://asc.fasb.org//1943274/2147482810/280-10-50-31
Reference 5: http://www.xbrl.org/2003/role/disclosureRef
-Topic 280
-SubTopic 10
-Name Accounting Standards Codification
-Section 50
-Paragraph 32
-Subparagraph (c)
-Publisher FASB
-URI https://asc.fasb.org//1943274/2147482810/280-10-50-32
| Name: |
us-gaap_OperatingIncomeLoss |
| Namespace Prefix: |
us-gaap_ |
| Data Type: |
xbrli:monetaryItemType |
| Balance Type: |
credit |
| Period Type: |
duration |
|
| X |
- DefinitionThe cash outflow associated with the acquisition of long-lived, physical assets that are used in the normal conduct of business to produce goods and services and not intended for resale; includes cash outflows to pay for construction of self-constructed assets. Reference 1: http://fasb.org/us-gaap/role/ref/legacyRef
-Topic 230
-SubTopic 10
-Name Accounting Standards Codification
-Section 45
-Paragraph 13
-Subparagraph (c)
-Publisher FASB
-URI https://asc.fasb.org//1943274/2147482740/230-10-45-13
| Name: |
us-gaap_PaymentsToAcquirePropertyPlantAndEquipment |
| Namespace Prefix: |
us-gaap_ |
| Data Type: |
xbrli:monetaryItemType |
| Balance Type: |
credit |
| Period Type: |
duration |
|
| X |
- DefinitionAmount, excluding tax collected from customer, of revenue from satisfaction of performance obligation by transferring promised good or service to customer. Tax collected from customer is tax assessed by governmental authority that is both imposed on and concurrent with specific revenue-producing transaction, including, but not limited to, sales, use, value added and excise. Reference 1: http://www.xbrl.org/2003/role/disclosureRef
-Topic 924
-SubTopic 10
-Name Accounting Standards Codification
-Section S99
-Paragraph 1
-Subparagraph (SAB Topic 11.L)
-Publisher FASB
-URI https://asc.fasb.org//1943274/2147479941/924-10-S99-1
Reference 2: http://www.xbrl.org/2003/role/disclosureRef
-Topic 606
-SubTopic 10
-Name Accounting Standards Codification
-Section 50
-Paragraph 5
-Publisher FASB
-URI https://asc.fasb.org//1943274/2147479806/606-10-50-5
Reference 3: http://www.xbrl.org/2003/role/disclosureRef
-Topic 280
-SubTopic 10
-Name Accounting Standards Codification
-Section 50
-Paragraph 30
-Subparagraph (a)
-Publisher FASB
-URI https://asc.fasb.org//1943274/2147482810/280-10-50-30
Reference 4: http://www.xbrl.org/2003/role/disclosureRef
-Topic 280
-SubTopic 10
-Name Accounting Standards Codification
-Section 50
-Paragraph 42
-Publisher FASB
-URI https://asc.fasb.org//1943274/2147482810/280-10-50-42
Reference 5: http://www.xbrl.org/2003/role/disclosureRef
-Topic 280
-SubTopic 10
-Name Accounting Standards Codification
-Section 50
-Paragraph 22
-Subparagraph (b)
-Publisher FASB
-URI https://asc.fasb.org//1943274/2147482810/280-10-50-22
Reference 6: http://www.xbrl.org/2003/role/disclosureRef
-Topic 280
-SubTopic 10
-Name Accounting Standards Codification
-Section 50
-Paragraph 32
-Subparagraph (b)
-Publisher FASB
-URI https://asc.fasb.org//1943274/2147482810/280-10-50-32
Reference 7: http://www.xbrl.org/2003/role/disclosureRef
-Topic 280
-SubTopic 10
-Name Accounting Standards Codification
-Section 50
-Paragraph 40
-Publisher FASB
-URI https://asc.fasb.org//1943274/2147482810/280-10-50-40
Reference 8: http://www.xbrl.org/2003/role/disclosureRef
-Topic 280
-SubTopic 10
-Name Accounting Standards Codification
-Section 50
-Paragraph 22
-Subparagraph (a)
-Publisher FASB
-URI https://asc.fasb.org//1943274/2147482810/280-10-50-22
Reference 9: http://www.xbrl.org/2003/role/disclosureRef
-Topic 280
-SubTopic 10
-Name Accounting Standards Codification
-Section 50
-Paragraph 32
-Subparagraph (a)
-Publisher FASB
-URI https://asc.fasb.org//1943274/2147482810/280-10-50-32
Reference 10: http://www.xbrl.org/2003/role/disclosureRef
-Topic 280
-SubTopic 10
-Name Accounting Standards Codification
-Section 50
-Paragraph 41
-Subparagraph (a)
-Publisher FASB
-URI https://asc.fasb.org//1943274/2147482810/280-10-50-41
Reference 11: http://www.xbrl.org/2003/role/disclosureRef
-Topic 606
-SubTopic 10
-Name Accounting Standards Codification
-Section 50
-Paragraph 4
-Subparagraph (a)
-Publisher FASB
-URI https://asc.fasb.org//1943274/2147479806/606-10-50-4
| Name: |
us-gaap_RevenueFromContractWithCustomerExcludingAssessedTax |
| Namespace Prefix: |
us-gaap_ |
| Data Type: |
xbrli:monetaryItemType |
| Balance Type: |
credit |
| Period Type: |
duration |
|
| X |
- DefinitionLine items represent financial concepts included in a table. These concepts are used to disclose reportable information associated with domain members defined in one or many axes to the table.
| Name: |
us-gaap_RevenuesFromExternalCustomersAndLongLivedAssetsLineItems |
| Namespace Prefix: |
us-gaap_ |
| Data Type: |
xbrli:stringItemType |
| Balance Type: |
na |
| Period Type: |
duration |
|
| X |
- Details
| Name: |
srt_StatementGeographicalAxis=country_US |
| Namespace Prefix: |
|
| Data Type: |
na |
| Balance Type: |
|
| Period Type: |
|
|
| X |
- Details
| Name: |
srt_StatementGeographicalAxis=country_MH |
| Namespace Prefix: |
|
| Data Type: |
na |
| Balance Type: |
|
| Period Type: |
|
|
| X |
- Details
| Name: |
srt_StatementGeographicalAxis=country_MY |
| Namespace Prefix: |
|
| Data Type: |
na |
| Balance Type: |
|
| Period Type: |
|
|
Synergy Empire (QB) (USOTC:SHMY)
Historical Stock Chart
From May 2024 to Jun 2024
 Charts.")
Synergy Empire (QB) (USOTC:SHMY)
Historical Stock Chart
From Jun 2023 to Jun 2024
 Charts.")