| 4Q 2023 SUPPLEMENTAL REPORT FINANCIAL I 25
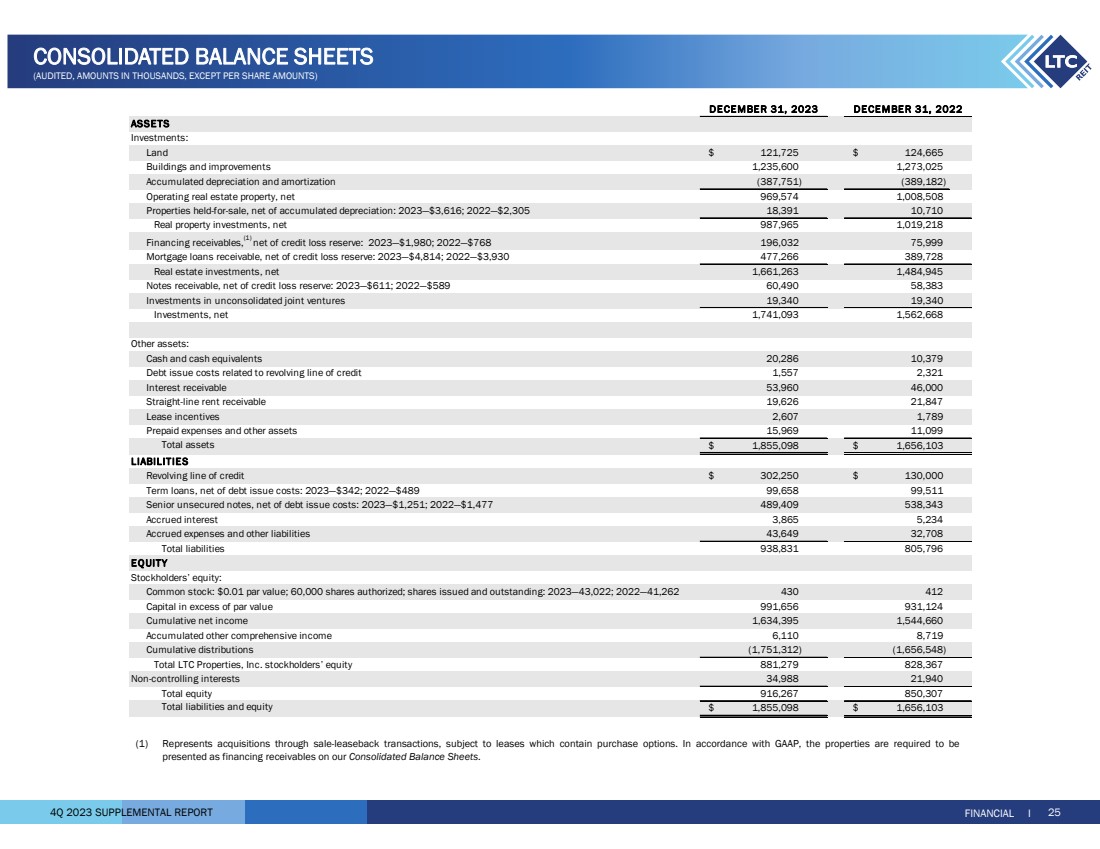
CONSOLIDATED BALANCE SHEETS
(AUDITED, AMOUNTS IN THOUSANDS, EXCEPT PER SHARE AMOUNTS)
ASSETS
Investments:
Land $ 121,725 $ 124,665
Buildings and improvements 1,235,600 1,273,025
Accumulated depreciation and amortization (387,751) (389,182)
Operating real estate property, net 1,008,508 969,574
Properties held-for-sale, net of accumulated depreciation: 2023—$3,616; 2022—$2,305 18,391 10,710
Real property investments, net 987,965 1,019,218
Financing receivables,(1) net of credit loss reserve: 2023—$1,980; 2022—$768 196,032 75,999
Mortgage loans receivable, net of credit loss reserve: 2023—$4,814; 2022—$3,930 477,266 389,728
Real estate investments, net 1,661,263 1,484,945
Notes receivable, net of credit loss reserve: 2023—$611; 2022—$589 60,490 58,383
Investments in unconsolidated joint ventures 19,340 19,340
Investments, net 1,741,093 1,562,668
Other assets:
Cash and cash equivalents 20,286 10,379
Debt issue costs related to revolving line of credit 1,557 2,321
Interest receivable 53,960 46,000
Straight-line rent receivable 19,626 21,847
Lease incentives 1,789 2,607
Prepaid expenses and other assets 15,969 11,099
Total assets $ 1,855,098 $ 1,656,103
LIABILITIES
Revolving line of credit $ 302,250 $ 130,000
Term loans, net of debt issue costs: 2023—$342; 2022—$489 99,511 99,658
Senior unsecured notes, net of debt issue costs: 2023—$1,251; 2022—$1,477 489,409 538,343
Accrued interest 3,865 5,234
Accrued expenses and other liabilities 43,649 32,708
Total liabilities 938,831 805,796
EQUITY
Stockholders’ equity:
Common stock: $0.01 par value; 60,000 shares authorized; shares issued and outstanding: 2023—43,022; 2022—41,262 430 412
Capital in excess of par value 991,656 931,124
Cumulative net income 1,634,395 1,544,660
Accumulated other comprehensive income 8,719 6,110
Cumulative distributions (1,751,312) (1,656,548)
Total LTC Properties, Inc. stockholders’ equity 881,279 828,367
Non-controlling interests 34,988 21,940
Total equity 916,267 850,307
Total liabilities and equity $ 1,855,098 $ 1,656,103
DECEMBER 31, 2023 DECEMBER 31, 2022
(1) Represents acquisitions through sale-leaseback transactions, subject to leases which contain purchase options. In accordance with GAAP, the properties are required to be
presented as financing receivables on our Consolidated Balance Sheets. |