SECURITIES AND EXCHANGE COMMISSION
WASHINGTON,
DC 20549
FORM 6-K
REPORT OF FOREIGN PRIVATE ISSUER
PURSUANT TO RULE 13a-16 OR 15d-16 UNDER
THE SECURITIES EXCHANGE ACT OF 1934
For the month of February 2024
FOMENTO ECONÓMICO
MEXICANO, S.A.B. DE C.V.
(Exact name of Registrant as specified in its charter)
Mexican Economic Development, Inc.
(Translation of Registrant’s name into English)
United Mexican States
(Jurisdiction of incorporation or organization)
General Anaya No. 601 Pte.
Colonia Bella Vista
Monterrey, Nuevo León 64410
México
(Address of principal executive offices)
Indicate by check mark whether the registrant
files or will file annual reports under cover of Form 20-F or Form 40-F:
Form 20-F x
Form 40-F ¨
Indicate by check mark if the registrant is submitting
the Form 6-K in paper as permitted by Regulation S-T Rule 101(b)(1): ¨
Indicate by check mark if the registrant is submitting
the Form 6-K in paper as permitted by Regulation S-T Rule 101(b)(7): ¨
Indicate by check mark whether by furnishing
the information contained in this Form, the registrant is also thereby furnishing the information to the Commission pursuant to
Rule 12g3-2(b) under the Securities Exchange Act of 1934.
Yes ¨
No x
If "Yes" is marked, indicate below the
file number assigned to the registrant in connection with Rule 12g3-2(b): 82-_____________
SIGNATURES
Pursuant to the requirements of the
Securities Exchange Act of 1934, the registrant has duly caused this report to be signed on its behalf of the undersigned, thereunto
duly authorized.
| |
FOMENTO ECONÓMICO MEXICANO, S.A. DE C.V. |
| |
|
| |
By: |
/s/ Eugenio
Garza y Garza |
| |
|
Eugenio Garza y Garza |
| |
|
Director of Finance and Corporate
Development |
Date: February, 23, 2024
Exhibit 99.1

4Q and Full Year 2023
Results
February 23, 2024

Investor Contact
(52) 818-328-6167
investor@femsa.com.mx
femsa.gcs-web.com
Media Contact
(52) 555-249-6843
comunicacion@femsa.com.mx
femsa.com

February 23, 2024 | Page 1
HIGHLIGHTS
Monterrey, Mexico,
February 23, 2024 — Fomento Económico Mexicano, S.A.B. de C.V. (“FEMSA”) (NYSE: FMX; BMV: FEMSAUBD,
FEMSAUB) announced today its operational and financial results for the fourth quarter and full year of 2023.
| • | FEMSA:
Total Consolidated Revenues grew 4.6% against 4Q22. |
| • | FEMSA
Retail1: Proximity Americas total Revenues increased 14.2% against 4Q22. |
| • | DIGITAL:
Spin by OXXO had 6.9 million active users2 while Spin Premia had 19.3
million active loyalty users2 and an average tender3 of 31.0%. |
| • | COCA-COLA
FEMSA: Total volume and revenues grew 6.1% and 8.1%, respectively, against 4Q22. |
Financial Summary
for the Fourth Quarter and Full Year 2023
Change
vs. comparable period
| | |
Total Revenues | | |
Gross Profit | | |
Income from Operations | | |
Same-Store Sales | |
| | |
4Q23 | | |
YTD23 | | |
4Q23 | | |
YTD23 | | |
4Q23 | | |
YTD23 | | |
4Q23 | | |
YTD23 | |
| FEMSA Consolidated | |
| 4.6 | % | |
| 17.7 | % | |
| 8.5 | % | |
| 15.7 | % | |
| (1.4 | %) | |
| (6.4 | %) | |
| | | |
| | |
| Proximity Americas | |
| 14.2 | % | |
| 19.0 | % | |
| 17.2 | % | |
| 20.0 | % | |
| 1.0 | % | |
| 11.7 | % | |
| 8.5 | % | |
| 14.2 | % |
| Health | |
| 2.6 | % | |
| 0.7 | % | |
| (1.2 | %) | |
| 2.3 | % | |
| (43.5 | %) | |
| (15.5 | %) | |
| 5.1 | % | |
| 6.1 | % |
| Fuel | |
| 9.0 | % | |
| 12.9 | % | |
| 10.8 | % | |
| 12.0 | % | |
| 13.5 | % | |
| 11.0 | % | |
| 4.8 | % | |
| 7.8 | % |
| Coca-Cola FEMSA | |
| 8.1 | % | |
| 8.1 | % | |
| 12.8 | % | |
| 10.5 | % | |
| 7.4 | % | |
| 10.8 | % | |
| | | |
| | |
José Antonio
Fernandez Carbajal, FEMSA’s Chief Executive Officer, commented:
“Our
results for the fourth quarter were strong, but less uniform across business units than what we saw earlier in the year. Revenues were
robust, even as we cycled tough comparison bases at certain business units. However, on the expense side we felt more directly the cumulative
effect from increased labor costs in Mexico, as well as some business- and country-specific situations that impacted our profitability.
Proximity
Americas increased revenues by more than 14%, driven by high-single-digit comparable sales at OXXO and reflecting an accelerated store
expansion, while we continued to see healthy growth trends in South America and across formats. In Europe, Valora achieved a strong operating
result with substantial growth in a challenging macro environment. FEMSA Health delivered stable revenues, but a deteriorating dynamic
in the institutional business in Colombia hurt our profitability. For its part, Coca-Cola FEMSA again delivered strong results across
its income statement, while Digital@FEMSA continued to add users at a brisk pace.
On the
strategic front, we recently provided incremental information regarding our capital allocation framework, and we stand ready to begin
executing the plan in order to reach our stated leverage objective within two to three years.
In short,
we wrapped up a unique year that was transformational on the strategic front, with remarkable results resulting from our FEMSA Forward
strategy. Today, we are a leaner, more focused company, ideally positioned to pursue and capture the most compelling opportunity set
we have ever had before us. Once again, I thank the entire FEMSA team for their excellent work, as we get ready to write another
exciting chapter.”
1 FEMSA Retail: Proximity
Americas & Europe, Fuel and FEMSA Health.
2 Active User for Spin by
OXXO: Any user with a balance or that has transacted within the last 56 days. Active User for Spin Premia: User that has transacted at
least once with OXXO Premia within the last 90 days.
3 Tender: OXXO Mexico MXN
sales with OXXO Premia or Spin Premia redemption or accrual divided by Total OXXO Mexico MXN Sales, during the period.
February 23, 2024 | Page 2
QUARTERLY RESULTS
Results are compared
to the same period of previous year
FEMSA
CONSOLIDATED
4Q23 Financial Summary
Amounts expressed in millions of Mexican Pesos (Ps.)
| | |
4Q23 | | |
4Q22 | | |
Var. | | |
Org. | |
| Total Revenues | |
| 189,825 | | |
| 181,454 | | |
| 4.6 | % | |
| 4.3 | % |
| Income from Operations | |
| 17,532 | | |
| 17,781 | | |
| (1.4 | %) | |
| (0.7 | %) |
| Operating Margin (%) | |
| 9.2 | | |
| 9.8 | | |
| (60 | bps) | |
| | |
| Adjusted EBITDA4 | |
| 26,933 | | |
| 26,002 | | |
| 3.6 | % | |
| 3.6 | % |
| Adjusted EBITDA Margin (%) | |
| 14.2 | | |
| 14.3 | | |
| (10 | bps) | |
| | |
| Net Income | |
| 6,337 | | |
| 7,990 | | |
| (20.7 | %) | |
| | |
Net Debt ex-KOF5
Amounts expressed in millions of Mexican Pesos (Ps.)
| As of December 31, 2023 | |
Ps. | | |
US$3 | |
| Cash | |
| 160,780 | | |
| 9,514 | |
| Long-Term Debt | |
| 71,611 | | |
| 4,237 | |
| Lease Liabilities | |
| 94,305 | | |
| 5,580 | |
| Net debt | |
| 5,136 | | |
| 304 | |
| ND / Adj. EBITDA | |
| 0.08 | x | |
| - | |
Total revenues
increased 4.6% in 4Q23 compared to 4Q22, driven by growth across our business units. On an organic4 basis, total revenues
increased 4.3%.
Gross profit
increased 8.5%. Gross margin expanded 140 basis points, reflecting margin expansions at Proximity Americas, Fuel, and Coca-Cola FEMSA.
This was partially offset by a margin contraction in Health and Proximity Europe.
Income from
operations decreased 1.4%. On an organic basis, income from operations decreased 0.7%. Consolidated operating margin decreased 60
basis points to 9.2% of total revenues, reflecting margin contractions in Coca-Cola FEMSA, Proximity Americas, and Health; this was partially
offset by margin expansions in Fuel and Proximity Europe.
Net consolidated
income was Ps. 6,337 million, reflecting: i) higher gross profit; and ii) a decrease in net interest expenses during the quarter.
This was partially offset by: i) a non-cash foreign exchange loss of Ps. 6,302 million related to our U.S. dollar-denominated cash position
impacted by the appreciation of the Mexican peso; and ii) a Ps. 3,235 million net loss from discontinued operations, mostly reflecting
the accounting re-measurement from historical cost to fair value of FEMSA’s investment in Solistica and Alpunto businesses, net
of impairments.
Net majority
income was Ps. 0.91 per FEMSA Unit5 and US$0.64 per FEMSA ADS.
Capital expenditures
amounted Ps. 15,679 million, driven by ongoing investment activities across our business units.
PROXIMITY AMERICAS
OXXO (Mexico & Latam3) |
 |
4Q23 Financial Summary
Amounts expressed in millions of Mexican Pesos (Ps.) except same-store sales
| | |
4Q23 | | |
| 4Q22 | |
Var. | |
| Same-store sales (thousands of Ps.) | |
| 989.9 | | |
| 912.5 | | |
| 8.5 | % |
| Total Revenues | |
| 71,530 | | |
| 62,652 | | |
| 14.2 | % |
| Income from Operations | |
| 8,020 | | |
| 7,941 | | |
| 1.0 | % |
| Income from Operations Margin (%) | |
| 11.2 | | |
| 12.7 | | |
| (150 | bps) |
| Adjusted EBITDA | |
| 11,486 | | |
| 10,972 | | |
| 5.6 | % |
| Adjusted EBITDA Margin (%) | |
| 16.1 | | |
| 17.5 | | |
| (140 | bps) |
1 Excludes the effects of significant mergers and acquisitions in the last twelve months, including the
acquisition of Valora.
2 FEMSA Units consist of FEMSA BD Units and FEMSA B Units. Each FEMSA BD Unit is comprised of one Series
B Share, two Series D-B Shares and two Series D-L Shares. Each FEMSA B Unit is comprised of five Series B Shares. The number of FEMSA
Units outstanding as of December 31, 2023 was 3,578,226,270, equivalent to the total number of FEMSA Shares outstanding as of the same
date, divided by 5.
3 The exchange rate published by the Federal Reserve Bank of New York for December 31, 2023 was 16.8998
MXN per USD.
4 Adjusted EBITDA: Operating Income + Depreciation + Amortizations.
5 ex-KOF: FEMSA Consolidated reported information – Coca-Cola FEMSA Consolidated reported information.
Adjusted EBITDA ex-KOF: FEMSA Consolidated Adjusted EBITDA as described above – Coca-Cola FEMSA’s Consolidated Adjusted EBITDA
+ Dividends received by FEMSA from Coca-Cola FEMSA and other investments.
All Net Debt calculations are shown on an Ex-KOF basis. For a detailed reconciliation
of this metric please see table on page 17 of this document.
3 OXXO Latam: OXXO Colombia, Chile and Peru.
February 23, 2024 | Page 3

Total revenues
increased 14.2% in 4Q23 compared to 4Q22, reflecting an 8.5% average same-store sales increase, driven by 6.3% growth in average
customer ticket and an increase of 2.1% in store traffic. These figures reflect a strong performance across most of OXXO’s categories
supported by the thirst and gathering occasions, such as beer, snacks, and other beverages. During the quarter, the OXXO
store base in Mexico & Latam expanded by 514 units to reach 1,408 total net store additions for the last twelve months. As of
December 31, 2023, Proximity Americas had a total of 22,866 OXXO stores.
Gross profit
reached 45.4% of total revenues, reflecting strong commercial activity and promotional programs from key suppliers, partially offset
by a decrease in the contribution of financial services relative to 4Q22.
Income from
operations represented 11.2% of total revenues. Operating expenses increased 23.7% to Ps. 24,432 million, reflecting an increase
in labor expenses resulting from labor reforms implemented in Mexico during this year.
PROXIMITY AMERICAS
Other formats |
 |
Bara1
Total revenues
increased 33.7% in 4Q23 compared to 4Q22, driven by a 13.0% average same-store sales increase, reflecting the strong performance of the
groceries, home hygiene and convenience categories, particularly beverages. During the quarter, the Bara store base expanded by 50 units
to reach 359 total Bara stores as of December 31, 2023.
Grupo Nós2
Total revenues
for the period grew 119.8%3 year-over-year, reaching R$256.1 million4. This figure reflects the successful
evolution and expansion of the OXXO value proposition which resulted in same-store sales growth at OXXO of 9.8% 3, as well
as the addition of 223 net new OXXO stores for the last twelve months. During the quarter, the store base of Grupo Nós expanded
by 60 units, the majority of which are OXXO stores. As of December 31, 2023, Grupo Nós had a total of 1,716 stores, which
include 440 company owned and operated OXXO stores.
1 Bara store count and results
are not consolidated within the Proximity Americas reported figures.
2 OXXO’s non-consolidated
joint-venture with Raízen in Brazil.
3 In local currency, BRL.
4 The exchange rate published
by the Federal Reserve Bank of New York for December 29, 2023 was 4.8521 BRL per USD.
February 23, 2024 | Page 4
PROXIMITY EUROPE1
Valora
4Q23 Financial Summary
Amounts
expressed in millions of Mexican Pesos (Ps.)
| | |
4Q23 | | |
4Q22 | | |
Var. | |
| Total Revenues | |
| 11,415 | | |
| 9,809 | | |
| 16.4 | % |
| Income from Operations | |
| 594 | | |
| 332 | | |
| 78.9 | % |
| Income from Operations Margin (%) | |
| 5.2 | | |
| 3.4 | | |
| 180 | bps |
| Adjusted EBITDA | |
| 1,845 | | |
| 1,163 | | |
| 58.6 | % |
| Adjusted EBITDA Margin (%) | |
| 16.2 | | |
| 11.9 | | |
| 430 | bps |
Total revenues
increased 16.4% in 4Q23 compared to 4Q22, reflecting positive pricing initiatives, as well as the growth of Valora’s foodservice
sales. As of the end of the period, Proximity Europe had 2,808 points of sale.
Gross profit
reached 44.9% of total revenues, reflecting a positive performance of the food products and foodservice category, which have a structurally
higher margin.
Income from
operations amounted to 5.2% of total revenues, reflecting the contribution of foodservice, higher promotional income, as well as
positive operating leverage. Operating expenses increased 6.1% to Ps. 4,526 million, reflecting an increase in labor expenses partially
offset by a decrease in administrative expenses.
1 The Proximity Europe segment
is comprised of Valora. The acquisition of Valora was concluded in October 2022, the financial summary reflects 2 months and 23 days
in both years for comparability purposes.
February 23, 2024 | Page 5
| HEALTH |
 |
| 4Q23 Financial Summary |
| Amounts expressed in millions of Mexican Pesos (Ps.) except same-store sales |
| | |
| | |
| | |
| |
| | |
| 4Q23 | | |
| 4Q22 | | |
| Var. | |
| Same-store sales (thousands of Ps.) | |
| 1,128.3 | | |
| 1,073.3 | | |
| 5.1 | % |
| Total Revenues | |
| 19,254 | | |
| 18,774 | | |
| 2.6 | % |
| Income from Operations | |
| 573 | | |
| 1,014 | | |
| (43.5 | %) |
| Income from Operations Margin (%) | |
| 3.0 | | |
| 5.4 | | |
| (240 | bps) |
| Adjusted EBITDA | |
| 2,262 | | |
| 1,946 | | |
| 16.2 | % |
| Adjusted EBITDA Margin (%) | |
| 11.7 | | |
| 10.4 | | |
| 130 | bps |
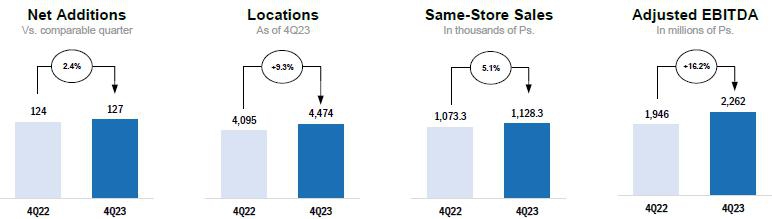
Total revenues increased 2.6% in 4Q23 compared
to 4Q22, mainly reflecting positive local currency sales trends in most of our territories, offset by a challenging competitive environment
in Mexico, and by currency translation effects. During the quarter, FEMSA Health’s store base expanded by 127 units reaching a total
of 4,474 locations across its territories as of December 31, 2023. This figure reflects the addition of 379 net new locations in
the last twelve months. Same-store sales increased by an average of 5.1%, reflecting the trends described above. However, on a currency-neutral1
basis, total revenues grew 9.0% while same-store sales increased by 3.1%.
1Calculated by translating comparable period figures at
the foreign currency exchange rates used in the current period.
February 23, 2024 | Page 6
Gross profit was 29.2%, reflecting efficiencies
and more effective collaboration and execution with key suppliers, as well as a negative price-mix effect resulting from an increase in
the contribution of our institutional sales channel in Colombia.
Income from operations amounted to 3.0%
of total revenues. Operating expenses increased 8.0% to Ps. 5,049 million, reflecting an increase in labor expenses in Mexico and Chile,
and a charge of Ps. 527 million for uncollectible accounts. Partially offset by a tight expense control across our operations.
| FUEL |
|
 |
| 4Q23 Financial Summary |
| Amounts expressed in millions of Mexican Pesos (Ps.) except same-station sales |
| | |
| | |
| | |
| |
| | |
| 4Q23 | | |
| 4Q22 | | |
| Var. | |
| Same-station sales (thousands of Ps.) | |
| 7,982.7 | | |
| 7,616.9 | | |
| 4.8 | % |
| Total Revenues | |
| 15,121 | | |
| 13,875 | | |
| 9.0 | % |
| Income from Operations | |
| 697 | | |
| 614 | | |
| 13.5 | % |
| Income from Operations Margin (%) | |
| 4.6 | | |
| 4.4 | | |
| 20 | bps |
| Adjusted EBITDA | |
| 943 | | |
| 920 | | |
| 2.5 | % |
| Adjusted EBITDA Margin (%) | |
| 6.2 | | |
| 6.6 | | |
| (40 | bps) |
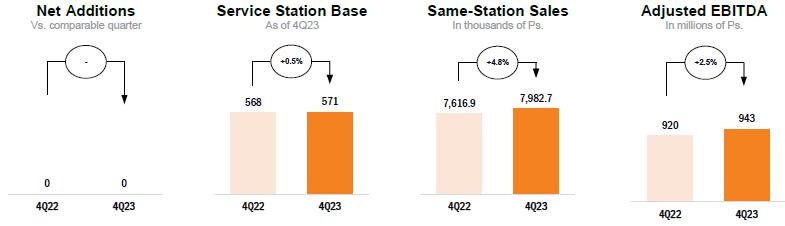
Total revenues increased 9.0% in 4Q23 compared
to 4Q22, reflecting a 4.8% average same-station sales increase, driven by 2.1% growth in average volume and 2.6% increase in the average
price per liter, as well as volume growth in our institutional and wholesale customer network. The OXXO Gas retail network had 571 points
of sale as of December 31, 2023. This figure reflects the addition of three net stations for the last twelve months.
Gross profit was 13.4% of total revenues.
Income from operations amounted to 4.6%
of total revenues, reflecting tight expense control and operational efficiencies. Operating expenses increased 9.4% to Ps. 1,325 million,
reflecting increased labor expenses.
February 23, 2024 | Page 7
FEMSA Retail Operations Summary
Currency-neutral
terms where applicable
Total Revenue Growth (% vs year ago)
| | |
| 4Q23 | |
| Proximity Americas | |
| | |
| OXXO1 | |
| 14.2 | % |
| Mexico | |
| 13.8 | % |
| OXXO Latam2 | |
| 35.0 | % |
| | |
| | |
| Other Proximity Americas formats | |
| | |
| Bara | |
| 33.7 | % |
| OXXO Brazil3 | |
| 119.8 | % |
| | |
| | |
| Proximity Europe4 | |
| 9.5 | % |
| OXXO Gas | |
| 9.0 | % |
| | |
| | |
| FEMSA Health5 | |
| 9.0 | % |
| Chile | |
| 2.9 | % |
| Colombia | |
| 11.9 | % |
| Ecuador | |
| (1.9 | %) |
| Mexico | |
| 2.9 | % |
| 1 |
OXXO Consolidated figures shown in MXN including currency effects. |
| 2 |
Includes OXXO Colombia, Chile and Peru. |
| 3 |
Operated through Grupo Nós, our joint-venture with Raízen. |
| 5 |
FEMSA Health Include franchised stores in Ecuador. |
Total
Unit Growth (% vs year ago)
| | |
| 4Q23 | |
| Proximity Americas | |
| | |
| OXXO | |
| 6.6 | % |
| Mexico | |
| 5.2 | % |
| OXXO Latam1 | |
| 55.8 | % |
| | |
| | |
| Other Proximity Americas formats | |
| | |
| Bara | |
| 32.5 | % |
| OXXO Brazil2 | |
| 102.8 | % |
| | |
| | |
| Proximity Europe3 | |
| 1.5 | % |
| OXXO Gas | |
| 0.5 | % |
| | |
| | |
| FEMSA Health | |
| 9.3 | % |
| Chile | |
| 3.7 | % |
| Colombia | |
| 14.5 | % |
| Ecuador | |
| 5.2 | % |
| Mexico | |
| 11.7 | % |
| 1 |
Includes OXXO Colombia, Chile and Perú. |
| 2 |
Operated through Grupo Nós, our joint-venture with Raízen. |
| 3 |
Includes company owned and franchised units. |
Same-Store
Sales
| | |
| 4Q23 | |
| Proximity Americas | |
| | |
| OXXO1 | |
| 8.5 | % |
| Mexico | |
| 8.5 | % |
| OXXO Latam2 | |
| 9.9 | % |
| | |
| | |
| Other Proximity Americas formats | |
| | |
| Bara | |
| 13.0 | % |
| OXXO Brazil3 | |
| 9.8 | % |
| | |
| | |
| Proximity Europe4 | |
| N.A. | |
| OXXO Gas | |
| 4.8 | % |
| | |
| | |
| FEMSA Health5 | |
| 3.1 | % |
| Chile | |
| (0.4 | %) |
| Colombia | |
| 12.0 | % |
| Ecuador | |
| (1.7 | %) |
| Mexico | |
| (7.8 | %) |
| 1 |
OXXO Consolidated figures shown in MXN including currency effects. |
| 2 |
Includes OXXO Colombia, Chile and Peru. |
| 3 |
Operated through Grupo Nós, our joint-venture with Raízen. |
| 4 |
Local currency (CHF). |
| 5 |
Only includes retail sales. FEMSA Health Include franchised stores in Ecuador. |
February 23, 2024 | Page 8
| DIGITAL@FEMSA1 |
 |
Spin by OXXO
Spin by OXXO acquired
1.1 million users during the quarter to reach 9.9 million total users in 4Q23, compared to 5.3 million users in 4Q22. This represents
an increase of 86.1% YoY and a 5.3% compound monthly growth rate. Active users2 represented 70.1% of the total acquired
user base. Total transactions per month increased 12.6%3 during the quarter to reach
an average of 47.1 million per month in 4Q23, reflecting an increase in user engagement.
Spin Premia
Spin Premia acquired
3.7 million users during the quarter to reach 40.2 million total users in 4Q23, compared to 26.1 million users in 4Q22. This represents
an increase of 54.3% YoY and a 3.7% compound monthly growth rate. Active users4 represented 48.0% of the total acquired
user base. The average tender5 during the quarter was 31.0%.
| COCA-COLA FEMSA |
 |
Coca-Cola FEMSA’s financial results and
discussion thereof are incorporated by reference from Coca-Cola FEMSA’s press release, which is attached to this press release
or may be accessed by visiting coca-colafemsa.com.
1 Digital@FEMSA’s results are
included within the Other business segment.
2 Active User for Spin by OXXO: Any
user with a balance or that has transacted within the last 56 days.
3 Represents the quarter-over-quarter
growth of average monthly transactions.
4 Active User for Spin Premia: User
that has transacted at least once with OXXO Premia or Spin Premia within the last 90 days.
5 Tender: OXXO Mexico MXN sales with
OXXO Premia or Spin Premia redemption or accrual divided by Total OXXO Mexico MXN Sales, during the period.
February 23, 2024 | Page 9
RESULTS FOR THE FULL YEAR OF 2023
Results
are compared to the same period of previous year
Financial Summary for the Full Year 2023
Amounts expressed in millions of
Mexican Pesos (Ps.)
| | |
2023 | | |
2022 | | |
Var. | |
Org. | |
| Total Revenues | |
| 702,692 | | |
| 597,008 | | |
| 17.7 | % |
| 17.4 | % |
| Income from Operations | |
| 59,812 | | |
| 63,870 | | |
| (6.4 | %) |
| (6.3 | %) |
| Operating Margin (%) | |
| 8.5 | | |
| 10.7 | | |
| (220 | bps) |
| | |
| Adjusted EBITDA1 | |
| 96,386 | | |
| 94,491 | | |
| 2.0 | % |
| 1.9 | % |
| Adjusted EBITDA Margin (%) | |
| 13.7 | | |
| 15.8 | | |
| (210 | bps) |
| | |
| Net Income | |
| 77,378 | | |
| 34,743 | | |
| 122.7 | % |
| | |
Total revenues increased 17.7%. On an organic
basis2, total revenues increased 17.4% reflecting growth across all our operations.
Gross profit increased 15.7%. Gross margin
decreased 70 basis points to 39.8% of total revenues, reflecting a gross margin contraction at Fuel, as well as the consolidation of Proximity
Europe. This was partially offset by margin expansion on Proximity Americas, Coca-Cola FEMSA and Health, offset by margin.
Income from operations decreased 6.4%.
On an organic basis2, income from operations decreased 6.3%. Our consolidated operating margin decreased 220 basis points to
8.5% of total revenues, reflecting margin expansion at Coca-Cola FEMSA, flat margin in Fuel, offset by margin contractions at Proximity
Americas, and Health, as well as by the consolidation of Proximity Europe.
Our effective income tax rate was 22.9%
for the full year 2023, compared to 28.3% in 2022. Our income tax provision was Ps. 13,577 million in 2023.
Net consolidated income increased to Ps.
77,378 million, reflecting; i) a Ps. 32,238 million net income from discontinued operations, mostly reflecting the accounting re-measurement
from historical cost to fair value of FEMSA’s investment in Heineken, and the Solistica and Alpunto businesses; a ii) higher other
non-operating income of Ps. 7,048 million, mainly related to the divestment of FEMSA’s minority stake in Jetro Restaurant Depot;
and iii) a Ps. 17,609 million non-cash financial product that mostly reflects the repurchase of US$1.7 billion3 of FEMSA’s
outstanding debt at favorable price levels during 1Q23. This was partially offset by: i) a non-cash foreign exchange loss of Ps. 9,849,
related to FEMSA’s U.S. dollar-denominated cash position as impacted by the appreciation of the Mexican peso.
Net majority income per FEMSA Unit4
was Ps.18.55 (US$10.98 per ADS).
Capital expenditures amounted to Ps. 38,958
million, reflecting the reactivation of ongoing investment activities at most of our business units.
RECENT
DEVELOPMENTS
| · | On October 31, 2023, FEMSA announced that
the transaction bringing together BradyIFS and Envoy Solutions had closed successfully, after receiving the necessary regulatory approvals.
The transaction combines the strengths and complementary footprints of Envoy Solutions and BradyIFS to create a strong customer-focused
platform to effectively provide its customers with high-value solutions, and its supplier partners with excellent market reach, delivering
more products and solutions in more locations across the United States. With this transaction, FEMSA continues to deliver on its FEMSA
Forward strategy. |
| · | On November 9, 2023, FEMSA announced the
final results of its previously announced offer (the "Tender Offer") to purchase for cash any and all of its outstanding US$552,830,000
principal amount of 4.375% Senior Notes due 2043 (CUSIP/ISIN: 344419 AB2 / US344419AB20) (the "Securities") on the terms and
subject to the conditions set forth in the offer to purchase, dated October 31, 2023 (the "Offer to Purchase") and the
related notice of guaranteed delivery (the "Notice of Guaranteed Delivery" and, together with the Offer to Purchase, the "Offer
Documents"). |
The Tender Offer expired on November 6,
2023, at 5:00 p.m. (New York City time) (the "Expiration Date") and settled on November 9, 2023 (the "Settlement
Date"). No Notice of Guaranteed Delivery was received by FEMSA prior to the Expiration Date. The aggregate amount paid by FEMSA to
Holders whose Securities were accepted for purchase, including Accrued Interest and Additional Amounts, was approximately US$117 million.
1 Adjusted EBITDA: Operating Income + Depreciation + Amortizations.
2 Excludes the effects of significant mergers and acquisitions
in the last twelve months.
3 Face Value
4 FEMSA Units consist of FEMSA BD
Units and FEMSA B Units. Each FEMSA BD Unit is comprised of one Series B Share, two Series D-B Shares and two Series D-L Shares. Each
FEMSA B Unit is comprised of five Series B Shares. The number of FEMSA Units outstanding as of December 31, 2023 was 3,578,226,270, equivalent
to the total number of FEMSA Shares outstanding as of the same date, divided by 5.
February 23, 2024 | Page 10
| · | On November 14, 2023, FEMSA announced that
in order to meet the needs of the populations affected by Otis, FEMSA through Coca-Cola FEMSA, OXXO, OXXO GAS, Farmacias Yza, Spin by
OXXO, Fundación FEMSA, and Solistica continue to add support for the prompt recovery of Acapulco. |
| o | With the commissioning of two "Ven por Agua" water treatment vehicles, as of November 13, Coca-Cola FEMSA has filled
5,323 bottles (20L) of drinking water. |
| o | The Spin Premia loyalty coalition program adds to the fundraising efforts. From November 6 to December 6, users of the program
could contribute their points to a fund that was transformed into support through the collaboration between FEMSA Foundation and World
Vision Mexico (More than 3.6 million pesos). |
| o | Among the actions that OXXO implemented as a priority were the delivery of 7,600 food pantries for employees and the community and
the delivery of 6,000 hydration products in the most affected areas and 5,520 bottles of water. |
| · | On February 15, 2024, FEMSA provided additional
information regarding its future capital allocation plans. These plans have been approved by the Board of Directors of FEMSA and are an
integral part of, and fully consistent with, the FEMSA Forward strategy presented in February of 2023. |
FEMSA´s
capital allocation strategy is focused on driving the long-term intrinsic per-share value. FEMSA believes they have abundant attractive
capital deployment opportunities. Over the next five years they expect to invest capital in core organic growth initiatives in excess
of Ps. 237,000 million, with close to Ps. 170,000 million of that deployed in Mexico, where they are one of the largest employers (over
280,000 employees), and taxpayers, expecting to pay over Ps. 100,000 million in aggregate income taxes for the period between fiscal 2023
and 2028. Considering the remarkable speed and success with which the FEMSA Forward-related
divestments have been executed, and after accounting for expected organic and inorganic capital needs, FEMSA believes that returning capital
to shareholders should be an important part of the overall strategy.
FEMSA look at the portfolio of investment
opportunities available, privileging organic investments within their proven business models that can generate returns well in excess
of cost of capital, and with a relatively low level of risk. Also favoring investments in initiatives and capabilities with attractive
risk-reward profiles that create and drive, through market expansion and innovation, future value creation opportunities. In addition,
inorganic investments will be focused on meeting the strategic objectives of core verticals and scrutinized to meet strict financial criteria:
value creation and cash flow generation.
Furthermore, subject to business performance
and capital deployment opportunities and beyond the ordinary dividend, FEMSA will endeavor to return to shareholders an aggregate amount
equivalent to approximately six percent of FEMSA’s current public market value over the next two to three years, through a combination
of additional dividends and share buybacks. This capital return framework will have the overarching tenet of not maintaining idle capital
on the balance sheet, and maximizing per-share value accretion as they strive to reach and maintain a 2x Net Debt/EBITDA ex-KOF objective.
FEMSA expects to use a combination
of dividends and a multi-year share buyback program to return capital to its shareholders in 2024 and beyond. To this end, the Board of
Directors has approved to submit to the 2024 Annual Shareholders Meeting the following proposals: i) Increase ordinary dividends by approximately
20% compared to 2023 on an aggregate basis by paying four quarterly installments of Ps. 0.9161 per FEMSAUB unit and Ps. 1.0993 per FEMSAUBD
unit (Ps. 10.9931 per ADS); ii) pay an additional dividend in four quarterly installments of Ps. 0.6418 per FEMSAUB unit and Ps. 0.7701
per FEMSAUBD unit (Ps. 7.7010 per ADS), over and above the approved ordinary dividends, to be disbursed on the same dates as the ordinary
dividends; and iii) double maximum share buyback capacity from the currently existing authorization.
Consistent with the plans described
above, FEMSA intends to utilize a mix of the share buyback program and additional dividends as needed. Intending to continue
to use these mechanisms in the medium term, focused on per-share value accretion and maintaining our stated leverage objective.
| · | On February 23, 2023, FEMSA announced that,
as part of its commitment to the FEMSA Forward strategy, it is implementing changes in its corporate organization. |
Consistent with the FEMSA Forward
strategy, each of the three core business verticals will continue strengthening their already robust teams to ensure they capture
the significant growth opportunities ahead of them. Their size and complexity require a strong team, dedicated to the execution of their
strategies, and the achievement of their business objectives. FEMSA corporate organization will focus on setting the overall strategic
direction and providing guidance and support for the core businesses, including all major strategic, financial, and capital market-related
matters.
In this context, and having largely
concluded the transformational transactions stemming from FEMSA Forward, FEMSA announces two changes in FEMSA’s senior leadership
team.
February 23, 2024 | Page 11
Francisco Camacho Beltrán, FEMSA’s
Chief Corporate Officer, has decided to complete his cycle at the Company and pursue new professional challenges, stepping down from his
role effective April 30, 2024. Since joining the Company in 2020, Francisco successfully led most of the corporate functions of FEMSA,
while also playing a pivotal role in defining FEMSA’s Strategic Priorities Framework, ensuring its alignment with the new FEMSA
Forward strategy, and coordinating the development of the current long-range plans of FEMSA and its business units. He leaves the
Company with a clear roadmap for sustained growth, and in an enviable position to meet all the ambitious goals that the Company has set
in its sustainability efforts.
Eugenio Garza y Garza, FEMSA’s
Chief Financial Officer (“CFO”), has also decided to finish his cycle at the Company and step down as CFO effective April 30,
2024. Since joining FEMSA in 2018, Eugenio has played an instrumental role in the strategic and corporate development of FEMSA, including
the design and implementation of the FEMSA Forward strategy in record time, the successful divestment of FEMSA’s stake in
Heineken, JRD, and Envoy, as well as numerous other benchmark-setting M&A and capital market transactions. His leadership, financial
acumen, and strategic vision have been key to the continued success and financial strength of FEMSA and its Business Units.
Martin Arias Yaniz has been appointed
Chief Financial Officer, effective April 30, 2024. Martin has been an integral part of FEMSA’s finance and strategy team for
25 years. He began working with FEMSA in 1999 as a strategic advisor before formally joining FEMSA in 2003, occupying different leadership
positions in the Corporate Development, Strategic Planning, and Treasury teams at both Coca-Cola FEMSA and FEMSA. From 2014 until 2019,
he was FEMSA’s Director of Strategic Planning and Corporate Development. Since his departure from this role, Martin has continued
as a close and trusted advisor of the Company for strategic projects, including FEMSA Forward and the implementation of its related
transactions. He will serve as FEMSA’s CFO on an interim basis, and FEMSA will conduct a thorough search process to appoint a permanent
replacement in due course. FEMSA’s CFO will report to José Antonio Fernández Carbajal, FEMSA’s Executive Chairman
and CEO.
Martin will work closely with Francisco
and Eugenio over the next two months to facilitate a seamless handover. In addition, during this period, Eugenio will launch the implementation
of the capital allocation elements of the FEMSA Forward strategy that was announced on February 15, transitioning to Martin
in due course to ensure its continued success. Following his departure from the CFO position, Eugenio will remain working with FEMSA in
an advisory role for key strategic projects.
CONFERENCE CALL INFORMATION
Our Fourth Quarter and Full Year 2023 Conference Call will be held on: Friday, February 23, 2024, 10:00 AM Eastern Time (9:00 AM Mexico
City Time). The conference call will be webcast live through streaming audio.
| Telephone: |
Toll Free US:
|
(866) 580 3963
|
| |
International: |
+1 (786) 697 3501 |
| |
|
|
| Webcast: |
https://edge.media-server.com/mmc/p/j59xingg/ |
| |
|
| Conference ID: |
FEMSA |
|
If you are unable to participate live, the conference call audio will
be available on https://femsa.gcs-web.com/financial-reports/quarterly-results
ABOUT FEMSA
FEMSA is a company that creates economic and social
value through companies and institutions and strives to be the best employer and neighbor to the communities in which it operates. Across
its business units, FEMSA has more than 350,000 employees in 18 countries. FEMSA is a member of the Dow Jones Sustainability MILA Pacific
Alliance, the FTSE4Good Emerging Index and the Mexican Stock Exchange Sustainability Index: S&P/BMV Total México ESG, among
other indexes that evaluate its sustainability performance.
The translations of
Mexican pesos into US dollars are included solely for the convenience of the reader, using the noon buying rate for Mexican pesos as published
by the Federal Reserve Bank of New York on December 31, 2023, which was 16.8998 Mexican pesos per US dollar.
February 23, 2024 | Page 12
FORWARD-LOOKING STATEMENTS
This report may contain certain forward-looking
statements concerning our future performance that should be considered as good faith estimates made by us. These forward-looking statements
reflect management’s expectations and are based upon currently available data. Actual results are subject to future events and uncertainties,
which could materially impact our actual performance.
Our consolidated financial statements as of and
for the year ended December 31, 2023, are not yet available, and the independent audit of those financial statements is ongoing and
has not yet been completed. The unaudited preliminary financial information as of and for the year ended December 31, 2023, presented
herein, is preliminary and subject to change as we complete our financial closing procedures and prepare our consolidated financial statements,
and as our independent registered public accounting firm completes its audit of such consolidated financial statements. As of the date
of this release, our independent registered public accounting firm has not expressed an opinion or any other form of assurance on any
financial information as of or for the year ended December 31, 2023, or on our internal control over financial reporting as of December 31,
2023. Our audited consolidated financial statements may differ materially from this preliminary information and will also include notes
providing additional disclosures.
Nine pages of tables and Coca-Cola
FEMSA’s press release to follow
February 23, 2024 | Page 13
FEMSA – Consolidated Income Statement
Amounts expressed in millions of Mexican Pesos (Ps.)
| | |
For
the fourth quarter of: | | |
For
the twelve months of: | |
| | |
2023 | | |
% of
rev. | | |
2022 | | |
% of
rev. | | |
%
Var. | | |
%
Org.(A) | | |
2023 | | |
% of
rev. | | |
2022 | | |
% of
rev. | | |
%
Var. | | |
%
Org.(A) | |
| Total revenues | |
| 189,825 | | |
| 100.0 | | |
| 181,454 | | |
| 100.0 | | |
| 4.6 | | |
| 4.3 | | |
| 702,692 | | |
| 100.0 | | |
| 597,008 | | |
| 100.0 | | |
| 17.7 | | |
| 17.4 | |
| Cost of sales | |
| 111,910 | | |
| 59.0 | | |
| 109,639 | | |
| 60.4 | | |
| 2.1 | | |
| | | |
| 423,185 | | |
| 60.2 | | |
| 355,490 | | |
| 59.5 | | |
| 19.0 | | |
| | |
| Gross profit | |
| 77,915 | | |
| 41.0 | | |
| 71,815 | | |
| 39.6 | | |
| 8.5 | | |
| | | |
| 279,507 | | |
| 39.8 | | |
| 241,518 | | |
| 40.5 | | |
| 15.7 | | |
| | |
| Administrative
expenses | |
| 8,178 | | |
| 4.3 | | |
| 10,512 | | |
| 5.8 | | |
| (22.2 | ) | |
| | | |
| 31,480 | | |
| 4.5 | | |
| 28,077 | | |
| 4.7 | | |
| 12.1 | | |
| | |
| Selling
expenses | |
| 52,741 | | |
| 27.8 | | |
| 43,480 | | |
| 24.0 | | |
| 21.3 | | |
| | | |
| 188,732 | | |
| 26.9 | | |
| 149,145 | | |
| 25.0 | | |
| 26.5 | | |
| | |
| Other
operating expenses (income), net (1) | |
| (536 | ) | |
| (0.3 | ) | |
| 42 | | |
| - | | |
| N.S.
| | |
| | | |
| (517 | ) | |
| (0.1 | ) | |
| 426 | | |
| 0.1 | | |
| N.S.
| | |
| | |
| Income
from operations (2) | |
| 17,532 | | |
| 9.2 | | |
| 17,781 | | |
| 9.8 | | |
| (1.4 | ) | |
| (0.7 | ) | |
| 59,812 | | |
| 8.5 | | |
| 63,870 | | |
| 10.7 | | |
| (6.4 | ) | |
| (6.3 | ) |
| Other non-operating expenses
(income) | |
| 2,494 | | |
| | | |
| 1,018 | | |
| | | |
| 145.0 | | |
| | | |
| (7,048 | ) | |
| | | |
| 1,227 | | |
| | | |
| N.S.
| | |
| | |
| Interest
expense | |
| 6,232 | | |
| | | |
| 4,288 | | |
| | | |
| 45.3 | | |
| | | |
| 14,916 | | |
| | | |
| 15,853 | | |
| | | |
| (5.9 | ) | |
| | |
| Interest
income | |
| 4,535 | | |
| | | |
| 1,171 | | |
| | | |
| N.S.
| | |
| | | |
| 17,609 | | |
| | | |
| 3,769 | | |
| | | |
| N.S.
| | |
| | |
| Interest
expense, net | |
| 1,697 | | |
| | | |
| 3,117 | | |
| | | |
| (45.6 | ) | |
| | | |
| (2,693 | ) | |
| | | |
| 12,084 | | |
| | | |
| N.S.
| | |
| | |
| Foreign
exchange loss (gain) | |
| 6,302 | | |
| | | |
| 3,521 | | |
| | | |
| 79.0 | | |
| | | |
| 9,849 | | |
| | | |
| 3,696 | | |
| | | |
| 166.5 | | |
| | |
| Other
financial expenses (income), net | |
| (165 | ) | |
| | | |
| (196 | ) | |
| | | |
| (15.8 | ) | |
| | | |
| 346 | | |
| | | |
| 175 | | |
| | | |
| 97.7 | | |
| | |
| Financing expenses, net | |
| 7,834 | | |
| | | |
| 6,442 | | |
| | | |
| 21.6 | | |
| | | |
| 7,502 | | |
| | | |
| 15,955 | | |
| | | |
| (53.0 | ) | |
| | |
| Income before income tax and
participation in associates results | |
| 7,204 | | |
| | | |
| 10,321 | | |
| | | |
| (30.2 | ) | |
| | | |
| 59,358 | | |
| | | |
| 46,688 | | |
| | | |
| 27.1 | | |
| | |
| Income
tax (5) | |
| (2,471 | ) | |
| | | |
| 1,418 | | |
| | | |
| N.S.
| | |
| | | |
| 13,577 | | |
| | | |
| 13,275 | | |
| | | |
| 2.3 | | |
| | |
| Participation
in associates results (3) | |
| (103 | ) | |
| | | |
| (28 | ) | |
| | | |
| N.S.
| | |
| | | |
| (641 | ) | |
| | | |
| (93 | ) | |
| | | |
| N.S.
| | |
| | |
| Continued Operations net income
(Loss) | |
| 9,572 | | |
| | | |
| 8,875 | | |
| | | |
| 7.9 | | |
| | | |
| 45,140 | | |
| | | |
| 33,320 | | |
| | | |
| 35.5 | | |
| | |
| Discontinued Operations net income
(Loss) | |
| (3,235 | ) | |
| | | |
| (885 | ) | |
| | | |
| (140.5 | ) | |
| | | |
| 32,238 | | |
| | | |
| 1,423 | | |
| | | |
| (7.2 | ) | |
| | |
| Consolidated net income (Loss) | |
| 6,337 | | |
| | | |
| 7,990 | | |
| | | |
| (20.7 | ) | |
| | | |
| 77,378 | | |
| | | |
| 34,743 | | |
| | | |
| 122.7 | | |
| | |
| Net majority income | |
| 3,267 | | |
| | | |
| 3,969 | | |
| | | |
| (17.7 | ) | |
| | | |
| 66,390 | | |
| | | |
| 23,909 | | |
| | | |
| 177.7 | | |
| | |
| Net minority income | |
| 3,070 | | |
| | | |
| 4,021 | | |
| | | |
| (23.7 | ) | |
| | | |
| 10,988 | | |
| | | |
| 10,834 | | |
| | | |
| 1.4 | | |
| | |
| Operative
Cash Flow & CAPEX | |
2023 | | |
% of
rev. | | |
2022 | | |
% of
rev. | | |
%
Var. | | |
%
Org.(A) | | |
2023 | | |
% of
rev. | | |
2022 | | |
% of
rev. | | |
%
Var. | | |
%
Org.(A) | |
| Income from operations | |
| 17,532 | | |
| 9.2 | | |
| 17,781 | | |
| 9.8 | | |
| (1.4 | ) | |
| (0.7 | ) | |
| 59,812 | | |
| 8.5 | | |
| 63,870 | | |
| 10.7 | | |
| (6.4 | ) | |
| (6.3 | ) |
| Depreciation | |
| 8,044 | | |
| 4.2 | | |
| 7,239 | | |
| 4.0 | | |
| 11.1 | | |
| | | |
| 31,378 | | |
| 4.5 | | |
| 26,109 | | |
| 4.4 | | |
| 20.2 | | |
| | |
| Amortization & other
non-cash charges | |
| 1,357 | | |
| 0.8 | | |
| 982 | | |
| 0.5 | | |
| 38.2 | | |
| | | |
| 5,196 | | |
| 0.7 | | |
| 4,512 | | |
| 0.7 | | |
| 15.2 | | |
| | |
| Adjusted EBITDA | |
| 26,933 | | |
| 14.2 | | |
| 26,002 | | |
| 14.3 | | |
| 3.6 | | |
| 3.6 | | |
| 96,386 | | |
| 13.7 | | |
| 94,491 | | |
| 15.8 | | |
| 2.0 | | |
| 1.9 | |
| CAPEX | |
| 15,679 | | |
| | | |
| 13,853 | | |
| | | |
| 13.2 | | |
| | | |
| 38,958 | | |
| | | |
| 32,854 | | |
| | | |
| 18.6 | | |
| | |
(A) Organic basis (%
Org.) excludes the effects of significant mergers and acquisitions in the last twelve months.
(1) Other operating expenses
(income), net = other operating expenses (income) +(-) equity method from operated associates.
(2) Income from operations
= gross profit – administrative and selling expenses – other operating expenses (income), net.
(3) Mainly represents
the results of our joint-venture with Raízen, Grupo Nós, net of taxes.
(4) At the end of December,
the CAPEX effectively paid is equivalent to Ps. 38,068 million.
(5) Includes negative effect on Income Tax of ($2,467M) due to a decrease in tax profit due to loss in FX.
February 23, 2024 | Page 14
FEMSA – Consolidated Balance Sheet
Amounts expressed in millions of Mexican Pesos (Ps.)
| ASSETS | |
Dec-23 | | |
Dec-22 | | |
% Inc. | |
| Cash and cash equivalents | |
| 165,112 | | |
| 83,439 | | |
| 97.9 | |
| Investments | |
| 26,728 | | |
| 51 | | |
| N.S.
| |
| Accounts receivable | |
| 38,863 | | |
| 45,527 | | |
| (14.6 | ) |
| Inventories | |
| 58,222 | | |
| 62,224 | | |
| (6.4 | ) |
| Other current assets | |
| 41,472 | | |
| 35,208 | | |
| 17.8 | |
| Current Assets Available for sale | |
| 25,819 | | |
| - | | |
| N.S.
| |
| Total current assets | |
| 356,216 | | |
| 226,449 | | |
| 57.3 | |
| Investments in shares | |
| 26,341 | | |
| 103,669 | | |
| (74.6 | ) |
| Property, plant and equipment, net | |
| 141,530 | | |
| 134,001 | | |
| 5.6 | |
| Right of use | |
| 85,744 | | |
| 83,966 | | |
| 2.1 | |
| Intangible
assets (1) | |
| 144,815 | | |
| 190,772 | | |
| (24.1 | ) |
| Other assets | |
| 51,190 | | |
| 59,958 | | |
| (14.6 | ) |
| TOTAL ASSETS | |
| 805,836 | | |
| 798,815 | | |
| 0.9 | |
| LIABILITIES & STOCKHOLDERS’
EQUITY | |
Dec-23 | | |
Dec-22 | | |
% Inc. | |
| Bank loans | |
| 2,453 | | |
| 1,862 | | |
| 31.7 | |
| Current maturities of long-term debt | |
| 8,955 | | |
| 14,471 | | |
| (38.1 | ) |
| Interest payable | |
| 1,677 | | |
| 2,075 | | |
| (19.2 | ) |
| Current maturities of long-term leases | |
| 12,236 | | |
| 12,095 | | |
| 1.2 | |
| Operating liabilities | |
| 149,396 | | |
| 144,411 | | |
| 3.5 | |
| Short term liabilities available for sale | |
| 11,569 | | |
| - | | |
| N.S.
| |
| Total current liabilities | |
| 186,286 | | |
| 174,914 | | |
| 6.5 | |
| Long-term
debt (2) | |
| 125,417 | | |
| 170,989 | | |
| (26.7 | ) |
| Long-term leases | |
| 83,838 | | |
| 81,222 | | |
| 3.2 | |
| Laboral obligations | |
| 6,920 | | |
| 7,048 | | |
| (1.8 | ) |
| Other liabilities | |
| 24,247 | | |
| 26,841 | | |
| (9.7 | ) |
| Total liabilities | |
| 426,708 | | |
| 461,014 | | |
| (7.4 | ) |
| Total stockholders’ equity | |
| 379,128 | | |
| 337,801 | | |
| 12.2 | |
| TOTAL LIABILITIES AND STOCKHOLDERS’ EQUITY | |
| 805,836 | | |
| 798,815 | | |
| 0.9 | |
| | |
December 31,
2023 | |
| DEBT
MIX (2) | |
% of Total | | |
Average
Rate | |
| Denominated in: | |
| | | |
| | |
| Mexican pesos | |
| 52.5 | % | |
| 9.1 | % |
| U.S. Dollars | |
| 26.3 | % | |
| 3.4 | % |
| Euros | |
| 8.5 | % | |
| 2.9 | % |
| Swiss Francs | |
| 0.7 | % | |
| 1.5 | % |
| Colombian pesos | |
| 0.6 | % | |
| 6.3 | % |
| Argentine pesos | |
| 0.1 | % | |
| 130.0 | % |
| Brazilian reais | |
| 10.3 | % | |
| 9.6 | % |
| Chilean pesos | |
| 1.0 | % | |
| 9.4 | % |
| Uruguayan Pesos | |
| 0.0 | % | |
| 0.0 | % |
| Guatemalan Quetzal | |
| 0.0 | % | |
| 0.0 | % |
| Total debt | |
| 100.0 | % | |
| 7.1 | % |
| Fixed
rate (2) |
| 82.6 | % |
| Variable
rate (2) |
| 17.4 | % |
| DEBT MATURITY PROFILE | |
2024 | | |
2025 | | |
2026 | | |
2027 | | |
2028 | | |
2029+ | |
| % of Total Debt | |
| 0.1 | % | |
| 5.8 | % | |
| 1.6 | % | |
| 9.1 | % | |
| 7.8 | % | |
| 75.6 | % |
(1) Includes mainly the intangible assets generated
by acquisitions.
(2) Includes the effect of derivative financial instruments
on long-term debt.
February 23, 2024 | Page 15
Net Debt & Adjusted EBITDA ex-KOF
Amounts
expressed in millions of US Dollars (US.)
| | |
Twelve
months ended December 31, 2023 | |
| | |
Reported
Adj. EBITDA | | |
Adjustments | | |
Adj.
EBITDA Ex-KOF4 | |
| Proximity
Americas & Europe1 | |
| 2,649 | | |
| - | | |
| 2,649 | |
| Fuel | |
| 210 | | |
| - | | |
| 210 | |
| Health Division | |
| 465 | | |
| - | | |
| 465 | |
| Envoy Solutions | |
| - | | |
| - | | |
| - | |
| Coca-Cola
FEMSA2 | |
| 2,711 | | |
| (2,711 | ) | |
| - | |
| Other3 | |
| 70 | | |
| - | | |
| 70 | |
| FEMSA Consolidated | |
| 6,105 | | |
| (2,711 | ) | |
| 3,394 | |
| | |
| | | |
| | | |
| | |
| Dividends
Received4 | |
| - | | |
| 381 | | |
| 381 | |
| | |
| | | |
| | | |
| | |
| FEMSA Consolidated
ex-KOF | |
| 6,105 | | |
| (2,330 | ) | |
| 3,775 | |
| | |
As
of December 31, 2023 | |
| | |
Reported | | |
Adjustments | | |
Ex-KOF | |
| Cash & Equivalents | |
| 9,514 | | |
| - | | |
| 9,514 | |
| Coca-Cola FEMSA Cash & Equivalents | |
| 1,838 | | |
| (1,838 | ) | |
| - | |
| Cash & Equivalents | |
| 11,352 | | |
| (1,838 | ) | |
| 9,514 | |
| | |
| | | |
| | | |
| | |
| Financial
Debt5 | |
| 4,237 | | |
| - | | |
| 4,237 | |
| Coca-Cola FEMSA Financial Debt | |
| 3,859 | | |
| (3,859 | ) | |
| - | |
| Lease Liabilities | |
| 5,580 | | |
| - | | |
| 5,580 | |
| Coca-Cola FEMSA Lease Liabilities | |
| 105 | | |
| (105 | ) | |
| - | |
| Debt | |
| 13,781 | | |
| (3,964 | ) | |
| 9,818 | |
| | |
| | | |
| | | |
| | |
| FEMSA Net Debt | |
| 2,430 | | |
| (2,126 | ) | |
| 304 | |
Translated
to USD for readers’ convenience using the exchange rate published by the Federal Reserve Bank of New York for December 31, 2023
which was 16.8998 MXN per USD.
1
Includes Proximity Europe only for the consolidated period.
2
Coca-Cola FEMSA adjustment represents 100% of its LTM Adjusted EBITDA.
3
Includes FEMSA Other Businesses (including Solistica and Digital@FEMSA), FEMSA corporate expenses and the effects of consolidation
adjustments
4 Reflects cash dividends received
from Coca-Cola FEMSA for approximately US$316 mm, and US$57 mm from Heineken during the last twelve months.
5 Includes EUR€ 500.0 mm in
notes convertible to Heineken Holding N.V. shares.
February 23, 2024 | Page 16
Proximity Americas – Results of Operations
Amounts expressed in millions of Mexican Pesos (Ps.)
| | |
For the fourth quarter of: |
|
For the twelve months of: | |
| | |
2023 | | |
% of
rev. | | |
2022 | | |
% of
rev. | | |
% Var. | | |
2023 | | |
% of
rev. | | |
2022 | | |
% of
rev. | | |
% Var. | |
| Total revenues | |
| 71,530 | | |
| 100.0 | | |
| 62,652 | | |
| 100.0 | | |
| 14.2 | | |
| 278,520 | | |
| 100.0 | | |
| 233,958 | | |
| 100.0 | | |
| 19.0 | |
| Cost of sales | |
| 39,078 | | |
| 54.6 | | |
| 34,953 | | |
| 55.8 | | |
| 11.8 | | |
| 161,458 | | |
| 58.0 | | |
| 136,372 | | |
| 58.3 | | |
| 18.4 | |
| Gross profit | |
| 32,452 | | |
| 45.4 | | |
| 27,699 | | |
| 44.2 | | |
| 17.2 | | |
| 117,062 | | |
| 42.0 | | |
| 97,586 | | |
| 41.7 | | |
| 20.0 | |
| Administrative expenses | |
| 2,006 | | |
| 2.8 | | |
| 1,694 | | |
| 2.7 | | |
| 18.4 | | |
| 6,514 | | |
| 2.3 | | |
| 6,066 | | |
| 2.6 | | |
| 7.4 | |
| Selling expenses | |
| 22,806 | | |
| 31.9 | | |
| 18,057 | | |
| 28.8 | | |
| 26.3 | | |
| 84,493 | | |
| 30.4 | | |
| 67,842 | | |
| 28.9 | | |
| 24.5 | |
| Other operating expenses (income), net | |
| (380 | ) | |
| (0.5 | ) | |
| 7 | | |
| - | | |
| N.S.
| | |
| (216 | ) | |
| (0.1 | ) | |
| 165 | | |
| 0.1 | | |
| N.S.
| |
| Income from operations | |
| 8,020 | | |
| 11.2 | | |
| 7,941 | | |
| 12.7 | | |
| 1.0 | | |
| 26,271 | | |
| 9.4 | | |
| 23,513 | | |
| 10.1 | | |
| 11.7 | |
| Depreciation | |
| 3,229 | | |
| 4.5 | | |
| 2,870 | | |
| 4.6 | | |
| 12.5 | | |
| 12,437 | | |
| 4.5 | | |
| 11,101 | | |
| 4.7 | | |
| 12.0 | |
| Amortization & other non-cash
charges | |
| 237 | | |
| 0.4 | | |
| 161 | | |
| 0.2 | | |
| 47.2 | | |
| 976 | | |
| 0.3 | | |
| 928 | | |
| 0.4 | | |
| 5.2 | |
| Adjusted EBITDA | |
| 11,486 | | |
| 16.1 | | |
| 10,972 | | |
| 17.5 | | |
| 4.7 | | |
| 39,684 | | |
| 14.2 | | |
| 35,542 | | |
| 15.2 | | |
| 11.7 | |
| CAPEX | |
| 3,972 | | |
| | | |
| 3,156 | | |
| | | |
| 25.9 | | |
| 13,776 | | |
| | | |
| 9,931 | | |
| | | |
| 38.7 | |
| Information of OXXO Stores | |
| | |
| | |
| | |
| | |
| | |
| |
| Total stores | |
| | | |
| | | |
| | | |
| 22,866 | | |
| 21,458 | | |
| 6.6 | |
| Stores Mexico | |
| | | |
| | | |
| | | |
| 21,970 | | |
| 20,883 | | |
| 5.2 | |
| Stores South America | |
| | | |
| | | |
| | | |
| 896 | | |
| 575 | | |
| 55.8 | |
| | |
| | | |
| | | |
| | | |
| | | |
| | | |
| | |
| Net new convenience stores: | |
| | | |
| | | |
| | | |
| | | |
| | | |
| | |
| vs. Last quarter | |
| 514 | | |
| 559 | | |
| (8.1 | ) | |
| | | |
| | | |
| | |
| Year-to-date | |
| 1,408 | | |
| 1,027 | | |
| 37.1 | | |
| | | |
| | | |
| | |
| Last-twelve-months | |
| 1,408 | | |
| 1,027 | | |
| 37.1 | | |
| | | |
| | | |
| | |
| | |
| | | |
| | | |
| | | |
| | | |
| | | |
| | |
| Same-store
data: (1) | |
| | | |
| | | |
| | | |
| | | |
| | | |
| | |
| Sales (thousands of pesos) | |
| 989.9 | | |
| 912.5 | | |
| 8.5 | | |
| 993.6 | | |
| 869.8 | | |
| 14.2 | |
| Traffic (thousands of transactions) | |
| 18.2 | | |
| 17.8 | | |
| 2.1 | | |
| 18.6 | | |
| 17.5 | | |
| 5.8 | |
| Ticket (pesos) | |
| 54.5 | | |
| 51.3 | | |
| 6.3 | | |
| 53.5 | | |
| 49.6 | | |
| 8.0 | |
(1) Monthly average information per store, considering
same stores with more than twelve months of operations, income from services are included.
February 23, 2024 | Page 17
Proximity Europe – Results of Operations1
Amounts expressed in millions of Mexican Pesos (Ps.)
| | |
For the
fourth quarter of: | | |
For the
twelve months of: | |
| | |
| 2023 | | |
| % of
rev. | | |
| 2022 | | |
| % of
rev. | | |
| %
Var. | | |
| 2023 | | |
| % of
rev. | | |
| 20221 | | |
| % of
rev. | | |
| %
Var. | |
| Total revenues | |
| 11,415 | | |
| 100.0 | | |
| 9,809 | | |
| 100.0 | | |
| 16.4 | | |
| 43,552 | | |
| 100.0 | | |
| 9,809 | | |
| 100.0 | | |
| NA | |
| Cost of sales | |
| 6,295 | | |
| 55.1 | | |
| 5,210 | | |
| 53.1 | | |
| 20.8 | | |
| 24,930 | | |
| 57.2 | | |
| 5,210 | | |
| 53.1 | | |
| NA | |
| Gross profit | |
| 5,120 | | |
| 44.9 | | |
| 4,599 | | |
| 46.9 | | |
| 11.3 | | |
| 18,622 | | |
| 42.8 | | |
| 4,599 | | |
| 46.9 | | |
| NA | |
| Administrative expenses | |
| 896 | | |
| 7.8 | | |
| 1,294 | | |
| 13.2 | | |
| (30.8 | ) | |
| 3,231 | | |
| 7.4 | | |
| 1,294 | | |
| 13.2 | | |
| NA | |
| Selling expenses | |
| 3,955 | | |
| 34.7 | | |
| 3,112 | | |
| 31.7 | | |
| 27.1 | | |
| 14,371 | | |
| 33.1 | | |
| 3,112 | | |
| 31.7 | | |
| NA
| |
| Other operating expenses (income), net | |
| (325 | ) | |
| (2.8 | ) | |
| (139 | ) | |
| (1.4 | ) | |
| 133.8 | | |
| (379 | ) | |
| (0.9 | ) | |
| (139 | ) | |
| (1.4 | ) | |
| NA | |
| Income from operations | |
| 594 | | |
| 5.2 | | |
| 332 | | |
| 3.4 | | |
| 78.9 | | |
| 1,399 | | |
| 3.2 | | |
| 332 | | |
| 3.4 | | |
| NA | |
| Depreciation | |
| 1,145 | | |
| 10.0 | | |
| 777 | | |
| 7.9 | | |
| 47.4 | | |
| 4,406 | | |
| 10.1 | | |
| 777 | | |
| 7.9 | | |
| NA
| |
| Amortization & other non-cash charges | |
| 106 | | |
| 1.0 | | |
| 54 | | |
| 0.6 | | |
| 96.3 | | |
| 442 | | |
| 1.0 | | |
| 54 | | |
| 0.6 | | |
| NA | |
| Adjusted EBITDA | |
| 1,845 | | |
| 16.2 | | |
| 1,163 | | |
| 11.9 | | |
| 58.6 | | |
| 6,247 | | |
| 14.3 | | |
| 1,163 | | |
| 11.9 | | |
| NA | |
| CAPEX | |
| 912 | | |
| 8 | | |
| 544 | | |
| 5.5 | | |
| 67.7 | | |
| 1,654 | | |
| 3.8 | | |
| 544 | | |
| 5.5 | | |
| NA | |
1 The Proximity Europe segment is comprised of Valora. The acquisition of Valora was concluded in October 2022, the financial summary
reflects 2 months and 23 days in both years for comparability purposes..
February 23, 2024 | Page 18
Health Division – Results of Operations
Amounts expressed in millions of Mexican Pesos (Ps.)
| | |
For
the fourth quarter of: | | |
For
the twelve months of: | |
| | |
2023 | | |
%
of rev. | | |
2022 | | |
%
of rev. | | |
%
Var. | | |
2023 | | |
%
of rev. | | |
2022 | | |
%
of rev. | | |
%
Var. | |
| Total revenues | |
| 19,254 | | |
| 100.0 | | |
| 18,774 | | |
| 100.0 | | |
| 2.6 | | |
| 75,358 | | |
| 100.0 | | |
| 74,800 | | |
| 100.0 | | |
| 0.7 | |
| Cost of sales | |
| 13,632 | | |
| 70.8 | | |
| 13,085 | | |
| 69.7 | | |
| 4.2 | | |
| 52,859 | | |
| 70.1 | | |
| 52,817 | | |
| 70.6 | | |
| 0.1 | |
| Gross profit | |
| 5,622 | | |
| 29.2 | | |
| 5,689 | | |
| 30.3 | | |
| (1.2 | ) | |
| 22,499 | | |
| 29.9 | | |
| 21,983 | | |
| 29.4 | | |
| 2.3 | |
| Administrative expenses | |
| 550 | | |
| 2.9 | | |
| 783 | | |
| 4.2 | | |
| (29.8 | ) | |
| 2,788 | | |
| 3.7 | | |
| 2,918 | | |
| 3.9 | | |
| (4.5 | ) |
| Selling expenses | |
| 4,535 | | |
| 23.5 | | |
| 3,903 | | |
| 20.8 | | |
| 16.2 | | |
| 16,402 | | |
| 21.8 | | |
| 15,139 | | |
| 20.2 | | |
| 8.3 | |
| Other operating
expenses (income), net | |
| (36 | ) | |
| (0.2 | ) | |
| (11 | ) | |
| (0.1 | ) | |
| N.S.
| | |
| (20 | ) | |
| - | | |
| (12 | ) | |
| - | | |
| 66.7 | |
| Income from
operations | |
| 573 | | |
| 3.0 | | |
| 1,014 | | |
| 5.4 | | |
| (43.5 | ) | |
| 3,329 | | |
| 4.4 | | |
| 3,938 | | |
| 5.3 | | |
| (15.5 | ) |
| Depreciation | |
| 788 | | |
| 4.1 | | |
| 731 | | |
| 3.9 | | |
| 7.8 | | |
| 3,099 | | |
| 4.1 | | |
| 2,934 | | |
| 3.9 | | |
| 5.6 | |
| Amortization&
other non-cash charges | |
| 901 | | |
| 4.6 | | |
| 201 | | |
| 1.1 | | |
| N.S.
| | |
| 1,645 | | |
| 2.2 | | |
| 751 | | |
| 1.0 | | |
| 119.0 | |
| Adjusted
EBITDA | |
| 2,262 | | |
| 11.7 | | |
| 1,946 | | |
| 10.4 | | |
| 16.2 | | |
| 8,073 | | |
| 10.7 | | |
| 7,623 | | |
| 10.2 | | |
| 5.9 | |
| CAPEX | |
| 755 | | |
| | | |
| 1,604 | | |
| | | |
| (53.0 | ) | |
| 1,750 | | |
| | | |
| 2,868 | | |
| | | |
| (39.0 | ) |
| | |
| | | |
| | | |
| | | |
| | | |
| | | |
| | | |
| | | |
| | | |
| | | |
| | |
| Information of Stores | |
| | | |
| | | |
| | | |
| | | |
| | | |
| | | |
| | | |
| | | |
| | | |
| | |
| Total stores | |
| | | |
| | | |
| | | |
| | | |
| | | |
| 4,474 | | |
| | | |
| 4,095 | | |
| | | |
| 9.3 | |
| Stores Mexico | |
| | | |
| | | |
| | | |
| | | |
| | | |
| 1,759 | | |
| | | |
| 1,575 | | |
| | | |
| 11.7 | |
| Stores South America | |
| | | |
| | | |
| | | |
| | | |
| | | |
| 2,715 | | |
| | | |
| 2,520 | | |
| | | |
| 7.7 | |
| | |
| | | |
| | | |
| | | |
| | | |
| | | |
| | | |
| | | |
| | | |
| | | |
| | |
| Net new stores: | |
| | | |
| | | |
| | | |
| | | |
| | | |
| | | |
| | | |
| | | |
| | | |
| | |
| vs. Last
quarter | |
| 127 | | |
| | | |
| 124 | | |
| | | |
| 2.4 | | |
| | | |
| | | |
| | | |
| | | |
| | |
| Year-to-date | |
| 379 | | |
| | | |
| 434 | | |
| | | |
| (12.7 | ) | |
| | | |
| | | |
| | | |
| | | |
| | |
| Last-twelve-months | |
| 379 | | |
| | | |
| 434 | | |
| | | |
| (12.7 | ) | |
| | | |
| | | |
| | | |
| | | |
| | |
| | |
| | | |
| | | |
| | | |
| | | |
| | | |
| | | |
| | | |
| | | |
| | | |
| | |
| Same-store
data: (1) | |
| | | |
| | | |
| | | |
| | | |
| | | |
| | | |
| | | |
| | | |
| | | |
| | |
| Sales
(thousands of pesos) | |
| 1,128.3 | | |
| | | |
| 1,073.3 | | |
| | | |
| 5.1 | | |
| 1,138.8 | | |
| | | |
| 1,072.9 | | |
| 6.1 | | |
| | |
(1) Monthly average information per store, considering
same stores with more than twelve months of all the retail operations of the Health Division.
February 23, 2024 | Page 19
Fuel – Results of Operations
Amounts expressed in millions of Mexican Pesos (Ps.)
| | |
For
the fourth quarter of: | | |
For
the twelve months of: | |
| | |
2023 | | |
%
of rev. | | |
2022 | | |
%
of rev. | | |
%
Var. | | |
2023 | | |
%
of rev. | | |
2022 | | |
%
of rev. | | |
%
Var. | |
| Total revenues | |
| 15,121 | | |
| 100.0 | | |
| 13,875 | | |
| 100.0 | | |
| 9.0 | | |
| 58,499 | | |
| 100.0 | | |
| 51,813 | | |
| 100.0 | | |
| 12.9 | |
| Cost of sales | |
| 13,099 | | |
| 86.6 | | |
| 12,050 | | |
| 86.8 | | |
| 8.7 | | |
| 51,155 | | |
| 87.4 | | |
| 45,253 | | |
| 87.3 | | |
| 13.0 | |
| Gross profit | |
| 2,022 | | |
| 13.4 | | |
| 1,825 | | |
| 13.2 | | |
| 10.8 | | |
| 7,344 | | |
| 12.6 | | |
| 6,560 | | |
| 12.7 | | |
| 12.0 | |
| Administrative expenses | |
| 100 | | |
| 0.7 | | |
| 78 | | |
| 0.6 | | |
| 28.2 | | |
| 299 | | |
| 0.5 | | |
| 227 | | |
| 0.4 | | |
| 31.7 | |
| Selling expenses | |
| 1,245 | | |
| 8.2 | | |
| 1,122 | | |
| 8.1 | | |
| 11.0 | | |
| 4,548 | | |
| 7.8 | | |
| 4,084 | | |
| 8.0 | | |
| 11.4 | |
| Other operating
expenses (income), net | |
| (20 | ) | |
| (0.1 | ) | |
| 11 | | |
| 0.1 | | |
| N.S.
| | |
| (1 | ) | |
| - | | |
| (1 | ) | |
| - | | |
| - | |
| Income
from operations | |
| 697 | | |
| 4.6 | | |
| 614 | | |
| 4.4 | | |
| 13.5 | | |
| 2,498 | | |
| 4.3 | | |
| 2,250 | | |
| 4.3 | | |
| 11.0 | |
| Depreciation | |
| 286 | | |
| 1.9 | | |
| 270 | | |
| 1.9 | | |
| 5.9 | | |
| 1,130 | | |
| 1.9 | | |
| 1,054 | | |
| 2.0 | | |
| 7.2 | |
| Amortization& other non-cash
charges | |
| (40 | ) | |
| (0.3 | ) | |
| 36 | | |
| 0.3 | | |
| N.S.
| | |
| 21 | | |
| - | | |
| 67 | | |
| 0.2 | | |
| (68.7 | ) |
| Adjusted
EBITDA | |
| 943 | | |
| 6.2 | | |
| 920 | | |
| 6.6 | | |
| 2.5 | | |
| 3,649 | | |
| 6.2 | | |
| 3,371 | | |
| 6.5 | | |
| 8.2 | |
| CAPEX | |
| 70 | | |
| | | |
| 99 | | |
| | | |
| (28.8 | ) | |
| 186 | | |
| | | |
| 157 | | |
| | | |
| 18.7 | |
| | |
| | | |
| | | |
| | | |
| | | |
| | | |
| | | |
| | | |
| | | |
| | | |
| | |
| Information of OXXO GAS
Service Stations | |
| | | |
| | | |
| | | |
| | | |
| | | |
| | | |
| | | |
| | | |
| | | |
| | |
| Total stores | |
| | | |
| | | |
| | | |
| | | |
| | | |
| 571 | | |
| | | |
| 568 | | |
| | | |
| 0.5 | |
| Net new convenience stores: | |
| | | |
| | | |
| | | |
| | | |
| | | |
| | | |
| | | |
| | | |
| | | |
| | |
| vs. Last quarter | |
| 0 | | |
| | | |
| 0 | | |
| | | |
| - | | |
| | | |
| | | |
| | | |
| | | |
| | |
| Year-to-date | |
| 3 | | |
| | | |
| 1 | | |
| | | |
| N.S | | |
| | | |
| | | |
| | | |
| | | |
| | |
| Last-twelve-months | |
| 3 | | |
| | | |
| 1 | | |
| | | |
| N.S | | |
| | | |
| | | |
| | | |
| | | |
| | |
| Volume (millions of liters) total stations | |
| 616 | | |
| | | |
| 613 | | |
| | | |
| 0.6 | | |
| 1,840 | | |
| | | |
| 1,755 | | |
| | | |
| 4.8 | |
| Same-store data: (1) | |
| | | |
| | | |
| | | |
| | | |
| | | |
| | | |
| | | |
| | | |
| | | |
| | |
| Sales (thousands of pesos) | |
| 7,982.7 | | |
| | | |
| 7,616.9 | | |
| | | |
| 4.8 | | |
| 7,506.4 | | |
| | | |
| 6,964.2 | | |
| | | |
| 7.8 | |
| Traffic (thousands of liters) | |
| 382.3 | | |
| | | |
| 374.3 | | |
| | | |
| 2.1 | | |
| 361.2 | | |
| | | |
| 346.8 | | |
| | | |
| 4.1 | |
| Average price per liter | |
| 20.9 | | |
| | | |
| 20.3 | | |
| | | |
| 2.6 | | |
| 20.8 | | |
| | | |
| 20.1 | | |
| | | |
| 3.5 | |
(A) Unaudited consolidated financial information.
(1) Monthly average information per station, considering
same stations with more than twelve months of operations.
February 23, 2024 | Page 20
Coca-Cola FEMSA – Results of Operations
Amounts expressed in millions of Mexican Pesos (Ps.)
| | |
For the fourth quarter of: | | |
For the twelve months of: | |
| | |
2023 | | |
%
of rev. | | |
2022 | | |
%
of rev. | | |
% Var. | | |
2023 | | |
%
of rev. | | |
2022 | | |
%
of rev. | | |
% Var. | |
| Total revenues | |
| 66,190 | | |
| 100.0 | | |
| 61,209 | | |
| 100.0 | | |
| 8.1 | | |
| 245,088 | | |
| 100.0 | | |
| 226,740 | | |
| 100.0 | | |
| 8.1 | |
| Cost of sales | |
| 35,664 | | |
| 53.9 | | |
| 34,142 | | |
| 55.8 | | |
| 4.5 | | |
| 134,229 | | |
| 54.8 | | |
| 126,441 | | |
| 55.8 | | |
| 6.2 | |
| Gross profit | |
| 30,526 | | |
| 46.1 | | |
| 27,068 | | |
| 44.2 | | |
| 12.8 | | |
| 110,860 | | |
| 45.2 | | |
| 100,300 | | |
| 44.2 | | |
| 10.5 | |
| Administrative expenses | |
| 3,137 | | |
| 4.7 | | |
| 3,049 | | |
| 5.0 | | |
| 2.9 | | |
| 12,820 | | |
| 5.2 | | |
| 11,263 | | |
| 5.0 | | |
| 13.8 | |
| Selling expenses | |
| 17,315 | | |
| 26.2 | | |
| 14,819 | | |
| 24.2 | | |
| 16.8 | | |
| 63,278 | | |
| 25.9 | | |
| 57,718 | | |
| 25.4 | | |
| 9.6 | |
| Other operating expenses (income), net | |
| 390 | | |
| 0.6 | | |
| 187 | | |
| 0.3 | | |
| 108.6 | | |
| 582 | | |
| 0.2 | | |
| 481 | | |
| 0.2 | | |
| 21.0 | |
| Income from operations | |
| 9,684 | | |
| 14.6 | | |
| 9,013 | | |
| 14.7 | | |
| 7.4 | | |
| 34,180 | | |
| 13.9 | | |
| 30,838 | | |
| 13.6 | | |
| 10.8 | |
| Depreciation | |
| 2,638 | | |
| 4.0 | | |
| 2,397 | | |
| 3.9 | | |
| 10.1 | | |
| 9,695 | | |
| 4.0 | | |
| 9,657 | | |
| 4.3 | | |
| 0.4 | |
| Amortization & other non-cash charges | |
| 849 | | |
| 1.3 | | |
| 544 | | |
| 0.9 | | |
| 56.1 | | |
| 2,543 | | |
| 1.0 | | |
| 2,506 | | |
| 1.1 | | |
| 1.5 | |
| Adjusted EBITDA | |
| 13,171 | | |
| 19.9 | | |
| 11,954 | | |
| 19.5 | | |
| 10.2 | | |
| 46,418 | | |
| 18.9 | | |
| 43,001 | | |
| 19.0 | | |
| 7.9 | |
| CAPEX | |
| 9,683 | | |
| | | |
| 8,489 | | |
| | | |
| 14.1 | | |
| 21,396 | | |
| | | |
| 19,665 | | |
| | | |
| 8.8 | |
| | |
| | | |
| | | |
| | | |
| | | |
| | | |
| | | |
| | | |
| | | |
| | | |
| | |
| Sales Volumes | |
| | | |
| | | |
| | | |
| | | |
| | | |
| | | |
| | | |
| | | |
| | | |
| | |
| (Millions of unit cases) | |
| | | |
| | | |
| | | |
| | | |
| | | |
| | | |
| | | |
| | | |
| | | |
| | |
| Mexico and Central America | |
| 580.9 | | |
| 55.0 | | |
| 547.9 | | |
| 55.0 | | |
| 6.0 | | |
| 2,394.8 | | |
| 59.2 | | |
| 2,188.4 | | |
| 58.3 | | |
| 9.4 | |
| South America | |
| 157.4 | | |
| 14.9 | | |
| 151.7 | | |
| 15.2 | | |
| 3.8 | | |
| 577.9 | | |
| 14.3 | | |
| 550.6 | | |
| 14.7 | | |
| 5.0 | |
| Brazil | |
| 318.0 | | |
| 30.1 | | |
| 295.8 | | |
| 29.7 | | |
| 7.5 | | |
| 1,075.1 | | |
| 26.6 | | |
| 1,016.2 | | |
| 27.1 | | |
| 5.8 | |
| Total | |
| 1,056.2 | | |
| 100.0 | | |
| 995.3 | | |
| 100.0 | | |
| 6.1 | | |
| 4,047.8 | | |
| 100.0 | | |
| 3,755.2 | | |
| 100.0 | | |
| 7.8 | |
(1) Organic basis (% Org.) excludes the effects of
significant mergers and acquisitions in the last twelve months.
February 23, 2024 | Page 21
FEMSA Macroeconomic Information
| | |
Inflation | | |
End-of-period Exchange Rates | |
| | |
| | |
| | |
Dec-23 | | |
Dec-22 | |
| | |
| | |
LTM
(1) | | |
| | |
| | |
| | |
| |
| | |
4Q 2023 | | |
Dec-23 | | |
Per USD | | |
Per MXN | | |
Per USD | | |
Per MXN | |
| Mexico | |
| 1.75 | % | |
| 4.66 | % | |
| 16.89 | | |
| 1.0000 | | |
| 19.36 | | |
| 1.0000 | |
| Colombia | |
| 1.36 | % | |
| 9.28 | % | |
| 3,822.05 | | |
| 0.0044 | | |
| 4,810.20 | | |
| 0.0040 | |
| Brazil | |
| 0.94 | % | |
| 4.62 | % | |
| 4.84 | | |
| 3.4895 | | |
| 5.22 | | |
| 3.7107 | |
| Argentina | |
| 60.86 | % | |
| 211.41 | % | |
| 808.45 | | |
| 0.0209 | | |
| 177.16 | | |
| 0.1093 | |
| Chile | |
| 1.07 | % | |
| 3.94 | % | |
| 877.12 | | |
| 0.0193 | | |
| 855.86 | | |
| 0.0226 | |
| Euro Zone | |
| -0.53 | % | |
| 2.91 | % | |
| 0.90 | | |
| 18.7611 | | |
| 0.94 | | |
| 20.6519 | |
(1) LTM = Last twelve months.
February 23, 2024 | Page 22

Mexico
City, February 22, 2024, Coca-Cola FEMSA, S.A.B. de C.V. (BMV: KOFUBL, NYSE: KOF) (“Coca-Cola FEMSA”, “KOF”
or the “Company”), the largest Coca-Cola franchise bottler in the world by sales volume, announces results for the fourth
quarter of 2023.
FOURTH QUARTER HIGHLIGHTS
| · | Volume
growth 6.1% |
| · | Revenue
growth 8.0% |
| · | Operating
income growth 7.3% |
| · | Majority
net income decreased 24.5% |
| · | Earnings
per share1 were Ps. 0.32. (Earnings per unit were Ps. 2.57 and per ADS were Ps.
25.67.) |
| · | Achieved
more than 1.1 million monthly active buyers on Juntos+, our omnichannel B2B platform |
FULL YEAR HIGHLIGHTS
| · | Volume
growth 7.8% —surpassing 4 billion unit cases for the first time in Coca-Cola FEMSA’s
history |
| · | Revenue
growth 8.1% |
| · | Operating
income growth 10.8% |
| · | Majority
net income growth 2.6% |
| · | Earnings
per share1 were Ps. 1.16. (Earnings per unit were Ps. 9.30 and per ADS were Ps.
92.99.) |
| · | Achieved
more than US$2.5 billion in digital revenues through Juntos+ |
FINANCIAL
SUMMARY FOR THE FOURTH QUARTER RESULTS
Change vs. same period of last year
| | |
| |
Total
Revenues | | |
Gross
Profit | | |
Operating
Income | | |
Majority
Net Income |
|
| | |
| |
4Q23 | | |
FY
2023 | | |
4Q23 | | |
FY
2023 | | |
4Q23 | | |
| FY
2023 | | |
4Q23 | | |
FY 2023 |
|
| | |
Consolidated | |
8.0 | % | |
8.1 | % | |
12.6 | % | |
10.5 | % | |
7.3 | % | |
| 10.8 | % | |
(24.5 | )% | |
2.6 |
% |
| As Reported | |
Mexico &
Central America | |
11.3 | % | |
14.0 | % | |
17.5 | % | |
15.5 | % | |
7.8 | % | |
| 10.6 | % | |
| |
|
|
|
| | |
South America | |
3.8 | % | |
(0.0 | )% | |
5.8 | % | |
2.4 | % | |
6.7 | % | |
| 11.3 | % | |
| |
|
|
|
| | |
| |
| | |
| | |
| | |
| | |
| | |
| | | |
| |
|
|
|
| | |
Consolidated | |
15.7 | % | |
18.0 | % | |
21.3 | % | |
20.5 | % | |
15.3 | % | |
| 19.4 | % | |
| |
|
|
|
| Comparable
(2) | |
Mexico &
Central America | |
13.1 | % | |
16.0 | % | |
19.4 | % | |
17.5 | % | |
10.0 | % | |
| 12.6 | % | |
| |
|
|
|
| | |
South America | |
19.5 | % | |
21.3 | % | |
24.3 | % | |
26.5 | % | |
23.6 | % | |
| 36.7 | % | |
| |
|
|
|
Ian Craig, Coca-Cola
FEMSA’s CEO, commented:
"We are pleased to report another
quarter of solid growth. Within our key markets, we achieved outstanding results, particularly in Mexico, Brazil, Colombia, and Guatemala.
These results enabled us to surpass 4 billion unit cases of NARTD volume for the year, underscoring our strategic focus on a sustainable
growth model across our markets.
This year also marked another milestone
in our digital transformation journey. We successfully accelerated the development and adoption of our digital platform Juntos +, achieving
more than 1.1 million monthly active users and digital sales of more than US$ 2.5 billion during the year. The integration of advanced
analytics and user experience improvements in version 4.0, is enabling us to serve our customers more effectively, driving both loyalty
and growth. Looking ahead, we are committed to further leveraging digital innovation and advanced analytics to stay ahead of consumer
trends, enhance our value proposition, and drive sustainable growth.
Finally, we continue to focus on developing
a consumer-centric culture, with psychological safety across all levels of our organization. This approach will continue to shape our
growth mindset as we aim to continue creating value for all of our customers, consumers, and stakeholders."
| (1) | Quarterly
earnings / outstanding shares. Earnings per share (EPS) were calculated using 16,806.7 million
shares outstanding. For the convenience of the reader, as a KOFUBL Unit is comprised of 8
shares (3 Series B shares and 5 Series L shares), earnings per unit are equal to
EPS multiplied by 8. Each ADS represents 10 KOFUBL Units. |
| (2) | Please
refer to page 10 for our definition of “comparable” and a description of
the factors affecting the comparability of our financial and operating performance. |
Coca-Cola FEMSA Reports 4Q23 Results February 22, 2024 | Page 2 of 17 |  |
RECENT
DEVELOPMENTS
| · | On
November 3, 2023, Coca-Cola FEMSA paid the second installment of the ordinary dividend
approved for Ps. 0.3625 per share, for a total cash distribution of Ps. 6,092 million. |
| · | On
November 27, 2023, Coca-Cola FEMSA announced an investment of Ps. 575 million to support
economic recovery and rehabilitate its operational units in the state of Guerrero affected
by Hurricane Otis. As part of its efforts to proactively address the needs of the affected
population and contribute to the swift recovery of communities, the Company has prioritized
humanitarian aid to its employees and the community, through in-kind donations addressing
the needs of the most affected population. |
| · | On
February 13, 2024, FEMSA and Coca-Cola FEMSA announced their inclusion in S&P Global’s
Sustainability Yearbook. This represented the fourth consecutive year and the sixth time
in the last decade that Coca-Cola FEMSA was included. In this edition, the Company achieved
high scores in Health and Nutrition, Water, Circularity and Resource Efficiency, Emissions,
and Transparency and Reporting. |
| · | On
February 15, 2024, Coca-Cola FEMSA announced that it will hold its Annual Shareholders'
Meeting on March 19, 2024. |
CONFERENCE
CALL INFORMATION

Coca-Cola FEMSA Reports 4Q23 Results February 22, 2024 | Page 3 of 17 | |
CONSOLIDATED
FOURTH QUARTER RESULTS
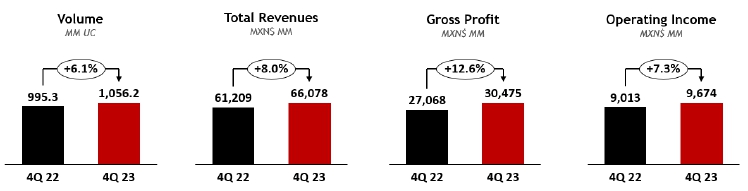
CONSOLIDATED FOURTH QUARTER RESULTS
| | |
As Reported | | |
Comparable (1) | |
| Expressed in millions of Mexican pesos | |
4Q 2023 | | |
4Q 2022 | | |
Δ% | | |
Δ% | |
| Total revenues | |
| 66,078 | | |
| 61,209 | | |
| 8.0 | % | |
| 15.7 | % |
| Gross profit | |
| 30,475 | | |
| 27,068 | | |
| 12.6 | % | |
| 21.3 | % |
| Operating income | |
| 9,674 | | |
| 9,013 | | |
| 7.3 | % | |
| 15.3 | % |
| Adj. EBITDA (2) | |
| 13,149 | | |
| 11,954 | | |
| 10.0 | % | |
| 19.3 | % |
Volume
increased 6.1% to 1,056.2 million unit cases, driven by volume growth in most of our territories, including a solid performance
in Mexico, Brazil, Guatemala, and Colombia, partially offset by a slight decrease in Argentina and Uruguay. Excluding the acquisition
of the Cristal bulk water business in Mexico, total volume would have increased 5.1%.
Total
revenues increased 8.0% to Ps. 66,078 million. This increase was driven mainly by volume growth, partially offset by unfavorable
currency translation effects from most of our operating currencies into Mexican Pesos. Excluding currency translation effects, total
revenues increased 15.7%.
Gross
profit increased 12.6% to Ps. 30,475 million, and gross margin increased 190 basis points to 46.1%. This expansion was driven
mainly by our top-line growth, easing packaging costs, and the appreciation of most of our operating currencies as applied to our U.S.
dollar-denominated raw material costs. These effects were partially offset by higher sweetener costs across our territories. Excluding
currency translation effects, gross profit increased 21.3%.
Operating
income increased 7.3% to Ps. 9,674 million, and operating margin decreased 10 basis points to 14.6%. This margin decrease
was driven mainly by an increase in expenses such as labor, marketing, and maintenance. In addition, the Company incurred temporary expenses
mostly related to the shipment of finished product to Acapulco as a result of hurricane Otis. These effects were partially offset by
a solid top-line performance, easing packaging costs, and the appreciation of most of our operating currencies as applied to our U.S.
dollar- denominated raw material costs. Excluding currency translation effects, operating income increased 15.3%
| (1) | Please
refer to page 10 for our definition of “comparable” and a description of
the factors affecting the comparability of our financial and operating performance. |
| (2) | Adjusted EBITDA = operating
income + depreciation + amortization & other operating non-cash charges. |
Coca-Cola FEMSA Reports 4Q23 Results February 22, 2024 | Page 4 of 17 | |
Comprehensive
financing result recorded an expense of Ps. 1,285 million, compared to an expense of Ps. 1,092 million in the previous year.
This increase was driven mainly by a lower gain in monetary positions in inflationary subsidiaries of Ps. 4 million, as compared to a
gain of Ps. 128 million during the same period of the previous year.
Additionally, we recorded an increase
in our interest expense, net, driven mainly by a decrease of Ps. 92 million in our interest income mainly related to the depreciation
of the Argentine Peso. Finally, we registered a foreign exchange loss of Ps. 317 million as compared to Ps. 281 million during the same
period of the previous year as our net cash exposure in U.S. dollars was negatively impacted by the appreciation of the Mexican Peso
and other operating currencies as compared to the previous quarter.
These effects were partially offset
by a (i) higher gain in financial instruments of Ps. 90 million as compared to a gain of Ps. 72 million during the previous year,
driven mainly by a decrease in interest rates in Brazil; and (ii) a lower interest expense related to the maturity of a Mexican
Peso denominated bond.
Income
tax as a percentage of income before taxes was 33.8% as compared to 7.7%. This increase was driven mainly by deferred taxes
recognized during the same period of the previous year that resulted in a lower effective tax rate in the fourth quarter of 2022.
Net
income attributable to equity holders of the company was Ps. 5,392 million as compared to Ps. 7,144 million during the same
period of the previous year. This decrease was driven mainly by the normalization of our effective tax rate as compared to the same period
of the previous year, coupled with an increase in our comprehensive financing result. Earnings per share1 were Ps. 0.32 (Earnings
per unit were Ps. 2.57 and per ADS were Ps. 25.67.). Normalizing the base effect of a lower effective tax rate during the same period
of the previous year, net income attributable to equity holders of the company increased 8.6%.
| (1) | Quarterly
earnings / outstanding shares. Earnings per share (EPS) were calculated using 16,806.7 million
shares outstanding. For the convenience of the reader, as a KOFUBL Unit is comprised of 8
shares (3 Series B shares and 5 Series L shares), earnings per unit are equal to
EPS multiplied by 8. Each ADS represents 10 KOFUBL Units. |
Coca-Cola FEMSA Reports 4Q23 Results February 22, 2024 | Page 5 of 17 | |
CONSOLIDATED FULL YEAR
RESULTS
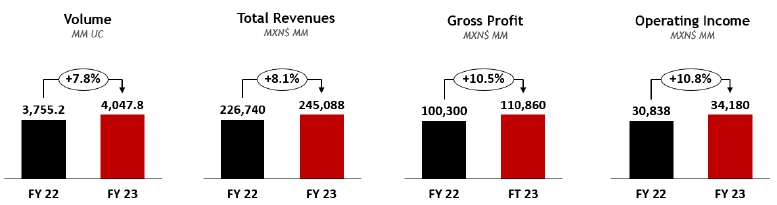
CONSOLIDATED FULL YEAR RESULTS
| | |
As Reported | | |
Comparable (1) | |
| Expressed in millions of Mexican pesos | |
FY 2023 | | |
FY 2022 | | |
Δ% | | |
Δ% | |
| Total revenues | |
| 245,088 | | |
| 226,740 | | |
| 8.1 | % | |
| 18.0 | % |
| Gross profit | |
| 110,860 | | |
| 100,300 | | |
| 10.5 | % | |
| 20.5 | % |
| Operating income | |
| 34,180 | | |
| 30,838 | | |
| 10.8 | % | |
| 19.4 | % |
| Adj. EBITDA (2) | |
| 46,418 | | |
| 43,001 | | |
| 7.9 | % | |
| 17.6 | % |
Volume
increased 7.8% to 4,047.8 million unit cases, driven by volume growth in all of our territories, including a strong performance
in Mexico, Brazil, Colombia and Guatemala. Excluding the acquisition of the Cristal bulk water business in Mexico, total volume would
have increased 6.1%.
Total
revenues increased 8.1% to Ps. 245,088 million driven by volume growth, revenue management initiatives, and favorable mix
effects. These factors were partially offset by unfavorable currency translation effects from most of our operating currencies into Mexican
Pesos. Excluding currency translation effects, total revenues increased 18.0%.
Gross
profit increased 10.5% to Ps. 110,860 million, and gross margin increased 100 basis points to 45.2%. This gross profit increase
was driven mainly by our top-line growth, easing packaging costs, and favorable raw material hedging initiatives. These effects were
partially offset by higher sweetener costs across our territories. Excluding currency translation effects, gross profit increased 20.5%.
Operating
income increased 10.8% to Ps. 34,180 million, and operating margin increased 30 basis points to 13.9%. This growth was driven
mainly by a solid top-line performance and an operating foreign exchange gain in Mexico as a result of the appreciation of the Mexican
Peso. These effects were partially offset by an increase in raw material costs, mainly sweeteners, coupled with an increase in operating
expenses such as labor, marketing, and maintenance. Excluding currency translation effects, operating income increased 19.4%.
| (1) | Please
refer to page 10 for our definition of “comparable” and a description of
the factors affecting the comparability of our financial and operating performance. |
| (2) | Adjusted
EBITDA = operating income + depreciation + amortization & other operating non-cash
charges. |
Coca-Cola FEMSA Reports 4Q23 Results February 22, 2024 | Page 6 of 17 | |
Comprehensive
financing result recorded an expense of Ps. 4,697 million, compared to an expense of Ps. 4,549 million in the previous year.
This increase was driven mainly by a higher foreign exchange loss of Ps. 1,046 million as compared to a loss of Ps. 324 million during
the same period of the previous year, as our net cash exposure in U.S. dollars was negatively impacted by the appreciation of the Mexican
Peso. In addition, we recorded a gain in monetary position in inflationary subsidiaries of Ps. 93 million as compared to a gain of Ps.
536 million during the same period of the previous year.
These effects were partially offset
by a gain in financial instruments of Ps. 169 million as compared to a loss of Ps. 672 million during the same period of the previous
year. This was driven mainly by a market value loss recorded during the first quarter of 2022, partially offset by a market value gain
recognized during the second quarter of 2022. In accordance with IFRS 9, as of the second quarter of 2022, we are recognizing the hedging
gain or loss on the debt instrument that is being hedged using interest rate derivatives.
In addition, we recorded a decrease
in our interest expense, net of 4.3% mainly as a result of a gain in our interest income that was driven by an increase in interest rates.
Income
tax as a percentage of income before taxes was 30.5% as compared to 25.4%. This increase was driven mainly by deferred taxes
recognized during the same period of the previous year that resulted in a lower effective tax rate.
Net
income attributable to equity holders of the company increased 2.6% to reach Ps. 19,536 million as compared to Ps. 19,034
million during the same period of the previous year. This increase was driven mainly by operating income growth, partially offset by
an increase in income tax. Earnings per share1 were Ps. 1.16 (Earnings per unit were Ps. 9.30 and per ADS were Ps. 92.99.).
| (1) | Quarterly
earnings / outstanding shares. Earnings per share (EPS) were calculated using 16,806.7 million
shares outstanding. For the convenience of the reader, as a KOFUBL Unit is comprised of 8
shares (3 Series B shares and 5 Series L shares), earnings per unit are equal to
EPS multiplied by 8. Each ADS represents 10 KOFUBL Units. |
Coca-Cola FEMSA Reports 4Q23 Results February 22, 2024 | Page 7 of 17 | |
MEXICO &
CENTRAL AMERICA DIVISION fourth QUARTER RESULTS
| (Mexico,
Guatemala, Costa Rica, Panama, and Nicaragua) |
 |
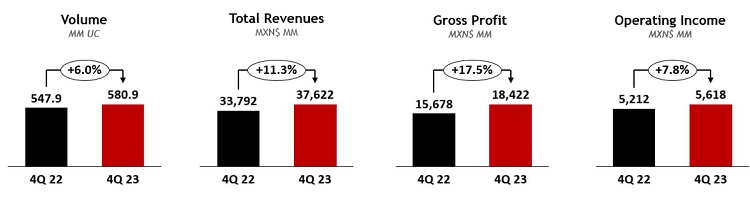
| MEXICO &
CENTRAL AMERICA DIVISION RESULTS |
| |
|
|
|
|
|
|
| | |
As Reported | | |
Comparable (1) | |
| Expressed in millions of Mexican pesos | |
4Q 2023 | | |
4Q 2022 | | |
Δ% | | |
Δ% | |
| Total revenues | |
| 37,622 | | |
| 33,792 | | |
| 11.3 | % | |
| 13.1 | % |
| Gross profit | |
| 18,422 | | |
| 15,678 | | |
| 17.5 | % | |
| 19.4 | % |
| Operating income | |
| 5,618 | | |
| 5,212 | | |
| 7.8 | % | |
| 10.0 | % |
| Adj. EBITDA (2) | |
| 7,704 | | |
| 6,902 | | |
| 11.6 | % | |
| 13.7 | % |
Volume
increased 6.0% driven mainly by solid growth in Mexico and Guatemala. These volumes include the integration of the Cristal
bulk water business; excluding this effect, volume would have increased 4.2% in the division and 3.1% in Mexico.
Total
revenues increased 11.3% to Ps. 37,622 million, driven mainly by volume growth and revenue management initiatives, partially
offset by unfavorable currency translation effects from most of our operating currencies in Central America. Excluding currency translation
effects, total revenues increased 13.1%.
Gross
profit increased 17.5% to Ps. 18,422 million, and gross margin expanded 260 basis points to 49.0%. This margin expansion was
driven mainly by our top-line growth, easing packaging costs, and the appreciation of the Mexican Peso as applied to our U.S. dollar-denominated
raw material costs. These effects were partially offset by an increase in sweeteners costs. Excluding currency translation effects, gross
profit increased 19.4%.
Operating
income increased 7.8% to Ps. 5,618 million, and operating margin contracted 50 basis points to 14.9%, driven mainly by an
increase in operating expenses such as labor, maintenance, and marketing. In addition, the Company incurred temporary expenses mostly
related to the shipment of finished product to Acapulco as a result of hurricane Otis. This impact was mostly limited to the fourth quarter,
as our production facility in Guerrero is now operating normally. These effects were partially offset by our top-line and gross profit
growth. Excluding currency translation effects, operating income increased 10.0%.
| (1) | Please
refer to page 10 for our definition of “comparable” and a description of
the factors affecting the comparability of our financial and operating performance. |
| (2) | Adjusted
EBITDA = operating income + depreciation + amortization & other operating non-cash
charges. |
Coca-Cola FEMSA Reports 4Q23 Results February 22, 2024 | Page 8 of 17 | |
SOUTH
AMERICA DIVISION FOURTH QUARTER RESULTS
| (Brazil, Argentina, Colombia, and Uruguay) |
 |
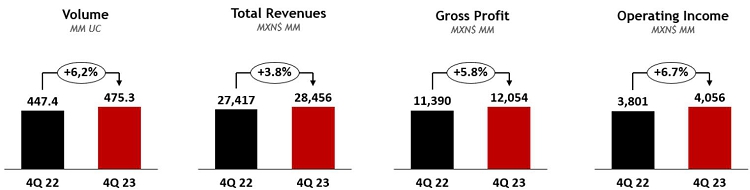
| SOUTH AMERICA DIVISION RESULTS |
| | |
| | |
| | |
| | |
| |
| | |
As Reported | | |
Comparable (1) | |
| Expressed in millions of Mexican pesos | |
4Q 2023 | | |
4Q 2022 | | |
Δ% | | |
Δ% | |
| Total revenues | |
| 28,456 | | |
| 27,417 | | |
| 3.8 | % | |
| 19.5 | % |
| Gross profit | |
| 12,054 | | |
| 11,390 | | |
| 5.8 | % | |
| 24.3 | % |
| Operating income | |
| 4,056 | | |
| 3,801 | | |
| 6.7 | % | |
| 23.6 | % |
| Adj. EBITDA (2) | |
| 5,444 | | |
| 5,052 | | |
| 7.8 | % | |
| 28.3 | % |
Volume
increased 6.2%, driven by growth in Brazil and Colombia, partially offset by a slight decrease in Argentina and Uruguay.
Total
revenues increased 3.8% to Ps. 28,456 million. This increase was driven mainly by volume growth, offset by unfavorable currency
translation effects of most of our operating currencies in the division into Mexican Pesos. Excluding currency translation effects, total
revenues increased 19.5%.
Gross
profit increased 5.8% to Ps. 12,054 million, and gross margin expanded 90 basis points to 42.4%. This increase was driven
mainly by our top-line growth, easing packaging costs, and the appreciation of most of our operating currencies as compared to the U.S.
dollar. These effects were partially offset by increases in sweeteners and the depreciation of the Argentine Peso as applied to our U.S.
dollar-denominated raw material costs. Excluding currency translation effects, gross profit increased 24.3%.
Operating
income increased 6.7% to Ps. 4,056 million, resulting in an operating margin expansion of 40 basis points to 14.3%. This increase
was driven mainly by operating expense efficiencies. This effect was partially offset by higher labor and freight expenses. Excluding
currency translation effects, operating income increased 23.6%.
| (1) | Please
refer to page 10 for our definition of “comparable” and a description of
the factors affecting the comparability of our financial and operating performance. |
| (2) | Adjusted
EBITDA = operating income + depreciation + amortization & other operating non-cash
charges. |
Coca-Cola FEMSA Reports 4Q23 Results February 22, 2024 | Page 9 of 17 | |
DEFINITIONS
Volume
is expressed in unit cases. Unit case refers to 192 ounces of finished beverage product (24 eight-ounce servings) and, when
applied to soda fountains, refers to the volume of syrup, powders, and concentrate that is required to produce 192 ounces of finished
beverage product.
Transactions
refers to the number of single units (e.g., a can or a bottle) sold, regardless of their size or volume or whether they are
sold individually or in multipacks, except for soda fountains, which represent multiple transactions based on a standard 12 oz. serving.
Operating
income is a non-GAAP financial measure computed as “gross profit – operating expenses – other operating
expenses, net + operative equity method (gain) loss in associates.”
Adjusted
EBITDA is a non-GAAP financial measure computed as “operating income + depreciation + amortization & other
operating non-cash charges.”
Earnings
per share are equal to “quarterly earnings / outstanding shares.” Earnings per share (EPS) for all periods are
adjusted to give effect to the stock split resulting in 16,806,658,096 shares outstanding. For the convenience of the reader, as a KOFUBL
Unit is comprised of 8 shares (3 Series B shares and 5 Series L shares), earnings per unit are equal to EPS multiplied by 8.
Each ADS represents 10 KOFUBL Units.
COMPARABILITY
Our “comparable” term
means, with respect to a year-over-year comparison, the change of a given measure excluding the effects of: (i) mergers, acquisitions,
and divestitures, in this case the acquisition of CVI in Brazil, integrated as of February 2022; and (ii) translation effects
resulting from exchange rate movements. In preparing this measure, management has used its best judgment, estimates, and assumptions
in order to maintain comparability.
Coca-Cola FEMSA Reports 4Q23 Results February 22, 2024 | Page 10 of 17 | |
ABOUT
THE COMPANY
Stock listing information: Mexican
Stock Exchange, Ticker: KOFUBL | NYSE (ADS), Ticker: KOF | Ratio of KOFUBL to KOF = 10:1
Coca-Cola
FEMSA files reports, including annual reports and other information, with the U.S. Securities and Exchange Commission, or the “SEC,”
and the Mexican Stock Exchange (Bolsa Mexicana de Valores, or the “BMV”) pursuant to the rules and regulations of the
SEC (that apply to foreign private issuers) and of the BMV. Filings we make electronically with the SEC and the BMV are available to
the public on the Internet at the SEC’s website at www.sec.gov, the BMV’s website
at www.bmv.com.mx, and our website at www.coca-colafemsa.com.
Coca-Cola
FEMSA, S.A.B. de C.V. is the largest Coca-Cola franchise bottler in the world by sales volume. The Company produces and distributes trademark
beverages of The Coca-Cola Company, offering a wide portfolio of 131 brands to a population of more than 266 million. With over 80 thousand
employees, the Company markets and sells approximately 3.5 billion unit cases through 2 million points of sale a year. Operating 49 manufacturing
plants and 260 distribution centers, Coca-Cola FEMSA is committed to generating economic, social, and environmental value for all of
its stakeholders across the value chain. The Company is a member of the Dow Jones Sustainability Emerging Markets Index, Dow Jones Sustainability
MILA Pacific Alliance Index, FTSE4Good Emerging Index, and the Mexican Stock Exchange’s IPC and Social Responsibility and Sustainability
Indices, among others. Its operations encompass franchise territories in Mexico, Brazil, Guatemala, Colombia, and Argentina, and, nationwide,
in Costa Rica, Nicaragua, Panama, Uruguay, and Venezuela through its investment in KOF Venezuela. For further information, please visit
www.coca-colafemsa.com.

ADDITIONAL
INFORMATION
All of the financial information presented
in this report was prepared under International Financial Reporting Standards (IFRS).
This news release may contain forward-looking
statements concerning Coca-Cola FEMSA’s future performance, which should be considered as good faith estimates by Coca-Cola FEMSA.
These forward-looking statements reflect management’s expectations and are based upon currently available data. Actual results
are subject to future events and uncertainties, many of which are outside Coca-Cola FEMSA’s control, which could materially impact
the Company’s actual performance. References herein to “US$” are to United States dollars. This news release contains
translations of certain Mexican peso amounts into U.S. dollars for the convenience of the reader. These translations should not be construed
as representations that Mexican peso amounts actually represent such U.S. dollar amounts or could be converted into U.S. dollars at the
rate indicated.
(6 pages of tables to follow)
Coca-Cola FEMSA Reports 4Q23 Results February 22, 2024 | Page 11 of 17 | |
COCA-COLA
FEMSA
CONSOLIDATED
INCOME STATEMENT
Millions
of Pesos (1)
| | |
For
the Fourth Quarter of: | | |
For
Full Year: | |
| | |
2023 | | |
%
of
Rev. | | |
2022 | | |
%
of
Rev. | | |
Δ%
Reported | | |
Δ%
Comparable (7) | | |
2023 | | |
%
of
Rev. | | |
2022 | | |
%
of
Rev. | | |
Δ%
Reported | | |
Δ%
Comparable (7) | |
| Transactions
(million transactions) | |
| 6,194.6 | | |
| | | |
| 5,987.7 | | |
| | | |
| 3.5 | % | |
| 3.5 | % | |
| 23,743.2 | | |
| | | |
| 22,315.1 | | |
| | | |
| 6.4 | % | |
| 6.3 | % |
| Volume (million unit cases) | |
| 1,056.2 | | |
| | | |
| 995.3 | | |
| | | |
| 6.1 | % | |
| 6.1 | % | |
| 4,047.8 | | |
| | | |
| 3,755.2 | | |
| | | |
| 7.8 | % | |
| 7.7 | % |
| Average price per unit case | |
| 60.24 | | |
| | | |
| 59.54 | | |
| | | |
| 1.2 | % | |
| | | |
| 58.54 | | |
| | | |
| 58.75 | | |
| | | |
| -0.4 | % | |
| | |
| Net revenues | |
| 65,830 | | |
| | | |
| 61,005 | | |
| | | |
| 7.9 | % | |
| | | |
| 244,264 | | |
| | | |
| 226,222 | | |
| | | |
| 8.0 | % | |
| | |
| Other operating
revenues | |
| 248 | | |
| | | |
| 204 | | |
| | | |
| 21.7 | % | |
| | | |
| 824 | | |
| | | |
| 518 | | |
| | | |
| 59.0 | % | |
| | |
| Total
revenues (2) | |
| 66,078 | | |
| 100.0 | % | |
| 61,209 | | |
| 100.0 | % | |
| 8.0 | % | |
| 15.7 | % | |
| 245,088 | | |
| 100.0 | % | |
| 226,740 | | |
| 100.0 | % | |
| 8.1 | % | |
| 18.0 | % |
| Cost of goods sold | |
| 35,603 | | |
| 53.9 | % | |
| 34,142 | | |
| 55.8 | % | |
| 4.3 | % | |
| | | |
| 134,228 | | |
| 54.8 | % | |
| 126,441 | | |
| 55.8 | % | |
| 6.2 | % | |
| | |
| Gross profit | |
| 30,475 | | |
| 46.1 | % | |
| 27,068 | | |
| 44.2 | % | |
| 12.6 | % | |
| 21.3 | % | |
| 110,860 | | |
| 45.2 | % | |
| 100,300 | | |
| 44.2 | % | |
| 10.5 | % | |
| 20.5 | % |
| Operating expenses | |
| 20,413 | | |
| 30.9 | % | |
| 17,868 | | |
| 29.2 | % | |
| 14.2 | % | |
| | | |
| 76,098 | | |
| 31.0 | % | |
| 68,981 | | |
| 30.4 | % | |
| 10.3 | % | |
| | |
| Other operative expenses, net | |
| 433 | | |
| 0.7 | % | |
| 226 | | |
| 0.4 | % | |
| 91.6 | % | |
| | | |
| 813 | | |
| 0.3 | % | |
| 673 | | |
| 0.3 | % | |
| 20.8 | % | |
| | |
| Operative
equity method (gain) loss in associates(3) | |
| (45 | ) | |
| -0.1 | % | |
| (40 | ) | |
| -0.1 | % | |
| 13.8 | % | |
| | | |
| (232 | ) | |
| -0.1 | % | |
| (192 | ) | |
| -0.1 | % | |
| 20.7 | % | |
| | |
| Operating
income (5) | |
| 9,674 | | |
| 14.6 | % | |
| 9,013 | | |
| 14.7 | % | |
| 7.3 | % | |
| 15.3 | % | |
| 34,180 | | |
| 13.9 | % | |
| 30,838 | | |
| 13.6 | % | |
| 10.8 | % | |
| 19.4 | % |
| Other non operative expenses,
net | |
| 50 | | |
| 0.1 | % | |
| (34 | ) | |
| -0.1 | % | |
| NA | | |
| | | |
| 459 | | |
| 0.2 | % | |
| 310 | | |
| 0.1 | % | |
| 48.2 | % | |
| | |
| Non
Operative equity method (gain) loss in associates (4) | |
| (132 | ) | |
| -0.2 | % | |
| (52 | ) | |
| -0.1 | % | |
| 151.8 | % | |
| | | |
| 17 | | |
| 0.0 | % | |
| (194 | ) | |
| -0.1 | % | |
| NA | | |
| | |
| Interest expense | |
| 1,791 | | |
| | | |
| 1,833 | | |
| | | |
| -2.3 | % | |
| | | |
| 7,102 | | |
| | | |
| 6,500 | | |
| | | |
| 9.3 | % | |
| | |
| Interest income | |
| 730 | | |
| | | |
| 821 | | |
| | | |
| -11.2 | % | |
| | | |
| 3,188 | | |
| | | |
| 2,411 | | |
| | | |
| 32.2 | % | |
| | |
| Interest expense, net | |
| 1,062 | | |
| | | |
| 1,012 | | |
| | | |
| 4.9 | % | |
| | | |
| 3,914 | | |
| | | |
| 4,089 | | |
| | | |
| -4.3 | % | |
| | |
| Foreign exchange loss (gain) | |
| 317 | | |
| | | |
| 281 | | |
| | | |
| 13.0 | % | |
| | | |
| 1,046 | | |
| | | |
| 324 | | |
| | | |
| 222.9 | % | |
| | |
| Loss (gain) on monetary position
in inflationary subsidiaries | |
| (4 | ) | |
| | | |
| (128 | ) | |
| | | |
| -97.1 | % | |
| | | |
| (93 | ) | |
| | | |
| (536 | ) | |
| | | |
| -82.6 | % | |
| | |
| Market value (gain) loss on financial
instruments | |
| (90 | ) | |
| | | |
| (72 | ) | |
| | | |
| 24.5 | % | |
| | | |
| (169 | ) | |
| | | |
| 672 | | |
| | | |
| NA | | |
| | |
| Comprehensive financing result | |
| 1,285 | | |
| | | |
| 1,092 | | |
| | | |
| 17.7 | % | |
| | | |
| 4,697 | | |
| | | |
| 4,549 | | |
| | | |
| 3.3 | % | |
| | |
| Income before taxes | |
| 8,470 | | |
| | | |
| 8,008 | | |
| | | |
| 5.8 | % | |
| | | |
| 29,007 | | |
| | | |
| 26,173 | | |
| | | |
| 10.8 | % | |
| | |
| Income taxes | |
| 2,802 | | |
| | | |
| 611 | | |
| | | |
| 358.3 | % | |
| | | |
| 8,781 | | |
| | | |
| 6,547 | | |
| | | |
| 34.1 | % | |
| | |
| Result of discontinued operations | |
| - | | |
| | | |
| - | | |
| | | |
| NA | | |
| | | |
| - | | |
| | | |
| - | | |
| | | |
| NA | | |
| | |
| Consolidated net income | |
| 5,669 | | |
| | | |
| 7,396 | | |
| | | |
| -23.4 | % | |
| | | |
| 20,226 | | |
| | | |
| 19,626 | | |
| | | |
| 3.1 | % | |
| | |
| Net income attributable
to equity holders of the company | |
| 5,392 | | |
| 8.2 | % | |
| 7,144 | | |
| 11.7 | % | |
| -24.5 | % | |
| -18.7 | % | |
| 19,536 | | |
| 8.0 | % | |
| 19,034 | | |
| 8.4 | % | |
| 2.6 | % | |
| 12.2 | % |
| Non-controlling interest | |
| 277 | | |
| 0.4 | % | |
| 253 | | |
| 0.4 | % | |
| 9.5 | % | |
| | | |
| 690 | | |
| 0.3 | % | |
| 592 | | |
| 0.3 | % | |
| 16.7 | % | |
| | |
| | |
| | | |
| | | |
| | | |
| | | |
| | | |
| | | |
| | | |
| | | |
| | | |
| | | |
| | | |
| | |
| Adj.
EBITDA & CAPEX | |
2023 | | |
%
of
Rev. | | |
2022 | | |
%
of
Rev. | | |
Δ%
Reported | | |
Δ%
Comparable (7) | | |
2023 | | |
%
of
Rev. | | |
2022 | | |
%
of
Rev. | | |
Δ%
Reported | | |
Δ%
Comparable (7) | |
| Operating
income (5) | |
| 9,674 | | |
| 14.6 | % | |
| 9,013 | | |
| 14.7 | % | |
| 7.3 | % | |
| 15.3 | % | |
| 34,180 | | |
| 13.9 | % | |
| 30,838 | | |
| 13.6 | % | |
| 10.8 | % | |
| 19.4 | % |
| Depreciation | |
| 2,632 | | |
| | | |
| 2,397 | | |
| | | |
| 9.8 | % | |
| | | |
| 9,695 | | |
| | | |
| 9,657 | | |
| | | |
| 0.4 | % | |
| | |
| Amortization
and other operative non-cash charges | |
| 843 | | |
| | | |
| 544 | | |
| | | |
| 54.8 | % | |
| | | |
| 2,542 | | |
| | | |
| 2,506 | | |
| | | |
| 1.5 | % | |
| | |
| Adj.
EBITDA (5)(6) | |
| 13,149 | | |
| 19.9 | % | |
| 11,954 | | |
| 19.5 | % | |
| 10.0 | % | |
| 19.3 | % | |
| 46,418 | | |
| 18.9 | % | |
| 43,001 | | |
| 19.0 | % | |
| 7.9 | % | |
| 17.6 | % |
| CAPEX(8) | |
| 9,837 | | |
| | | |
| 8,489 | | |
| | | |
| 15.9 | % | |
| | | |
| 21,396 | | |
| | | |
| 19,665 | | |
| | | |
| 8.8 | % | |
| | |
| (1) | Except
volume and average price per unit case figures. |
| (2) | Please
refer to page 15 for revenue breakdown. |
| (3) | Includes
equity method in Jugos del Valle, among others. |
| (4) | Includes
equity method in PIASA, IEQSA, Beta San Miguel, IMER, and KSP Participacoes, among
others. |
| (5) | The
operating income and Adjusted EBITDA lines are presented as non-GAAP measures for the convenience
of the reader. |
| (6) | Adjusted
EBITDA = operating income + depreciation, amortization & other operating non-cash
charges. |
| (7) | Please
refer to page 10 for our definition of “comparable” and a description of
the factors affecting the comparability of our financial and operating performance. |
| (8) | As
of December 31, 2023, the investment in fixed assets effectively paid is equivalent
to Ps. 20,453 million. |
Coca-Cola FEMSA Reports 4Q23 Results February 22, 2024 | Page 12 of 17 | |
MEXICO &
CENTRAL AMERICA DIVISION
RESULTS
OF OPERATIONS
Millions
of Pesos (1)
| | |
For
the Fourth Quarter of: | | |
For
Full Year: | |
| | |
2023 | | |
%
of
Rev. | | |
2022 | | |
%
of
Rev. | | |
Δ%
Reported | | |
Δ%
Comparable (6) | | |
2023 | | |
%
of
Rev. | | |
2022 | | |
%
of
Rev. | | |
Δ%
Reported | | |
Δ%
Comparable (6) | |
| Transactions
(million transactions) | |
| 2,981.7 | | |
| | | |
| 2,921.2 | | |
| | | |
| 2.1 | % | |
| 2.1 | % | |
| 12,344.9 | | |
| | | |
| 11,633.2 | | |
| | | |
| 6.1 | % | |
| 6.1 | % |
| Volume (million unit cases) | |
| 580.9 | | |
| | | |
| 547.9 | | |
| | | |
| 6.0 | % | |
| 6.0 | % | |
| 2,394.8 | | |
| | | |
| 2,188.4 | | |
| | | |
| 9.4 | % | |
| 9.4 | % |
| Average price per unit case | |
| 64.28 | | |
| | | |
| 61.69 | | |
| | | |
| 4.2 | % | |
| | | |
| 62.07 | | |
| | | |
| 59.85 | | |
| | | |
| 3.7 | % | |
| | |
| Net revenues | |
| 37,603 | | |
| | | |
| 33,797 | | |
| | | |
| | | |
| | | |
| 149,320 | | |
| | | |
| 130,981 | | |
| | | |
| | | |
| | |
| Other operating revenues | |
| 19 | | |
| | | |
| (5 | ) | |
| | | |
| | | |
| | | |
| 42 | | |
| | | |
| 21 | | |
| | | |
| | | |
| | |
| Total
Revenues (2) | |
| 37,622 | | |
| 100.0 | % | |
| 33,792 | | |
| 100.0 | % | |
| 11.3 | % | |
| 13.1 | % | |
| 149,362 | | |
| 100.0 | % | |
| 131,002 | | |
| 100.0 | % | |
| 14.0 | % | |
| 16.0 | % |
| Cost of goods sold | |
| 19,200 | | |
| 51.0 | % | |
| 18,114 | | |
| 53.6 | % | |
| | | |
| | | |
| 77,698 | | |
| 52.0 | % | |
| 68,967 | | |
| 52.6 | % | |
| | | |
| | |
| Gross profit | |
| 18,422 | | |
| 49.0 | % | |
| 15,678 | | |
| 46.4 | % | |
| 17.5 | % | |
| 19.4 | % | |
| 71,665 | | |
| 48.0 | % | |
| 62,035 | | |
| 47.4 | % | |
| 15.5 | % | |
| 17.5 | % |
| Operating expenses | |
| 12,663 | | |
| 33.7 | % | |
| 10,451 | | |
| 30.9 | % | |
| | | |
| | | |
| 48,343 | | |
| 0.3 | | |
| 40,829 | | |
| 0.3 | | |
| | | |
| | |
| Other operative expenses, net | |
| 150 | | |
| 0.4 | % | |
| 39 | | |
| 0.1 | % | |
| | | |
| | | |
| 281 | | |
| 0.2 | % | |
| 394 | | |
| 0.3 | % | |
| | | |
| | |
| Operative
equity method (gain) loss in associates (3) | |
| (9 | ) | |
| 0.0 | % | |
| (25 | ) | |
| -0.1 | % | |
| | | |
| | | |
| (130 | ) | |
| -0.1 | % | |
| (136 | ) | |
| -0.1 | % | |
| | | |
| | |
| Operating
income (4) | |
| 5,618 | | |
| 14.9 | % | |
| 5,212 | | |
| 15.4 | % | |
| 7.8 | % | |
| 10.0 | % | |
| 23,170 | | |
| 15.5 | % | |
| 20,948 | | |
| 16.0 | % | |
| 10.6 | % | |
| 12.6 | % |
| Depreciation, amortization &
other operating non-cash charges | |
| 2,086 | | |
| 5.5 | % | |
| 1,690 | | |
| 5.0 | % | |
| | | |
| | | |
| 7,652 | | |
| 5.1 | % | |
| 7,380 | | |
| 5.6 | % | |
| | | |
| | |
| Adj.
EBITDA (4)(5) | |
| 7,704 | | |
| 20.5 | % | |
| 6,902 | | |
| 20.4 | % | |
| 11.6 | % | |
| 13.7 | % | |
| 30,822 | | |
| 20.6 | % | |
| 28,329 | | |
| 21.6 | % | |
| 8.8 | % | |
| 10.7 | % |
| (1) | Except
volume and average price per unit case figures. |
| (2) | Please
refer to page 15 & 16 for revenue breakdown. |
| (3) | Includes
equity method in Jugos del Valle, among others. |
| (4) | The
operating income and Adjusted EBITDA lines are presented as non-GAAP measures for the convenience
of the reader. |
| (5) | Adjusted
EBITDA = operating income + depreciation, amortization & other operating non-cash
charges. |
| (6) | Please
refer to page 10 for our definition of “comparable” and a description of
the factors affecting the comparability of our financial and operating performance. |
SOUTH
AMERICA DIVISION
RESULTS
OF OPERATIONS
Millions
of Pesos (1)
| | |
For
the Fourth Quarter of: | | |
For
Full Year: | |
| | |
2023 | | |
%
of
Rev. | | |
2022 | | |
%
of
Rev. | | |
Δ%
Reported | | |
Δ%
Comparable (6) | | |
2023 | | |
%
of
Rev. | | |
2022 | | |
%
of
Rev. | | |
Δ%
Reported | | |
Δ%
Comparable (6) | |
| Transactions
(million transactions) | |
| 3,212.9 | | |
| | | |
| 3,066.5 | | |
| | | |
| 4.8 | % | |
| 4.8 | % | |
| 11,398.3 | | |
| | | |
| 10,681.9 | | |
| | | |
| 6.7 | % | |
| 6.5 | % |
| Volume (million unit cases) | |
| 475.3 | | |
| | | |
| 447.4 | | |
| | | |
| 6.2 | % | |
| 6.2 | % | |
| 1,653.1 | | |
| | | |
| 1,566.8 | | |
| | | |
| 5.5 | % | |
| 5.3 | % |
| Average price per unit case | |
| 55.32 | | |
| | | |
| 56.91 | | |
| | | |
| -2.8 | % | |
| | | |
| 53.43 | | |
| | | |
| 57.21 | | |
| | | |
| -6.6 | % | |
| | |
| Net revenues | |
| 28,227 | | |
| | | |
| 27,208 | | |
| | | |
| | | |
| | | |
| 94,944 | | |
| | | |
| 95,241 | | |
| | | |
| | | |
| | |
| Other operating revenues | |
| 229 | | |
| | | |
| 209 | | |
| | | |
| | | |
| | | |
| 782 | | |
| | | |
| 497 | | |
| | | |
| | | |
| | |
| Total
Revenues (2) | |
| 28,456 | | |
| 100.0 | % | |
| 27,417 | | |
| 100.0 | % | |
| 3.8 | % | |
| 19.5 | % | |
| 95,726 | | |
| 100.0 | % | |
| 95,738 | | |
| 100.0 | % | |
| 0.0 | % | |
| 21.3 | % |
| Cost of goods sold | |
| 16,403 | | |
| 57.6 | % | |
| 16,027 | | |
| 58.5 | % | |
| | | |
| | | |
| 56,531 | | |
| 59.1 | % | |
| 57,473 | | |
| 60.0 | % | |
| | | |
| | |
| Gross profit | |
| 12,054 | | |
| 42.4 | % | |
| 11,390 | | |
| 41.5 | % | |
| 5.8 | % | |
| 24.3 | % | |
| 39,195 | | |
| 40.9 | % | |
| 38,265 | | |
| 40.0 | % | |
| 2.4 | % | |
| 26.5 | % |
| Operating expenses | |
| 7,750 | | |
| 27.2 | % | |
| 7,417 | | |
| 27.1 | % | |
| | | |
| | | |
| 27,755 | | |
| 29.0 | % | |
| 28,152 | | |
| 29.4 | % | |
| | | |
| | |
| Other operative expenses, net | |
| 284 | | |
| 1.0 | % | |
| 187 | | |
| 0.7 | % | |
| | | |
| | | |
| 531 | | |
| 0.6 | % | |
| 279 | | |
| 0.3 | % | |
| | | |
| | |
| Operative
equity method (gain) loss in associates (3) | |
| (36 | ) | |
| -0.1 | % | |
| (15 | ) | |
| -0.1 | % | |
| | | |
| | | |
| (102 | ) | |
| -0.1 | % | |
| (55 | ) | |
| -0.1 | % | |
| | | |
| | |
| Operating
income (4) | |
| 4,056 | | |
| 14.3 | % | |
| 3,801 | | |
| 13.9 | % | |
| 6.7 | % | |
| 23.6 | % | |
| 11,011 | | |
| 11.5 | % | |
| 9,890 | | |
| 10.3 | % | |
| 11.3 | % | |
| 36.7 | % |
| Depreciation, amortization &
other operating non-cash charges | |
| 1,389 | | |
| 4.9 | % | |
| 1,251 | | |
| 4.6 | % | |
| | | |
| | | |
| 4,585 | | |
| 4.8 | % | |
| 4,782 | | |
| 5.0 | % | |
| | | |
| | |
| Adj.
EBITDA (4)(5) | |
| 5,444 | | |
| 19.1 | % | |
| 5,052 | | |
| 18.4 | % | |
| 7.8 | % | |
| 28.3 | % | |
| 15,596 | | |
| 16.3 | % | |
| 14,672 | | |
| 15.3 | % | |
| 6.3 | % | |
| 34.2 | % |
| (1) | Except
volume and average price per unit case figures. |
| (2) | Please
refer to page 15 & 16 for revenue breakdown. |
| (3) | Includes
equity method in Leão
Alimentos, among others. |
| (4) | The
operating income and Adjusted EBITDA lines are presented as non-GAAP measures for the convenience
of the reader. |
| (5) | Adjusted
EBITDA = operating income + depreciation, amortization & other operating non-cash
charges. |
| (6) | Please
refer to page 10 for our definition of “comparable” and a description of
the factors affecting the comparability of our financial and operating performance. |
Coca-Cola FEMSA Reports 4Q23 Results February 22, 2024 | Page 13 of 17 | |
COCA-COLA
FEMSA
CONSOLIDATED
BALANCE SHEET
Millions
of Pesos
| Assets | |
Dec-23 | | |
Dec-22 | | |
%
Var. | |
| Current Assets | |
| | |
| | |
| |
| Cash, cash equivalents and
marketable securities | |
| 31,060 | | |
| 40,277 | | |
| -23 | % |
| Total accounts receivable | |
| 17,750 | | |
| 16,318 | | |
| 9 | % |
| Inventories | |
| 11,880 | | |
| 11,888 | | |
| 0 | % |
| Other current assets | |
| 7,105 | | |
| 10,729 | | |
| -34 | % |
| Total current assets | |
| 67,794 | | |
| 79,211 | | |
| -14 | % |
| Non-Current Assets | |
| | | |
| | | |
| | |
| Property, plant and equipment | |
| 133,406 | | |
| 125,293 | | |
| 6 | % |
| Accumulated depreciation | |
| (54,676 | ) | |
| (54,088 | ) | |
| 1 | % |
| Total property, plant and equipment,
net | |
| 78,730 | | |
| 71,205 | | |
| 11 | % |
| Right of use assets | |
| 2,387 | | |
| 2,069 | | |
| 15 | % |
| Investment in shares | |
| 9,246 | | |
| 8,452 | | |
| 9 | % |
| Intangible assets and other assets | |
| 101,162 | | |
| 103,122 | | |
| -2 | % |
| Other non-current assets | |
| 14,150 | | |
| 13,936 | | |
| 2 | % |
| Total Assets | |
| 273,471 | | |
| 277,995 | | |
| -2 | % |
| Liabilities & Equity | |
Dec-23 | | |
Dec-22 | | |
%
Var. | |
| Current Liabilities | |
| | |
| | |
| |
| Short-term bank loans and
notes payable | |
| 140 | | |
| 8,524 | | |
| -98 | % |
| Suppliers | |
| 27,352 | | |
| 26,834 | | |
| 2 | % |
| Short-term leasing Liabilities | |
| 752 | | |
| 472 | | |
| 59 | % |
| Other current liabilities | |
| 26,623 | | |
| 22,129 | | |
| 20 | % |
| Total current liabilities | |
| 54,867 | | |
| 57,959 | | |
| -5 | % |
| Non-Current Liabilities | |
| | | |
| | | |
| | |
| Long-term bank loans and notes payable | |
| 65,074 | | |
| 70,146 | | |
| -7 | % |
| Long Term Leasing Liabilities | |
| 1,769 | | |
| 1,663 | | |
| 6 | % |
| Other long-term liabilities | |
| 18,056 | | |
| 16,351 | | |
| 10 | % |
| Total liabilities | |
| 139,766 | | |
| 146,119 | | |
| -4 | % |
| Equity | |
| | | |
| | | |
| | |
| Non-controlling interest | |
| 6,680 | | |
| 6,491 | | |
| 3 | % |
| Total controlling interest | |
| 127,025 | | |
| 125,384 | | |
| 1 | % |
| Total equity | |
| 133,705 | | |
| 131,876 | | |
| 1 | % |
| Total Liabilities and Equity | |
| 273,471 | | |
| 277,995 | | |
| -2 | % |
| | |
December 31,
2023 | |
| Debt Mix | |
%
Total
Debt (1) | | |
%
Interest Rate
Floating (1) (2) | | |
Average
Rate | |
| Currency | |
| | |
| | |
| |
| Mexican Pesos | |
| 61.4 | % | |
| 6.9 | % | |
| 8.8 | % |
| U.S. Dollars | |
| 15.9 | % | |
| 37.4 | % | |
| 4.6 | % |
| Colombian Pesos | |
| 1.3 | % | |
| 0.0 | % | |
| 6.3 | % |
| Brazilian Reals | |
| 21.3 | % | |
| 24.8 | % | |
| 9.6 | % |
| Argentine Pesos | |
| 0.1 | % | |
| 0.0 | % | |
| 130.0 | % |
| Total Debt | |
| 100 | % | |
| 21.9 | % | |
| 8.4 | % |
(1) After
giving effect to cross- currency swaps.
(2) Calculated
by weighting each year´s outstanding debt balance mix.
Debt Maturity Profile

| Financial Ratios | |
FY
2023 | | |
FY
2022 | | |
Δ% | |
| Net
debt including effect of hedges (1)(3) | |
| 37,794 | | |
| 38,104 | | |
| -0.8 | % |
| Net
debt including effect of hedges / Adj.EBITDA (1)(3) | |
| 0.81 | | |
| 0.89 | | |
| | |
| Adj.
EBITDA/ Interest expense, net (1) | |
| 11.86 | | |
| 10.34 | | |
| | |
| Capitalization
(2) | |
| 32.8 | % | |
| 38.9 | % | |
| | |
(1) Net debt =
total debt - cash
(2) Total debt
/ (total debt + shareholders' equity)
(3) After giving
effect to cross-currency swaps.
Coca-Cola FEMSA Reports 4Q23 Results February 22, 2024 | Page 14 of 17 | |
COCA-COLA
FEMSA
QUARTERLY-
VOLUME, TRANSACTIONS & REVENUES
Volume
| | |
4Q
2023 | | |
4Q
2022 | | |
YoY | |
| | |
Sparkling | | |
Water
(1) | | |
Bulk
(2) | | |
Stills | | |
Total | | |
Sparkling | | |
Water
(1) | | |
Bulk
(2) | | |
Stills | | |
Total | | |
Δ
% | |
| Mexico
(3) | |
| 346.1 | | |
| 26.4 | | |
| 85.8 | | |
| 35.1 | | |
| 493.4 | | |
| 335.3 | | |
| 25.0 | | |
| 74.8 | | |
| 33.6 | | |
| 468.7 | | |
| 5.3 | % |
| Guatemala | |
| 40.5 | | |
| 2.0 | | |
| - | | |
| 2.0 | | |
| 44.4 | | |
| 36.0 | | |
| 1.1 | | |
| - | | |
| 2.1 | | |
| 39.2 | | |
| 13.2 | % |
| CAM
South | |
| 35.5 | | |
| 1.3 | | |
| 0.9 | | |
| 5.4 | | |
| 43.1 | | |
| 32.6 | | |
| 1.7 | | |
| 0.1 | | |
| 5.4 | | |
| 39.9 | | |
| 7.9 | % |
| Mexico and
Central America | |
| 422.1 | | |
| 29.7 | | |
| 86.7 | | |
| 42.5 | | |
| 580.9 | | |
| 404.0 | | |
| 27.8 | | |
| 75.0 | | |
| 41.1 | | |
| 547.9 | | |
| 6.0 | % |
| Colombia | |
| 70.9 | | |
| 10.2 | | |
| 3.5 | | |
| 7.4 | | |
| 91.9 | | |
| 66.0 | | |
| 9.0 | | |
| 3.4 | | |
| 6.9 | | |
| 85.4 | | |
| 7.6 | % |
| Brazil
(4) | |
| 266.4 | | |
| 22.4 | | |
| 3.2 | | |
| 26.0 | | |
| 318.0 | | |
| 250.0 | | |
| 20.3 | | |
| 2.8 | | |
| 22.7 | | |
| 295.8 | | |
| 7.5 | % |
| Argentina | |
| 37.8 | | |
| 6.6 | | |
| 1.9 | | |
| 4.8 | | |
| 51.1 | | |
| 41.1 | | |
| 5.0 | | |
| 1.1 | | |
| 4.3 | | |
| 51.6 | | |
| -1.0 | % |
| Uruguay | |
| 12.0 | | |
| 1.7 | | |
| - | | |
| 0.8 | | |
| 14.4 | | |
| 12.4 | | |
| 1.8 | | |
| - | | |
| 0.6 | | |
| 14.7 | | |
| -2.1 | % |
| South America | |
| 387.0 | | |
| 40.8 | | |
| 8.5 | | |
| 39.0 | | |
| 475.3 | | |
| 369.5 | | |
| 36.1 | | |
| 7.4 | | |
| 34.5 | | |
| 447.4 | | |
| 6.2 | % |
| TOTAL | |
| 809.1 | | |
| 70.5 | | |
| 95.2 | | |
| 81.5 | | |
| 1,056.2 | | |
| 773.5 | | |
| 63.9 | | |
| 82.3 | | |
| 75.6 | | |
| 995.3 | | |
| 6.1 | % |
(1) Excludes
water presentations larger than 5.0 Lt ; includes flavored water.
(2) Bulk
Water = Still bottled water in 5.0, 19.0 and 20.0 - liter packaging presentations; includes flavored water
(3) Includes
10.1 million unit cases corresponding to the acquisition of Cristal from Embotelladoras Bepensa
Transactions
| | |
4Q
2023 | | |
4Q
2022 | | |
YoY | |
| | |
Sparkling | | |
Water | | |
Stills | | |
Total | | |
Sparkling | | |
Water | | |
Stills | | |
Total | | |
Δ
% | |
| Mexico
(3) | |
| 1,900.7 | | |
| 190.7 | | |
| 243.8 | | |
| 2,335.2 | | |
| 1,888.8 | | |
| 179.8 | | |
| 239.3 | | |
| 2,307.8 | | |
| 1.2 | % |
| Guatemala | |
| 293.4 | | |
| 13.1 | | |
| 21.7 | | |
| 328.2 | | |
| 271.2 | | |
| 10.9 | | |
| 20.6 | | |
| 302.7 | | |
| 8.4 | % |
| CAM
South | |
| 251.1 | | |
| 13.0 | | |
| 54.2 | | |
| 318.3 | | |
| 237.6 | | |
| 11.6 | | |
| 61.4 | | |
| 310.6 | | |
| 2.5 | % |
| Mexico and
Central America | |
| 2,445.2 | | |
| 216.9 | | |
| 319.7 | | |
| 2,981.7 | | |
| 2,397.6 | | |
| 202.3 | | |
| 321.3 | | |
| 2,921.2 | | |
| 2.1 | % |
| Colombia | |
| 513.5 | | |
| 106.6 | | |
| 68.2 | | |
| 688.2 | | |
| 481.4 | | |
| 94.2 | | |
| 70.4 | | |
| 645.9 | | |
| 6.5 | % |
| Brazil
(4) | |
| 1,705.0 | | |
| 191.3 | | |
| 292.1 | | |
| 2,188.3 | | |
| 1,579.3 | | |
| 177.6 | | |
| 324.5 | | |
| 2,081.5 | | |
| 5.1 | % |
| Argentina | |
| 182.6 | | |
| 41.0 | | |
| 44.5 | | |
| 268.1 | | |
| 201.9 | | |
| 32.0 | | |
| 37.0 | | |
| 270.8 | | |
| -1.0 | % |
| Uruguay | |
| 55.0 | | |
| 6.6 | | |
| 6.5 | | |
| 68.2 | | |
| 56.0 | | |
| 7.0 | | |
| 5.2 | | |
| 68.2 | | |
| -0.1 | % |
| South America | |
| 2,456.1 | | |
| 345.5 | | |
| 411.2 | | |
| 3,212.9 | | |
| 2,318.6 | | |
| 310.8 | | |
| 437.1 | | |
| 3,066.5 | | |
| 4.8 | % |
| TOTAL | |
| 4,901.3 | | |
| 562.4 | | |
| 730.9 | | |
| 6,194.6 | | |
| 4,716.2 | | |
| 513.1 | | |
| 758.4 | | |
| 5,987.7 | | |
| 3.5 | % |
Revenues
| Expressed in million Mexican Pesos | |
4Q
2023 | | |
4Q
2022 | | |
Δ
% | |
| Mexico | |
| 30,709 | | |
| 27,388 | | |
| 12.1 | % |
| Guatemala | |
| 3,353 | | |
| 3,130 | | |
| 7.1 | % |
| CAM South | |
| 3,560 | | |
| 3,275 | | |
| 8.7 | % |
| Mexico and Central America | |
| 37,622 | | |
| 33,792 | | |
| 11.3 | % |
| Colombia | |
| 5,094 | | |
| 3,567 | | |
| 42.8 | % |
| Brazil
(5) | |
| 20,125 | | |
| 19,293 | | |
| 4.3 | % |
| Argentina | |
| 1,932 | | |
| 3,273 | | |
| -41.0 | % |
| Uruguay | |
| 1,305 | | |
| 1,283 | | |
| 1.7 | % |
| South America | |
| 28,456 | | |
| 27,417 | | |
| 3.8 | % |
| TOTAL | |
| 66,078 | | |
| 61,209 | | |
| 8.0 | % |
(4) Volume
and transactions in Brazil do not include beer
(5) Brazil
includes beer revenues of Ps. 1,734.2 million for the fourth quarter of 2023 and Ps.1,742.4 million for the same period of the previous
year.
| (1) | Volume
is expressed in unit cases. Unit case refers to 192 ounces of finished beverage product (24
eight-ounce servings) and, when applied to soda fountains, refers to the volume of syrup,
powders, and concentrate that is required to produce 192 ounces of finished beverage product. |
| (2) | Transactions
refers to the number of single units (e.g., a can or a bottle) sold, regardless of their
size or volume or whether they are sold individually or in multipacks, except for soda fountains,
which represent multiple transactions based on a standard 12 oz. serving. |
Coca-Cola FEMSA Reports 4Q23 Results February 22, 2024 | Page 15 of 17 | |
COCA-COLA
FEMSA
FY-
VOLUME, TRANSACTIONS & REVENUES
Volume
| | |
FY
2023 | | |
FY
2022 | | |
YoY | |
| | |
Sparkling | | |
Water
(1) | | |
Bulk
(2) | | |
Stills | | |
Total | | |
Sparkling | | |
Water
(1) | | |
Bulk
(2) | | |
Stills | | |
Total | | |
Δ
% | |
| Mexico
(3) | |
| 1,408.7 | | |
| 121.7 | | |
| 376.6 | | |
| 145.9 | | |
| 2,052.9 | | |
| 1,348.8 | | |
| 104.4 | | |
| 300.6 | | |
| 135.1 | | |
| 1,888.9 | | |
| 8.7 | % |
| Guatemala | |
| 157.6 | | |
| 7.7 | | |
| - | | |
| 8.9 | | |
| 174.2 | | |
| 133.7 | | |
| 4.8 | | |
| - | | |
| 8.7 | | |
| 147.2 | | |
| 18.4 | % |
| CAM
South | |
| 136.4 | | |
| 6.1 | | |
| 2.7 | | |
| 22.5 | | |
| 167.7 | | |
| 124.2 | | |
| 6.5 | | |
| 0.7 | | |
| 20.9 | | |
| 152.3 | | |
| 10.1 | % |
| Mexico and
Central America | |
| 1,702.7 | | |
| 135.4 | | |
| 379.3 | | |
| 177.3 | | |
| 2,394.8 | | |
| 1,606.7 | | |
| 115.6 | | |
| 301.3 | | |
| 164.7 | | |
| 2,188.4 | | |
| 9.4 | % |
| Colombia | |
| 264.7 | | |
| 39.2 | | |
| 14.0 | | |
| 29.6 | | |
| 347.6 | | |
| 254.6 | | |
| 34.0 | | |
| 12.5 | | |
| 29.0 | | |
| 330.1 | | |
| 5.3 | % |
| Brazil
(4) | |
| 902.4 | | |
| 75.2 | | |
| 10.2 | | |
| 87.4 | | |
| 1,075.1 | | |
| 854.6 | | |
| 66.5 | | |
| 10.7 | | |
| 84.5 | | |
| 1,016.2 | | |
| 5.8 | % |
| Argentina | |
| 135.1 | | |
| 21.0 | | |
| 5.8 | | |
| 16.8 | | |
| 178.7 | | |
| 139.4 | | |
| 16.0 | | |
| 3.8 | | |
| 14.6 | | |
| 173.9 | | |
| 2.7 | % |
| Uruguay | |
| 40.6 | | |
| 8.7 | | |
| - | | |
| 2.4 | | |
| 51.7 | | |
| 39.2 | | |
| 5.7 | | |
| - | | |
| 1.6 | | |
| 46.6 | | |
| 10.9 | % |
| South America | |
| 1,342.7 | | |
| 144.2 | | |
| 30.0 | | |
| 136.1 | | |
| 1,653.1 | | |
| 1,287.8 | | |
| 122.2 | | |
| 27.1 | | |
| 129.7 | | |
| 1,566.8 | | |
| 5.5 | % |
| TOTAL | |
| 3,045.4 | | |
| 279.7 | | |
| 409.3 | | |
| 313.5 | | |
| 4,047.8 | | |
| 2,894.5 | | |
| 237.8 | | |
| 328.4 | | |
| 294.4 | | |
| 3,755.2 | | |
| 7.8 | % |
(1) Excludes
water presentations larger than 5.0 Lt ; includes flavored water.
(2) Bulk
Water = Still bottled water in 5.0, 19.0 and 20.0 - liter packaging presentations; includes flavored water
(3) Includes
59.2 million unit cases corresponding to the acquisition of Cristal from Embotelladoras Bepensa
Transactions
| | |
FY
2023 | | |
FY
2022 | | |
YoY | |
| | |
Sparkling | | |
Water | | |
Stills | | |
Total | | |
Sparkling | | |
Water | | |
Stills | | |
Total | | |
Δ
% | |
| Mexico
(3) | |
| 7,835.7 | | |
| 866.4 | | |
| 1,026.9 | | |
| 9,729.0 | | |
| 7,569.8 | | |
| 739.5 | | |
| 967.1 | | |
| 9,276.4 | | |
| 4.9 | % |
| Guatemala | |
| 1,179.8 | | |
| 56.9 | | |
| 91.9 | | |
| 1,328.5 | | |
| 1,027.3 | | |
| 48.0 | | |
| 85.5 | | |
| 1,160.8 | | |
| 14.4 | % |
| CAM
South | |
| 996.4 | | |
| 53.6 | | |
| 237.3 | | |
| 1,287.4 | | |
| 920.5 | | |
| 38.8 | | |
| 236.7 | | |
| 1,196.0 | | |
| 7.6 | % |
| Mexico and
Central America | |
| 10,011.8 | | |
| 976.9 | | |
| 1,356.2 | | |
| 12,344.9 | | |
| 9,517.6 | | |
| 826.3 | | |
| 1,289.3 | | |
| 11,633.2 | | |
| 6.1 | % |
| Colombia | |
| 1,942.5 | | |
| 411.8 | | |
| 302.2 | | |
| 2,656.5 | | |
| 1,834.4 | | |
| 361.5 | | |
| 307.8 | | |
| 2,503.7 | | |
| 6.1 | % |
| Brazil
(4) | |
| 5,887.7 | | |
| 655.1 | | |
| 981.1 | | |
| 7,523.9 | | |
| 5,478.5 | | |
| 581.6 | | |
| 954.3 | | |
| 7,014.5 | | |
| 7.3 | % |
| Argentina | |
| 689.8 | | |
| 135.2 | | |
| 149.3 | | |
| 974.4 | | |
| 713.6 | | |
| 103.8 | | |
| 122.0 | | |
| 939.5 | | |
| 3.7 | % |
| Uruguay | |
| 190.7 | | |
| 32.6 | | |
| 20.3 | | |
| 243.6 | | |
| 187.3 | | |
| 22.4 | | |
| 14.6 | | |
| 224.2 | | |
| 8.6 | % |
| South America | |
| 8,710.7 | | |
| 1,234.7 | | |
| 1,452.9 | | |
| 11,398.3 | | |
| 8,213.8 | | |
| 1,069.3 | | |
| 1,398.8 | | |
| 10,681.9 | | |
| 6.7 | % |
| TOTAL | |
| 18,722.5 | | |
| 2,211.6 | | |
| 2,809.1 | | |
| 23,743.2 | | |
| 17,731.4 | | |
| 1,895.6 | | |
| 2,688.1 | | |
| 22,315.1 | | |
| 6.4 | % |
Revenues
| Expressed in million Mexican Pesos | |
FY
2023 | | |
FY
2022 | | |
Δ
% | |
| Mexico | |
| 122,615 | | |
| 106,911 | | |
| 14.7 | % |
| Guatemala | |
| 13,016 | | |
| 12,059 | | |
| 7.9 | % |
| CAM South | |
| 13,731 | | |
| 12,031 | | |
| 14.1 | % |
| Mexico and Central America | |
| 149,362 | | |
| 131,002 | | |
| 14.0 | % |
| Colombia | |
| 17,680 | | |
| 16,800 | | |
| 5.2 | % |
| Brazil
(5) | |
| 66,963 | | |
| 63,944 | | |
| 4.7 | % |
| Argentina | |
| 6,668 | | |
| 10,917 | | |
| -38.9 | % |
| Uruguay | |
| 4,415 | | |
| 4,078 | | |
| 8.3 | % |
| South America | |
| 95,726 | | |
| 95,738 | | |
| 0.0 | % |
| TOTAL | |
| 245,088 | | |
| 226,740 | | |
| 8.1 | % |
(4) Volume
and transactions in Brazil do not include beer
(5) Brazil
includes beer revenues of Ps. 6,116.7million for the full year of 2023 and Ps. 5,599.9 million for the same period of the previous year.
| (1) | Volume
is expressed in unit cases. Unit case refers to 192 ounces of finished beverage product (24
eight-ounce servings) and, when applied to soda fountains, refers to the volume of syrup,
powders, and concentrate that is required to produce 192 ounces of finished beverage product. |
| (2) | Transactions
refers to the number of single units (e.g., a can or a bottle) sold, regardless of their
size or volume or whether they are sold individually or in multipacks, except for soda fountains,
which represent multiple transactions based on a standard 12 oz. serving. |
Coca-Cola FEMSA Reports 4Q23 Results February 22, 2024 | Page 16 of 17 | |
COCA-COLA
FEMSA
MACROECONOMIC
INFORMATION
Inflation
(1)
| |
|
4Q23 |
|
FY23 |
|
| Mexico |
|
1.75 |
% |
4.66 |
% |
| Colombia |
|
1.36 |
% |
9.28 |
% |
| Brasil |
|
0.94 |
% |
4.62 |
% |
| Argentina |
|
60.86 |
% |
211.41 |
% |
| Costa Rica |
|
0.26 |
% |
-1.77 |
% |
| Panama |
|
0.00 |
% |
1.92 |
% |
| Guatemala |
|
1.07 |
% |
4.18 |
% |
| Nicaragua |
|
1.00 |
% |
5.60 |
% |
| Uruguay |
|
1.12 |
% |
5.11 |
% |
(1) Source:
inflation estimated by the company based on historic publications from the Central Bank of each country.
Average
Exchange Rates for each period (2)
| |
|
Quarterly Exchange Rate
(Local Currency per USD) |
|
Year to Date Exchange Rate
(Local Currency per USD) |
|
| |
|
4Q23 |
|
4Q22 |
|
Δ% |
|
FY 23 |
|
FY 22 |
|
Δ% |
|
| México |
|
17.58 |
|
19.70 |
|
-10.7 |
% |
17.77 |
|
20.13 |
|
-11.7 |
% |
| Colombia |
|
4,071.19 |
|
4,808.38 |
|
-15.3 |
% |
4,325.96 |
|
4,256.19 |
|
1.6 |
% |
| Brasil |
|
4.95 |
|
5.26 |
|
-5.8 |
% |
4.99 |
|
5.16 |
|
-3.3 |
% |
| Argentina |
|
448.97 |
|
162.54 |
|
176.2 |
% |
296.61 |
|
130.72 |
|
126.9 |
% |
| Costa Rica |
|
534.44 |
|
614.10 |
|
-13.0 |
% |
547.36 |
|
650.75 |
|
-15.9 |
% |
| Panama |
|
1.00 |
|
1.00 |
|
-81.0 |
% |
1.00 |
|
1.00 |
|
-80.6 |
% |
| Guatemala |
|
7.83 |
|
7.85 |
|
-0.2 |
% |
7.83 |
|
7.75 |
|
1.1 |
% |
| Nicaragua |
|
36.58 |
|
36.14 |
|
1.2 |
% |
36.44 |
|
35.87 |
|
1.6 |
% |
| Uruguay |
|
39.53 |
|
39.97 |
|
-1.1 |
% |
38.82 |
|
41.17 |
|
-5.7 |
% |
End-of-period
Exchange Rates
| |
|
Closing Exchange Rate
(Local Currency per USD) |
|
Closing Exchange Rate
(Local Currency per USD) |
|
| |
|
Dec-23 |
|
Dec-22 |
|
Δ% |
|
Sep-23 |
|
Sep-22 |
|
Δ% |
|
| México |
|
16.89 |
|
19.36 |
|
-12.7 |
% |
17.62 |
|
20.31 |
|
-13.2 |
% |
| Colombia |
|
3,822.05 |
|
4,810.20 |
|
-20.5 |
% |
4,053.76 |
|
4,532.07 |
|
-10.6 |
% |
| Brasil |
|
4.84 |
|
5.22 |
|
-7.2 |
% |
5.01 |
|
5.41 |
|
-7.4 |
% |
| Argentina |
|
808.45 |
|
177.16 |
|
356.3 |
% |
349.95 |
|
147.32 |
|
137.5 |
% |
| Costa Rica |
|
526.88 |
|
601.99 |
|
-12.5 |
% |
542.35 |
|
632.72 |
|
-14.3 |
% |
| Panama |
|
1.00 |
|
1.00 |
|
0.0 |
% |
1.00 |
|
1.00 |
|
0.0 |
% |
| Guatemala |
|
7.83 |
|
7.85 |
|
-0.3 |
% |
7.86 |
|
7.88 |
|
-0.3 |
% |
| Nicaragua |
|
36.62 |
|
36.23 |
|
1.1 |
% |
36.53 |
|
36.05 |
|
1.3 |
% |
| Uruguay |
|
39.02 |
|
40.07 |
|
-2.6 |
% |
38.56 |
|
41.74 |
|
-7.6 |
% |
(2) Average
exchange rate for each period computed with the average exchange rate of each month.
Coca-Cola FEMSA Reports 4Q23 Results February 22, 2024 | Page 17 of 17 | |
Fomento Economico Mexica... (NYSE:FMX)
Historical Stock Chart
From Mar 2024 to Apr 2024

Fomento Economico Mexica... (NYSE:FMX)
Historical Stock Chart
From Apr 2023 to Apr 2024
