UNITED STATES
SECURITIES AND EXCHANGE COMMISSION
WASHINGTON, D.C. 20549
FORM 6-K
REPORT OF FOREIGN ISSUER
PURSUANT TO RULE 13a-16 OR 15b-16 OF
THE SECURITIES EXCHANGE ACT OF 1934
January 2024
Date of Report (Date of Earliest Event Reported)
Embotelladora Andina S.A.
(Exact name of registrant as specified in its charter)
Andina Bottling Company, Inc.
(Translation of Registrant´s name into English)
Avda. Miraflores 9153
Renca
Santiago, Chile
(Address of principal executive office)
Indicate by check mark whether the registrant files
or will file annual reports under cover Form 20-F or Form 40-F.
Form 20-F x Form 40-F ¨
Indicate by check mark if the Registrant is submitting
this Form 6-K in paper as permitted by Regulation S-T Rule 101(b)(1):
Yes ¨ No x
Indicate by check mark if the Registrant is submitting
this Form 6-K in paper as permitted by Regulation S-T Rule 101(b)(7):
Yes ¨ No x
Indicate by check mark whether the registrant by
furnishing the information contained in this Form 6-K is also thereby furnishing the information to the Commission pursuant to Rule 12g3-2(b) under
the Securities Exchange Act of 1934
Yes ¨ No x

EXECUTIVE SUMMARY
 |
The quarter closed with a consolidated Sales Volume of 248.4 million unit cases*, a decrease of 1.0%
compared to the same quarter of the previous year. Transactions reached 1,361.3 million for the quarter, a decrease of 2.4% compared
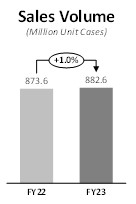
to the same quarter of the previous year. Accumulated consolidated sales volume reached 882.6 million unit cases, an increase of 1.0%
with respect to the previous year. Accumulated transactions reached 4,859.6 million, representing an increase of 0.7%. |
|
Company figures reported are the following: |
| · | Consolidated
Net Sales reached CLP 773,552 million in the quarter, decreasing by 2.1% over the same quarter
of the previous year. Accumulated consolidated Net Sales reached CLP 2,618,437 million, representing
a 1.4% decrease regarding the previous year. |
| · | Consolidated
Operating Income* reached CLP 130,138 million in the quarter, representing a 13.1% increase
over the same quarter of the previous year. Accumulated consolidated Operating Income reached
CLP 357,337 million, an increase of 3.5% regarding the previous year. |
| · | Consolidated
Adjusted EBITDA* increased by 7.3% over the same quarter of the previous year, reaching CLP
159,070 million in the quarter. Adjusted EBITDA Margin reached 20.6%, an expansion of 180
basis points compared to the same quarter of the previous year. Accumulated consolidated
Adjusted EBITDA reached CLP 470,108 million, which represents an increase of 1.2% compared
to the previous year. Adjusted EBITDA Margin for the period reached 18.0%, an expansion of
47 basis points compared to the previous year. |
| · | Net
Income attributable to the owners of the controller for the quarter reached CLP 80,740 million,
representing an increase of 78.7% regarding the same quarter of the previous year. Accumulated
Net Income attributable to the owners of the controller was CLP 171,441 million, which represents
a 36.6% increase regarding the previous year. |
|
Consolidated quarterly and accumulated results were strongly affected by the depreciation of local
currencies, especially the Argentine peso against the reporting currency. Isolating this effect, i.e. on a currency neutral* basis,
the company's figures are as follows: |
| · | Consolidated
Net Sales reached CLP 823,505 million in the quarter, an increase of 4.2% over the same quarter
of the previous year. Accumulated consolidated Net Sales reached CLP 2,837,973 million, an
increase of 6.8% over the previous year. |
| · | Consolidated
Operating Income* reached CLP 137,588 million in the quarter, an increase of 19.6% over the
same quarter of the previous year. Accumulated consolidated Operating Income was CLP 390,000
million, an increase of 13.0% over the previous year. |
| · | Consolidated
Adjusted EBITDA* reached CLP 168,816 million in the quarter, an increase of 13.9% over the
same quarter of the previous year. Accumulated consolidated Adjusted EBITDA was CLP 514,227
million, an increase of 10.7% over the previous year. |
SUMMARY OF RESULTS FOURTH QUARTER AND FULL YEAR
ENDED DECEMBER 31, 2023
| (Figures
in million CLP) | |
| 4Q22 | | |
4Q23 | | |
Var % | | |
FY22 | | |
FY23 | | |
Var % | |
Sales
Volume
(Million Unit Cases) | |
| 250.9 | | |
248.4 | | |
-1.0 | % | |
873.6 | | |
882.6 | | |
1.0 | % |
| Net Sales | |
| 789,934 | | |
773,552 | | |
-2.1 | % | |
2,656,878 | | |
2,618,437 | | |
-1.4 | % |
| Operating Income* | |
| 115,042 | | |
130,138 | | |
13.1 | % | |
345,144 | | |
357,337 | | |
3.5 | % |
| Adjusted EBITDA* | |
| 148,257 | | |
159,070 | | |
7.3 | % | |
464,510 | | |
470,108 | | |
1.2 | % |
| Net income attributable to the owners of the controller | |
| 45,194 | | |
80,740 | | |
78.7 | % | |
125,498 | | |
171,441 | | |
36.6 | % |
*The definitions used can be found in the Glossary on page 16 of this document.
COCA-COLA ANDINA
4Q23 EARNINGS RELEASE
www.koandina.com | -2- |
Comment of the Chief Executive Officer.
Mr. Miguel Ángel Peirano
"We closed the fourth quarter of 2023
with solid financial results, as we had done in previous quarters. In local currency terms, adjusted EBITDA increased 20.6% (in real
terms) in Argentina, 19.5% in Brazil, 5.5% in Chile, and 23.1% in Paraguay. Adjusted consolidated EBITDA for the quarter reached CLP
159,070 million, a 7.3% increase in Chilean pesos with a margin expansion of 180 basis points, while income for the quarter increased
by 78.7% compared to the same period last year, reaching CLP 80,740 million.
It is worth noting that the strong devaluation
of the Argentine currency in December 2023 had a negative impact on the company's consolidated results. Because Argentina is a hyperinflationary
economy, IAS 29 requires that the results of this operation for the full year (and fourth quarter) be translated into Chilean pesos
using the period's closing exchange rate. Isolating this effect, the Company's adjusted EBITDA on a currency neutral basis* increased
by 13.9% during the quarter. Excluding the Argentine operation, the Company's EBITDA increased 12.9% over the same period the previous
year.
The Company's consolidated volume fell
1.0% in the quarter, owing to an 8.4% volume reduction in Argentina, a country experiencing a difficult macroeconomic situation that
has resulted in a significant loss of purchasing power by consumers, and an 8.3% decline in Chile, where we had adverse weather conditions
compared to the previous year. Both Brazil and Paraguay experienced volume growth of 10.8% and 5.5%, respectively, but it was insufficient
to offset the aforementioned volume reductions.
The
achievements we made in ESG issues in 2023 are equally important to the Company as the financial results. In December we were included
in the Dow Jones Chile Index for the eighth year in a row, as well as the Dow Jones Sustainability Index MILA Pacific Alliance for the
seventh year in a row. We are the top-ranked Chilean company in our industry and among the top four worldwide, also in our industry,
thanks to our commitment to these matters and our tenacity in addressing them. Our water consumption ratio at the end of the year
was 1.72 liters extracted for every liter of beverage produced. Notable accomplishments included the establishment of effluent water
treatment and recovery projects in Brazil and Chile, among other projects. In Argentina, Brazil, and Paraguay, we are already producing
bottles made from recycled PET resin. In Paraguay, we inaugurated Circular Pet, a plant in which we own 33.33%, allowing us to recycle
PET containers and transform them into recycled food-grade resin to produce new bottles, while in Chile, we are continuing to build the
Re-Ciclar plant, which will begin operations in 2024. In terms of soft drink returnability, we closed the year with 41.4% in Argentina,
40.0% in Paraguay, 41.1% in Chile, and 22.2% in Brazil, putting us among the top bottlers in the system globally. Our focus on energy
has led to the use of 100% renewable energy in Renca, Antofagasta, Ribeirão Preto and Duque de Caxias plants, as well as distribution
centers in Brazil. Finally, we were named Employer of the Year in Paraguay, and in Chile, we ranked first in the MERCO Talento beverage
category and second in the mass consumption category.
We estimate that the Capex for 2024 will
be around USD 250 million. A significant portion of this Capex will be allocated to investments in returnable bottles and cases, as well
as cold equipment to be installed at points of sale that require it, thereby supporting our on-premise and traditional channel customers.
In addition, we will continue with our project to expand and adapt our infrastructure in Brazil for the manufacture and storage of new
products, including the acquisition of a state-of-the-art mixed production line, capable of producing beer and alcoholic and non-alcoholic
beverages, which will be operational in early 2025. Finally, we will complete the projects for reopening the Mendoza plant in Argentina
and the PET resin recycling plant in Chile. It is important to note that this Capex estimate is constantly evaluated and monitored, and
it may change depending on the macroeconomic conditions of the countries in which we operate."
BASIS OF PRESENTATION
Figures in the following analysis are expressed
in accordance with IFRS, in nominal Chilean pesos, both for consolidated results and for the results of each of our operations. All variations
with respect to 2022 are nominal.
Since Argentina has been classified as a Hyperinflationary
economy, pursuant to IAS 29, translation of figures from local to reporting currency was performed using the closing exchange rate for
the translation to Chilean pesos. Local currency figures for both 2023 and 2022 referred to in the Argentina sections are expressed in
December 2023 currency.
Finally, a devaluation of local currencies regarding
the U.S. dollar has a negative impact on our dollarized costs and a devaluation of local currencies regarding the Chilean peso has a
negative impact upon consolidating figures.
COCA-COLA ANDINA
4Q23 EARNINGS RELEASE
www.koandina.com | -3- |
When we refer to "Argentina", we mean
our subsidiaries Embotelladora del Atlántico S.A. and Empaques Argentina S.A. When we refer to "Chile", we include all
companies domiciled in Chile, among which are Embotelladora Andina S.A., VJ S.A., Vital Aguas S.A., and Envases Central S.A.
CONSOLIDATED RESULTS: 4th Quarter 2023 vs. 4th Quarter 2022

| (Figures in million CLP) | |
4Q22 | | |
4Q23 | | |
Var % | |
| Net Sales | |
| 789,934 | | |
| 773,552 | | |
| -2.1 | % |
| Operating Income | |
| 115,042 | | |
| 130,138 | | |
| 13.1 | % |
| Adjusted EBITDA | |
| 148,257 | | |
| 159,070 | | |
| 7.3 | % |
| Net income attributable to the owners of the controller | |
| 45,194 | | |
| 80,740 | | |
| 78.7 | % |
During the quarter, consolidated Sales Volume
was 248.4 million unit cases, which represented a decrease of 1.0% compared to the same period of 2022, mainly explained by the volume
decrease of the operations in Argentina and Chile, partially offset by the volume increase of the operations in Brazil and Paraguay.
The Non-Alcoholic Beverages Segment represented 94.4% of consolidated Sales Volume and decreased 1.4%, mainly explained by the decrease
of the segment in Chile and Argentina, partially offset by the growth in Brazil and Paraguay. The Alcoholic Beverages Segment represented
5.6% of total volume and grew 6.6% explained by the volume growth in all countries where we operate. Transactions reached 1,361.3 million
during the quarter, representing a 2.4% decrease compared to the same quarter of the previous year.
Consolidated Net Sales decreased by 2.1% to CLP
773,552 million, explained by the reduction in revenues in Argentina, mainly due to lower volumes in that country and the impact of translating
figures to the reporting currency, which was partially offset by the revenue growth in Brazil and Paraguay.
Consolidated Cost of Sales decreased 4.4%, which
is mainly explained by (i) the effect of translating figures from the local currency of Argentina to the reporting currency, (ii) a
lower cost of Pet resin in the four countries where we operate, and (iii) lower volume sold in Argentina and Chile. This was partially
offset by (i) higher volume sold in Brazil and Paraguay, (ii) the shift in the mix towards higher unit cost products in Brazil,
Chile and Paraguay, and (iii) a higher cost of sugar, mainly in Argentina, Chile and Paraguay.
Consolidated Distribution Costs and Administrative
Expenses decreased 5.3%, which is mainly explained by (i) the effect of translating figures from the local currency of Argentina
to the reporting currency, and (ii) lower distribution costs in Argentina and Chile. This was partially offset by (i) higher
labor costs, and (ii) higher marketing expenses in Brazil and Chile.
The aforementioned effects led to a consolidated
Operating Income of CLP 130,138 million, an increase of 13.1%. Operating Margin was 16.8%.
Consolidated Adjusted EBITDA reached CLP 159,070
million, increasing by 7.3%. Adjusted EBITDA margin was 20.6%, an expansion of 180 basis points.
Net income attributable to the owners of the
controller for the quarter was CLP 80,740 million, an increase of 78.7%, and Net Margin reached 10.4%, an expansion of 472 basis points.
COCA-COLA ANDINA
4Q23 EARNINGS RELEASE
www.koandina.com | -4- |
ARGENTINA: 4th Quarter 2023 vs. 4th Quarter 2022
| | |
| 4Q22 | | |
| 4Q23 | | |
| Var
% | | |
| 4Q22 | | |
| 4Q23 | | |
| Var
% | |
| | |
| (Figures in million CLP) | | |
| (Figures
in million ARS of December 2023) | |
| Net Sales | |
| 202,411 | | |
| 129,595 | | |
| -36.0 | % | |
| 129,848 | | |
| 119,449 | | |
| -8.0 | % |
| Operating Income | |
| 19,867 | | |
| 18,683 | | |
| -6.0 | % | |
| 12,745 | | |
| 17,221 | | |
| 35.1 | % |
| Adjusted EBITDA | |
| 28,789 | | |
| 24,169 | | |
| -16.0 | % | |
| 18,468 | | |
| 22,277 | | |
| 20.6 | % |
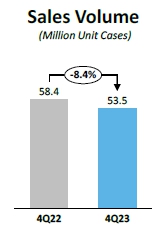
Sales volume in the quarter decreased 8.4%, reaching
53.5 million unit cases, explained by the decrease in the volume of the Soft Drinks, Waters and Juices and other non-alcoholic beverages
categories, partially offset by the increase in the Beer and other alcoholic beverages category. The reduction in sales volume is mainly
explained by the fact that the country is going through a difficult macroeconomic situation that has resulted in a significant loss of
purchasing power on the part of consumers. Transactions amounted to 252.4 million, representing a decrease of 8.8%.
Net sales amounted to CLP 129,595 million, down
36.0%. In local currency, they decreased by 8.0%, which was mainly explained by the aforementioned decrease in volume, slightly offset
by the increase in the average revenue per unit case sold, as a result of price increases in line with local inflation during the quarter.
Cost of Sales decreased 41.3%, while in local
currency it decreased 15.7%, which is mainly explained by (i) the lower sales volume, (ii) a lower cost of concentrate, and
(iii) a lower cost of Pet resin. This was partially offset by (i) higher labor costs, and (ii) higher sugar costs.
Distribution Costs and Administrative Expenses
decreased 36.3% in the reporting currency, while in local currency they decreased 8.4%, which is mainly explained by lower distribution
and transportation freight expenses and lower volume sold. This was partially offset by higher labor expenses.
The aforementioned effects led to an Operating
Income of CLP 18,683 million, a decrease of 6.0% compared to the same period of the previous year. Operating Margin was 14.4%. In local
currency, Operating Income increased 35.1%.
Adjusted EBITDA amounted to CLP 24,169 million,
a decrease of 16.0%. Adjusted EBITDA margin was 18.6%, an expansion of 443 basis points. Adjusted EBITDA in local currency increased
20.6%.
BRAZIL: 4th Quarter 2023 vs. 4th Quarter 2022
| | |
| 4Q22 | | |
| 4Q23 | | |
| Var
% | | |
| 4Q22 | | |
| 4Q23 | | |
| Var
% | |
| | |
| (Figures
in million CLP) | | |
| (Figures
in million BRL) | |
| Net Sales | |
| 192,836 | | |
| 243,604 | | |
| 26.3 | % | |
| 1,112 | | |
| 1,349 | | |
| 21.3 | % |
| Operating Income | |
| 30,463 | | |
| 41,705 | | |
| 36.9 | % | |
| 177 | | |
| 231 | | |
| 30.7 | % |
| Adjusted EBITDA | |
| 39,558 | | |
| 49,284 | | |
| 24.6 | % | |
| 228 | | |
| 273 | | |
| 19.5 | % |
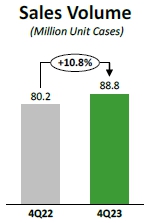
Sales volume for the quarter reached 88.8 million
unit cases, an increase of 10.8%, explained by the increase in all categories. The Non-Alcoholic Beverages Segment represented 98.0%
of total sales volume, and grew 10.2%, which was explained by the growth of all categories, especially Waters and Juices and other non-alcoholic
beverages. The Alcoholic Beverages segment represented 2.0% of total volume and grew 49.6%, explained by the increase in the Beer and
Other alcoholic beverages categories. Transactions amounted to 475.0 million, an increase of 8.5%.
Net Sales amounted to CLP 243,604 million, an
increase of 26.3%. In local currency, Net Sales increased 21.3%, which was mainly explained by the aforementioned increase in volume
and the increase in the average revenue per unit case sold. Net Sales of the Non-Alcoholic Beverages segment increased 20.0% in local
currency, representing 94.4% of total sales. Net Sales of the Alcoholic Beverages Segment increased 49.0% in local currency, representing
5.6% of total sales.
COCA-COLA ANDINA
4Q23 EARNINGS RELEASE
www.koandina.com | -5- |
Cost of Sales increased 23.9%, while in local
currency it increased 19.1%, which is mainly explained by (i) higher sales volume, (ii) a shift in the mix towards higher unit
cost products, and (iii) higher labor costs. This was partially offset by lower raw material costs, especially Pet resin.
Distribution Costs and Administrative Expenses
increased 25.7% in the reporting currency. In local currency, they increased 20.6%, which is mainly explained by (i) higher distribution
expenses, due to both higher volumes and higher tariffs, (ii) higher labor expenses, and (iii) higher marketing expenses.
The aforementioned effects led to an Operating
Income of CLP 41,705 million, an increase of 36.9%. Operating Margin was 17.1%. In local currency, Operating Income increased 30.7%.
Adjusted EBITDA reached CLP 49,284 million, an
increase of 24.6% over the previous year. Adjusted EBITDA margin was 20.2%, a contraction of 28 basis points. In local currency, Adjusted
EBITDA increased 19.5%.
CHILE: 4th Quarter 2023 vs. 4th Quarter 2022
| | |
| 4Q22 | | |
| 4Q23 | | |
| Var
% | |
| | |
| (Figures
in million CLP) | |
| Net Sales | |
| 332,666 | | |
| 332,474 | | |
| -0.1 | % |
| Operating Income | |
| 51,332 | | |
| 54,183 | | |
| 5.6 | % |
| Adjusted EBITDA | |
| 62,858 | | |
| 66,340 | | |
| 5.5 | % |
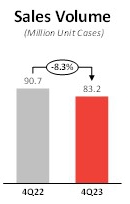
During the quarter, Sales Volume reached 83.2
million unit cases, a decrease of 8.3%, explained by the decrease in the Soft Drinks, Waters and Juices and other non-alcoholic beverages
categories, partially offset by the increase in the Beer and other alcoholic beverages category. Sales volume was mainly affected by
adverse weather factors compared to the previous year. Transactions totaled 494.5 million, representing a decrease of 10.0%. The volume
of the Non-Alcoholic Beverages Segment represented 85.7% of total Sales Volume, and decreased 9.6%, which was explained by the decrease
in all categories. The volume of the Alcoholic Beverages Segment represented 14.3% of total Sales Volume, and grew 0.8%, explained by
the increase in the Other alcoholic beverages category, partially offset by the decrease in the Beer category.
Net Sales reached CLP 332,474 million, a 0.1%
decrease, which is mainly explained by the aforementioned decrease in volume, partially offset by the increase in the average revenue
per unit case sold, as a result of price increases. Net Sales of the Non-Alcoholic Beverages segment decreased 2.9%, representing 74.3%
of total sales. Net Sales of the Alcoholic Beverages Segment increased 9.1%, representing 25.7% of total sales.
Cost of Sales decreased 3.7%, which is mainly
explained by (i) the lower volume sold, and (ii) a lower cost of raw materials, especially Pet resin. This was partially offset
by (i) a shift in the mix towards higher unit cost products, and (ii) a higher cost of sugar.
Distribution Costs and Administrative Expenses
increased 7.9%, which is mainly explained by (i) higher marketing expenses, and (ii) higher cost of labor and services provided
by third parties. This was partially offset by lower distribution and transportation expenses due to lower volumes.
The aforementioned effects led to an Operating
Income of CLP 54,183 million, 5.6% higher when compared to the previous year. Operating Margin was 16.3%.
Adjusted EBITDA reached CLP 66,340 million, an
increase of 5.5%. Adjusted EBITDA Margin was 20.0%, an expansion of 106 basis points.
COCA-COLA ANDINA
4Q23 EARNINGS RELEASE
www.koandina.com | -6- |
PARAGUAY: 4th Quarter 2023 vs. 4th Quarter 2022
| | |
| 4Q22 | | |
| 4Q23 | | |
| Var
% | | |
| 4Q22 | | |
| 4Q23 | | |
| Var
% | |
| | |
| (Figures
in million CLP) | | |
| (Figures
in million PGY) | |
| Net Sales | |
| 63,418 | | |
| 69,230 | | |
| 9.2 | % | |
| 503,558 | | |
| 572,666 | | |
| 13.7 | % |
| Operating Income | |
| 15,463 | | |
| 18,869 | | |
| 22.0 | % | |
| 123,670 | | |
| 156,560 | | |
| 26.6 | % |
| Adjusted EBITDA | |
| 19,136 | | |
| 22,662 | | |
| 18.4 | % | |
| 152,655 | | |
| 187,934 | | |
| 23.1 | % |
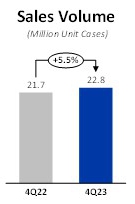
During the quarter, Sales Volume reached 22.8
million unit cases, an increase of 5.5%, explained by the volume increase in the Soft Drinks and Juices and other non-alcoholic beverages
categories, partially offset by the decrease in the Water category. Transactions totaled 139.3 million, an increase of 6.6%.
Net Sales amounted to CLP 69,230 million, an
increase of 9.2%. In local currency, Net Sales increased 13.7%, which was mainly explained by a higher average revenue per unit case
sold and the aforementioned increase in volume.
Cost of Sales in the reporting currency increased
7.1%. In local currency, it increased 11.6%, which is mainly explained by (i) the higher volume sold, (ii) a higher cost of
concentrate due to price increases, (iii) a higher cost of sugar and fructose, and (iv) the shift in the mix towards higher
unit cost products. This was partially offset by a lower cost of Pet resin.
Distribution Costs and Administrative Expenses
decreased 1.3%, and in local currency they increased 3.0%. This is mainly explained by (i) higher distribution expenses, due to
the higher volume sold, and (ii) higher cost of labor and services provided by third parties. This was partially offset by higher
other operating income, which is classified under this item.
The aforementioned effects led to an Operating
Income of CLP 18,869 million, 22.0% higher when compared to the previous year. Operating Margin reached 27.3%. In local currency, operating
income increased 26.6%.
Adjusted EBITDA reached CLP 22,662 million, an
increase of 18.4%, and Adjusted EBITDA Margin was 32.7%, an expansion of 256 basis points. In local currency Adjusted EBITDA increased
23.1%.
ACCUMULATED RESULTS: Full year ended December 31, 2023 vs.
Full year ended December 31, 2022
Consolidated Results
| (Figures in million CLP) | |
FY22 | | |
FY23 | | |
Var
% | |
| Net Sales | |
| 2,656,878 | | |
| 2,618,437 | | |
| -1.4 | % |
| Operating Income | |
| 345,144 | | |
| 357,337 | | |
| 3.5 | % |
| Adjusted EBITDA | |
| 464,510 | | |
| 470,108 | | |
| 1.2 | % |
| Net income attributable to the owners
of the controller | |
| 125,498 | | |
| 171,441 | | |
| 36.6 | % |
Consolidated Sales Volume was 882.6 million unit
cases, which represented an increase of 1.0% compared to the same period of 2022, mainly explained by the volume increase in the Brazilian
and Paraguayan operations, partially offset by the volume decrease in the Argentine and Chilean operations. The Non-Alcoholic Beverages
Segment represented 94.7% of consolidated Sales Volume and grew 1.1%, explained by the growth of the Segment in Brazil and Paraguay,
partially offset by the decrease in Argentina and Chile. The Alcoholic Beverages Segment represented 5.3% of total volume and grew 0.7%,
which was mainly explained by the growth of the Segment in the Brazilian and Argentine operations, and was partially offset by the reduction
of the Segment's volume in the Chilean operation. Transactions amounted to 4,859.6 million, an increase of 0.7%. Consolidated Net Sales
amounted to CLP 2,618,437 million, a decrease of 1.4%.
Consolidated Cost of Sales decreased by 1.6%,
which is mainly explained by (i) the effect of translating figures from the local currencies of Argentina and Paraguay to the reporting
currency, (ii) a lower cost of Pet resin in the four countries where we operate, and (iii) a lower cost of concentrate in Argentina.
This was partially offset by (i) the higher cost of concentrate due to price increases in Chile and Paraguay, (ii) the higher
volume sold in Brazil and Paraguay, (iii) the shift in the mix towards higher unit cost products in Brazil, Chile and Paraguay,
and (iv) a higher cost of sugar in all four operations.
COCA-COLA ANDINA
4Q23 EARNINGS RELEASE
www.koandina.com | -7- |
Consolidated Distribution Costs and Administrative
Expenses decreased by 3.5%, which is mainly explained by (i) the effect of translating figures from the local currencies of Argentina
and Paraguay to the reporting currency, and (ii) lower freight expense in Argentina. This was partially offset by (i) higher
distribution expenses in Brazil, Chile and Paraguay, (ii) higher labor costs, and (iii) higher marketing expenses in Argentina
and Chile.
The aforementioned effects led to a consolidated
Operating Income of CLP 357,337 million, an increase of 3.5%. Operating Margin was 13.6%.
Consolidated Adjusted EBITDA reached CLP 470,108
million, an increase of 1.2%. Adjusted EBITDA Margin was 18.0%, an expansion of 47 basis points.
Net income attributable to the owners of the
controller was CLP 171,441 million, an increase of 36.6%, and net margin reached 6.5%, an expansion of 182 basis points.
Argentina
| | |
FY22 | | |
FY23 | | |
Var
% | | |
FY22 | | |
FY23 | | |
Var
% | |
| | |
(Figures in million CLP) | | |
(Figures
in million ARS of December 2023) | |
| Net Sales | |
| 688,705 | | |
| 460,338 | | |
| -33.2 | % | |
| 441,807 | | |
| 424,298 | | |
| -4.0 | % |
| Operating Income | |
| 86,499 | | |
| 62,960 | | |
| -27.2 | % | |
| 55,490 | | |
| 58,031 | | |
| 4.6 | % |
| Adjusted EBITDA | |
| 119,942 | | |
| 86,016 | | |
| -28.3 | % | |
| 76,944 | | |
| 79,282 | | |
| 3.0 | % |
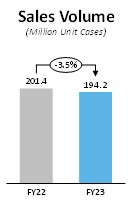
Sales volume decreased 3.5%, reaching 194.2 million
unit cases, explained by the decrease in the volume of the Soft Drinks and Juices and other non-alcoholic beverages category, partially
offset by the increase in the volume of the Water and Beer and other alcoholic beverages categories. Transactions amounted to 926.3 million,
representing a decrease of 2.2%.
Net Sales amounted to CLP 460,338 million, a
decrease of 33.2%, while in local currency, Net Sales decreased by 4.0%, which was mainly explained by the aforementioned decrease in
volume.
Cost of Sales decreased 36.2%. In local currency,
it decreased 8.3%, which is mainly explained by (i) the reduction in volume sold, (ii) a lower cost of concentrate, and (iii) a
lower cost of Pet resin. This was partially offset by higher labor costs.
Distribution Costs and Administrative Expenses
decreased 30.6% in the reporting currency. In local currency, these decreased 0.3%, which is mainly explained by a lower distribution
cost due to lower sales volume. This was partially offset by (i) higher labor expenses, and (ii) higher advertising expenses.
The aforementioned effects led to an Operating
Income of CLP 62,960 million, a decrease of 27.2%. Operating Margin was 13.7%. In local currency, Operating Income increased 4.6%.
Adjusted EBITDA reached CLP 86,016 million, a
decrease of 28.3%. Adjusted EBITDA margin was 18.7%, an expansion of 127 basis points. Adjusted EBITDA in local currency increased 3.0%.
COCA-COLA ANDINA
4Q23 EARNINGS RELEASE
www.koandina.com | -8- |
Brazil

| | |
FY22 | | |
FY23 | | |
Var % | | |
FY22 | | |
FY23 | | |
Var % | |
| | |
| | |
| | |
| | |
| | |
| | |
| |
| | |
(Figures in million CLP) | | |
(Figures in million BRL) | |
| Net Sales | |
636,860 | | |
745,383 | | |
17.0 | % | |
3,753 | | |
4,404 | | |
17.3 | % |
| Operating Income | |
81,206 | | |
108,705 | | |
33.9 | % | |
479 | | |
638 | | |
33.3 | % |
| Adjusted EBITDA | |
113,094 | | |
140,090 | | |
23.9 | % | |
666 | | |
825 | | |
23.9 | % |
Sales volume increased 8.2%, reaching 300.9 million
unit cases, explained by the increase in volume of all categories. The Non-Alcoholic Beverages segment represented 98.1% of total sales
volume, and grew 8.0%, which was explained by the growth of all categories in the segment. The Alcoholic Beverages segment represented
1.9% of total volume and grew 23.6%, which was explained by the growth of all categories in the segment. Transactions reached 1,642.4
million, an increase of 7.5%.
Net Sales reached CLP 745,383 million, an increase
of 17.0%. In local currency, Net Sales increased 17.3%, due to a higher average price as a result of the price increases we have implemented
and the aforementioned increase in volume. Net Sales of the Non-Alcoholic Beverages segment increased 16.4% in local currency, representing
94.3% of total sales. Net Sales of the Alcoholic Beverages segment increased 35.2% in local currency, representing 5.7% of total sales.
Cost of Sales increased 14.1%, while in local
currency it increased 14.5%, which is mainly explained by (i) the higher sales volume, (ii) the shift in the mix towards higher
unit cost products, (iii) a higher sugar cost, and (iv) a higher labor cost. This was partially offset by a lower cost of raw
materials, especially Pet resin.
Distribution Costs and Administrative Expenses
increased 15.8% in the reporting currency, and in local currency they increased 16.3%, which is mainly explained by (i) higher labor
costs, (ii) higher distribution and transportation expenses, and (iii) higher depreciation charges.
The aforementioned effects led to an Operating
Income of CLP 108,705 million, an increase of 33.9%. Operating Margin was 14.6%. In local currency, Operating Income increased 33.3%.
Adjusted EBITDA reached CLP 140,090 million, an
increase of 23.9% over the previous year. Adjusted EBITDA Margin was 18.8%, an expansion of 104 basis points. In local currency, Adjusted
EBITDA increased 23.9%.
Chile
| | |
FY22 | | |
FY23 | | |
Var % | |
| | |
(Figures
in million CLP) | |
| Net Sales | |
| 1,123,665 | | |
| 1,191,974 | | |
| 6.1 | % |
| Operating Income | |
| 134,840 | | |
| 139,519 | | |
| 3.5 | % |
| Adjusted EBITDA | |
| 175,554 | | |
| 184,450 | | |
| 5.1 | % |
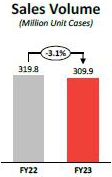
Sales volume reached 309.9 million unit cases,
a decrease of 3.1%, explained by the decrease in the volume of the Soft Drinks, Juices and other non-alcoholic beverages and Beer and
other alcoholic beverages categories, partially offset by the increase in the Water category. Transactions amounted to 1,813.2 million,
representing a decrease of 4.8%. The Non-Alcoholic Beverages Segment represented 86.9% of total Sales Volume, and decreased by 3.1%, which
was explained by the decrease in the volume of the Soft Drinks and Juices and other non-alcoholic beverages categories, partially offset
by the increase in the Waters category. The Alcoholic Beverages segment represented 13.1% of total sales volume and decreased 2.9%, explained
by the decrease in the Beer category, partially offset by the increase in the Other alcoholic beverages category.
COCA-COLA ANDINA
4Q23 EARNINGS RELEASE
www.koandina.com | -9- |
Net Sales amounted to CLP 1,191,974 million, an
increase of 6.1%, which is explained by a higher average price in the period, due to the price increases performed, partially offset by
the aforementioned decrease in volume. Net Sales of the Non-Alcoholic Beverages segment increased 5.6%, representing 75.6% of total sales.
Net Sales of the Alcoholic Beverages Segment increased 7.4%, representing 24.4% of total sales.
Cost of Sales increased 5.6%, which is mainly
explained by (i) a shift in the mix towards higher unit cost products, and (ii) a higher cost of concentrate due to the implementation
of price increases. This was partially offset by a lower cost of raw materials, especially Pet resin.
Distribution Costs and Administrative Expenses
increased 8.8%, which is mainly explained by (i) a higher cost of labor and services provided by third parties, (ii) higher
distribution and transportation expenses, as a consequence of higher tariffs, and (iii) higher marketing expenses.
The aforementioned effects led to an Operating
Income of CLP 139,519 million, 3.5% higher when compared to the previous year. Operating Margin was 11.7%.
Adjusted EBITDA reached CLP 184,450 million, an
increase of 5.1%. Adjusted EBITDA Margin was 15.5%, a contraction of 15 basis points.
Paraguay

| | |
FY22 | | |
FY23 | | |
Var % | | |
FY22 | | |
FY23 | | |
Var % | |
| | |
| | |
| | |
| | |
| | |
| | |
| |
| | |
(Figures in million CLP) | | |
(Figures in million PGY) | |
| Net Sales | |
| 212,339 | | |
| 223,841 | | |
| 5.4 | % | |
| 1,706,394 | | |
| 1,937,751 | | |
| 13.6 | % |
| Operating Income | |
| 49,709 | | |
| 54,722 | | |
| 10.1 | % | |
| 402,745 | | |
| 473,188 | | |
| 17.5 | % |
| Adjusted EBITDA | |
| 63,029 | | |
| 68,452 | | |
| 8.6 | % | |
| 509,070 | | |
| 592,351 | | |
| 16.4 | % |
Sales volume reached 77.6 million unit cases,
an increase of 4.3%, explained by the increase in volume in all categories. Transactions reached 477.8 million, an increase of 6.4%.
Net sales amounted to CLP 223,841 million, an
increase of 5.4%. In local currency, Net Sales increased 13.6%, which is explained by a higher average price, and to a lesser extent by
the aforementioned increase in Sales Volume.
Cost of Sales increased 5.2% and in local currency
increased 13.5%, which is mainly explained by (i) the higher sales volume, (ii) a higher cost of concentrate due to price increases,
(iii) a change in the mix towards higher unit cost products, and (iv) a higher cost of sweeteners. This was partially offset
by the lower cost of Pet resin.
Distribution Costs and Administrative Expenses
increased 0.6% in reported currency. In local currency, it increased 9.1%, which is mainly explained by (i) higher distribution expenses,
mainly due to higher tariffs, and (ii) higher labor and services provided by third parties.
The aforementioned effects led to an Operating
Income of CLP 54,722 million, 10.1% higher when compared to the previous year. Operating Margin reached 24.4%. In local currency, Operating
Income increased 17.5%.
Adjusted EBITDA reached CLP 68,452 million, 8.6%
higher when compared to the previous year, and the Adjusted EBITDA Margin was 30.6%, an expansion of 90 basis points. In local currency,
Adjusted EBITDA increased 16.4%.
NON-OPERATING RESULTS
FOR THE QUARTER
Net Financial Income and Expenses account recorded
an expense of CLP 8,247 million, which compares to an expense of CLP 6,470 million in the same quarter of the previous year, mainly due
to higher debt and lower financial income in our subsidiary in Argentina.
Share of Profit or Loss from Investments Accounted
for by the Equity Method went from a gain of CLP 1,124 million to a gain of CLP 2,721 million, which is mainly explained by higher results
of subsidiaries in Chile.
Other Income and Expenses account recorded a loss
of CLP 1,282 million, compared to a loss of CLP 5,248 million in the same quarter of the previous year. The difference is mainly explained
by higher revenues from the sale of mineral water sources in Brazil to The Coca-Cola Company.
COCA-COLA ANDINA
4Q23 EARNINGS RELEASE
www.koandina.com | -10- |
Results by Adjustment Units and Exchange Rate
Differences account went from a loss of CLP 15,849 million to a loss of CLP 10,665 million. This lower loss is mainly explained by a decrease
in the loss from on indexation units, due to the positive effect of the price-level restatement of balance sheet and income statement
accounts in Argentina, as well as the effect of lower inflation in Chile on the UF debt. These effects were partially offset by exchange
losses in Argentina.
Income Tax went from -CLP 41,806 million to -CLP
30,255 million, a variation that is mainly explained by the positive tax effect of the exchange rate difference and by lower inflation.
These effects were partially offset by higher operating income.
CONSOLIDATED BALANCE
The following are the balances of Assets and Liabilities as of the
closing date of these financial statements:
| | |
12.31.2022 | | |
12.31.2023 | | |
Variation | |
| Assets | |
million CLP | | |
million CLP | | |
million CLP | |
| Current assets | |
| 1,161,729 | | |
| 981,771 | | |
| -179,958 | |
| Non-current assets | |
| 1,848,971 | | |
| 1,939,750 | | |
| 90,779 | |
| Total Assets | |
| 3,010,701 | | |
| 2,921,521 | | |
| -89,180 | |
| | |
| | | |
| | | |
| | |
| | |
12.31.2022 | | |
12.31.2023 | | |
Variation | |
| Liabilities | |
million CLP | | |
million CLP | | |
million CLP | |
| Current liabilities | |
| 949,245 | | |
| 692,871 | | |
| -256,374 | |
| Non-current liabilities | |
| 1,178,053 | | |
| 1,307,664 | | |
| 129,611 | |
| Total Liabilities | |
| 2,127,298 | | |
| 2,000,535 | | |
| -126,762 | |
| | |
| | | |
| | | |
| | |
| | |
12.31.2022 | | |
12.31.2023 | | |
Variation | |
| Equity | |
million CLP | | |
million CLP | | |
million CLP | |
| Non-controlling interests | |
| 28,143 | | |
| 34,695 | | |
| 6,552 | |
| Equity attributable to the owners of the controller | |
| 855,260 | | |
| 886,291 | | |
| 31,030 | |
| Total Equity | |
| 883,403 | | |
| 920,985 | | |
| 37,583 | |
At the closing of December 2023, with respect
to the closing of 2022, the Argentine peso depreciated 345.3% with respect to the Chilean peso, which generated a decrease in assets,
liabilities and equity accounts, due to the effect of translation of figures to the reporting currency. Additionally, the figures for
Argentina, in accordance with IAS 29, prior to the translation of figures, are adjusted for accumulated inflation as of the end of 2022,
until the closing currency of this report (December 2023), increasing the figures in local currency by 211.2%. On the other hand,
the Brazilian real and the Paraguayan guarani appreciated against the Chilean peso by 9.5% and 3.3%, respectively, which generated an
increase in assets, liabilities and equity accounts, due to the effect of translation of figures to the reporting currency.
In September, one of the 144A/RegS format bonds
issued in the United States matured. The maturity was for USD 365 million at a rate of 5.00% [USD], a bond that was redenominated through
derivatives into Brazilian reais for a total of BRL 840 million at a fixed rate of 13.51% [BRL]. This maturity was refinanced through
the issuance, in September, of a new bond in the Swiss market for a total of CHF 170 million at a fixed rate of 2.7175% [CHF] for a term
of 5 years, these conditions were redenominated through the use of derivatives, to Brazilian reais for a total of BRL 920 million at a
fixed rate of 11.27% [BRL].
Assets
Total assets decreased by CLP 89,180 million,
3.0% compared to December 2022.
Current assets decreased by CLP 179,958 million,
15.5% compared to December 2022, which is mainly explained by the decrease in Other current financial assets (- CLP 195,759 million),
mainly due to the liquidation of the cross currency swap associated with the 144A bond that matured in September 2023. This decrease
was partially offset by the increase in Trade and other current accounts receivable (CLP 19,122 million), mainly in the operations in
Chile, Brazil and Paraguay, and by the increase in Cash and cash equivalents (CLP 12,002 million).
Non-current assets increased by CLP 90,779 million,
4.9% compared to December 2022, mainly due to the increase in Property, plant and equipment (CLP 74,168 million) due to investments
made (CLP 222,620 million), which were partially offset by the negative effect of translation and readjustment due to IAS29, and by the
Depreciation account. In addition to this increase, there was an increase in Intangible assets other than goodwill (CLP 24,148 million),
mainly explained by the positive translation effect of the figures of our subsidiaries in Brazil and Paraguay.
Liabilities and Equity
Total liabilities decreased by CLP 126,762 million,
6.0% compared to December 2022.
COCA-COLA ANDINA
4Q23 EARNINGS RELEASE
www.koandina.com | -11- |
Current liabilities decreased by CLP 256,374 million,
27.0% compared to December 2022, mainly due to the decrease in Other current financial liabilities (-CLP 314,305 million) mainly
explained by the payment on maturity of the 144A Bond. This decrease was partially offset by the increase in Trade and other current accounts
payable (CLP 44,110 million), mainly explained by the reclassification of the account payable maintained with the former shareholders
of Companhia de Bebidas Ipiranga related to a tax credit, from the caption "Other non-current non-financial liabilities", considering
that it is a debt that will be paid in the short term.
On the other hand, non-current liabilities increased
by CLP 129,611 million, 11.0% compared to December 2022, mainly due to the increase in Other non-current financial liabilities (CLP
139,524 million), which is mainly explained by the placement of the Swiss Bond, which is partially offset by the decrease in the mark
to market liability of the cross currency swap of the bond issued in the United States in 2020 (Senior Notes due 2050).
Equity increased by CLP 37,583 million, 4.3% compared
to December 2022, explained by the increase in Accumulated Earnings as a result of the profits obtained in the previously mentioned
period, the restatement of equity balances in our subsidiary in Argentina, in accordance with IAS 29 (CLP 48,864 million) and by the distribution
of dividends (-CLP 167,969 million). The increase in Accumulated Earnings was partially offset by the decrease in Other reserves (-CLP
21,306 million).
FINANCIAL ASSETS AND
LIABILITIES
| CONSOLIDATED NET FINANCIAL DEBT | |
(USD million) | |
| Total Financial Assets | |
| 452 | |
| Cash and Cash Equivalent (1) | |
| 346 | |
| Other current financial assets (1) | |
| 75 | |
| Net valuation of Hedge Derivatives (2) | |
| 30 | |
| | |
| | |
| Financial Debt | |
| 1,175 | |
| Bonds on the international market | |
| 505 | |
| Bonds on the local market (Chile) | |
| 614 | |
| Bank Debt and Others | |
| 57 | |
| | |
| | |
| Net Financial Debt | |
| 724 | |
(1) Financial
Assets corresponding to Cash and Cash Equivalents and Other current financial assets are held invested in low-risk instruments such as
time deposits, short-term fixed-income mutual funds and others.
(2)
Considers the net effect of valuations in favor of and against hedge derivatives.
CURRENCY EXPOSURE (%)
| | |
Financial
Assets (1) | | |
Financial
Debt (3) | |
| CLP (Chile) | |
43 | % | |
27 | % |
Unidad de Fomento (CLP indexed to inflation) | |
13 | % | |
54 | % |
| BRL (Brazil) | |
26 | % | |
19 | % |
| PGY (Paraguay) | |
11 | % | |
0 | % |
| ARS (Argentina) | |
5 | % | |
0 | % |
| USD (United States) | |
2 | % | |
0 | % |
| Total | |
100 | % | |
100 | % |
(3) Includes
valuation of hedge derivatives.
RISK RATING
| Local
rating agencies | |
Rating | |
| ICR | |
| AA+ | |
| Fitch Chile | |
| AA+ | |
| International
rating agencies | |
| Rating | |
| Standard & Poors | |
| BBB | |
| Fitch Ratings, Inc. | |
| BBB+ | |
DEBT AMORTIZATION PROFILE

CASH FLOW
| | |
12.31.2022 | | |
12.31.2023 | | |
Variation | |
| Cash flow | |
million CLP | | |
million CLP | | |
million CLP | | |
% | |
| Operating | |
397,452 | | |
366,830 | | |
-30,622 | | |
-7.7 | % |
| Investment | |
-85,168 | | |
-158,289 | | |
-73,120 | | |
85.9 | % |
| Financing | |
-286,963 | | |
-187,127 | | |
99,837 | | |
-34.8 | % |
| Net Cash Flow for the period | |
25,321 | | |
21,415 | | |
-3,906 | | |
-15.4 | % |
COCA-COLA ANDINA
4Q23 EARNINGS RELEASE
www.koandina.com | -12- |
During the period, the Company generated a positive
net cash flow of CLP 21,415 million, which is explained as follows:
Operating activities generated a positive net
cash flow of CLP 366,830 million, lower than the CLP 397,452 million recorded in the same period of 2022, mainly due to higher other
operating payments.
Investing activities generated a negative cash
flow of CLP 158,289 million, with a negative variation of CLP 73,120 million with respect to the previous period, which is mainly explained
by lower redemptions of financial instruments compared to 2022 for CLP 69,191 million, added to a higher investment in Capex for CLP
6,000 million.
Financing activities generated a negative cash
flow of CLP 187,127 million, with a positive variation of CLP 99,837 million with respect to the previous period, which is mainly explained
by lower dividend payments than in 2022.
MAIN INDICATORS
| INDICATOR |
Definition |
Unit |
Dec
23 |
Dec
22 |
Dec
23 vs Dec 22 |
| LIQUIDITY |
|
|
|
|
|
| |
Current
liquidity |
Current
Asset |
Times |
1.4 |
1.2 |
15.8% |
| |
|
Current
Liability |
|
|
|
|
| |
Acid
ratio |
Current
Asset – Inventory |
Times |
1.1 |
1.0 |
12.0% |
| |
|
Current
Liability |
|
|
|
|
| ACTIVITY |
|
|
|
|
|
| |
Investment |
|
Million
CLP |
222,620 |
173,675 |
28.2% |
| |
|
|
|
|
|
|
| |
Inventory
turnover |
Cost
of Sales |
Times |
6.7
|
7.4 |
-10.2% |
| |
|
Average
Inventory |
|
|
|
|
| INDEBTEDNESS |
|
|
|
|
|
| |
Indebtedness
ratio |
Net
Financial Debt* |
Times |
0.7 |
0.7 |
-2.7% |
| |
|
Total
Equity* |
|
|
|
|
| |
Financial
exp. coverage |
Adjusted
EBITDA (12M) |
Times |
13.6 |
19.9 |
-31.5% |
| |
|
Financial
Expenses* (12M) – Financial Income* (12M) |
|
|
|
|
| |
Net
financial debt / |
Net
Financial Debt |
Times |
1.4 |
1.3 |
0.2% |
| |
Adjusted
EBITDA |
Adjusted
EBITDA (12M) |
|
|
|
|
| PROFITABILITY
|
|
|
|
|
|
| |
On
Equity |
Net
Income Fiscal Year (12M) |
% |
19.7% |
13.0% |
6.7
pp |
| |
|
Average
Equity |
|
|
|
|
| |
On
Total Assets |
Net
Income Fiscal Year (12M) |
% |
5.8% |
4.2% |
1.6
pp |
| |
|
Average
Assets |
|
|
|
|
Liquidity
Current Liquidity showed a positive variation
of 15.8% with respect to December 2022, explained by the 27.0% decrease in current liabilities, which was greater than the decrease
in current assets (15.5%).
The Acid Ratio showed an increase of 12.0% with
respect to December 2022, for the reasons explained above, in addition to the decrease in inventories (5.2%) in the period. Current
assets excluding inventories showed a decrease of 18.2% compared to December 2022.
Activity
At the closing of December 2023, investments
reached CLP 222,620 million, which corresponds to an increase of 28.2% compared to the same period of 2022, mainly explained by higher
productive investments such as the returnable capacity expansion in our subsidiary in Argentina and the beer plant in our subsidiary
in Brazil.
Inventory turnover reached 6.7 times, showing
a decrease of 10.2% versus the same period of 2022, mainly explained by the increase in average inventory by 9.5% versus the same period
of 2022, added to the decrease in cost of sales (1.6%).
* Definitions
used are contained in the Glossary on page 16 of this document.
| COCA-COLA ANDINA | |
| 4Q23 EARNINGS RELEASE | |
| www.koandina.com | -13- |
Indebtedness
The indebtedness ratio reached 0.7 times at the
closing of December 2023, which corresponds to a decrease of 2.7% compared to the closing of December 2022. This is mainly
due to the 4.3% increase in equity.
The Financial Expense Coverage indicator shows
a decrease of 31.5% when compared to December 2022, reaching 13.6 times. This is explained by an increase in net financial expenses
(rolling 12 months) of 47.8% and the increase in Adjusted EBITDA (rolling 12 months) of 1.2% for the period.
Net financial debt/Adjusted EBITDA reached 1.4
times, which represents an increase of 0.2% compared to December 2022. This is due to the 1.5% increase in net financial debt, along
with the 1.2% increase in Adjusted EBITDA for the period.
Profitability
Return on equity reached 19.7%, 6.7 percentage
points higher than the indicator measured in December 2022. This result is due to the increase in Net Income for the rolling 12-month
period (36.6%), together with the decrease in Average Equity (9.8%).
Return on Total Assets was 5.8%, 1.6 percentage
points higher than the indicator measured in December 2022, explained by the increase in Net Income for the 12 rolling months, together
with the decrease in Average Assets (0.4%).
MACROECONOMIC INFORMATION
| INFLATION | |
|
| | |
Accumulated
FY23 | |
| Argentina* | |
| 211.20 | % |
| Brazil | |
| 4.62 | % |
| Chile | |
| 3.90 | % |
| Paraguay | |
| 3.67 | % |
*Official inflation reported
by the National Institute of Statistics and Censuses of Argentina (INDEC). It should be mentioned that the inflation used to restate
Argentina's figures in accordance with IAS 29 corresponds to inflation estimated by the Central Bank of the Argentine Republic (in its
Survey of Market Expectations report), which is also adjusted for the difference between the estimate (by the Central Bank) and the actual
inflation of the previous month (INDEC).
| | |
Local
currency/USD | | |
CLP/local
currency | |
| EXCHANGE | |
(Average
exchange rate*) | | |
(Average
exchange rate*) | |
| RATES USED | |
4Q22 | | |
4Q23 | | |
4Q22 | | |
4Q23 | |
| Argentina | |
| 177.2 | | |
| 808.5 | | |
| 4.8 | | |
| 1.1 | |
| Brazil | |
| 5.26 | | |
| 4.95 | | |
| 174.00 | | |
| 180.80 | |
| Chile | |
| 915 | | |
| 896 | | |
| N.A | | |
| N.A | |
| Paraguay | |
| 7,206 | | |
| 7,391 | | |
| 0.13 | | |
| 0.12 | |
*Except
Argentina, where the closing exchange rate is used, in accordance with IAS 29.
| | |
Local
currency/USD | | |
CLP/local
currency | |
| EXCHANGE | |
(Average
exchange rate*) | | |
(Average
exchange rate*) | |
| RATES
USED | |
FY22 | | |
FY23 | | |
FY22 | | |
FY23 | |
| Argentina | |
| 177.2 | | |
| 808.5 | | |
| 4.8 | | |
| 1.1 | |
| Brazil | |
| 5.16 | | |
| 4.99 | | |
| 169.08 | | |
| 168.15 | |
| Chile | |
| 873 | | |
| 840 | | |
| N.A | | |
| N.A | |
| Paraguay | |
| 6,988 | | |
| 7,294 | | |
| 0.12 | | |
| 0.12 | |
*Except
Argentina, where the closing exchange rate is used, in accordance with IAS 29.
MARKET RISK ANALYSIS
The Company’s risk management is the responsibility
of the office of the Chief Executive Officer, (through the areas of Corporate Management Control, Sustainability and Risks, which depends
on the office of the Chief Financial Officer), as well as each of the management areas of Coca-Cola Andina. The main risks that the Company
has identified and that could possibly affect the business are as follows:
Relationship with The Coca-Cola Company
A large part of the Company’s sales derives
from the sale of products whose trademarks are owned by The Coca-Cola Company, which has the ability to exert an important influence
on the business through its rights under the Licensing or Bottling Agreements. In addition, we depend on The Coca-Cola Company to renew
these Bottling Agreements.
| COCA-COLA ANDINA | |
| 4Q23 EARNINGS RELEASE | |
| www.koandina.com | -14- |
Non-alcoholic beverage business environment
Consumers, public health officials, and government
officials in our markets are increasingly concerned about the public health consequences associated with obesity, which can affect demand
for our products, especially those containing sugar.
The Company has developed a large portfolio of
sugar-free products and has also made reformulations to some of its sugary products, significantly reducing the sugar contents of its
products.
Raw material prices and exchange rate
Many raw materials are used in the production
of beverages and packaging, including sugar and PET resin, the prices of which may present great volatility. In the case of sugar, the
Company sets the price of a part of the volume that it consumes with some anticipation, in order to avoid having large fluctuations of
cost that cannot be anticipated.
In addition, these raw materials are traded in
dollars; the Company has a policy of hedging in the futures market a portion of the dollars it uses to buy raw materials.
Instability in the supply of utilities and
raw materials
In the countries in which we operate, our operations
depend on a stable supply of utilities, fuel and raw materials. Power outages or water shut offs as well as the lack of raw materials
may result in interruptions of our production. The Company has mitigation plans to reduce the effects of eventual interruptions in the
supply of utilities and raw materials.
Economic conditions of the countries where
we operate
The Company maintains operations in Argentina,
Brazil, Chile and Paraguay. The demand for our products largely depends on the economic situation of these countries. Moreover, economic
instability can cause depreciation of the currencies of these countries, as well as inflation, which may eventually affect the Company’s
financial situation.
New tax laws or modifications to tax incentives
We cannot ensure that any government authority
in any of the countries in which we operate will not impose new taxes or increase existing taxes on our raw materials, products or containers.
Likewise, we cannot assure that these authorities are going to uphold and/or renew tax incentives that currently benefit some of our
operations.
A devaluation of the currencies of the countries
where we have our operations, regarding the Chilean peso, can negatively affect the results reported by the Company in Chilean pesos
The Company reports its results in Chilean pesos,
while a large part of its revenues and Adjusted EBITDA comes from countries that use other currencies. Should currencies devaluate regarding
the Chilean peso, this would have a negative effect on the results of the Company, upon the translation of results into Chilean pesos.
The imposition of exchange controls could
restrict the entry and exit of funds to and from the countries in which we operate, which could significantly limit our financial capacity
The imposition of exchange controls in the countries
in which we operate could affect our ability to repatriate profits, which could significantly limit our ability to pay dividends to our
shareholders. Additionally, it may limit the ability of our foreign subsidiaries to finance payments of U.S. dollar denominated liabilities
required by foreign creditors.
Price control policies in Argentina may have
a material and adverse effect on the results of our Argentine operations
The Argentine government has from time to time
established price controls on consumer products. To the extent that the price of our products in Argentina are restricted by government
imposed price controls the results of our Argentine operations may be materially affected. We cannot assure that authorities will not
impose price controls on our products in Argentina.
Civil unrest in Chile could have a material
adverse effect on general economic conditions in Chile and our business and financial condition
Since October 18, 2019, there have been
protests and demonstrations in Chile, seeking to reduce inequality, including claims about better pensions, improvement in health plans
and reduced health care costs, reduction in the cost of public transportation, better wages, among others. Sometimes demonstrations have
been violent, causing damage to public and private property.
We cannot predict the extent to which the Chilean
economy will be affected by the civil unrest, nor can we predict if government policies enacted as a response to the civil unrest will
have a negative impact on the Chilean economy and our business. Neither can we assure that demonstrations and vandalism will not cause
damage to our logistics and production infrastructure. So far, the Company has not been affected in any material respect.
Our business is subject to risks arising from the COVID-19 pandemic
The COVID-19 pandemic has resulted in the countries
where we operate taking extraordinary measures to contain the spread of COVID-19, including travel restrictions, closing borders, restrictions
or bans on social gathering events, instructions to citizens to practice social distancing, non-essential business closure, quarantine
implementation, and other similar actions. The impact of this pandemic has substantially increased uncertainty regarding the development
of economies and is most likely to cause a global recession. We cannot predict how long this pandemic will last, or how long the restrictions
imposed by the countries where we operate will last.
| COCA-COLA ANDINA | |
| 4Q23 EARNINGS RELEASE | |
| www.koandina.com | -15- |
Since the impact of COVID-19 is very uncertain,
we cannot accurately predict the extent of impact this pandemic will have on our business and our operations. There is a risk that our
collaborators, contractors and suppliers may be restricted or prevented from carrying out their activities for an indefinite period of
time, due to shutdowns mandated by the authorities. Although our operations have not been materially disrupted to date, eventually the
pandemic and the measures taken by governments to contain the virus could affect the continuity of our operations. In addition, some
measures taken by governments have negatively affected some of our sales channels, especially the closing of restaurants and bars, as
well as the prohibition of social gathering events, which affects our sales volumes to these channels. We cannot predict the effect that
the pandemic and these measures will have on our sales to these channels, nor whether these channels will recover once the pandemic is
over. Nor can we predict how long our consumers will change their consumer spending pattern as a result of the pandemic.
Additionally,
a possible outbreak of other epidemics in the future, such as SARS, Zika or the Ebola virus, could also result in a similar impact
on our business than COVID-19.
A more detailed analysis of business risks is
available in the Company’s 20-F and Annual Report, available on our website.
RECENT EVENTS
Dow Jones Chile Index and Dow Jones Sustainability
Index MILA Pacific Alliance
We were included in the Dow Jones Chile Index
for the eighth year in a row in December, as well as the Dow Jones Sustainability Index MILA Pacific Alliance for the seventh time. Because
of our dedication and perseverance in addressing these issues, we have become the best-ranked Chilean company in our industry, as well
as one of the top four companies in the world, also in our industry.
Interim Dividend 229
On January 25, 2024, the Company paid Interim
Dividend 229: CLP 32.0 per Series A share; and CLP 35.2 per Series B share.
GLOSSARY
Adjusted
EBITDA: includes Revenue, Costs of Sales, Distribution Costs and Administrative Expenses, included in the Financial Statements
submitted to Chile’s Financial Market Commission and determined in accordance with IFRS, plus Depreciation.
Currency-neutral
of a quarter q for a Q year is calculated using the same ratio of local currencies to the Chilean peso as the q
quarter of the Q-1 year. In the case of Argentina, given that it is a hyperinflationary economy, the result of the
q quarter is also deflated by inflation of the last 12 months.
Financial
Expenses: correspond to interest generated by the Company’s financial debt.
Financial
Income: corresponds to the interest generated by the Company's cash.
Net
Financial Debt: considers the consolidated financial liability that accrues interest, i.e.: (i) other current financial
liabilities, plus (ii) other non-current financial liabilities, less (iii) the sum of cash and cash equivalent; plus other
current financial assets; plus other non-current financial assets (to the extent that they correspond to the balances of assets for derivative
financial instruments, taken to cover exchange rate risk and/or interest rate of financial liabilities).
Operating
Income: includes Revenue, Costs of Sales, Distribution Costs and Administrative Expenses, included in the Financial
Statements submitted to Chile Financial Market Commission and determined in accordance with IFRS.
Total
Equity: corresponds to the equity attributable to the owners of the controller plus non-controlling interests.
Transactions:
refers to the number of units sold, regardless of size.
Volume:
expressed in Unit Cases (UCs), which is the conventional measurement used to measure sales volume in the Coca-Cola System
worldwide.
| COCA-COLA ANDINA | |
| 4Q23 EARNINGS RELEASE | |
| www.koandina.com | -16- |
ADDITIONAL INFORMATION
| STOCK
EXCHANGES ON WHICH WE TRADE |
|

ANDINA-A
ANDINA-B
|

AKO/A
AKO/B
|
|
|
| |
|
|
|
| ESG
INDICES IN WHICH WE PARTICIPATE |

Dow
Jones Sustainability Index Chile
Dow Jones Sustainability MILA Pacific Alliance Index. |

|

|

|
| |
|
|
|
| NUMBER
OF SHARES |
|
|
|
| TOTAL:
946,570,604 |
SERIES
A: 473,289,301 |
SERIES
B: 473,281,303 |
SHARES
PER ADR: 6 |
| |
|
|
|
ABOUT COCA-COLA ANDINA
Coca-Cola Andina is among the three largest Coca-Cola
bottlers in Latin America, servicing franchised territories with almost 57.4 million people, delivering 882.6 million unit cases or 5,011
million liters of soft drinks, juices, bottled water, beer and other alcoholic beverages during 2023. Coca-Cola Andina has the franchise
to produce and commercialize Coca-Cola products in certain territories in Argentina (through Embotelladora del Atlántico), in
Brazil (through Rio de Janeiro Refrescos), in Chile, (through Embotelladora Andina) and in all of Paraguay (through Paraguay Refrescos).
The Chadwick Claro, Garcés Silva, Said Handal and Said Somavía families control Coca-Cola Andina in equal parts. The Company's
value generation proposal is to become a Total Beverage Company, using existing resources efficiently and sustainably, developing a relationship
of excellence with consumers of its products, as well as with its collaborators, customers, suppliers, the community in which it operates
and with its strategic partner The Coca-Cola Company, in order to increase ROIC for shareholders in the long term. For more company information
visit www.koandina.com.b
This document may contain
projections reflecting Coca-Cola Andina’s good faith expectations and are based on currently available information. However, the
results that are finally obtained are subject to diverse variables, many of which are beyond the Company's control, and which could materially
impact the current performance. Among the factors that could change the performance are the political and economic conditions on mass
consumption, pricing pressures resulting from competitive discounts of other bottlers, weather conditions in the Southern Cone and other
risk factors that would be applicable from time to time, and which are periodically informed in reports filed before the appropriate
regulatory authorities, and which are available on our website.
| COCA-COLA ANDINA | |
| 4Q23 EARNINGS RELEASE | |
| www.koandina.com | -17- |
Embotelladora
Andina S.A.
Fourth
Quarter Results for the period ended December 31, 2023. Reported figures, IFRS GAAP.
(In
nominal million Chilean pesos, except per share)
| | |
October-December 2023 | | |
October-December 2022 | | |
| |
| | |
Chilean
Operations | | |
Brazilian
Operations | | |
Argentine
Operations | | |
Paraguay
Operations | | |
Total
(1) | | |
Chilean
Operations | | |
Brazilian
Operations | | |
Argentine
Operations | | |
Paraguay
Operations | | |
Total
(1) | | |
%
Ch. | |
| Volume total
beverages (Million UC) | |
| 83.2 | | |
| 88.8 | | |
| 53.5 | | |
| 22.8 | | |
| 248.4 | | |
| 90.7 | | |
| 80.2 | | |
| 58.4 | | |
| 21.7 | | |
| 250.9 | | |
| -1.0 | % |
| Transactions (Million) | |
| 494.5 | | |
| 475.0 | | |
| 252.4 | | |
| 139.3 | | |
| 1,361.3 | | |
| 549.2 | | |
| 438.0 | | |
| 276.7 | | |
| 130.6 | | |
| 1,394.5 | | |
| -2.4 | % |
| | |
| | | |
| | | |
| | | |
| | | |
| | | |
| | | |
| | | |
| | | |
| | | |
| | | |
| | |
| Net sales | |
| 332,474 | | |
| 243,604 | | |
| 129,595 | | |
| 69,230 | | |
| 773,552 | | |
| 332,666 | | |
| 192,836 | | |
| 202,411 | | |
| 63,418 | | |
| 789,934 | | |
| -2.1 | % |
| Cost of sales | |
| (210,545 | ) | |
| (149,292 | ) | |
| (63,100 | ) | |
| (38,881 | ) | |
| (460,384 | ) | |
| (218,574 | ) | |
| (120,508 | ) | |
| (107,543 | ) | |
| (36,319 | ) | |
| (481,548 | ) | |
| -4.4 | % |
| Gross profit | |
| 121,929 | | |
| 94,312 | | |
| 66,495 | | |
| 30,350 | | |
| 313,169 | | |
| 114,092 | | |
| 72,328 | | |
| 94,868 | | |
| 27,099 | | |
| 308,386 | | |
| 1.6 | % |
| Gross margin | |
| 36.7 | % | |
| 38.7 | % | |
| 51.3 | % | |
| 43.8 | % | |
| 40.5 | % | |
| 34.3 | % | |
| 37.5 | % | |
| 46.9 | % | |
| 42.7 | % | |
| 39.0 | % | |
| | |
| Distribution and administrative
expenses | |
| (67,746 | ) | |
| (52,607 | ) | |
| (47,812 | ) | |
| (11,481 | ) | |
| (179,646 | ) | |
| (62,760 | ) | |
| (41,865 | ) | |
| (75,001 | ) | |
| (11,635 | ) | |
| (191,260 | ) | |
| -6.1 | % |
| | |
| | | |
| | | |
| | | |
| | | |
| | | |
| | | |
| | | |
| | | |
| | | |
| | | |
| | |
| Corporate expenses (2) | |
| | | |
| | | |
| | | |
| | | |
| (3,385 | ) | |
| | | |
| | | |
| | | |
| | | |
| (2,084 | ) | |
| 62.5 | % |
| Operating
income (3) | |
| 54,183 | | |
| 41,705 | | |
| 18,683 | | |
| 18,869 | | |
| 130,138 | | |
| 51,332 | | |
| 30,463 | | |
| 19,867 | | |
| 15,463 | | |
| 115,042 | | |
| 13.1 | % |
| Operating margin | |
| 16.3 | % | |
| 17.1 | % | |
| 14.4 | % | |
| 27.3 | % | |
| 16.8 | % | |
| 15.4 | % | |
| 15.8 | % | |
| 9.8 | % | |
| 24.4 | % | |
| 14.6 | % | |
| | |
| Adjusted EBITDA
(4) | |
| 66,340 | | |
| 49,284 | | |
| 24,169 | | |
| 22,662 | | |
| 159,070 | | |
| 62,858 | | |
| 39,558 | | |
| 28,789 | | |
| 19,136 | | |
| 148,257 | | |
| 7.3 | % |
| Adjusted EBITDA margin | |
| 20.0 | % | |
| 20.2 | % | |
| 18.6 | % | |
| 32.7 | % | |
| 20.6 | % | |
| 18.9 | % | |
| 20.5 | % | |
| 14.2 | % | |
| 30.2 | % | |
| 18.8 | % | |
| | |
| | |
| | | |
| | | |
| | | |
| | | |
| | | |
| | | |
| | | |
| | | |
| | | |
| | | |
| | |
| Financial (expenses) income (net) | |
| | | |
| | | |
| | | |
| | | |
| (8,247 | ) | |
| | | |
| | | |
| | | |
| | | |
| (6,470 | ) | |
| 27.5 | % |
| Share of (loss) profit of investments
accounted for using the equity method | |
| | | |
| | | |
| | | |
| | | |
| 2,721 | | |
| | | |
| | | |
| | | |
| | | |
| 1,124 | | |
| 142.1 | % |
| Other income (expenses) (5) | |
| | | |
| | | |
| | | |
| | | |
| (1,282 | ) | |
| | | |
| | | |
| | | |
| | | |
| (5,248 | ) | |
| -75.6 | % |
| Results by readjustement unit
and exchange rate difference | |
| | | |
| | | |
| | | |
| | | |
| (10,665 | ) | |
| | | |
| | | |
| | | |
| | | |
| (15,849 | ) | |
| -32.7 | % |
| | |
| | | |
| | | |
| | | |
| | | |
| | | |
| | | |
| | | |
| | | |
| | | |
| | | |
| | |
| Net income before income
taxes | |
| | | |
| | | |
| | | |
| | | |
| 112,665 | | |
| | | |
| | | |
| | | |
| | | |
| 88,599 | | |
| 27.2 | % |
| | |
| | | |
| | | |
| | | |
| | | |
| | | |
| | | |
| | | |
| | | |
| | | |
| | | |
| | |
| Income tax expense | |
| | | |
| | | |
| | | |
| | | |
| (30,255 | ) | |
| | | |
| | | |
| | | |
| | | |
| (41,806 | ) | |
| -27.6 | % |
| | |
| | | |
| | | |
| | | |
| | | |
| | | |
| | | |
| | | |
| | | |
| | | |
| | | |
| | |
| Net income | |
| | | |
| | | |
| | | |
| | | |
| 82,410 | | |
| | | |
| | | |
| | | |
| | | |
| 46,793 | | |
| 76.1 | % |
| | |
| | | |
| | | |
| | | |
| | | |
| | | |
| | | |
| | | |
| | | |
| | | |
| | | |
| | |
| Net income
attributable to non-controlling interests | |
| | | |
| | | |
| | | |
| | | |
| (1,670 | ) | |
| | | |
| | | |
| | | |
| | | |
| (1,599 | ) | |
| 4.5 | % |
| Net income attributable to
equity holders of the parent | |
| | | |
| | | |
| | | |
| | | |
| 80,740 | | |
| | | |
| | | |
| | | |
| | | |
| 45,194 | | |
| 78.7 | % |
| Net margin | |
| | | |
| | | |
| | | |
| | | |
| 10.4 | % | |
| | | |
| | | |
| | | |
| | | |
| 5.7 | % | |
| | |
| | |
| | | |
| | | |
| | | |
| | | |
| | | |
| | | |
| | | |
| | | |
| | | |
| | | |
| | |
| WEIGHTED AVERAGE SHARES OUTSTANDING | |
| | | |
| | | |
| | | |
| | | |
| 946.6 | | |
| | | |
| | | |
| | | |
| | | |
| 946.6 | | |
| | |
| EARNINGS PER SHARE | |
| | | |
| | | |
| | | |
| | | |
| 85.3 | | |
| | | |
| | | |
| | | |
| | | |
| 47.7 | | |
| | |
| EARNINGS PER ADS | |
| | | |
| | | |
| | | |
| | | |
| 511.8 | | |
| | | |
| | | |
| | | |
| | | |
| 286.5 | | |
| 78.7 | % |
(1) Total
may be different from the addition of the four countries because of intercountry eliminations.
(2) Corporate
expenses partially reclassified to the operations.
(3) Operating
Income considers Net Sales, Cost of Sales, Distribution Costs, and Administrative Expenses included in the Financial Statements filed
with the Chilean Financial Market Comission and determined in accordance to IFRS.
(4) Adjusted
EBITDA considers Net Sales, Cost of Sales, Distribution Costs, and Administrative Expenses included in the Financial Statements filed
with the Chilean Financial Market Comission and determined in accordance to IFRS, plus Depreciation.
(5) Other
income (expenses) includes the following lines of the income statement by function included in the published financial statements in
the Financial Market Comission: "Other income", "Other expenses" and "Other (loss) gains".
Embotelladora
Andina S.A.
Twelve
Months Results for the period ended December 31, 2023. Reported figures, IFRS GAAP.
(In
nominal million Chilean pesos, except per share)
| | |
January-December 2023 | | |
January-December 2022 | | |
| |
| | |
Chilean Operations | | |
Brazilian Operations | | |
Argentine Operations | | |
Paraguay Operations | | |
Total (1) | | |
Chilean Operations | | |
Brazilian Operations | | |
Argentine Operations | | |
Paraguay Operations | | |
Total (1) | | |
% Ch. | |
| Volume total beverages (Million UC) | |
| 309.9 | | |
| 300.9 | | |
| 194.2 | | |
| 77.6 | | |
| 882.6 | | |
| 319.8 | | |
| 278.0 | | |
| 201.4 | | |
| 74.4 | | |
| 873.6 | | |
| 1.0 | % |
| Transactions (Million) | |
| 1,813.2 | | |
| 1,642.4 | | |
| 926.3 | | |
| 477.8 | | |
| 4,859.6 | | |
| 1,904.0 | | |
| 1,527.1 | | |
| 947.3 | | |
| 449.0 | | |
| 4,827.3 | | |
| 0.7 | % |
| | |
| | | |
| | | |
| | | |
| | | |
| | | |
| | | |
| | | |
| | | |
| | | |
| | | |
| | |
| Net sales | |
| 1,191,974 | | |
| 745,383 | | |
| 460,338 | | |
| 223,841 | | |
| 2,618,437 | | |
| 1,123,665 | | |
| 636,860 | | |
| 688,705 | | |
| 212,339 | | |
| 2,656,878 | | |
| -1.4 | % |
| Cost of sales | |
| (785,164 | ) | |
| (460,649 | ) | |
| (234,814 | ) | |
| (124,799 | ) | |
| (1,601,997 | ) | |
| (743,227 | ) | |
| (403,696 | ) | |
| (367,880 | ) | |
| (118,591 | ) | |
| (1,628,702 | ) | |
| -1.6 | % |
| Gross profit | |
| 406,810 | | |
| 284,734 | | |
| 225,524 | | |
| 99,042 | | |
| 1,016,440 | | |
| 380,439 | | |
| 233,164 | | |
| 320,825 | | |
| 93,748 | | |
| 1,028,177 | | |
| -1.1 | % |
| Gross margin | |
| 34.1 | % | |
| 38.2 | % | |
| 49.0 | % | |
| 44.2 | % | |
| 38.8 | % | |
| 33.9 | % | |
| 36.6 | % | |
| 46.6 | % | |
| 44.2 | % | |
| 38.7 | % | |
| | |
| Distribution and administrative expenses | |
| (267,291 | ) | |
| (176,029 | ) | |
| (162,564 | ) | |
| (44,320 | ) | |
| (650,203 | ) | |
| (245,598 | ) | |
| (151,958 | ) | |
| (234,326 | ) | |
| (44,040 | ) | |
| (675,922 | ) | |
| -3.8 | % |
| | |
| | | |
| | | |
| | | |
| | | |
| | | |
| | | |
| | | |
| | | |
| | | |
| | | |
| | |
| Corporate expenses (2) | |
| | | |
| | | |
| | | |
| | | |
| (8,900 | ) | |
| | | |
| | | |
| | | |
| | | |
| (7,110 | ) | |
| 25.2 | % |
| Operating income (3) | |
| 139,519 | | |
| 108,705 | | |
| 62,960 | | |
| 54,722 | | |
| 357,337 | | |
| 134,840 | | |
| 81,206 | | |
| 86,499 | | |
| 49,709 | | |
| 345,144 | | |
| 3.5 | % |
| Operating margin | |
| 11.7 | % | |
| 14.6 | % | |
| 13.7 | % | |
| 24.4 | % | |
| 13.6 | % | |
| 12.0 | % | |
| 12.8 | % | |
| 12.6 | % | |
| 23.4 | % | |
| 13.0 | % | |
| | |
| Adjusted EBITDA (4) | |
| 184,450 | | |
| 140,090 | | |
| 86,016 | | |
| 68,452 | | |
| 470,108 | | |
| 175,554 | | |
| 113,094 | | |
| 119,942 | | |
| 63,029 | | |
| 464,510 | | |
| 1.2 | % |
| Adjusted EBITDA margin | |
| 15.5 | % | |
| 18.8 | % | |
| 18.7 | % | |
| 30.6 | % | |
| 18.0 | % | |
| 15.6 | % | |
| 17.8 | % | |
| 17.4 | % | |
| 29.7 | % | |
| 17.5 | % | |
| | |
| | |
| | | |
| | | |
| | | |
| | | |
| | | |
| | | |
| | | |
| | | |
| | | |
| | | |
| | |
| Financial (expenses) income (net) | |
| | | |
| | | |
| | | |
| | | |
| (33,892 | ) | |
| | | |
| | | |
| | | |
| | | |
| (19,826 | ) | |
| 71.0 | % |
| Share of (loss) profit of investments accounted for using the equity method | |
| | | |
| | | |
| | | |
| | | |
| 2,716 | | |
| | | |
| | | |
| | | |
| | | |
| 1,409 | | |
| 92.8 | % |
| Other income (expenses) (5) | |
| | | |
| | | |
| | | |
| | | |
| (41,040 | ) | |
| | | |
| | | |
| | | |
| | | |
| (23,373 | ) | |
| 75.6 | % |
| Results by readjustement unit and exchange rate difference | |
| | | |
| | | |
| | | |
| | | |
| (24,615 | ) | |
| | | |
| | | |
| | | |
| | | |
| (70,551 | ) | |
| -65.1 | % |
| | |
| | | |
| | | |
| | | |
| | | |
| | | |
| | | |
| | | |
| | | |
| | | |
| | | |
| | |
| Net income before income taxes | |
| | | |
| | | |
| | | |
| | | |
| 260,506 | | |
| | | |
| | | |
| | | |
| | | |
| 232,804 | | |
| 11.9 | % |
| | |
| | | |
| | | |
| | | |
| | | |
| | | |
| | | |
| | | |
| | | |
| | | |
| | | |
| | |
| Income tax expense | |
| | | |
| | | |
| | | |
| | | |
| (85,994 | ) | |
| | | |
| | | |
| | | |
| | | |
| (104,345 | ) | |
| -17.6 | % |
| | |
| | | |
| | | |
| | | |
| | | |
| | | |
| | | |
| | | |
| | | |
| | | |
| | | |
| | |
| Net income | |
| | | |
| | | |
| | | |
| | | |
| 174,511 | | |
| | | |
| | | |
| | | |
| | | |
| 128,459 | | |
| 35.8 | % |
| | |
| | | |
| | | |
| | | |
| | | |
| | | |
| | | |
| | | |
| | | |
| | | |
| | | |
| | |
| Net income attributable to non-controlling interests | |
| | | |
| | | |
| | | |
| | | |
| (3,070 | ) | |
| | | |
| | | |
| | | |
| | | |
| (2,961 | ) | |
| 3.7 | % |
| Net income attributable to equity holders of the parent | |
| | | |
| | | |
| | | |
| | | |
| 171,441 | | |
| | | |
| | | |
| | | |
| | | |
| 125,498 | | |
| 36.6 | % |
| Net margin | |
| | | |
| | | |
| | | |
| | | |
| 6.5 | % | |
| | | |
| | | |
| | | |
| | | |
| 4.7 | % | |
| | |
| | |
| | | |
| | | |
| | | |
| | | |
| | | |
| | | |
| | | |
| | | |
| | | |
| | | |
| | |
| WEIGHTED AVERAGE SHARES OUTSTANDING | |
| | | |
| | | |
| | | |
| | | |
| 946.6 | | |
| | | |
| | | |
| | | |
| | | |
| 946.6 | | |
| | |
| EARNINGS PER SHARE | |
| | | |
| | | |
| | | |
| | | |
| 181.1 | | |
| | | |
| | | |
| | | |
| | | |
| 132.6 | | |
| | |
| EARNINGS PER ADS | |
| | | |
| | | |
| | | |
| | | |
| 1,086.7 | | |
| | | |
| | | |
| | | |
| | | |
| 795.5 | | |
| 36.6 | % |
(1) Total
may be different from the addition of the four countries because of intercountry eliminations.
(2) Corporate
expenses partially reclassified to the operations.
(3) Operating
Income considers Net Sales, Cost of Sales, Distribution Costs, and Administrative Expenses included in the Financial Statements filed
with the Chilean Financial Market Comission and determined in accordance to IFRS.
(4) Adjusted
EBITDA considers Net Sales, Cost of Sales, Distribution Costs, and Administrative Expenses included in the Financial Statements filed
with the Chilean Financial Market Comission and determined in accordance to IFRS, plus Depreciation.
(5) Other
income (expenses) includes the following lines of the income statement by function included in the published financial statements in
the Financial Market Comission: "Other income", "Other expenses" and "Other (loss) gains".
Embotelladora
Andina S.A.
Fourth
Quarter Results for the period ended December 31, 2023.
(In
local nominal currency of each period, except Argentina (3))
| | |
October-December 2023 | | |
October-December 2022 | |
| | |
Chile
Million Ch$ | | |
Brazil
Million R$ | | |
Argentina
(3)
Million AR$ | | |
Paraguay
Million G$ | | |
Chile
Million Ch$ | | |
Brazil
Million R$ | | |
Argentina
(3)
Million AR$ | | |
Paraguay
Million G$ | |
| | |
Nominal | | |
Nominal | | |
IAS29 | | |
Nominal | | |
Nominal | | |
Nominal | | |
IAS
29 | | |
Nominal | |
| Total beverages
volume (Million UC) | |
| 83.2 | | |
| 88.8 | | |
| 53.5 | | |
| 22.8 | | |
| 90.7 | | |
| 80.2 | | |
| 58.4 | | |
| 21.7 | |
| Transactions (Million) | |
| 494.5 | | |
| 475.0 | | |
| 252.4 | | |
| 139.3 | | |
| 549.2 | | |
| 438.0 | | |
| 276.7 | | |
| 130.6 | |
| | |
| | | |
| | | |
| | | |
| | | |
| | | |
| | | |
| | | |
| | |
| Net sales | |
| 332,474 | | |
| 1,348.7 | | |
| 119,448.7 | | |
| 572,666 | | |
| 332,666 | | |
| 1,111.9 | | |
| 129,847.6 | | |
| 503,558 | |
| Cost of sales | |
| (210,545 | ) | |
| (826.5 | ) | |
| (58,159.8 | ) | |
| (321,528 | ) | |
| (218,574 | ) | |
| (693.8 | ) | |
| (68,989.6 | ) | |
| (288,099 | ) |
| Gross profit | |
| 121,929 | | |
| 522.2 | | |
| 61,288.9 | | |
| 251,138 | | |
| 114,092 | | |
| 418.1 | | |
| 60,858.0 | | |
| 215,459 | |
| Gross margin | |
| 36.7 | % | |
| 38.7 | % | |
| 51.3 | % | |
| 43.9 | % | |
| 34.3 | % | |
| 37.6 | % | |
| 46.9 | % | |
| 42.8 | % |
| Distribution and administrative
expenses | |
| (67,746 | ) | |
| (291.1 | ) | |
| (44,068.4 | ) | |
| (94,578 | ) | |
| (62,760 | ) | |
| (241.3 | ) | |
| (48,113.2 | ) | |
| (91,789 | ) |
| |
| | | |
| | | |
| | | |
| | | |
| | | |
| | | |
| | | |
| | |
| Operating
income (1) | |
| 54,183 | | |
| 231.1 | | |
| 17,220.5 | | |
| 156,560 | | |
| 51,332 | | |
| 176.8 | | |
| 12,744.7 | | |
| 123,670 | |
| Operating margin | |
| 16.3 | % | |
| 17.1 | % | |
| 14.4 | % | |
| 27.3 | % | |
| 15.4 | % | |
| 15.9 | % | |
| 9.8 | % | |
| 24.6 | % |
| Adjusted EBITDA (2) | |
| 66,340 | | |
| 273.0 | | |
| 22,276.6 | | |
| 187,934 | | |
| 62,858 | | |
| 228.5 | | |
| 18,468.0 | | |
| 152,655 | |
| Adjusted
EBITDA margin | |
| 20.0 | % | |
| 20.2 | % | |
| 18.6 | % | |
| 32.8 | % | |
| 18.9 | % | |
| 20.5 | % | |
| 14.2 | % | |
| 30.3 | % |
(1) Operating
Income considers Net Sales, Cost of Sales, Distribution Costs, and Administrative Expenses included in the Financial Statements filed
with the Chilean Financial Market Comission and determined in accordance to IFRS.
(2) Adjusted
EBITDA considers Net Sales, Cost of Sales, Distribution Costs, and Administrative Expenses included in the Financial Statements filed
with the Chilean Financial Market Comission and determined in accordance to IFRS, plus Depreciation.
(3) Argentina
2023 figures are presented in accordance to IAS 29, in December 2023 currency. 2022 figures are also presented in accordance to
IAS 29, in December 2023 currency.
Embotelladora
Andina S.A.
Twelve
Months Results for the period ended December 31, 2023.
(In
local nominal currency of each period, except Argentina (3))
| | |
January-December 2023 | | |
January-December 2022 | |
| | |
Chile Million Ch$ | | |
Brazil Million R$ | | |
Argentina (3)
Million AR$ | | |
Paraguay Million G$ | | |
Chile Million Ch$ | | |
Brazil Million R$ | | |
Argentina (3)
Million AR$ | | |
Paraguay Million G$ | |
| | |
Nominal | | |
Nominal | | |
IAS29 | | |
Nominal | | |
Nominal | | |
Nominal | | |
IAS 29 | | |
Nominal | |
| Total beverages volume (Million UC) | |
| 309.9 | | |
| 300.9 | | |
| 194.2 | | |
| 77.6 | | |
| 319.8 | | |
| 278.0 | | |
| 201.4 | | |
| 74.4 | |
| Transactions (Million) | |
| 1,813.2 | | |
| 1,642.4 | | |
| 926.3 | | |
| 477.8 | | |
| 1,904.0 | | |
| 1,527.1 | | |
| 947.3 | | |
| 449.0 | |
| | |
| | | |
| | | |
| | | |
| | | |
| | | |
| | | |
| | | |
| | |
| Net sales | |
| 1,191,974 | | |
| 4,403.6 | | |
| 424,298.0 | | |
| 1,937,751 | | |
| 1,123,665 | | |
| 3,752.9 | | |
| 441,807.2 | | |
| 1,706,394 | |
| Cost of sales | |
| (785,164 | ) | |
| (2,723.1 | ) | |
| (216,430.4 | ) | |
| (1,080,045 | ) | |
| (743,227 | ) | |
| (2,377.7 | ) | |
| (235,996.5 | ) | |
| (951,286 | ) |
| Gross profit | |
| 406,810 | | |
| 1,680.5 | | |
| 207,867.5 | | |
| 857,707 | | |
| 380,439 | | |
| 1,375.2 | | |
| 205,810.8 | | |
| 755,109 | |
| Gross margin | |
| 34.1 | % | |
| 38.2 | % | |
| 49.0 | % | |
| 44.3 | % | |
| 33.9 | % | |
| 36.6 | % | |
| 46.6 | % | |
| 44.3 | % |
| Distribution and administrative expenses | |
| (267,291 | ) | |
| (1,042.4 | ) | |
| (149,836.5 | ) | |
| (384,519 | ) | |
| (245,598 | ) | |
| (896.4 | ) | |
| (150,321.0 | ) | |
| (352,364 | ) |
| |
| | | |
| | | |
| | | |
| | | |
| | | |
| | | |
| | | |
| | |
| Operating income (1) | |
| 139,519 | | |
| 638.1 | | |
| 58,031.1 | | |
| 473,188 | | |
| 134,840 | | |
| 478.8 | | |
| 55,489.8 | | |
| 402,745 | |
| Operating margin | |
| 11.7 | % | |
| 14.5 | % | |
| 13.7 | % | |
| 24.4 | % | |
| 12.0 | % | |
| 12.8 | % | |
| 12.6 | % | |
| 23.6 | % |
| Adjusted EBITDA (2) | |
| 184,450 | | |
| 825.0 | | |
| 79,281.9 | | |
| 592,351 | | |
| 175,554 | | |
| 666.1 | | |
| 76,943.5 | | |
| 509,070 | |
| Adjusted EBITDA margin | |
| 15.5 | % | |
| 18.7 | % | |
| 18.7 | % | |
| 30.6 | % | |
| 15.6 | % | |
| 17.7 | % | |
| 17.4 | % | |
| 29.8 | % |
(1) Operating
Income considers Net Sales, Cost of Sales, Distribution Costs, and Administrative Expenses included in the Financial Statements filed
with the Chilean Financial Market Comission and determined in accordance to IFRS.
(2) Adjusted
EBITDA considers Net Sales, Cost of Sales, Distribution Costs, and Administrative Expenses included in the Financial Statements filed
with the Chilean Financial Market Comission and determined in accordance to IFRS, plus Depreciation.
(3) Argentina
2023 figures are presented in accordance to IAS 29, in December 2023 currency. 2022 figures are also presented in accordance to
IAS 29, in December 2023 currency.
Embotelladora Andina S.A.
Consolidated Balance Sheet
(In million Chilean pesos)
| | |
| | |
| | |
Variation % | |
| ASSETS | |
12-31-2023 | | |
12-31-2022 | | |
12-31-2022 | |
| Cash + Time deposits + market. Securit. | |
| 370,969 | | |
| 554,727 | | |
| -33.1 | % |
| Account receivables (net) | |
| 315,053 | | |
| 294,832 | | |
| 6.9 | % |
| Inventories | |
| 233,053 | | |
| 245,887 | | |
| -5.2 | % |
| Other current assets | |
| 62,695 | | |
| 66,283 | | |
| -5.4 | % |
| Total Current Assets | |
| 981,771 | | |
| 1,161,729 | | |
| -15.5 | % |
| | |
| | | |
| | | |
| | |
| Property, plant and equipment | |
| 1,952,105 | | |
| 1,888,340 | | |
| 3.4 | % |
| Depreciation | |
| (1,091,032 | ) | |
| (1,090,118 | ) | |
| 0.1 | % |
| Total Property, Plant, and Equipment | |
| 872,389 | | |
| 798,221 | | |
| 9.3 | % |
| | |
| | | |
| | | |
| | |
| Investment in related companies | |
| 91,799 | | |
| 92,345 | | |
| -0.6 | % |
| Goodwill | |
| 122,104 | | |
| 129,024 | | |
| -5.4 | % |
| Other long term assets | |
| 853,458 | | |
| 829,381 | | |
| 2.9 | % |
| Total Other Assets | |
| 1,067,361 | | |
| 1,050,750 | | |
| 1.6 | % |
| | |
| | | |
| | | |
| | |
| TOTAL ASSETS | |
| 2,921,521 | | |
| 3,010,701 | | |
| -3.0 | % |
| | |
| | |
| | |
Variation % | |
| LIABILITIES & SHAREHOLDERS' EQUITY | |
12-31-2023 | | |
12-31-2022 | | |
12-31-2022 | |
| Short term bank liabilities | |
| 1,501 | | |
| 689 | | |
| 117.9 | % |
| Current portion of bonds payable | |
| 27,479 | | |
| 340,768 | | |
| -91.9 | % |
| Other financial liabilities | |
| 24,017 | | |
| 25,845 | | |
| -7.1 | % |
| Trade accounts payable and notes payable | |
| 524,958 | | |
| 475,050 | | |
| 10.5 | % |
| Other liabilities | |
| 114,917 | | |
| 106,893 | | |
| 7.5 | % |
| Total Current Liabilities | |
| 692,871 | | |
| 949,245 | | |
| -27.0 | % |
| | |
| | | |
| | | |
| | |
| Long term bank liabilities | |
| 13,404 | | |
| 13,366 | | |
| 0.3 | % |
| Bonds payable | |
| 953,660 | | |
| 763,368 | | |
| 24.9 | % |
| Other financial liabilities | |
| 77,262 | | |
| 128,068 | | |
| -39.7 | % |
| Other long term liabilities | |
| 263,338 | | |
| 273,251 | | |
| -3.6 | % |
| Total Long Term Liabilities | |
| 1,307,664 | | |
| 1,178,053 | | |
| 11.0 | % |
| | |
| | | |
| | | |
| | |
| Minority interest | |
| 34,695 | | |
| 28,143 | | |
| 23.3 | % |
| | |
| | | |
| | | |
| | |
| Stockholders' Equity | |
| 886,291 | | |
| 855,260 | | |
| 3.6 | % |
| | |
| | | |
| | | |
| | |
| TOTAL LIABILITIES & SHAREHOLDERS' EQUITY | |
| 2,921,521 | | |
| 3,010,701 | | |
| -3.0 | % |
| Financial Highlights |
| (In million Chilean pesos) |
| | |
| | |
| |
| | |
Accumulated | |
| ADDITIONS TO FIXED ASSETS | |
12-31-2023 | | |
12-31-2022 | |
| | |
| | |
| |
| Chile | |
| 107,314 | | |
| 70,395 | |
| Brazil | |
| 54,082 | | |
| 44,611 | |
| Argentina | |
| 44,729 | | |
| 37,757 | |
| Paraguay | |
| 16,495 | | |
| 20,912 | |
| Total | |
| 222,620 | | |
| 173,675 | |
SIGNATURES
Pursuant to the requirements of the Securities Exchange Act of 1934,
the registrant has duly caused this report to be signed on its behalf by the undersigned, thereunto duly authorized, in the city of Santiago,
Chile.
| |
EMBOTELLADORA ANDINA S.A. |
| |
|
| |
By: |
/s/ Andrés Wainer |
| |
Name: |
Andrés Wainer |
| |
Title: |
Chief Financial Officer |
Santiago, January 30, 2024
Embotelladora Andina (NYSE:AKO.B)
Historical Stock Chart
From Mar 2024 to Apr 2024

Embotelladora Andina (NYSE:AKO.B)
Historical Stock Chart
From Apr 2023 to Apr 2024
