0000890447
false
0000890447
2023-11-07
2023-11-07
iso4217:USD
xbrli:shares
iso4217:USD
xbrli:shares
UNITED STATES
SECURITIES AND EXCHANGE COMMISSION
Washington, D.C. 20549
FORM 8-K
CURRENT REPORT
Pursuant to Section 13 or 15(d) of the Securities Exchange
Act of 1934
Date of Report (Date of Earliest Event
Reported): November 7, 2023
VERTEX ENERGY, INC.
(Exact name of registrant as specified in its charter)
| Nevada |
001-11476 |
94-3439569 |
(State or other jurisdiction of
incorporation) |
(Commission File Number) |
(IRS Employer
Identification No.) |
|
1331 Gemini Street
Suite 250
Houston, Texas |
77058 |
| (Address of principal executive offices) |
(Zip Code) |
Registrant’s telephone number, including area
code: (866) 660-8156
Check the appropriate box below if the Form 8-K filing
is intended to simultaneously satisfy the filing obligation of the registrant under any of the following provisions:
| ☐ |
Written communications pursuant to Rule 425 under the Securities Act (17 CFR 230.425) |
| |
|
| ☐ |
Soliciting material pursuant to Rule 14a-12 under the Exchange Act (17 CFR 240.14a-12) |
| |
|
| ☐ |
Pre-commencement communications pursuant to Rule 14d-2(b) under the Exchange Act (17 CFR 240.14d-2(b)) |
| |
|
| ☐ |
Pre-commencement communications pursuant to Rule 13e-4(c) under the Exchange Act (17 CFR 240.13e-4(c)) |
Securities registered pursuant to Section 12(b) of
the Act:
| Title of each class |
Trading Symbol(s) |
Name of each exchange on which registered |
|
Common Stock,
$0.001 Par Value Per Share |
VTNR |
The NASDAQ
Stock Market LLC
(Nasdaq Capital Market) |
Indicate by check mark whether the registrant is an
emerging growth company as defined in Rule 405 of the Securities Act of 1933 (§230.405 of this chapter) or Rule 12b-2 of the Securities
Exchange Act of 1934 (§240.12b-2 of this chapter).
Emerging growth company ☐
If an emerging growth company, indicate by check mark
if the registrant has elected not to use the extended transition period for complying with any new or revised financial accounting standards
provided pursuant to Section 13(a) of the Exchange Act. ☐
| Item 2.02 |
Results of Operations and Financial Condition. |
On
November 7, 2023, Vertex Energy, Inc. (“Vertex” or the “Company”) issued a press release and will
hold a conference call regarding its financial results for the three and nine months ended September 30, 2023. A copy of the
press release, which includes information on the conference call and a summary of such financial results is furnished as Exhibit
99.1 to this Form 8-K and incorporated herein by reference. Additionally, a copy of a presentation which will be discussed on
the earnings call is furnished as Exhibit 99.2 to this Form 8-K and is incorporated herein by reference, and has
also been posted to the Company’s website at https://www.vertexenergy.com/presentation, although the Company reserves the right
to discontinue that availability at any time.
The
information contained in this Current Report and Exhibits 99.1 and 99.2 hereto shall not be deemed “filed”
for purposes of Section 18 of the Securities Exchange Act of 1934, as amended (the “Exchange Act”) or otherwise subject
to the liabilities of that section, nor shall they be deemed incorporated by reference in any filing under the Securities Act of 1933,
as amended or the Exchange Act, except as expressly set forth by specific reference in such a filing.
The Company is making reference
to non-GAAP financial information in the press release, presentation, and the conference call. A reconciliation of these non-GAAP financial
measures to the comparable GAAP financial measures is contained in the attached press release and presentation.
| Item 9.01 |
Financial Statements and Exhibits. |
| Exhibit No. |
|
Description |
|
| |
|
|
|
| 99.1* |
|
Press Release of Vertex Energy, Inc., dated November 7, 2023 |
| 99.2* |
|
Third Quarter 2023 Earnings Call Presentation |
| 104 |
|
Inline XBRL for the cover page of this Current Report on Form 8-K |
* Furnished herewith.
The inclusion of any website
address in this Form 8-K, and any exhibit thereto, is intended to be an inactive textual reference only and not an active hyperlink. The
information contained in, or that can be accessed through, such website is not part of or incorporated into this Form 8-K.
Forward-Looking Statements
This Current Report on Form 8-K,
including the press release and presentation furnished as Exhibits 99.1 and 99.2,
respectively, to this Current Report on Form 8-K, contains forward-looking statements
within the meaning of the federal securities laws, including the Private Securities
Litigation Reform Act of 1995, and, as such, may involve known and unknown risks, uncertainties and assumptions. You can identify
these forward-looking statements by words such as “may,” “should,” “expect,”
“anticipate,” “believe,” “estimate,” “intend,” “plan”
and other similar expressions. These forward-looking statements relate to the Company’s
current expectations and are subject to the limitations and qualifications set forth in the press release and presentation as well as
in the Company’s other filings with the Securities and Exchange Commission, including, without limitation, that actual events and/or
results may differ materially from those projected in such forward-looking statements. These statements also involve known and unknown
risks, which may cause the results of the Company, its divisions and concepts to be materially different than those expressed
or implied in such statements, including those referenced in the press release. Accordingly,
readers should not place undue reliance on any forward-looking statements. Forward-looking statements may include comments as to the Company’s
beliefs and expectations as to future financial performance, events and trends affecting its business and are necessarily subject to uncertainties,
many of which are outside the Company’s control. More information on potential factors that could affect the Company’s financial
results is included from time to time in the “Cautionary Statement Regarding Forward-Looking Statements,” “Risk
Factors” and “Management’s Discussion and Analysis of Financial Condition and Results of Operations”
sections of the Company’s most recently filed periodic reports on Form 10-K and Form 10-Q and subsequent filings with the SEC and
available at www.sec.gov and in the “Investor Relations” – “SEC Filings”
section of the Company’s website at www.vertexenergy.com. Forward-looking statements speak only as of the date
they are made. The Company undertakes no obligation to publicly update or revise any forward-looking statements, whether as a result of
new information, future events or otherwise that occur after that date, except as otherwise provided by law.
SIGNATURES
Pursuant to the requirements of the Securities Exchange Act of 1934, the
registrant has duly caused this report to be signed on its behalf by the undersigned hereunto duly authorized.
| |
VERTEX ENERGY, INC. |
| |
|
| Date: November 7, 2023 |
By: |
/s/ Chris Carlson |
| |
|
Chris Carlson |
| |
|
Chief Financial Officer |
Vertex Energy, Inc. 8-K
Exhibit 99.1
Vertex Energy Announces Third Quarter 2023
Results
HOUSTON, TX / BUSINESSWIRE / November 7, 2023 / Vertex Energy, Inc. (NASDAQ:
VTNR) (“Vertex” or the “Company”), a leading specialty refiner and marketer of high-quality refined products,
today announced its financial results for the third quarter ended September 30, 2023.
The Company will host a conference
call to discuss third quarter 2023 results today, at 8:30 A.M. Eastern Time. Details regarding the conference call are included at the
end of this release.
THIRD QUARTER 2023 HIGHLIGHTS
| · | Reported net income attributable to common shareholders of $19.8 million,
or $0.17 per fully-diluted share |
| · | Reported Adjusted EBITDA of $51.5 million |
| · | Continued safe operation of the Company’s Mobile, Alabama refinery
(the “Mobile Refinery”) with third quarter 2023 conventional throughput of 80,171 barrels per day (bpd), which was above prior
guidance and reflecting 107% of stated facility conventional operational capacity |
| · | Renewable diesel (“RD”) throughput of 5,397 bpd, reflecting Phase
One capacity utilization of 67.5% |
| · | Total cash and cash equivalents of $79.3 million, including restricted cash
of $3.6 million as of September 30, 2023 |
Vertex reported third quarter 2023 net income
attributable to common shareholders of $19.8 million, or $0.17 per fully-diluted share, versus net income attributable to common shareholders
of $22.2 million, or $0.15 per fully-diluted share for the third quarter of 2022. Adjusted EBITDA (see “Non-GAAP Financial Measures
and Key Performance Indicators”, below) was $51.5 million for the third quarter 2023, compared to Adjusted EBITDA of $1.6 million
in the prior-year period. Financial results for the third quarter of 2023 include an inventory valuation adjustment charge in the amount
of $9.4 million during the quarter.
Schedules reconciling the Company’s generally
accepted accounting principles in the United States (“GAAP”) and non-GAAP financial results, including Adjusted EBITDA and
certain key performance indicators, are included later in this release (see also “Non-GAAP Financial Measures and Key Performance
Indicators”, below).
MANAGEMENT COMMENTARY
Mr. Benjamin P. Cowart, Vertex’s
Chief Executive Officer stated, “During the third quarter, we demonstrated yet another quarter of safe, reliable operations at the
Mobile Refinery, exceeding our operational expectations for the period. Favorable commodity prices which provided a tailwind to results
during the third quarter, presented an opportunity for our risk management team to secure attractive pricing for approximately 27% of
our gasoline production during the seasonally weak fourth quarter of the year.” Mr. Cowart continued, “We continue to advance
our alternative feedstock strategy for optimization of our renewable diesel operations, and are actively assessing strategic options related
to this asset in an effort to bring a portion of what we believe is the substantial unrecognized value of this asset forward to add liquidity
and greater financial flexibility to the Company.”
MOBILE REFINERY OPERATIONS
Conventional Fuels Refining
Total conventional throughput
at the Mobile Refinery was 80,171 bpd in the third quarter of 2023. Total production of finished high-value, light products, such as gasoline,
diesel and jet fuel, represented approximately 67% of total production in the third quarter of 2023, vs. 61% in the second quarter of
2023, and slightly ahead of management’s original expectations, reflecting a continued successful yield optimization initiative
at the Mobile conventional refining facility.
The Mobile Refinery’s
conventional operations generated a gross profit of $86.2 million and $129.5 million of fuel gross margin (a KPI discussed below) or $17.56
per barrel during the third quarter of 2023, versus generating a gross profit of $49.1 million, and fuel gross margin (a KPI discussed
below) of $92.9 million, or $14.86 per barrel in the third quarter of 2022.
Renewable Diesel Facility
Total renewable throughput at
the Mobile Renewable Diesel facility was 5,397 bpd in the third quarter of 2023. Total production of renewable diesel was 5,276 bpd reflecting
a product yield of 97.8%.
The Mobile Renewable Diesel
facility operations generated a gross loss of $(8.5) million and $2.4 million of fuel gross margin (a non-GAAP measure) or $4.78 per barrel
during the third quarter of 2023.
Feedstock Supply Strategy Advanced.
During the third quarter, Vertex continued to advance its alternative feedstock supply strategy. The Company has completed the required
temporary filings for LCFS credits at the default carbon intensity (“C.I.”) score. Vertex expects the initial default level
LCFS credits to be applied to all volumes of renewable diesel produced during the 3rd and 4th quarter of 2023 and
to contribute to financial results in the 4th quarter.
During the quarter the company successfully
completed runs to support filing for proprietary carbon intensity scores of LCFS pathways for Soy, DCO and Canola and is completing the
necessary Tallow runs in November. The filings for each of these four feedstocks are expected to be completed during the 4th
quarter as scheduled. Once completed, these filings will allow Vertex to receive the increased credit value available with their lower
carbon intensity production as compared to the default temporary values.
Third Quarter 2023 Mobile
Refinery Financial and Operating Results ($/millions unless otherwise noted)
| |
|
|
|
|
|
| Conventional
Fuels Refinery |
1Q23 |
2Q23 |
3Q23 |
2023
YTD |
| |
|
|
|
|
|
| |
Total Throughput (bpd) |
71,328 |
76,330 |
80,171 |
75,976 |
| |
Total Throughput (MMbbl) |
6.42 |
6.95 |
7.38
|
20.74
|
| |
Conventional
Facility Capacity Utilization1 |
95.1%
|
101.8%
|
106.9%
|
101.3%
|
| |
|
|
|
|
|
| |
Direct Opex Per Barrel ($/bbl) |
$3.84
|
$3.35
|
$2.40
|
$3.17
|
| |
Fuel Gross Margin ($/MM) |
$103.8
|
$55.7
|
$129.5
|
$289.0
|
| |
Fuel Gross Margin Per Barrel
($/bbl) |
$16.17
|
$8.03
|
$17.56
|
$13.94
|
| |
|
|
|
|
|
| |
Production Yield |
|
|
|
|
| |
Gasoline
(bpd) |
15,723 |
17,812 |
21,287 |
18,295 |
| |
%
Production |
22.7% |
23.2% |
26.6% |
24.3% |
| |
ULSD
(bpd) |
14,720 |
15,618 |
16,479 |
15,612 |
| |
%
Production |
21.2% |
20.3% |
20.6% |
20.7% |
| |
Jet
(bpd) |
12,789 |
13,570 |
15,823 |
14,072 |
| |
%
Production |
18.4% |
17.7% |
19.8% |
18.7% |
| |
Total
Finished Fuel Products |
43,232 |
47,000 |
53,589 |
47,979 |
| |
%
Production |
62.3% |
61.2% |
67.0% |
63.6% |
| |
Other2 |
26,119 |
29,828 |
26,419 |
27,456 |
| |
%
Production |
37.7% |
38.8% |
33.0% |
36.4% |
| |
Total
Production (bpd) |
69,351 |
76,828 |
80,008 |
75,435 |
| |
Total
Production (MMbbl) |
6.24 |
6.99 |
7.36 |
20.59 |
| |
|
|
|
|
|
| Renewable
Fuels Refinery |
1Q23 |
2Q23 |
3Q23 |
2023
YTD |
| |
|
|
|
|
|
| |
Total Renewable Throughput
(bpd) |
- |
2,490 |
5,397 |
3,952 |
| |
Total Renewable Throughput
(MMbbl) |
- |
0.23 |
0.50
|
1.08 |
| |
Renewable
Diesel Facility Capacity Utilization3 |
- |
31.1%
|
67.5%
|
49.4%
|
| |
|
|
|
|
|
| |
Direct Opex Per Barrel ($/bbl) |
- |
$31.23
|
$23.05
|
$25.61
|
| |
Renewable Fuel Gross Margin
($/MM) |
- |
($3.1) |
$2.4
|
($0.7) |
| |
Renewable Fuel Gross Margin
Per Barrel ($/bbl) |
- |
($13.66) |
$4.78
|
($1.00) |
| |
|
|
|
|
|
| |
Renewable Diesel Production
(bpd) |
- |
2,208 |
5,276 |
3,750 |
| |
Renewable Diesel Production
(MMbbl) |
- |
0.20 |
0.49 |
1.02 |
| |
Renewable Diesel Production
Yield (%) |
-
|
88.7%
|
97.8%
|
94.9%
|
| |
|
|
|
|
|
| |
1.) Assumes 75,000 barrels per day of conventional operational capacity
|
|
|
|
|
| |
2.) Other includes naphtha, intermediates, and LPG |
|
|
|
|
| |
3.) Assumes 8,000 barrels per day of renewable fuels
operational capacity |
|
|
|
Balance Sheet and Liquidity Update
As of September 30, 2023, Vertex had total debt outstanding
of $242.3 million, including $15.2 million in 6.25% Senior Convertible Notes, $148.0 million outstanding on the Company’s Term
Loan, finance lease obligations of $69.0 million, and $10.1 million in other obligations. The Company had total cash and equivalents
of $79.3 million, including $3.6 million of restricted cash on the balance sheet as of September 30, 2023, for a net debt position of
$163.0 million. The ratio of net debt to trailing twelve month Adjusted EBITDA was 1.3 times as of September 30, 2023. (see also “Non-GAAP
Financial Measures and Key Performance Indicators”, below).
Commodity Price Risk Management
During
the third quarter, Vertex’s commodity price risk management team identified an opportunity to secure attractive future refining
margins for a portion of the Company’s forecast gasoline production ahead of the projected seasonally weak fourth quarter for this
specific market. The Company entered hedge positions covering approximately 27% of planned gasoline production for the fourth quarter
of 2023.
Management Outlook
All guidance presented below is current as of the
time of this release and is subject to change. All prior financial guidance should no longer be relied upon.
| Conventional
Fuels |
4Q
2023 |
| Operational: |
Low |
|
High |
| Mobile Refinery Conventional
Throughput Volume (Mbpd) |
68.0 |
|
71.0 |
| Capacity
Utilization |
91% |
|
95% |
| Production Yield Profile: |
|
|
|
| Percentage
Finished Products1 |
64% |
|
68% |
| Intermediate
& Other Products2 |
36% |
|
32% |
| |
|
|
|
| Renewable
Fuels |
4Q
2023 |
| Operational: |
Low |
|
High |
| Mobile Refinery Renewable
Throughput Volume (Mbpd) |
4.0 |
|
6.0 |
| Capacity
Utilization |
50% |
|
75% |
| Production
Yield |
97% |
|
98% |
| Yield
Loss |
3% |
|
2% |
| |
|
|
|
| Consolidated |
4Q
2023 |
| Operational: |
Low |
|
High |
| Mobile
Refinery Total Throughput Volume (Mbpd) |
72.0 |
|
77.0 |
| Capacity
Utilization |
87% |
|
93%
|
| |
|
|
|
| Financial
Guidance: |
|
|
|
| Direct
Operating Expense ($/bbl) |
$3.95 |
|
$4.20
|
| Capital
Expenditures ($/MM) |
$15.00 |
|
$20.00
|
| |
|
|
|
| |
|
|
|
| 1.) Finished products include gasoline, ULSD, and Jet A |
|
|
|
| 2.) Intermediate & Other products include Vacuum Gas
Oil (VGO), Liquified Petroleum Gases (LPGs), and Vacuum Tower Bottoms (VTBs) |
CONFERENCE CALL AND WEBCAST DETAILS
A conference call will be held
today, November 7, 2023 at 8:30 A.M. Eastern Time to review the Company’s financial results, discuss recent events and conduct
a question-and-answer session. An audio webcast of the conference call and accompanying presentation materials will also be available
in the “Events and Presentation” section of Vertex’s website at www.vertexenergy.com.
To listen to a live broadcast, visit the site at least 15 minutes prior to the scheduled start time in order to register, download, and
install any necessary audio software.
To participate in the live teleconference:
Domestic: (888) 350-3870
International: (646) 960-0308
Conference ID: 8960754
To listen to a replay of the teleconference, which
will be available through November 21, 2023, either go to the “Events and Presentation” section of Vertex's website at www.vertexenergy.com,
or call the number below:
Domestic Replay: (800)
770-2030
Access Code: 8960754
ABOUT VERTEX ENERGY
Vertex Energy is a leading energy transition company
that specializes in producing both renewable and conventional fuels. Our innovative solutions are designed to enhance the performance
of our customers and partners while also prioritizing sustainability, safety, and operational excellence. With a commitment to providing
superior products and services, Vertex Energy is dedicated to shaping the future of the energy industry.
FORWARD-LOOKING STATEMENTS
Certain of the matters discussed in this
communication which are not statements of historical fact constitute forward-looking statements within the meaning of the securities
laws, including the Private Securities Litigation Reform Act of 1995, that involve a number of risks and uncertainties. Words such
as “strategy,” “expects,” “continues,” “plans,” “anticipates,”
“believes,” “would,” “will,” “estimates,” “intends,”
“projects,” “goals,” “targets” and other words of similar meaning are intended to identify
forward-looking statements but are not the exclusive means of identifying these statements. Any statements made in this news release
other than those of historical fact, about an action, event or development, are forward-looking statements. The important factors
that may cause actual results and outcomes to differ materially from those contained in such forward-looking statements include,
without limitation, the Company’s projected Outlook for the fourth quarter of 2023, as discussed above; statements concerning:
the Company’s engagement of BofA Securities, Inc., as previously disclosed; the review and evaluation of potential joint
ventures, divestitures, acquisitions, mergers, business combinations, or other strategic transactions and their impact on
shareholder value; the process by which the Company engages in evaluation of strategic transactions; the Company’s ability to
identify potential partners; the outcome of potential future strategic transactions and the terms thereof; the future production of
the Company’s Mobile Refinery; anticipated and unforeseen events which could reduce future production at the refinery or delay
future capital projects, and changes in commodity and credit values; throughput volumes, production rates, yields, operating
expenses and capital expenditures at the Mobile Refinery; the timing of, and outcome of, the evaluation and associated carbon
intensity scoring of the Company’s feedstock blends by officials in the state of California; the ability of the Company to
obtain low carbon fuel standard (LCFS) credits, and the amounts thereof; the need for additional capital in the future, including,
but not limited to, in order to complete future capital projects and satisfy liabilities, the Company’s ability to raise such
capital in the future, and the terms of such funding; the timing of capital projects at the Company’s refinery located in
Mobile, Alabama (the “Mobile Refinery”) and the outcome of such projects; the future production of the Mobile Refinery,
including but not limited to, renewable diesel production; estimated and actual production and costs associated with the renewable
diesel capital project; estimated revenues, margins and expenses, over the course of the agreement with Idemitsu; anticipated and
unforeseen events which could reduce future production at the Mobile Refinery or delay planned and future capital projects; changes
in commodity and credits values; certain early termination rights associated with third party agreements and conditions precedent to
such agreements; certain mandatory redemption provisions of the outstanding senior convertible notes, the conversion rights
associated therewith, and dilution caused by conversions and/or the exchanges of convertible notes; the Company’s ability to
comply with required covenants under outstanding senior notes and a term loan and pay amounts due under such senior notes and term
loan, including interest and other amounts due thereunder; the ability of the Company to retain and hire key personnel; the level of
competition in the Company’s industry and its ability to compete; the Company’s ability to respond to changes in its
industry; the loss of key personnel or failure to attract, integrate and retain additional personnel; the Company’s ability to
protect intellectual property and not infringe on others’ intellectual property; the Company’s ability to scale its
business; the Company’s ability to maintain supplier relationships and obtain adequate supplies of feedstocks; the
Company’s ability to obtain and retain customers; the Company’s ability to produce products at competitive rates; the
Company’s ability to execute its business strategy in a very competitive environment; trends in, and the market for, the price
of oil and gas and alternative energy sources; the impact of inflation on margins and costs; the volatile nature of the prices for
oil and gas caused by supply and demand, including volatility caused by the ongoing Ukraine/Russia conflict and/or the Israel/Hamas
conflict, increased interest rates, recessions and inflation; the Company’s ability to maintain relationships with partners;
the outcome of pending and potential future litigation, judgments and settlements; rules and regulations making the Company’s
operations more costly or restrictive; volatility in the market price of compliance credits (primarily Renewable Identification
Numbers (RINs) needed to comply with the Renewable Fuel Standard (“RFS”)) under renewable and low-carbon fuel programs
and emission credits needed under other environmental emissions programs, the requirement for the Company to purchase RINs in the
secondary market to the extent it does not generate sufficient RINs internally, liabilities associated therewith and the timing,
funding and costs of such required purchases, if any; changes in environmental and other laws and regulations and risks associated
with such laws and regulations; economic downturns both in the United States and globally, changes in inflation and interest rates,
increased costs of borrowing associated therewith and potential declines in the availability of such funding; risk of increased
regulation of the Company’s operations and products; disruptions in the infrastructure that the Company and its partners rely
on; interruptions at the Company’s facilities; unexpected and expected changes in the Company’s anticipated capital
expenditures resulting from unforeseen and expected required maintenance, repairs, or upgrades; the Company’s ability to
acquire and construct new facilities; the Company’s ability to effectively manage growth; decreases in global demand for, and
the price of, oil, due to inflation, recessions or other reasons, including declines in economic activity or global conflicts;
expected and unexpected downtime at the Company’s facilities; the Company’s level of indebtedness, which could affect
its ability to fulfill its obligations, impede the implementation of its strategy, and expose the Company’s interest rate
risk; dependence on third party transportation services and pipelines; risks related to obtaining required crude oil supplies, and
the costs of such supplies; counterparty credit and performance risk; unanticipated problems at, or downtime effecting, the
Company’s facilities and those operated by third parties; risks relating to the Company’s hedging activities or lack of
hedging activities; and risks relating to planned and future divestitures, asset sales, joint ventures and acquisitions.
Other important factors that may cause actual results
and outcomes to differ materially from those contained in the forward-looking statements included in this communication are described
in the Company’s publicly filed reports, including, but not limited to, the Company’s Annual Report on Form 10-K for the year
ended December 31, 2022, and the Company’s Quarterly Report on Form 10-Q for the quarter ended September 30, 2023, and future Annual
Reports on Form 10-K and Quarterly Reports on Form 10-Q. These reports are available at www.sec.gov. The Company cautions that the foregoing
list of important factors is not complete. All subsequent written and oral forward-looking statements attributable to the Company or any
person acting on behalf of the Company are expressly qualified in their entirety by the cautionary statements referenced above. Other
unknown or unpredictable factors also could have material adverse effects on Vertex’s future results. The forward-looking statements
included in this press release are made only as of the date hereof. Vertex cannot guarantee future results, levels of activity, performance
or achievements. Accordingly, you should not place undue reliance on these forward-looking statements. Finally, Vertex undertakes no obligation
to update these statements after the date of this release, except as required by law, and takes no obligation to update or correct information
prepared by third parties that are not paid for by Vertex. If we update one or more forward-looking statements, no inference should be
drawn that we will make additional updates with respect to those or other forward-looking statements.
PROJECTIONS
The financial projections (the “Projections”)
included herein were prepared by Vertex in good faith using assumptions believed to be reasonable. A significant number of assumptions
about the operations of the business of Vertex were based, in part, on economic, competitive, and general business conditions prevailing
at the time the Projections were developed. Any future changes in these conditions, may materially impact the ability of Vertex to achieve
the financial results set forth in the Projections. The Projections are based on numerous assumptions, including realization of the operating
strategy of Vertex; industry performance; no material adverse changes in applicable legislation or regulations, or the administration
thereof, or generally accepted accounting principles; general business and economic conditions; competition; retention of key management
and other key employees; absence of material contingent or unliquidated litigation, indemnity, or other claims; minimal changes in current
pricing; static material and equipment pricing; no significant increases in interest rates or inflation; and other matters, many of which
will be beyond the control of Vertex, and some or all of which may not materialize. The Projections also assume the continued uptime of
the Company’s facilities at historical levels and the successful funding of, timely completion of, and successful outcome of, planned
capital projects. Additionally, to the extent that the assumptions inherent in the Projections are based upon future business decisions
and objectives, they are subject to change. Although the Projections are presented with numerical specificity and are based on reasonable
expectations developed by Vertex’s management, the assumptions and estimates underlying the Projections are subject to significant
business, economic, and competitive uncertainties and contingencies, many of which will be beyond the control of Vertex. Accordingly,
the Projections are only estimates and are necessarily speculative in nature. It is expected that some or all of the assumptions in the
Projections will not be realized and that actual results will vary from the Projections. Such variations may be material and may increase
over time. In light of the foregoing, readers are cautioned not to place undue reliance on the Projections. The projected financial information
contained herein should not be regarded as a representation or warranty by Vertex, its management, advisors, or any other person that
the Projections can or will be achieved. Vertex cautions that the Projections are speculative in nature and based upon subjective decisions
and assumptions. As a result, the Projections should not be relied on as necessarily predictive of actual future events.
NON-GAAP FINANCIAL MEASURES AND KEY PERFORMANCE
INDICATORS
In addition to our results calculated under generally
accepted accounting principles in the United States (“GAAP”), in this news release we also present certain non-U.S.
GAAP financial measures and key performance indicators. Non-U.S. GAAP financial measures include Adjusted Gross Margin, Fuel Gross Margin
and Refining Adjusted EBITDA, for the Company’s Legacy Refining and Marketing segment, and the total Refining and Marketing segment,
as a whole, and Net Long-Term Debt and Ratio of Net Long-Term Debt (collectively, the “Non-U.S. GAAP Financial Measures”).
Key performance indicators include Adjusted Gross Margin, Fuel Gross Margin and Refining Adjusted EBITDA for Conventional, Renewable
and the Mobile Refinery as a whole, and Fuel Gross Margin Per Barrel of Throughput and Adjusted Gross Margin Per Barrel of Throughput
for Conventional, Renewable and the Mobile Refinery as a whole (collectively, the “KPIs”). EBITDA represents net income
before interest, taxes, depreciation and amortization, for continued and discontinued operations. Adjusted EBITDA represents net income
(loss) from operations plus unrealized gain or losses on hedging activities, Renewable Fuel Standard (RFS) costs (mainly related to Renewable
Identification Numbers (RINs), and inventory adjustments, depreciation and amortization, acquisition costs, gain on change in value of
derivative warrant liability, environmental clean-up, stock-based compensation, (gain) loss on sale of assets, interest expense, and
certain other unusual or non-recurring charges included in selling, general, and administrative expenses. Adjusted Gross Margin is defined
as gross profit (loss) plus or minus unrealized gain or losses on hedging activities and inventory valuation adjustments. Fuel Gross
Margin is defined as Adjusted Gross Margin, plus production costs, operating expenses and depreciation attributable to cost of revenues
and other non-fuel items included in costs of revenues including realized and unrealized gain or losses on hedging activities, RFS costs
(mainly related to RINs), inventory valuation adjustments, fuel financing costs and other revenues and cost of sales items. Fuel Gross
Margin Per Barrel of Throughput is calculated as fuel gross margin divided by total throughput barrels for the period presented. Operating
Expenses Per Barrel of Throughput is defined as total operating expenses divided by total barrels of throughput. RIN Adjusted Fuel Gross
Margin is defined as [Fuel Gross Margin minus RIN expense divided by total barrels of throughput. RIN Adjusted Fuel Gross Margin Per
Barrel of Throughput is calculated as RIN Adjusted Fuel Gross Margin divided by total throughput barrels for the period presented. Net
Long-Term Debt is long-term debt and lease obligations, adjusted for unamortized discount and deferred financing costs, insurance premiums
financed, less cash and cash equivalents and restricted cash. Ratio of Net Long-Term Debt is defined as Long-Term Debt divided by Adjusted
EBITDA.
Each of the Non-U.S. GAAP Financial Measures
and KPIs are discussed in greater detail below. The (a) Non-U.S. GAAP Financial Measures are “non-U.S. GAAP financial measures”,
and (b) the KPIs are, presented as supplemental measures of the Company’s performance. They are not presented in accordance with
U.S. GAAP. We use the Non-U.S. GAAP Financial Measures and KPIs as supplements to U.S. GAAP measures of performance to evaluate the effectiveness
of our business strategies, to make budgeting decisions, to allocate resources and to compare our performance relative to our peers. Additionally,
these measures, when used in conjunction with related U.S. GAAP financial measures, provide investors with an additional financial analytical
framework which management uses, in addition to historical operating results, as the basis for financial, operational and planning decisions
and present measurements that third parties have indicated are useful in assessing the Company and its results of operations. The Non-U.S.
GAAP Financial Measures and KPIs are presented because we believe they provide additional useful information to investors due to the various
noncash items during the period. Non-U.S. GAAP financial information and KPIs similar to the Non-U.S. GAAP Financial Measures and KPIs
are also frequently used by analysts, investors and other interested parties to evaluate companies in our industry. The Non-U.S. GAAP
Financial Measures and KPIs are unaudited, and have limitations as analytical tools, and you should not consider them in isolation, or
as a substitute for analysis of our operating results as reported under U.S. GAAP. Some of
these limitations are: the Non-U.S. GAAP Financial
Measures and KPIs do not reflect cash expenditures, or future requirements for capital expenditures, or contractual commitments; the Non-GAAP
Financial Measures and KPIs do not reflect changes in, or cash requirements for, working capital needs; the Non-GAAP Financial Measures
and KPIs do not reflect the significant interest expense, or the cash requirements necessary to service interest or principal payments,
on debt or cash income tax payments; although depreciation and amortization are noncash charges, the assets being depreciated and amortized
will often have to be replaced in the future, the Non-U.S. GAAP Financial Measures and KPIs do not reflect any cash requirements for such
replacements; the Non-U.S. GAAP Financial Measures and KPIs represent only a portion of our total operating results; and other companies
in this industry may calculate the Non-U.S. GAAP Financial Measures and KPIs differently than we do, limiting their usefulness as a comparative
measure. You should not consider the Non-U.S. GAAP Financial Measures and KPIs in isolation, or as substitutes for analysis of the Company’s
results as reported under U.S. GAAP. The Company’s presentation of these measures should not be construed as an inference that future
results will be unaffected by unusual or nonrecurring items. We compensate for these limitations by providing a reconciliation of each
of these non-U.S. GAAP Financial Measures and KPIs to the most comparable U.S. GAAP measure below. We encourage investors and others to
review our business, results of operations, and financial information in their entirety, not to rely on any single financial measure,
and to view these non-U.S. GAAP Financial Measures and KPIs in conjunction with the most directly comparable U.S. GAAP financial measure.
We compensate for these limitations by providing
a reconciliation of each of the non-GAAP Financial Measures to the most comparable GAAP measure and reconciliation of the KPIs, below.
We encourage investors and others to review our business, results of operations, and financial information in their entirety, not to rely
on any single financial measure, and to view the non-GAAP Financial Measures in conjunction with the most directly comparable GAAP financial
measure. For more information on these non-GAAP financial measures and KPIs, please see the sections titled “Unaudited Reconciliation
of Gross Profit (Loss) From Continued and Discontinued Operations to Adjusted Gross Margin, Fuel Gross Margin, Fuel Gross Margin Per Barrel
of Throughput and Operating Expenses Per Barrel of Throughput”, “Unaudited Reconciliation of Adjusted EBITDA to Net loss from
Continued and Discontinued Operations”, and “Unaudited Reconciliation of Long-Term Debt to Net Long-Term Debt and Net Leverage”,
at the end of this release.
CONTACT:
IR@vertexenergy.com
203-682-8284
VERTEX ENERGY, INC.
CONSOLIDATED BALANCE SHEETS
(in thousands, except number of shares and par
value)
(UNAUDITED)
| | |
September
30,
2023 | |
December
31,
2022 |
| ASSETS | |
| | | |
| | |
| Current assets | |
| | | |
| | |
| Cash and cash equivalents | |
$ | 75,705 | | |
$ | 141,258 | |
| Restricted cash | |
| 3,605 | | |
| 4,929 | |
| Accounts receivable, net | |
| 36,816 | | |
| 34,548 | |
| Inventory | |
| 222,685 | | |
| 135,473 | |
| Derivative commodity asset | |
| 4,991 | | |
| — | |
| Prepaid expenses and other current assets | |
| 57,315 | | |
| 36,660 | |
| Assets held for sale, current | |
| — | | |
| 20,560 | |
| Total current assets | |
| 401,117 | | |
| 373,428 | |
| | |
| | | |
| | |
| Fixed assets, net | |
| 321,314 | | |
| 201,749 | |
| Finance lease right-of-use assets | |
| 65,317 | | |
| 44,081 | |
| Operating lease right-of use assets | |
| 90,413 | | |
| 53,557 | |
| Intangible assets, net | |
| 11,207 | | |
| 11,827 | |
| Deferred taxes assets | |
| — | | |
| 2,498 | |
| Other assets | |
| 3,310 | | |
| 2,245 | |
| TOTAL ASSETS | |
$ | 892,678 | | |
$ | 689,385 | |
| | |
| | | |
| | |
| LIABILITIES AND STOCKHOLDERS' EQUITY | |
| | | |
| | |
| Current liabilities | |
| | | |
| | |
| Accounts payable | |
$ | 63,628 | | |
$ | 20,997 | |
| Accrued expenses | |
| 69,315 | | |
| 81,711 | |
| Finance lease liability-current | |
| 2,297 | | |
| 1,363 | |
| Operating lease liability-current | |
| 26,047 | | |
| 9,012 | |
| Current portion of long-term debt, net | |
| 18,321 | | |
| 13,911 | |
| Obligations under inventory financing agreements,
net | |
| 182,487 | | |
| 117,939 | |
| Derivative commodity liability | |
| — | | |
| 242 | |
| Liabilities held for sale, current | |
| — | | |
| 3,424 | |
| Total
current liabilities | |
| 362,095 | | |
| 248,599 | |
| | |
| | | |
| | |
| Long-term debt, net | |
| 125,010 | | |
| 170,010 | |
| Finance lease liability-long-term | |
| 66,751 | | |
| 45,164 | |
| Operating lease liability-long-term | |
| 64,367 | | |
| 44,545 | |
| Deferred tax liabilities | |
| 1,257 | | |
| — | |
| Derivative warrant liability | |
| 9,234 | | |
| 14,270 | |
| Other liabilities | |
| 1,377 | | |
| 1,377 | |
| Total liabilities | |
| 630,091 | | |
| 523,965 | |
| | |
| | | |
| | |
| COMMITMENTS AND CONTINGENCIES (Note 4) | |
| — | | |
| — | |
| | |
| | | |
| | |
| STOCKHOLDERS' EQUITY | |
| | | |
| | |
| | |
| | | |
| | |
Common stock, $0.001 par value per share;
750,000,000 shares authorized; 93,514,346 and
75,668,826 shares issued and outstanding at September 30, 2023 and December 31, 2022, respectively. | |
| 94 | | |
| 76 | |
| Additional paid-in capital | |
| 382,849 | | |
| 279,552 | |
| Accumulated deficit | |
| (123,588 | ) | |
| (115,893 | ) |
| Total Vertex Energy, Inc. stockholders' equity | |
| 259,355 | | |
| 163,735 | |
| Non-controlling interest | |
| 3,232 | | |
| 1,685 | |
| Total equity | |
| 262,587 | | |
| 165,420 | |
| TOTAL LIABILITIES AND STOCKHOLDERS' EQUITY | |
$ | 892,678 | | |
$ | 689,385 | |
VERTEX ENERGY, INC.
CONSOLIDATED STATEMENTS OF OPERATIONS
(in thousands, except per share amounts)
(UNAUDITED)
| | |
Three Months Ended September 30, | |
Nine Months Ended September 30, |
| | |
2023 | |
2022 | |
2023 | |
2022 |
| Revenues | |
$ | 1,018,407 | | |
$ | 809,529 | | |
$ | 2,444,442 | | |
$ | 1,913,435 | |
| Cost of revenues (exclusive of depreciation and amortization shown separately
below) | |
| 925,542 | | |
| 749,654 | | |
| 2,274,543 | | |
| 1,817,787 | |
| Depreciation and amortization attributable to costs
of revenues | |
| 7,896 | | |
| 4,049 | | |
| 18,863 | | |
| 9,139 | |
| Gross profit | |
| 84,969 | | |
| 55,826 | | |
| 151,036 | | |
| 86,509 | |
| | |
| | | |
| | | |
| | | |
| | |
| Operating expenses: | |
| | | |
| | | |
| | | |
| | |
| Selling, general and administrative expenses (exclusive of depreciation
and amortization shown separately below) | |
| 43,137 | | |
| 37,142 | | |
| 127,715 | | |
| 90,039 | |
| Depreciation and amortization attributable to operating
expenses | |
| 1,033 | | |
| 1,119 | | |
| 3,077 | | |
| 2,655 | |
| Total operating expenses | |
| 44,170 | | |
| 38,261 | | |
| 130,792 | | |
| 92,694 | |
| Income (loss) from operations | |
| 40,799 | | |
| 17,565 | | |
| 20,244 | | |
| (6,185 | ) |
| Other income (expense): | |
| | | |
| | | |
| | | |
| | |
| Other income (loss) | |
| (133 | ) | |
| 416 | | |
| 1,023 | | |
| 1,059 | |
| Gain on change in value of derivative warrant liability | |
| 4,621 | | |
| 12,312 | | |
| 5,036 | | |
| 7,788 | |
| Interest expense | |
| (13,523 | ) | |
| (13,028 | ) | |
| (103,536 | ) | |
| (64,961 | ) |
| Total other expense | |
| (9,035 | ) | |
| (300 | ) | |
| (97,477 | ) | |
| (56,114 | ) |
| Income (loss) from continuing operations before income tax | |
| 31,764 | | |
| 17,265 | | |
| (77,233 | ) | |
| (62,299 | ) |
| Income tax benefit (expense) | |
| (12,231 | ) | |
| — | | |
| 15,445 | | |
| — | |
| Income (loss) from continuing operations | |
| 19,533 | | |
| 17,265 | | |
| (61,788 | ) | |
| (62,299 | ) |
| Income from discontinued operations, net of tax (see
note 23) | |
| — | | |
| 4,905 | | |
| 53,680 | | |
| 19,878 | |
| Net income (loss) | |
| 19,533 | | |
| 22,170 | | |
| (8,108 | ) | |
| (42,421 | ) |
| Net income (loss) attributable to non-controlling interest and redeemable
non-controlling interest from continuing operations | |
| (310 | ) | |
| (49 | ) | |
| (413 | ) | |
| 15 | |
| Net income (loss) attributable to non-controlling
interest and redeemable non-controlling interest from discontinued operations | |
| — | | |
| (15 | ) | |
| — | | |
| 6,847 | |
| Net income (loss) attributable to Vertex Energy, Inc. | |
| 19,843 | | |
| 22,234 | | |
| (7,695 | ) | |
| (49,283 | ) |
| | |
| | | |
| | | |
| | | |
| | |
| Accretion of redeemable noncontrolling interest to redemption value from
continued operations | |
| — | | |
| — | | |
| — | | |
| (428 | ) |
| | |
| | | |
| | | |
| | | |
| | |
| Net income (loss) attributable to common stockholders from continuing operations | |
| 19,843 | | |
| 17,314 | | |
| (61,375 | ) | |
| (62,742 | ) |
| Net income attributable to common stockholders from
discontinued operations, net of tax | |
| — | | |
| 4,920 | | |
| 53,680 | | |
| 13,031 | |
| Net income (loss) attributable to common shareholders | |
$ | 19,843 | | |
$ | 22,234 | | |
$ | (7,695 | ) | |
$ | (49,711 | ) |
| | |
| | | |
| | | |
| | | |
| | |
| Basic loss per common share | |
| | | |
| | | |
| | | |
| | |
| Continuing operations | |
$ | 0.21 | | |
$ | 0.23 | | |
$ | (0.74 | ) | |
$ | (0.91 | ) |
| Discontinued operations, net
of tax | |
| — | | |
| 0.07 | | |
| 0.65 | | |
| 0.19 | |
| Basic loss per common share | |
$ | 0.21 | | |
$ | 0.30 | | |
$ | (0.09 | ) | |
$ | (0.72 | ) |
| | |
| | | |
| | | |
| | | |
| | |
| Diluted income (loss) per common share | |
| | | |
| | | |
| | | |
| | |
| Continuing operations | |
$ | 0.17 | | |
$ | 0.10 | | |
$ | (0.74 | ) | |
$ | (0.91 | ) |
| Discontinued operations, net
of tax | |
| — | | |
| 0.05 | | |
| 0.65 | | |
| 0.19 | |
| Diluted income (loss) per common share | |
$ | 0.17 | | |
$ | 0.15 | | |
$ | (0.09 | ) | |
$ | (0.72 | ) |
| | |
| | | |
| | | |
| | | |
| | |
| Shares used in computing earnings per share | |
| | | |
| | | |
| | | |
| | |
| Basic | |
| 93,381 | | |
| 75,591 | | |
| 82,928 | | |
| 69,007 | |
| Diluted | |
| 100,427 | | |
| 97,126 | | |
| 82,928 | | |
| 69,007 | |
VERTEX ENERGY, INC.
CONSOLIDATED STATEMENTS OF STOCKHOLDERS' EQUITY
(in thousands, except par value)
(UNAUDITED)
| Nine
Months Ended September 30, 2023 |
| | |
| Common
Stock | | |
| Series
A Preferred | | |
| | | |
| | | |
| | | |
| | |
| | |
| Shares | | |
| $0.001
Par | | |
| Shares | | |
| $0.001
Par | | |
| Additional
Paid-In Capital | | |
| Retained
Earnings | | |
| Non-controlling
Interest | | |
| Total
Equity | |
| Balance on January 1, 2023 | |
| 75,669 | | |
$ | 76 | | |
| — | | |
$ | — | | |
$ | 279,552 | | |
$ | (115,893 | ) | |
$ | 1,685 | | |
$ | 165,420 | |
| Exercise of options | |
| 166 | | |
| — | | |
| — | | |
| — | | |
| 209 | | |
| — | | |
| — | | |
| 209 | |
| Stock based compensation expense | |
| — | | |
| — | | |
| — | | |
| — | | |
| 365 | | |
| — | | |
| — | | |
| 365 | |
| Non controlling shareholder contribution | |
| — | | |
| — | | |
| — | | |
| — | | |
| — | | |
| — | | |
| 980 | | |
| 980 | |
| Net income (loss) | |
| — | | |
| — | | |
| — | | |
| — | | |
| — | | |
| 53,863 | | |
| (50 | ) | |
| 53,813 | |
| Balance on March 31, 2023 | |
| 75,835 | | |
| 76 | | |
| — | | |
| — | | |
| 280,126 | | |
| (62,030 | ) | |
| 2,615 | | |
| 220,787 | |
| Exercise of options | |
| 195 | | |
| — | | |
| — | | |
| — | | |
| 169 | | |
| — | | |
| — | | |
| 169 | |
| Stock based compensation expense | |
| — | | |
| — | | |
| — | | |
| — | | |
| 368 | | |
| — | | |
| — | | |
| 368 | |
| Senior Note Converted | |
| 17,207 | | |
| 17 | | |
| — | | |
| — | | |
| 101,113 | | |
| — | | |
| — | | |
| 101,130 | |
| Non-controlling shareholder contribution | |
| — | | |
| — | | |
| — | | |
| — | | |
| — | | |
| — | | |
| 490 | | |
| 490 | |
| Net loss | |
| — | | |
| — | | |
| — | | |
| — | | |
| — | | |
| (81,401 | ) | |
| (53 | ) | |
| (81,454 | ) |
| Balance on June 30, 2023 | |
| 93,237 | | |
| 93 | | |
| — | | |
| — | | |
| 381,776 | | |
| (143,431 | ) | |
| 3,052 | | |
| 241,490 | |
| Exercise of options | |
| 165 | | |
| 1 | | |
| — | | |
| — | | |
| 304 | | |
| — | | |
| — | | |
| 305 | |
| Stock based compensation expense | |
| — | | |
| — | | |
| — | | |
| — | | |
| 769 | | |
| — | | |
| — | | |
| 769 | |
| Issue of restricted common stock | |
| 113 | | |
| — | | |
| — | | |
| — | | |
| — | | |
| — | | |
| — | | |
| — | |
| Non-controlling shareholder contribution | |
| — | | |
| — | | |
| — | | |
| — | | |
| — | | |
| — | | |
| 490 | | |
| 490 | |
| Net income (loss) | |
| — | | |
| — | | |
| — | | |
| — | | |
| — | | |
| 19,843 | | |
| (310 | ) | |
| 19,533 | |
| Balance on September 30, 2023 | |
| 93,515 | | |
$ | 94 | | |
| — | | |
$ | — | | |
$ | 382,849 | | |
$ | (123,588 | ) | |
$ | 3,232 | | |
$ | 262,587 | |
VERTEX ENERGY, INC.
CONSOLIDATED STATEMENTS OF STOCKHOLDERS' EQUITY
(in thousands, except par value)
(UNAUDITED)
| Nine Months Ended September 30, 2022 |
| | |
Common Stock | |
Series A Preferred | |
| |
| |
| |
|
| | |
Shares | |
$0.001 Par | |
Shares | |
$0.001 Par | |
Additional Paid-In Capital | |
Retained Earnings | |
Non-controlling Interest | |
Total Equity |
| Balance on January 1, 2022 | |
| 63,288 | | |
$ | 63 | | |
| 386 | | |
$ | — | | |
$ | 138,620 | | |
$ | (110,614 | ) | |
$ | 1,997 | | |
$ | 30,066 | |
| Exercise of options | |
| 60 | | |
| — | | |
| — | | |
| — | | |
| 76 | | |
| — | | |
| — | | |
| 76 | |
| Exercise of warrants | |
| 1,113 | | |
| 1 | | |
| — | | |
| — | | |
| (1 | ) | |
| — | | |
| — | | |
| — | |
| Stock based compensation expense | |
| — | | |
| — | | |
| — | | |
| — | | |
| 250 | | |
| — | | |
| — | | |
| 250 | |
| Conversion of Series A Preferred stock to common | |
| 5 | | |
| — | | |
| (5 | ) | |
| — | | |
| — | | |
| — | | |
| — | | |
| — | |
| Reclassification of derivative liabilities | |
| — | | |
| — | | |
| — | | |
| — | | |
| 78,789 | | |
| — | | |
| — | | |
| 78,789 | |
| Accretion of redeemable non-controlling interest to redemption value | |
| — | | |
| — | | |
| — | | |
| — | | |
| — | | |
| (422 | ) | |
| — | | |
| (422 | ) |
| Net income (loss) | |
| — | | |
| — | | |
| — | | |
| — | | |
| — | | |
| (4,547 | ) | |
| 3,739 | | |
| (808 | ) |
| Less: amount attributable to redeemable non-controlling interest | |
| — | | |
| — | | |
| — | | |
| — | | |
| — | | |
| — | | |
| (3,769 | ) | |
| (3,769 | ) |
| Balance on March 31, 2022 | |
| 64,466 | | |
| 64 | | |
| 381 | | |
| — | | |
| 217,734 | | |
| (115,583 | ) | |
| 1,967 | | |
| 104,182 | |
| Exercise of options to common | |
| 498 | | |
| 1 | | |
| — | | |
| — | | |
| 553 | | |
| — | | |
| — | | |
| 554 | |
| Exercise of options to common- unissued | |
| — | | |
| — | | |
| — | | |
| — | | |
| 3 | | |
| — | | |
| — | | |
| 3 | |
| Distribution to non-controlling shareholder | |
| — | | |
| — | | |
| — | | |
| — | | |
| — | | |
| — | | |
| (380 | ) | |
| (380 | ) |
| Adjustment of redeemable non controlling interest | |
| — | | |
| — | | |
| — | | |
| — | | |
| 29 | | |
| (29 | ) | |
| — | | |
| — | |
| Conversion of Convertible Senior Notes to common | |
| 10,165 | | |
| 10 | | |
| — | | |
| — | | |
| 59,812 | | |
| — | | |
| — | | |
| 59,822 | |
| Share based compensation expense | |
| — | | |
| — | | |
| — | | |
| — | | |
| 324 | | |
| — | | |
| — | | |
| 324 | |
| Conversion of Series A Preferred stock to common | |
| 381 | | |
| 1 | | |
| (381 | ) | |
| — | | |
| — | | |
| — | | |
| — | | |
| 1 | |
| Accretion of redeemable non-controlling interest to redemption value | |
| — | | |
| — | | |
| — | | |
| — | | |
| — | | |
| (6 | ) | |
| — | | |
| (6 | ) |
| Net income (loss) | |
| — | | |
| — | | |
| — | | |
| — | | |
| — | | |
| (66,970 | ) | |
| 3,188 | | |
| (63,782 | ) |
| Less: amount attributable to redeemable non-controlling interest | |
| — | | |
| — | | |
| — | | |
| — | | |
| — | | |
| — | | |
| (3,023 | ) | |
| (3,023 | ) |
| Balance on June 30, 2022 | |
| 75,510 | | |
| 76 | | |
| — | | |
| — | | |
| 278,455 | | |
| (182,588 | ) | |
| 1,752 | | |
| 97,695 | |
| Exercise of options to common | |
| 4 | | |
| — | | |
| — | | |
| — | | |
| — | | |
| — | | |
| — | | |
| — | |
| Exercise of options to common- unissued | |
| — | | |
| — | | |
| — | | |
| — | | |
| 97 | | |
| — | | |
| — | | |
| 97 | |
| Exercise of warrants | |
| 96 | | |
| — | | |
| — | | |
| — | | |
| — | | |
| — | | |
| — | | |
| — | |
| Share based compensation expense | |
| — | | |
| — | | |
| — | | |
| — | | |
| 378 | | |
| — | | |
| — | | |
| 378 | |
| Net income (loss) | |
| — | | |
| — | | |
| — | | |
| — | | |
| — | | |
| 22,234 | | |
| (64 | ) | |
| 22,170 | |
| Balance on September 30, 2022 | |
| 75,610 | | |
$ | 76 | | |
| — | | |
$ | — | | |
$ | 278,930 | | |
$ | (160,354 | ) | |
$ | 1,688 | | |
$ | 120,340 | |
VERTEX ENERGY, INC.
CONSOLIDATED STATEMENTS OF CASH FLOWS
(in thousands)
(UNAUDITED)
| | |
Nine Months Ended September 30, |
| | |
2023 | |
2022 |
| Cash flows from operating activities | |
| | | |
| | |
| Net income (loss) | |
$ | (8,108 | ) | |
$ | (42,421 | ) |
| Income from discontinued operations,
net of tax | |
| 53,680 | | |
| 19,878 | |
| Loss from continuing operations | |
| (61,788 | ) | |
| (62,299 | ) |
| Adjustments to reconcile net loss from continuing operations
to cash used in operating activities | |
| | | |
| | |
| Stock based compensation expense | |
| 1,502 | | |
| 952 | |
| Depreciation and amortization | |
| 21,940 | | |
| 11,794 | |
| Deferred income tax benefit | |
| (15,445 | ) | |
| — | |
| | |
| | | |
| | |
| Gain on sale of assets | |
| (2 | ) | |
| (112 | ) |
| Provision for environment clean up | |
| — | | |
| 1,428 | |
| (Decrease) increase in allowance for bad debt | |
| (132 | ) | |
| 157 | |
| (Decrease) increase in fair value of derivative
warrant liability | |
| (5,036 | ) | |
| (7,788 | ) |
| Loss on commodity derivative contracts | |
| 219 | | |
| 87,217 | |
| Net cash settlements
on commodity derivatives | |
| (2,061 | ) | |
| (100,253 | ) |
| Amortization of debt
discount and deferred costs | |
| 74,618 | | |
| 44,537 | |
| Changes in operating assets and liabilities | |
| | | |
| | |
| Accounts receivable and other receivables | |
| (3,819 | ) | |
| (39,202 | ) |
| Inventory | |
| (85,796 | ) | |
| (31,387 | ) |
| Prepaid expenses and other current assets | |
| (24,601 | ) | |
| (16,437 | ) |
| Accounts payable | |
| 42,219 | | |
| 58,275 | |
| Accrued expenses | |
| (12,500 | ) | |
| 37,404 | |
| Other
assets | |
| (987 | ) | |
| 82 | |
| Net cash used in
operating activities from continuing operations | |
| (71,669 | ) | |
| (15,632 | ) |
| Cash flows from investing activities | |
| | | |
| | |
| Acquisition of business, net of cash | |
| (7,642 | ) | |
| — | |
| Purchase of intangible assets | |
| (2,500 | ) | |
| (106 | ) |
| Investment in Mobile Refinery assets | |
| — | | |
| (227,525 | ) |
| Purchase of fixed assets | |
| (128,599 | ) | |
| (34,743 | ) |
| Proceeds from sale of discontinued operation | |
| 92,034 | | |
| — | |
| Proceeds from sale of fixed
assets | |
| 5 | | |
| 188 | |
| Net cash used in investing
activities from continuing operations | |
| (46,702 | ) | |
| (262,186 | ) |
| Cash flows from financing activities | |
| | | |
| | |
| Payments on finance leases | |
| (1,469 | ) | |
| (201 | ) |
| Proceeds from exercise of options and warrants to
common stock | |
| 683 | | |
| 729 | |
| Distributions to noncontrolling interest | |
| — | | |
| (380 | ) |
| Contributions received from noncontrolling interest | |
| 1,960 | | |
| — | |
| Net change on inventory financing agreements | |
| 63,798 | | |
| 133,744 | |
| Redemption of noncontrolling interest | |
| — | | |
| (50,666 | ) |
| Proceeds from note payable | |
| 19,641 | | |
| 173,315 | |
| Payments on note payable | |
| (32,969 | ) | |
| (14,101 | ) |
| Net cash provided by financing
activities from continuing operations | |
| 51,644 | | |
| 242,440 | |
| | |
| | | |
| | |
| Discontinued operations: | |
| | | |
| | |
| Net cash provided by (used in) operating activities | |
| (150 | ) | |
| 23,021 | |
| Net cash used in investing activities | |
| — | | |
| (1,877 | ) |
| Net cash provided by (used in)
discontinued operations | |
| (150 | ) | |
| 21,144 | |
| | |
| | | |
| | |
| Net decrease in cash, cash equivalents and restricted cash | |
| (66,877 | ) | |
| (14,234 | ) |
| Cash, cash equivalents, and restricted cash at beginning
of the period | |
| 146,187 | | |
| 136,627 | |
| Cash, cash equivalents, and restricted cash at end
of period | |
$ | 79,310 | | |
$ | 122,393 | |
VERTEX ENERGY, INC.
CONSOLIDATED STATEMENTS OF CASH FLOWS
(in thousands)
(UNAUDITED)
(Continued)
The following table provides a reconciliation of
cash and cash equivalents and restricted cash reported within the consolidated balance sheets to the same amounts shown in the consolidated
statements of cash flows (in thousands).
| | |
Nine Months
Ended |
| | |
September
30,
2023 | |
September
30,
2022 |
| Cash and cash equivalents | |
$ | 75,705 | | |
$ | 117,464 | |
| Restricted cash | |
| 3,605 | | |
| 4,929 | |
| Cash and cash equivalents and restricted cash as
shown in the consolidated statements of cash flows | |
$ | 79,310 | | |
$ | 122,393 | |
| | |
| | | |
| | |
| SUPPLEMENTAL INFORMATION | |
| | | |
| | |
| Cash paid for interest | |
$ | 35,553 | | |
$ | 65,083 | |
| Cash paid for taxes | |
$ | — | | |
$ | — | |
| | |
| | | |
| | |
| NON-CASH INVESTING AND FINANCING TRANSACTIONS | |
| | | |
| | |
| Equity component of the convertible note issuance | |
$ | — | | |
$ | 78,789 | |
| ROU assets obtained from new finance lease obligation | |
$ | 23,990 | | |
$ | 45,096 | |
| Exchange of Convertible Senior Notes to common stock | |
$ | 79,948 | | |
$ | 59,822 | |
| ROU assets obtained from new operating lease obligation | |
$ | 36,856 | | |
$ | 20,061 | |
| Accretion of redeemable non-controlling interest
to redemption value | |
$ | — | | |
$ | 428 | |
Unaudited segment information for the three and nine months ended
September 30, 2023 and 2022 is as follows (in thousands):
| Three
Months Ended September 30, 2023 |
| | |
Refining
& Marketing | |
Black
Oil & Recovery | |
Corporate
and Eliminations | |
Total |
| Revenues: | |
| |
| |
| |
|
| Refined products | |
$ | 966,805 | | |
$ | 38,642 | | |
$ | (4,632 | ) | |
$ | 1,000,815 | |
| Re-refined products | |
| 4,509 | | |
| 2,966 | | |
| — | | |
| 7,475 | |
| Services | |
| 7,398 | | |
| 2,719 | | |
| — | | |
| 10,117 | |
| Total revenues | |
| 978,712 | | |
| 44,327 | | |
| (4,632 | ) | |
| 1,018,407 | |
| Cost of revenues (exclusive of depreciation and amortization
shown separately below) | |
| 893,612 | | |
| 36,569 | | |
| (4,639 | ) | |
| 925,542 | |
| Depreciation and amortization attributable
to costs of revenues | |
| 6,527 | | |
| 1,369 | | |
| — | | |
| 7,896 | |
| Gross profit | |
| 78,573 | | |
| 6,389 | | |
| 7 | | |
| 84,969 | |
| Selling, general and administrative expenses | |
| 31,485 | | |
| 5,231 | | |
| 6,421 | | |
| 43,137 | |
| Depreciation and amortization attributable
to operating expenses | |
| 829 | | |
| 38 | | |
| 166 | | |
| 1,033 | |
| Income (loss) from operations | |
| 46,259 | | |
| 1,120 | | |
| (6,580 | ) | |
| 40,799 | |
| Other income (expenses) | |
| | | |
| | | |
| | | |
| | |
| Other income (expense) | |
| — | | |
| (167 | ) | |
| 34 | | |
| (133 | ) |
| Gain on change in value of derivative warrant liabilities | |
| — | | |
| — | | |
| 4,621 | | |
| 4,621 | |
| Interest expense | |
| (4,394 | ) | |
| (41 | ) | |
| (9,088 | ) | |
| (13,523 | ) |
| Net income (loss) | |
$ | 41,865 | | |
$ | 912 | | |
$ | (11,013 | ) | |
$ | 31,764 | |
| | |
| | | |
| | | |
| | | |
| | |
| Capital expenditures | |
$ | 20,875 | | |
$ | 8,449 | | |
$ | — | | |
$ | 29,324 | |
| Three
Months Ended September 30, 2022 |
| | |
Refining
& Marketing | |
Black
Oil & Recovery | |
Corporate
and Eliminations | |
Total |
| Revenues: | |
| |
| |
| |
|
| Refined products | |
$ | 748,190 | | |
$ | 37,607 | | |
$ | — | | |
$ | 785,797 | |
| Re-refined products | |
| 16,434 | | |
| 4,587 | | |
| — | | |
| 21,021 | |
| Services | |
| 2,144 | | |
| 567 | | |
| — | | |
| 2,711 | |
| Total revenues | |
| 766,768 | | |
| 42,761 | | |
| — | | |
| 809,529 | |
| Cost of revenues (exclusive of depreciation and amortization
shown separately below) | |
| 714,976 | | |
| 34,678 | | |
| — | | |
| 749,654 | |
| Depreciation and amortization attributable
to costs of revenues | |
| 3,111 | | |
| 938 | | |
| — | | |
| 4,049 | |
| Gross profit | |
| 48,681 | | |
| 7,145 | | |
| — | | |
| 55,826 | |
| Selling, general and administrative expenses | |
| 28,269 | | |
| 4,803 | | |
| 4,070 | | |
| 37,142 | |
| Depreciation and amortization attributable
to operating expenses | |
| 850 | | |
| 38 | | |
| 231 | | |
| 1,119 | |
| Income (loss) from operations | |
| 19,562 | | |
| 2,304 | | |
| (4,301 | ) | |
| 17,565 | |
| Other income (expenses) | |
| | | |
| | | |
| | | |
| | |
| Other income | |
| — | | |
| 416 | | |
| — | | |
| 416 | |
| Gain on change in value of derivative warrant liabilities | |
| — | | |
| — | | |
| 12,312 | | |
| 12,312 | |
| Interest expense | |
| (3,444 | ) | |
| — | | |
| (9,584 | ) | |
| (13,028 | ) |
| Net income (loss) | |
$ | 16,118 | | |
$ | 2,720 | | |
$ | (1,573 | ) | |
$ | 17,265 | |
| | |
| | | |
| | | |
| | | |
| | |
| Capital expenditures | |
| 26,333 | | |
$ | 412 | | |
$ | — | | |
$ | 26,745 | |
| Nine
Months Ended September 30, 2023 |
| | |
Refining
& Marketing | |
Black
Oil & Recovery | |
Corporate
and Eliminations | |
Total |
| Revenues: | |
| |
| |
| |
|
| Refined products | |
$ | 2,322,452 | | |
$ | 89,863 | | |
$ | (9,775 | ) | |
$ | 2,402,540 | |
| Re-refined products | |
| 13,874 | | |
| 10,912 | | |
| — | | |
| 24,786 | |
| Services | |
| 13,133 | | |
| 3,983 | | |
| — | | |
| 17,116 | |
| Total revenues | |
| 2,349,459 | | |
| 104,758 | | |
| (9,775 | ) | |
| 2,444,442 | |
| Cost of revenues (exclusive of depreciation and amortization
shown separately below) | |
| 2,194,382 | | |
| 90,250 | | |
| (10,089 | ) | |
| 2,274,543 | |
| Depreciation and amortization attributable
to costs of revenues | |
| 15,389 | | |
| 3,474 | | |
| — | | |
| 18,863 | |
| Gross profit | |
| 139,688 | | |
| 11,034 | | |
| 314 | | |
| 151,036 | |
| Selling, general and administrative expenses | |
| 90,940 | | |
| 14,535 | | |
| 22,240 | | |
| 127,715 | |
| Depreciation and amortization attributable
to operating expenses | |
| 2,459 | | |
| 114 | | |
| 504 | | |
| 3,077 | |
| Income (loss) from operations | |
| 46,289 | | |
| (3,615 | ) | |
| (22,430 | ) | |
| 20,244 | |
| Other income (expenses) | |
| | | |
| | | |
| | | |
| | |
| Other income | |
| — | | |
| 989 | | |
| 34 | | |
| 1,023 | |
| Gain on change in value of derivative warrant liabilities | |
| — | | |
| — | | |
| 5,036 | | |
| 5,036 | |
| Interest expense | |
| (12,799 | ) | |
| (126 | ) | |
| (90,611 | ) | |
| (103,536 | ) |
| Net income (loss) | |
$ | 33,490 | | |
$ | (2,752 | ) | |
$ | (107,971 | ) | |
$ | (77,233 | ) |
| | |
| | | |
| | | |
| | | |
| | |
| Capital expenditures | |
$ | 118,545 | | |
$ | 16,123 | | |
$ | — | | |
$ | 134,668 | |
| Nine
Months Ended September 30, 2022 |
| | |
Refining
& Marketing | |
Black
Oil & Recovery | |
Corporate
and Eliminations | |
Total |
| Revenues: | |
| |
| |
| |
|
| Refined products | |
$ | 1,721,044 | | |
$ | 129,078 | | |
$ | — | | |
$ | 1,850,122 | |
| Re-refined products | |
| 42,381 | | |
| 14,860 | | |
| — | | |
| 57,241 | |
| Services | |
| 4,452 | | |
| 1,620 | | |
| — | | |
| 6,072 | |
| Total revenues | |
| 1,767,877 | | |
| 145,558 | | |
| — | | |
| 1,913,435 | |
| Cost of revenues (exclusive of depreciation and amortization
shown separately below) | |
| 1,707,746 | | |
| 110,041 | | |
| — | | |
| 1,817,787 | |
| Depreciation and amortization attributable
to costs of revenues | |
| 6,339 | | |
| 2,800 | | |
| — | | |
| 9,139 | |
| Gross profit | |
| 53,792 | | |
| 32,717 | | |
| — | | |
| 86,509 | |
| Selling, general and administrative expenses | |
| 53,073 | | |
| 13,125 | | |
| 23,841 | | |
| 90,039 | |
| Depreciation and amortization attributable
to operating expenses | |
| 1,784 | | |
| 142 | | |
| 729 | | |
| 2,655 | |
| Income (loss) from operations | |
| (1,065 | ) | |
| 19,450 | | |
| (24,570 | ) | |
| (6,185 | ) |
| Other income (expenses) | |
| | | |
| | | |
| | | |
| | |
| Other income | |
| 18 | | |
| 1,041 | | |
| — | | |
| 1,059 | |
| Gain on change in value of derivative warrant liabilities | |
| — | | |
| — | | |
| 7,788 | | |
| 7,788 | |
| Interest expense | |
| (6,694 | ) | |
| (51 | ) | |
| (58,216 | ) | |
| (64,961 | ) |
| Net income (loss) | |
$ | (7,741 | ) | |
$ | 20,440 | | |
$ | (74,998 | ) | |
$ | (62,299 | ) |
| | |
| | | |
| | | |
| | | |
| | |
| Capital expenditures | |
$ | 142,927 | | |
$ | 2,830 | | |
$ | — | | |
$ | 145,757 | |
The following summarized unaudited financial
information has been segregated from continuing operations and reported as discontinued operations for the three and nine months ended
September 30, 2023, and 2022 (in thousands):
| | |
Three Months Ended September 30, | |
Nine Months Ended September
30, |
| | |
2023 | |
2022 | |
2023 | |
2022 |
| Revenues | |
$ | — | | |
$ | 22,859 | | |
$ | 7,366 | | |
$ | 65,618 | |
| Cost of revenues (exclusive of depreciation shown separately below) | |
| — | | |
| 14,953 | | |
| 4,589 | | |
| 37,871 | |
| Depreciation and amortization attributable to costs
of revenues | |
| — | | |
| 394 | | |
| 124 | | |
| 1,176 | |
| Gross profit | |
| — | | |
| 7,512 | | |
| 2,653 | | |
| 26,571 | |
| Operating expenses: | |
| | | |
| | | |
| | | |
| | |
| Selling, general and administrative expenses (exclusive of depreciation
shown separately below) | |
| — | | |
| 2,534 | | |
| 632 | | |
| 6,472 | |
| Depreciation and amortization expense attributable
to operating expenses | |
| — | | |
| 63 | | |
| 21 | | |
| 188 | |
| Total operating expenses | |
| — | | |
| 2,597 | | |
| 653 | | |
| 6,660 | |
| Income from operations | |
| — | | |
| 4,915 | | |
| 2,000 | | |
| 19,911 | |
| Other income (expense) | |
| | | |
| | | |
| | | |
| | |
| Interest expense | |
| — | | |
| (10 | ) | |
| — | | |
| (33 | ) |
| Total other expense | |
| — | | |
| (10 | ) | |
| — | | |
| (33 | ) |
| Income before income tax | |
| — | | |
| 4,905 | | |
| 2,000 | | |
| 19,878 | |
| Income tax expense | |
| — | | |
| — | | |
| (528 | ) | |
| — | |
| Gain on sale of discontinued operations, net of $0 and
$18,671 of tax for three and nine months ended September 30, 2023 | |
| — | | |
| — | | |
| 52,208 | | |
| — | |
| Income from discontinued operations, net of tax | |
$ | — | | |
$ | 4,905 | | |
$ | 53,680 | | |
$ | 19,878 | |
Unaudited Reconciliation of Gross Profit (Loss) From Continued
and Discontinued Operations to Adjusted Gross Margin, Fuel Gross Margin, Fuel Gross Margin Per Barrel of Throughput and Operating Expenses
Per Barrel of Throughput
| Three
Months Ended September 30, 2023 |
| In thousands | |
Conventional | |
Renewable | |
Mobile
Refinery Total |
| Gross profit | |
$ | 86,185 | | |
$ | (8,515 | ) | |
$ | 77,670 | |
| Unrealized (gain) loss on hedging activities | |
| (4,620 | ) | |
| (3,622 | ) | |
| (8,242 | ) |
| Inventory valuation adjustments | |
| 13,225 | | |
| (3,851 | ) | |
| 9,374 | |
| Adjusted gross margin | |
$ | 94,790 | | |
$ | (15,988 | ) | |
$ | 78,802 | |
| Variable production costs attributable to cost of revenues | |
| 26,847 | | |
| 12,958 | | |
| 39,805 | |
| Depreciation and amortization attributable to cost of revenues | |
| 2,982 | | |
| 3,320 | | |
| 6,302 | |
| RINs | |
| 7,058 | | |
| — | | |
| 7,058 | |
| Realized loss on hedging activities | |
| 2,854 | | |
| 2,401 | | |
| 5,255 | |
| Financing costs | |
| 1,772 | | |
| 205 | | |
| 1,977 | |
| Other revenues | |
| (6,804 | ) | |
| (524 | ) | |
| (7,328 | ) |
| Fuel gross margin | |
$ | 129,499 | | |
$ | 2,372 | | |
$ | 131,871 | |
| Throughput (bpd) | |
| 80,171 | | |
| 5,397 | | |
| 85,568 | |
| Fuel gross margin per barrel of
throughput | |
$ | 17.56 | | |
$ | 4.78 | | |
$ | 16.75 | |
| Total OPEX | |
$ | 17,720 | | |
$ | 11,445 | | |
$ | 29,165 | |
| Operating expenses per barrel of
throughput | |
$ | 2.40 | | |
$ | 23.05 | | |
$ | 3.70 | |
| Three
Months Ended June 30, 2023 |
| In thousands | |
Conventional | |
Renewable | |
Mobile
Refinery Total |
| Gross profit | |
$ | 6,544 | | |
$ | (13,006 | ) | |
$ | (6,462 | ) |
| Unrealized (gain) loss on hedging activities | |
| 849 | | |
| 2,913 | | |
| 3,762 | |
| Inventory valuation adjustments | |
| (4,246 | ) | |
| 3,745 | | |
| (501 | ) |
| Adjusted gross margin | |
$ | 3,147 | | |
$ | (6,348 | ) | |
$ | (3,201 | ) |
| Variable production costs attributable to cost of revenues | |
| 28,686 | | |
| 77 | | |
| 28,763 | |
| Depreciation and amortization attributable to cost of revenues | |
| 3,351 | | |
| 2,018 | | |
| 5,369 | |
| RINs | |
| 25,410 | | |
| — | | |
| 25,410 | |
| Realized loss on hedging activities | |
| (1,150 | ) | |
| 1,288 | | |
| 138 | |
| Financing costs | |
| (87 | ) | |
| 58 | | |
| (29 | ) |
| Other revenues | |
| (3,610 | ) | |
| (190 | ) | |
| (3,800 | ) |
| Fuel gross margin | |
$ | 55,747 | | |
$ | (3,097 | ) | |
$ | 52,650 | |
| Throughput (bpd) | |
| 76,330 | | |
| 2,490 | | |
| 78,820 | |
| Fuel gross margin per barrel of
throughput | |
$ | 8.03 | | |
$ | (13.66 | ) | |
$ | 7.34 | |
| Total OPEX | |
$ | 23,299 | | |
$ | 7,076 | | |
$ | 30,375 | |
| Operating expenses per barrel of
throughput | |
$ | 3.35 | | |
$ | 31.23 | | |
$ | 4.23 | |
| Three
Months Ended March 31, 2023 |
| In thousands | |
Conventional | |
Renewable | |
Mobile
Refinery Total |
| Gross profit | |
$ | 65,470 | | |
$ | — | | |
$ | 65,470 | |
| Unrealized (gain) loss on hedging activities | |
| (570 | ) | |
| — | | |
| (570 | ) |
| Inventory valuation adjustments | |
| (1,532 | ) | |
| — | | |
| (1,532 | ) |
| Adjusted gross margin | |
$ | 63,368 | | |
$ | — | | |
$ | 63,368 | |
| Variable production costs attributable to cost of revenues | |
| 21,252 | | |
| — | | |
| 21,252 | |
| Depreciation and amortization attributable to cost of revenues | |
| 3,144 | | |
| — | | |
| 3,144 | |
| RINs | |
| 16,115 | | |
| — | | |
| 16,115 | |
| Realized loss on hedging activities | |
| (439 | ) | |
| — | | |
| (439 | ) |
| Financing costs | |
| 2,295 | | |
| — | | |
| 2,295 | |
| Other revenues | |
| (1,933 | ) | |
| — | | |
| (1,933 | ) |
| Fuel gross margin | |
$ | 103,802 | | |
$ | — | | |
$ | 103,802 | |
| Throughput (bpd) | |
| 71,328 | | |
| — | | |
| 71,328 | |
| Fuel gross margin per barrel of
throughput | |
$ | 16.17 | | |
$ | — | | |
$ | 16.17 | |
| Total OPEX | |
$ | 24,681 | | |
$ | — | | |
$ | 24,681 | |
| Operating expenses per barrel of
throughput | |
$ | 3.84 | | |
$ | — | | |
$ | 3.84 | |
| Nine
Months Ended September 30, 2023 |
| In thousands | |
Conventional | |
Renewable | |
Mobile
Refinery Total |
| Gross profit | |
$ | 158,198 | | |
$ | (21,521 | ) | |
$ | 136,677 | |
| Unrealized (gain) loss on hedging activities | |
| (4,341 | ) | |
| (709 | ) | |
| (5,050 | ) |
| Inventory valuation adjustments | |
| 7,447 | | |
| (106 | ) | |
| 7,341 | |
| Adjusted gross margin | |
$ | 161,304 | | |
$ | (22,336 | ) | |
$ | 138,968 | |
| Variable production costs attributable to cost of revenues | |
| 76,785 | | |
| 13,035 | | |
| 89,820 | |
| Depreciation and amortization attributable to cost of revenues | |
| 9,477 | | |
| 5,338 | | |
| 14,815 | |
| RINs | |
| 48,583 | | |
| — | | |
| 48,583 | |
| Realized loss on hedging activities | |
| 1,265 | | |
| 3,689 | | |
| 4,954 | |
| Financing costs | |
| 3,980 | | |
| 263 | | |
| 4,243 | |
| Other revenues | |
| (12,347 | ) | |
| (714 | ) | |
| (13,061 | ) |
| Fuel gross margin | |
$ | 289,047 | | |
$ | (725 | ) | |
$ | 288,322 | |
| Throughput (bpd) | |
| 75,976 | | |
| 3,952 | | |
| 79,928 | |
| Fuel gross margin per barrel of
throughput | |
$ | 13.94 | | |
$ | (1.00 | ) | |
$ | 13.21 | |
| Total OPEX | |
$ | 65,700 | | |
$ | 18,521 | | |
$ | 84,221 | |
| Operating expenses per barrel of
throughput | |
$ | 3.17 | | |
$ | 25.61 | | |
$ | 3.86 | |
Unaudited Reconciliation of Adjusted EBITDA to Net loss from
Continued and Discontinued Operations.
| In thousands | |
Three
Months Ended | |
Nine
Months Ended | |
Twelve
Months Ended |
| | |
September
30, 2023 | |
September
30, 2022 | |
September
30, 2023 | |
September
30, 2022 | |
September
30, 2023 | |
September
30, 2022 |
| Net income (loss) | |
$ | 19,534 | | |
$ | 22,172 | | |
$ | (8,107 | ) | |
$ | (42,421 | ) | |
$ | 36,310 | | |
$ | (47,771 | ) |
| Depreciation and amortization | |
| 8,929 | | |
| 5,623 | | |
| 22,085 | | |
| 13,157 | | |
| 27,847 | | |
| 15,088 | |
| Income tax expense (benefit) | |
| 12,231 | | |
| — | | |
| 3,754 | | |
| — | | |
| 1,265 | | |
| — | |
| Interest expense | |
| 13,523 | | |
| 13,129 | | |
| 103,536 | | |
| 65,069 | | |
| 118,493 | | |
| 67,921 | |
| EBITDA | |
$ | 54,217 | | |
$ | 40,924 | | |
$ | 121,268 | | |
$ | 35,805 | | |
$ | 183,915 | | |
$ | 35,239 | |
| Unrealized (gain) loss on hedging activities | |
| (8,348 | ) | |
| (47,756 | ) | |
| (5,233 | ) | |
| (1,123 | ) | |
| (4,256 | ) | |
| (1,375 | ) |
| Inventory valuation adjustments | |
| 9,374 | | |
| 17,972 | | |
| 7,341 | | |
| 41,152 | | |
| 16,955 | | |
| 41,152 | |
| Gain on change in value of derivative warrant liability | |
| (4,621 | ) | |
| (12,312 | ) | |
| (5,036 | ) | |
| (7,788 | ) | |
| (5,069 | ) | |
| (3,483 | ) |
| Stock-based compensation | |
| 769 | | |
| 378 | | |
| 1,502 | | |
| 951 | | |
| 2,125 | | |
| 1,201 | |
| (Gain) loss on sale of assets | |
| — | | |
| — | | |
| (70,881 | ) | |
| — | | |
| (70,558 | ) | |
| (1,041 | ) |
| Acquisition costs | |
| — | | |
| 2,889 | | |
| 4,308 | | |
| 16,526 | | |
| 4,309 | | |
| 20,092 | |
| Environmental clean-up reserve | |
| — | | |
| — | | |
| — | | |
| 1,428 | | |
| — | | |
| 1,428 | |
| Other | |
| 132 | | |
| (417 | ) | |
| (1,022 | ) | |
| (1,042 | ) | |
| (8 | ) | |
| 2,106 | |
| Adjusted
EBITDA | |
$ | 51,523 | | |
$ | 1,678 | | |
$ | 52,247 | | |
$ | 85,909 | | |
$ | 127,413 | | |
$ | 95,318 | |
| | |
Three
Months Ended September 30, 2023 |
| | |
Mobile
Refinery | |
Legacy
Refining & | |
Total
Refining & Marketing | |
Black
Oil and | |
Corporate | |
Consolidated |
| In thousands | |
Conventional | |
Renewable | |
Marketing | |
Marketing | |
Recovery | |
| |
|
| Net income (loss) | |
$ | 65,161 | | |
$ | (21,807 | ) | |
$ | (1,489 | ) | |
$ | 41,865 | | |
$ | 912 | | |
$ | (42,443 | ) | |
$ | 335 | |
| Depreciation and amortization | |
| 3,718 | | |
| 3,341 | | |
| 297 | | |
| 7,356 | | |
| 1,407 | | |
| 166 | | |
| 8,929 | |
| Income tax expense (benefit) | |
| — | | |
| — | | |
| — | | |
| — | | |
| — | | |
| 31,430 | | |
| 31,430 | |
| Interest expense | |
| 2,568 | | |
| 1,826 | | |
| — | | |
| 4,394 | | |
| 41 | | |
| 9,089 | | |
| 13,523 | |
| EBITDA | |
$ | 71,447 | | |
$ | (16,640 | ) | |
$ | (1,192 | ) | |
$ | 53,615 | | |
$ | 2,360 | | |
$ | (1,758 | ) | |
$ | 54,217 | |
| Unrealized (gain) loss on hedging activities | |
| (4,620 | ) | |
| (3,622 | ) | |
| (40 | ) | |
| (8,282 | ) | |
| (66 | ) | |
| — | | |
| (8,348 | ) |
| Inventory valuation adjustments | |
| 13,225 | | |
| (3,851 | ) | |
| — | | |
| 9,374 | | |
| — | | |
| — | | |
| 9,374 | |
| Gain on change in value of derivative warrant liability | |
| — | | |
| — | | |
| — | | |
| — | | |
| — | | |
| (4,621 | ) | |
| (4,621 | ) |
| Stock-based compensation | |
| — | | |
| — | | |
| — | | |
| — | | |
| — | | |
| 769 | | |
| 769 | |
| Other | |
| — | | |
| — | | |
| — | | |
| — | | |
| 167 | | |
| (35 | ) | |
| 132 | |
| Adjusted
EBITDA | |
$ | 80,052 | | |
$ | (24,113 | ) | |
$ | (1,232 | ) | |
$ | 54,707 | | |
$ | 2,461 | | |
$ | (5,645 | ) | |
$ | 51,523 | |
| | |
Nine
Months Ended September 30, 2023 |
| | |
Mobile
Refinery | |
Legacy
Refining & | |
Total
Refining & | |
Black
Oil and | |
Corporate | |
Consolidated |
| In thousands | |
Conventional | |
Renewable | |
Marketing | |
Marketing | |
Recovery | |
| |
|
| Net income (loss) | |
$ | 79,686 | | |
$ | (42,272 | ) | |
$ | (3,924 | ) | |
$ | 33,490 | | |
$ | 50,929 | | |
$ | (111,726 | ) | |
$ | (27,306 | ) |
| Depreciation and amortization | |
| 11,685 | | |
| 5,373 | | |
| 790 | | |
| 17,848 | | |
| 3,733 | | |
| 504 | | |
| 22,085 | |
| Income tax expense (benefit) | |
| — | | |
| — | | |
| — | | |
| — | | |
| 19,199 | | |
| 3,754 | | |
| 22,953 | |
| Interest expense | |
| 10,604 | | |
| 2,195 | | |
| — | | |
| 12,799 | | |
| 126 | | |
| 90,612 | | |
| 103,536 | |
| EBITDA | |
$ | 101,975 | | |
$ | (34,704 | ) | |
$ | (3,134 | ) | |
$ | 64,137 | | |
$ | 73,987 | | |
$ | (16,856 | ) | |
$ | 121,268 | |
| Unrealized (gain) loss on hedging activities | |
| (4,341 | ) | |
| (709 | ) | |
| (82 | ) | |
| (5,132 | ) | |
| (101 | ) | |
| — | | |
| (5,233 | ) |
| Inventory valuation adjustments | |
| 7,447 | | |
| (106 | ) | |
| — | | |
| 7,341 | | |
| — | | |
| — | | |
| 7,341 | |
| Gain on change in value of derivative warrant liability | |
| — | | |
| — | | |
| — | | |
| — | | |
| — | | |
| (5,036 | ) | |
| (5,036 | ) |
| Stock-based compensation | |
| — | | |
| — | | |
| — | | |
| — | | |
| — | | |
| 1,502 | | |
| 1,502 | |
| (Gain) loss on sale of assets | |
| — | | |
| — | | |
| — | | |
| — | | |
| (70,884 | ) | |
| 3 | | |
| (70,881 | ) |
Acquisition costs | |
| — | | |
| — | | |
| — | | |
| — | | |
| — | | |
| 4,308 | | |
| 4,308 | |
| Other | |
| — | | |
| — | | |
| — | | |
| — | | |
| (984 | ) | |
| (38 | ) | |
| (1,022 | ) |
| Adjusted
EBITDA | |
$ | 105,081 | | |
$ | (35,519 | ) | |
$ | (3,216 | ) | |
$ | 66,346 | | |
$ | 2,018 | | |
$ | (16,117 | ) | |
$ | 52,247 | |
| | |
Three
Months Ended September 30, 2022 |
| In thousands | |
Mobile
Refinery | |
Legacy
Refining & Marketing | |
Total
Refining & Marketing | |
Black
Oil | |
Corporate | |
Consolidated |
| Net income (loss) | |
$ | 18,369 | | |
$ | (2,251 | ) | |
$ | 16,118 | | |
$ | 7,638 | | |
$ | (1,585 | ) | |
$ | 22,172 | |
| Depreciation and amortization | |
| 3,693 | | |
| 268 | | |
| 3,961 | | |
| 1,431 | | |
| 231 | | |
| 5,623 | |
| Interest expense | |
| 3,536 | | |
| — | | |
| 3,536 | | |
| (2 | ) | |
| 9,595 | | |
| 13,129 | |
| EBITDA | |
$ | 25,599 | | |
$ | (1,983 | ) | |
$ | 23,616 | | |
$ | 9,067 | | |
$ | 8,241 | | |
$ | 40,924 | |
| Unrealized (gain) loss on hedging activities | |
| (46,977 | ) | |
| (775 | ) | |
| (47,752 | ) | |
| (4 | ) | |
| — | | |
| (47,756 | ) |
| Inventory valuation adjustments | |
| 17,972 | | |
| — | | |
| 17,972 | | |
| — | | |
| — | | |
| 17,972 | |
| Gain on change in value of derivative warrant liability | |
| — | | |
| — | | |
| — | | |
| — | | |
| (12,312 | ) | |
| (12,312 | ) |
| Stock-based compensation | |
| — | | |
| — | | |
| — | | |
| — | | |
| 378 | | |
| 378 | |
| Acquisition costs | |
| 2,889 | | |
| — | | |
| 2,889 | | |
| — | | |
| — | | |
| 2,889 | |
| Other | |
| — | | |
| — | | |
| — | | |
| (417 | ) | |
| — | | |
| (417 | ) |
| Adjusted
EBITDA | |
$ | (517 | ) | |
$ | (2,758 | ) | |
$ | (3,275 | ) | |
$ | 8,646 | | |
$ | (3,693 | ) | |
$ | 1,678 | |
| | |
Nine
Months Ended September 30, 2022 |
| In thousands | |
Mobile
Refinery | |
Legacy
Refining & Marketing | |
Total
Refining & Marketing | |
Black
Oil | |
Corporate | |
Consolidated |
| Net income (loss) | |
$ | (5,593 | ) | |
$ | (2,147 | ) | |
$ | (7,740 | ) | |
$ | 40,399 | | |
$ | (75,080 | ) | |
$ | (42,421 | ) |
| Depreciation and amortization | |
| 7,416 | | |
| 707 | | |
| 8,123 | | |
| 4,305 | | |
| 729 | | |
| 13,157 | |
| Interest
expense | |
| 6,768 | | |
| — | | |
| 6,768 | | |
| 4 | | |
| 58,297 | | |
| 65,069 | |
| EBITDA | |
$ | 8,591 | | |
$ | (1,440 | ) | |
$ | 7,151 | | |
$ | 44,708 | | |
$ | (16,054 | ) | |
$ | 35,805 | |
| Unrealized gain on hedging activities | |
| (76 | ) | |
| (68 | ) | |
| (144 | ) | |
| (979 | ) | |
| — | | |
| (1,123 | ) |
| Inventory valuation adjustments | |
| 41,152 | | |
| — | | |
| 41,152 | | |
| — | | |
| — | | |
| 41,152 | |
| Gain on change in value of derivative warrant liability | |
| — | | |
| — | | |
| — | | |
| — | | |
| (7,788 | ) | |
| (7,788 | ) |
| Stock-based compensation | |
| — | | |
| — | | |
| — | | |
| — | | |
| 951 | | |
| 951 | |
| Acquisition costs | |
| 11,967 | | |
| — | | |
| 11,967 | | |
| — | | |
| 4,559 | | |
| 16,526 | |
| Environmental clean-up reserve | |
| 1,428 | | |
| — | | |
| 1,428 | | |
| — | | |
| — | | |
| 1,428 | |
| Other | |
| — | | |
| — | | |
| — | | |
| (1,042 | ) | |
| — | | |
| (1,042 | ) |
| Adjusted
EBITDA | |
$ | 63,062 | | |
$ | (1,508 | ) | |
$ | 61,554 | | |
$ | 42,687 | | |
$ | (18,332 | ) | |
$ | 85,909 | |
Unaudited Reconciliation of Long-Term Debt to Net Long-Term Debt
and Net Leverage
| In thousands | |
As of |
| | |
September
30, 2023 | |
September
30, 2022 | |
December
31, 2022 |
| Long-Term Debt: | |
| | | |
| | | |
| | |
| Senior Convertible
Note | |
$ | 15,230 | | |
$ | 95,178 | | |
$ | 95,178 | |
| Term Loan 2025 | |
| 148,013 | | |
| 165,000 | | |
| 165,000 | |
| Finance lease liability long-term | |
| 66,751 | | |
| 44,339 | | |
| 45,164 | |
| Finance lease liability short-term | |
| 2,297 | | |
| 1,155 | | |
| 1,363 | |
| Insurance
premiums financed | |
| 10,071 | | |
| 10,449 | | |
| 5,602 | |
| Long-Term
Debt and Lease Obligations | |
$ | 242,362 | | |
$ | 316,121 | | |
$ | 312,307 | |
| Unamortized
discount and deferred financing costs | |
| (29,983 | ) | |
| (86,384 | ) | |
| (81,918 | ) |
| Long-Term
Debt and Lease Obligations per Balance Sheet | |
$ | 212,379 | | |
$ | 229,737 | | |
$ | 230,389 | |
| Cash and Cash Equivalents | |
| (75,705 | ) | |
| (117,464 | ) | |
| (141,258 | ) |
| Restricted
Cash | |
| (3,605 | ) | |
| (4,929 | ) | |
| (4,929 | ) |
| Total Cash
and Cash Equivalents | |
$ | (79,310 | ) | |
$ | (122,393 | ) | |
$ | (146,187 | ) |
| Net Long-Term
Debt | |
$ | 163,052 | | |
$ | 193,728 | | |
$ | 166,120 | |
| Adjusted
EBITDA | |
$ | 127,413 | | |
$ | 95,318 | | |
$ | 161,000 | |
| Net Leverage | |
| 1.3 | x | |
| 2.0 | x | |
| 1.0 | x |
Vertex Energy, Inc. 8-K
Exhibit 99.2

Third Quarter 2023 Quarterly Results Summary Presentation November 2023

DISCLAIMER Forward - looking statements 2 Forward - Looking Statements Certain of the matters discussed in this presentation which are not statements of historical fact constitute forward - looking sta tements within the meaning of the securities laws, including the Private Securities Litigation Reform Act of 1995, that invol ve a number of risks and uncertainties. Words such as “strategy,” “expects,” “continues,” “plans,” “anticipates,” “believes,” “would,” “will,” “estimates,” “intends,” “projects,” “goals,” “targets” and oth er words of similar meaning are intended to identify forward - looking statements but are not the exclusive means of identifying t hese statements. Any statements made in this presentation other than those of historical fact, about an action, event or development, are forward - looking statements. The important factors that may cause act ual results and outcomes to differ materially from those contained in such forward - looking statements include, without limitatio n; statements concerning: the Company’s engagement of BofA Securities, Inc., as previously disclosed; the review and evaluation of potential joint ventures, divestitures, acquisitions, me rgers, business combinations, or other strategic transactions and their impact on shareholder value; the process by which the Co mpany engages in evaluation of strategic transactions; the Company’s ability to identify potential partners; the outcome of potential future strategic transactions and the terms thereof; the fut ure production of the Company’s Mobile, Alabama Refinery (the “Mobile Refinery”); anticipated and unforeseen events which could r ed uce future production at the refinery or delay future capital projects, and changes in commodity and credits values; throughput volumes, production rates, yields, operating expenses and capital expendi tur es at the Mobile Refinery; the timing of, and outcome of, the evaluation and associated carbon intensity scoring of the Compa ny’ s feedstock blends by officials in the state of California; the ability of the Company to obtain low carbon fuel standard (LCFS) credits, and the amounts thereof; the need for additional capital in th e future, including, but not limited to, in order to complete future capital projects and satisfy liabilities, the Company’s abi lity to raise such capital in the future, and the terms of such funding; the timing of capital projects at the Company’s Mobile Refinery and the outcome of such projects; the future production of the Mo bil e Refinery, including but not limited to, renewable diesel production; estimated and actual production and costs associated w ith the renewable diesel capital project; estimated revenues, margins and expenses, over the course of the agreement with Idemitsu Kosan (“ Idemitsu ”); anticipated and unforeseen events which could reduce future production at the Mobile Refinery or delay planned and future ca pital projects; changes in commodity and credits values; certain early termination rights associated with third party agreements and conditions precedent to such agreements; certain mandatory redemption provisions of the outstanding senior con ver tible notes, the conversion rights associated therewith, and dilution caused by conversions and/or the exchanges of convertib le notes; the Company’s ability to comply with required covenants under outstanding senior notes and a term loan and pay amounts due under such senior notes and term loan, including interest and other amounts due thereunder; the ability of the Company to retain and hire key personnel; the level of competition in the Co mp any’s industry and its ability to compete; the Company’s ability to respond to changes in its industry; the loss of key personnel or failure to attract, integrate and retain additional personne l; the Company’s ability to protect intellectual property and not infringe on others’ intellectual property; the Company’s abili ty to scale its business; the Company’s ability to maintain supplier relationships and obtain adequate supplies of feedstocks; the Company’s ability to obtain and retain customers; the Company’s ability to pr odu ce products at competitive rates; the Company’s ability to execute its business strategy in a very competitive environment; t ren ds in, and the market for, the price of oil and gas and alternative energy sources; the impact of inflation on margins and costs; the volatile nature of the prices for oil and gas caused by sup ply and demand, including volatility caused by the ongoing Ukraine/Russia conflict and/or the Israel/Hamas conflict, increased in te rest rates, recessions and inflation; the Company’s ability to maintain relationships with partners; the outcome of pending and potential future litigation, judgments and settlements; rules and reg ula tions making the Company’s operations more costly or restrictive; volatility in the market price of compliance credits (prima ril y Renewable Identification Numbers (RINs) needed to comply with the Renewable Fuel Standard (“RFS”)) under renewable and low - carbon fuel programs and emission credits needed under other environmen tal emissions programs, the requirement for the Company to purchase RINs in the secondary market to the extent it does not ge ner ate sufficient RINs internally, liabilities associated therewith and the timing, funding and costs of such required purchases, if any; changes in environmental and other laws and r egu lations and risks associated with such laws and regulations; economic downturns both in the United States and globally, chang es in inflation and interest rates, increased costs of borrowing associated therewith and potential declines in the availability of such funding; risk of increased regulation of the Company’ s o perations and products; disruptions in the infrastructure that the Company and its partners rely on; interruptions at the Com pan y’s facilities; unexpected and expected changes in the Company’s anticipated capital expenditures resulting from unforeseen and expected required maintenance, repairs, or upgrades; the Compa ny’ s ability to acquire and construct new facilities; the Company’s ability to effectively manage growth; decreases in global de man d for, and the price of, oil, due to inflation, recessions or other reasons, including declines in economic activity or global conflicts; expected and unexpected downtime at the Company’s facil iti es; the Company’s level of indebtedness, which could affect its ability to fulfill its obligations, impede the implementation of its strategy, and expose the Company’s interest rate risk; dependence on third party transportation services and pipelines; risks related to obtaining required crude oil supplies, and the costs of s uch supplies; counterparty credit and performance risk; unanticipated problems at, or downtime effecting, the Company’s facilitie s and those operated by third parties; risks relating to the Company’s hedging activities or lack of hedging activities; and risks relating to planned and future divestitures, asset sales, joint v ent ures and acquisitions. Other important factors that may cause actual results and outcomes to differ materially from those contained in the forward - look ing statements included in this communication are described in the Company’s publicly filed reports, including, but not limit ed to, the Company’s Annual Report on Form 10 - K for the year ended December 31, 2022, and the Company’s Quarterly Report on Form 10 - Q for the quarter ended September 30, 2023, and future Annual R eports on Form 10 - K and Quarterly Reports on Form 10 - Q. These reports are available at www.sec.gov. The Company cautions that th e foregoing list of important factors is not complete. All subsequent written and oral forward - looking statements attributable to the Company or any person acting on behalf of the Com pany are expressly qualified in their entirety by the cautionary statements referenced above. Other unknown or unpredictable fac tors also could have material adverse effects on Vertex’s future results. The forward - looking statements included in this presentation are made only as of the date hereof. Vertex cannot guarant ee future results, levels of activity, performance or achievements. Accordingly, you should not place undue reliance on these fo rward - looking statements. Finally, Vertex undertakes no obligation to update these statements after the date of this presentation, except as required by law, and takes no obligation to update or cor rect information prepared by third parties that are not paid for by Vertex. If we update one or more forward - looking statements, no inference should be drawn that we will make additional updates with respect to those or other forward - looking statements. Date of Information in Presentation All information in this presentation is as of November 7, 2023 (unless otherwise stated). The Company undertakes no duty to u pd ate any forward - looking statement to conform the statement to actual results or changes in the Company’s expectations. Industry Information In this presentation, we may rely on and refer to information regarding the refining, re - refining, used oil and oil and gas ind ustries in general from market research reports, analyst reports and other publicly available information. Although we believ e t hat this information is reliable, we have not commissioned any of such information, we cannot guarantee the accuracy and completeness of this information, and we have not independently verified an y o f it. Projections The financial projections (the “Projections”) included herein were prepared by Vertex in good faith using assumptions believe d t o be reasonable. A significant number of assumptions about the operations of the business of Vertex were based, in part, on e con omic, competitive, and general business conditions prevailing at the time the Projections were developed. Any future changes in these conditions, may materially impact the ability of Vertex to achieve the financial results set forth in the Projections. The Projections are based on numerous assumptions, including real iza tion of the operating strategy of Vertex; industry performance; no material adverse changes in applicable legislation or regulations, or the administration thereof, or generally accepted accou nti ng principles; general business and economic conditions; competition; retention of key management and other key employees; ab sen ce of material contingent or unliquidated litigation, indemnity, or other claims; minimal changes in current pricing; static material and equipment pricing; no significant increases in interest ra tes or inflation; and other matters, many of which will be beyond the control of Vertex, and some or all of which may not mat eri alize . The Projections also assume the continued uptime of the Company’s facilities at historical levels and the successful funding of, timely completion of, and successful outcome of, pla nne d capital projects. Additionally, to the extent that the assumptions inherent in the Projections are based upon future busine ss decisions and objectives, they are subject to change. Although the Projections are presented with numerical specificity and are based on reasonable expectations developed by Vertex’s managemen t, the assumptions and estimates underlying the Projections are subject to significant business, economic, and competitive uncer tai nties and contingencies, many of which will be beyond the control of Vertex. Accordingly, the Projections are only estimates and are necessarily speculative in nature. It is expected tha t some or all of the assumptions in the Projections will not be realized and that actual results will vary from the Projectio ns. Such variations may be material and may increase over time. In light of the foregoing, readers are cautioned not to place undue reliance on the Projections. The projected financial information containe d h erein should not be regarded as a representation or warranty by Vertex, its management, advisors, or any other person that th e P rojections can or will be achieved. Vertex cautions that the Projections are speculative in nature and based upon subjective decisions and assumptions. As a result, the Projections shoul d n ot be relied on as necessarily predictive of actual future events.

DISCLAIMER Non - GAAP Financial Measures 3 Non - GAAP Financial Measures and Key Performance Measures In addition to our results calculated under generally accepted accounting principles in the United States (“ GAAP ”), in this presentation we also present certain non - U.S. GAAP financial measures and key performance indicators. Non - U.S. GAAP financial measures include Adjusted EBITDA, Net Long - Term Debt and Net Leverage for the Company (collectively, the “ Non - U.S. GAAP Financial Measures ”). Key performance indicators include Fuel Gross Margin, Fuel Gross Margin Per Barrel, Operating Expenses Per Barrel of Thro ugh put, Renewable Gross Margin and Renewable Gross Margin Per Barrel (collectively, the “ KPIs ”). EBITDA represents net income before interest, taxes, depreciation and amortization, for continued and discontinued operat ion s. Adjusted EBITDA represents net income (loss) from operations plus unrealized gain or losses on hedging activities, Renewable Fuel Standard (RFS) costs (mainly related to Renewable Identification Numbers (RINs), an d inventory adjustments, depreciation and amortization, acquisition costs, gain on change in value of derivative warrant liab ili ty, environmental clean - up, stock - based compensation, (gain) loss on sale of assets, interest expense, and certain other unusual or non - recurring charges in cluded in selling, general, and administrative expenses. Net Long - Term Debt is long - term debt and lease obligations, adjusted f or unamortized discount and deferred financing costs, insurance premiums financed, less cash and cash equivalents and restricted cash. Net Leverage i s d efined as Long - Term Debt divided by Adjusted EBITDA. Fuel Gross Margin is defined as gross profit (loss) plus unrealized gain or losses on hedging activities and inventory valuation adjustments, plus production costs, operating expenses and depreciation attributable to co st of revenues and other non - fuel items included in costs of revenues including realized and unrealized gain or losses on hedging a ctivities, RFS costs (mainly related to RINs), inventory valuation adjustments, fuel financing costs and other revenues and cost of sales items. Fuel Gros s M argin Per Barrel of Throughput is calculated as fuel gross margin divided by total throughput barrels for the period presente d. Operating Expenses Per Barrel of Throughput is defined as total operating expenses divided by total barrels of throughput. Renewable Fuel Gross Marg in is defined as gross profit (loss) plus unrealized gain or losses on hedging activities and inventory valuation adjustments, p lus production costs, operating expenses and depreciation attributable to cost of revenues and other non - fuel items included in costs of revenues including real ized and unrealized gain or losses on hedging activities, inventory valuation adjustments, fuel financing costs and other rev enu es and cost of sales items. Renewable Fuel Gross Margin Per Barrel is Renewable Gross Margin divided by total renewable throughput barrels for the period pr esented. The (a) Non - U.S. GAAP Financial Measures, which are “ non - U.S. GAAP financial measures ”, and (b) the KPIs, are presented as supplemental measures of the Company’s performance. They are not presented in accordanc e w ith U.S. GAAP. We use the Non - U.S. GAAP Financial Measures and KPIs as supplements to U.S. GAAP measures of performance to evaluate the effectiveness of our business strategie s, to make budgeting decisions, to allocate resources and to compare our performance relative to our peers. Additionally, these me asures, when used in conjunction with related U.S. GAAP financial measures, provide investors with an additional financial analytical framework wh ich management uses, in addition to historical operating results, as the basis for financial, operational and planning decisi ons and present measurements that third parties have indicated are useful in assessing the Company and its results of operations. The Non - U.S. GAAP Financia l Measures and KPIs are presented because we believe they provide additional useful information to investors due to the vario us noncash items during the period. Non - U.S. GAAP financial information and KPIs similar to the Non - U.S. GAAP Financial Measures and KPIs are also frequ ently used by analysts, investors and other interested parties to evaluate companies in our industry. The Non - U.S. GAAP Financia l Measures and KPIs are unaudited, and have limitations as analytical tools, and you should not consider them in isolation, or as a substitu te for analysis of our operating results as reported under U.S. GAAP. Some of these limitations are: the Non - U.S. GAAP Financial Me asures and KPIs do not reflect cash expenditures, or future requirements for capital expenditures, or contractual commitments; the Non - GAAP Financial M easures and KPIs do not reflect changes in, or cash requirements for, working capital needs; the Non - GAAP Financial Measures and KPIs do not reflect the significant interest expense, or the cash requirements necessary to service interest or principal payments, on debt or ca sh income tax payments; although depreciation and amortization are noncash charges, the assets being depreciated and amortized w ill often have to be replaced in the future, the Non - U.S. GAAP Financial Measures and KPIs do not reflect any cash requirements for such replacements ; the Non - U.S. GAAP Financial Measures and KPIs represent only a portion of our total operating results; and other companies in this industry may calculate the Non - U.S. GAAP Financial Measures and KPIs differently than we do, limiting their usefulness as a comparative measu re. You should not consider the Non - U.S. GAAP Financial Measures and KPIs in isolation, or as substitutes for analysis of the Co mpany’s results as reported under U.S. GAAP. The Company’s presentation of these measures should not be construed as an inference that future re sul ts will be unaffected by unusual or nonrecurring items. We compensate for these limitations by providing a reconciliation of eac h of these non - U.S. GAAP Financial Measures and KPIs to the most comparable U.S. GAAP measure below. We encourage investors and others to review our business, results of operations, and financial information in their entirety, not to rely on any single financial measure, an d to view these non - U.S. GAAP Financial Measures and KPIs in conjunction with the most directly comparable U.S. GAAP financial measure. We compensate for these limitations by providing a reconciliation of each of the non - GAAP Financial Measures to the most compara ble GAAP measure and reconciliation of the KPIs, below. We encourage investors and others to review our business, results of ope rations, and financial information in their entirety, not to rely on any single financial measure, and to view the non - GAAP Financial Measure s in conjunction with the most directly comparable GAAP financial measure. For more information on these non - GAAP financial meas ures and KPIs, please see the sections titled “Unaudited Reconciliation of Gross Profit (Loss) From Continued and Discontinued Operations to Adjust ed Gross Margin, Fuel Gross Margin, Fuel Gross Margin Per Barrel of Throughput and Operating Expenses Per Barrel of Throughput”, “U naudited Reconciliation of Adjusted EBITDA to Net loss from Continued and Discontinued Operations”, and “Unaudited Reconciliation of L ong - Term Debt to Net Long - Term Debt and Net Leverage”, at the end of this release. Management should confirm this information and the breakdown between non - GAAP and KPIs Long - Term Debt as well? Is that a Non - GAAP item? Additional tables should be included to reconcile the other non - GAAP and KPI numbers above.

THIRD QUARTER 2023 Performance Summary

3Q23 Performance Indicators COMPANY PERFORMANCE SUMMARY Third Quarter 2023 5 1. A full - reconciliation of GAAP to Non - GAAP metrics is provided in the appendix of this presentation 2. Net debt defined as total long - term debt outstanding less cash and equivalents 3. Net leverage defined as net debt (cash) divided by trailing twelve - month adjusted EBITDA * Total cash & equivalents, Net long - term debt, and net leverage stated as of 9/30/2023 & 9/30/2022, respectively Key Performance Indicators ($/MM) Key Takeaways 3Q23 Performance Summary • Reported net income (GAAP) of $19.8 million and Adjusted EBITDA of $51.5 million in 3Q23, versus net income of $22.2 million and Adjusted EBITDA of $1.6 million in 2Q22. Reported financial results include an inventory valuation adjustment of $9.4 million. • Strong conventional throughput volumes of 80,171 barrels per day (bpd) exceed prior outlook and reflect continued smooth operations at Mobile Refinery (107 % utilization) during 3Q23. • Renewable Diesel (RD) facility throughput of 5,397 barrels per day (bpd) • Phase one capacity utilization of 67.5% • Volumes optimized for consideration of • prevailing economic market conditions • Current commercial obligations • Catalyst life preservation • Feedstock diet optimization process • Ended 3Q23 with total net long - term debt of $163 million including cash and equivalents of $79.3 million, implying a leverage position of approximately 1.3x trailing - twelve - month (“TTM”) Adjusted EBITDA. % Y / Y 3Q22 3Q23 34% $63.3 $85.0 Total Gross Profit (11%) 22.2 19.8 GAAP Net Income 3,119% 1.6 51.5 Adjusted EBITDA 1 (35%) 122.4 79.3 Total Cash & Equivalents (16%) 193.7 163.0 Net Long - Term Debt 2 (35%) 2.0x 1.3x Net Leverage 3
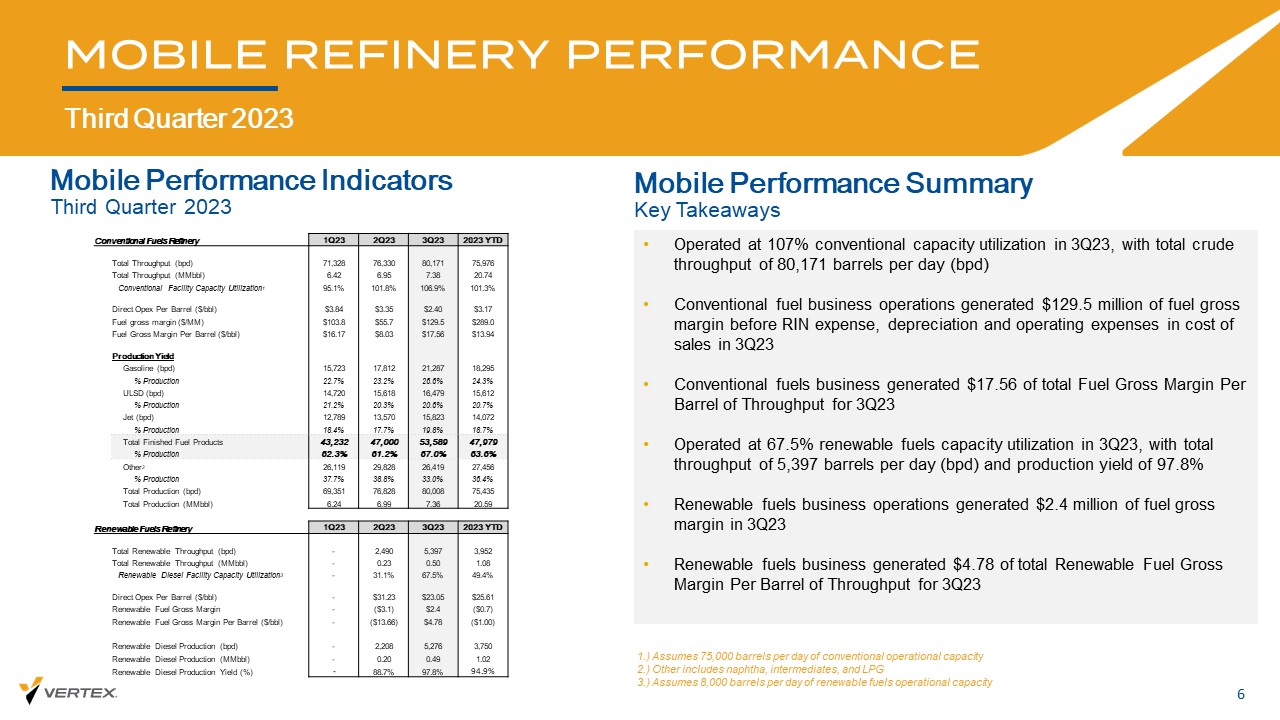
Mobile Performance Indicators MOBILE REFINERY PERFORMANCE Third Quarter 2023 6 • Operated at 107% conventional capacity utilization in 3Q23, with total crude throughput of 80,171 barrels per day (bpd) • Conventional fuel business operations generated $129.5 million of fuel gross margin before RIN expense, depreciation and operating expenses in cost of sales in 3Q23 • Conventional fuels business generated $17.56 of total Fuel Gross Margin Per Barrel of Throughput for 3Q23 • Operated at 67.5% renewable fuels capacity utilization in 3Q23, with total throughput of 5,397 barrels per day (bpd) and production yield of 97.8% • Renewable fuels business operations generated $2.4 million of fuel gross margin in 3Q23 • Renewable fuels business generated $4.78 of total Renewable Fuel Gross Margin Per Barrel of Throughput for 3Q23 1.) Assumes 75,000 barrels per day of conventional operational capacity 2.) Other includes naphtha, intermediates, and LPG 3.) Assumes 8,000 barrels per day of renewable fuels operational capacity Third Quarter 2023 Mobile Performance Summary Key Takeaways 2023 YTD 3Q23 2Q23 1Q23 Conventional Fuels Refinery 75,976 80,171 76,330 71,328 Total Throughput (bpd) 20.74 7.38 6.95 6.42 Total Throughput (MMbbl) 101.3% 106.9% 101.8% 95.1% Conventional Facility Capacity Utilization 1 $3.17 $2.40 $3.35 $3.84 Direct Opex Per Barrel ($/bbl) $289.0 $129.5 $55.7 $103.8 Fuel gross margin ($/MM) $13.94 $17.56 $8.03 $16.17 Fuel Gross Margin Per Barrel ($/bbl) Production Yield 18,295 21,287 17,812 15,723 Gasoline (bpd) 24.3% 26.6% 23.2% 22.7% % Production 15,612 16,479 15,618 14,720 ULSD (bpd) 20.7% 20.6% 20.3% 21.2% % Production 14,072 15,823 13,570 12,789 Jet (bpd) 18.7% 19.8% 17.7% 18.4% % Production 47,979 53,589 47,000 43,232 Total Finished Fuel Products 63.6% 67.0% 61.2% 62.3% % Production 27,456 26,419 29,828 26,119 Other 2 36.4% 33.0% 38.8% 37.7% % Production 75,435 80,008 76,828 69,351 Total Production (bpd) 20.59 7.36 6.99 6.24 Total Production (MMbbl) 2023 YTD 3Q23 2Q23 1Q23 Renewable Fuels Refinery 3,952 5,397 2,490 - Total Renewable Throughput (bpd) 1.08 0.50 0.23 - Total Renewable Throughput (MMbbl) 49.4% 67.5% 31.1% - Renewable Diesel Facility Capacity Utilization 3 $25.61 $23.05 $31.23 - Direct Opex Per Barrel ($/bbl) ($0.7) $2.4 ($3.1) - Renewable Fuel Gross Margin ($1.00) $4.78 ($13.66) - Renewable Fuel Gross Margin Per Barrel ($/bbl) 3,750 5,276 2,208 - Renewable Diesel Production (bpd) 1.02 0.49 0.20 - Renewable Diesel Production (MMbbl) 94.9% 97.8% 88.7% - Renewable Diesel Production Yield (%)

RENEWABLE DIESEL UPDATE 7 Proven Production with Continued Feedstock Diversification Progress • Soybean Oil, Tallow, DCO 1 , and Canola completed • Sampling and Testing underway for UCO 2 Proven Feedstocks • Renewable Diesel Fuel Primary Products • Phase I Capex: $110 - 115 million ( completed ) Project Budget • Initial commercial sales transactions of RD announced on June 26 th , 2023 Output Timeline • ~8 Mbbl /d – Phase I • ~14 Mbbl /d – Phase II (Hydrogen supply installed) Projected Renewable Capacity • Idemitsu Apollo (5 - year) Supply Agreements • California market Offtake Markets PROJECT SUMMARY SPECS Pathway Updates • Phase I operational capacity validated at 8,000 bpd • Current throughput levels optimized for current economics and feedstock blending required for LCFS proprietary carbon intensity approval process for Soy, DCO, Canola and Tallow • Temporary LCFS 3 filings completed, LCFS credits to be received for all RD production in 3 rd & 4 th quarter • Default CI scores applied to production until provisional feedstock pathway approvals are secured which will be based on actual carbon intensity scores specific to Vertex production • LCFS credits to contribute to 4 th quarter financial performance • Feedstock optimization strategy progressing ahead of schedule • Additional suppliers approved and providing new commercial quantities of Soy, DCO, Canola and Tallow • Initial suppliers have provided samples of UCO for testing and qualification process which is now underway and being advanced by several months 1.) DCO – “Distillers Corn Oil” 2.) UCO – “Used Cooking Oil” 3.) LCFS – “Low Carbon Fuel Standard” 4.) RBD – “refined, bleached, deodorized”

5 6 7 8 9 10 11 Jan Feb Mar Apr May Jun Jul Aug Sep Oct Nov Dec '17-'22 '17-'22 Average 2022 2023 DOMESTIC FUELS DEMAND Conventional Refined Fuels Demand Remains Strong 8 US Gasoline Demand ( MMbpd ) US Distillate Demand ( MMbpd ) 3 4 5 6 Jan Feb Mar Apr May Jun Jul Aug Sep Oct Nov Dec '17-'22 '17-'22 Average 2022 2023 Source: Bloomberg; data as of 10/26/2023

DOMESTIC FUELS INVENTORIES REMAIN TIGHT Distillate Inventory Levels Remain Below 5 - Year Average, Gasoline Inventory Levels Building US Gasoline Inventories 9 ( MMbbl ) US Distillate Inventories ( MMbbl ) Source: Bloomberg; data as of 10/26/2023 80 100 120 140 160 180 200 Jan Feb Mar Apr May Jun Jul Aug Sep Oct Nov Dec '17-'22 '17-'22 Average 2022 2023 200 210 220 230 240 250 260 270 280 Jan Feb Mar Apr May Jun Jul Aug Sep Oct Nov Dec '17-'22 '17-'22 Average 2022 2023

DOMESTIC FUELS PRODUCTION LEVELS Production Levels In - Line With Historical Averages US Conventional Gasoline Production 10 ( MMbpd ) US Distillate Production ( MMbpd ) Source: Bloomberg; data as of 10/26/2023 2.5 3.0 3.5 4.0 4.5 5.0 5.5 6.0 6.5 Jan Feb Mar Apr May Jun Jul Aug Sep Oct Nov Dec '17-'22 '17-'22 Average 2022 2023 5.0 6.0 7.0 8.0 9.0 10.0 11.0 12.0 Jan Feb Mar Apr May Jun Jul Aug Sep Oct Nov Dec '17-'22 '17-'22 Average 2022 2023

$1.50 $1.75 $2.00 $2.25 $2.50 $2.75 $3.00 $/Gal COMMODITIES FUTURES MARKETS Gasoline & Diesel Futures Pricing Reflects More Normalized Margin Environment In 2024 11 Gasoline Monthly Futures Price ($/Gal) ULSD Monthly Futures Price ($/Gal) $2.00 $2.20 $2.40 $2.60 $2.80 $3.00 $/Gal FY 2024 4Q24 3Q24 2Q24 1Q24 FY 2023 4Q23 3Q23 2Q23 1Q23 $2.34 $2.17 $2.41 $2.48 $2.28 $2.52 $2.41 $2.69 $2.61 $2.37 Gasoline ($/gal) $2.66 $2.60 $2.62 $2.66 $2.76 $2.86 $2.62 $3.00 $2.65 $3.17 ULSD ($/gal) $80.11 $77.68 $79.13 $80.91 $82.77 $78.86 $79.12 $82.03 $76.22 $78.00 WTI Crude ($/Bbl) Source: Bloomberg; data as of 10/26/2023
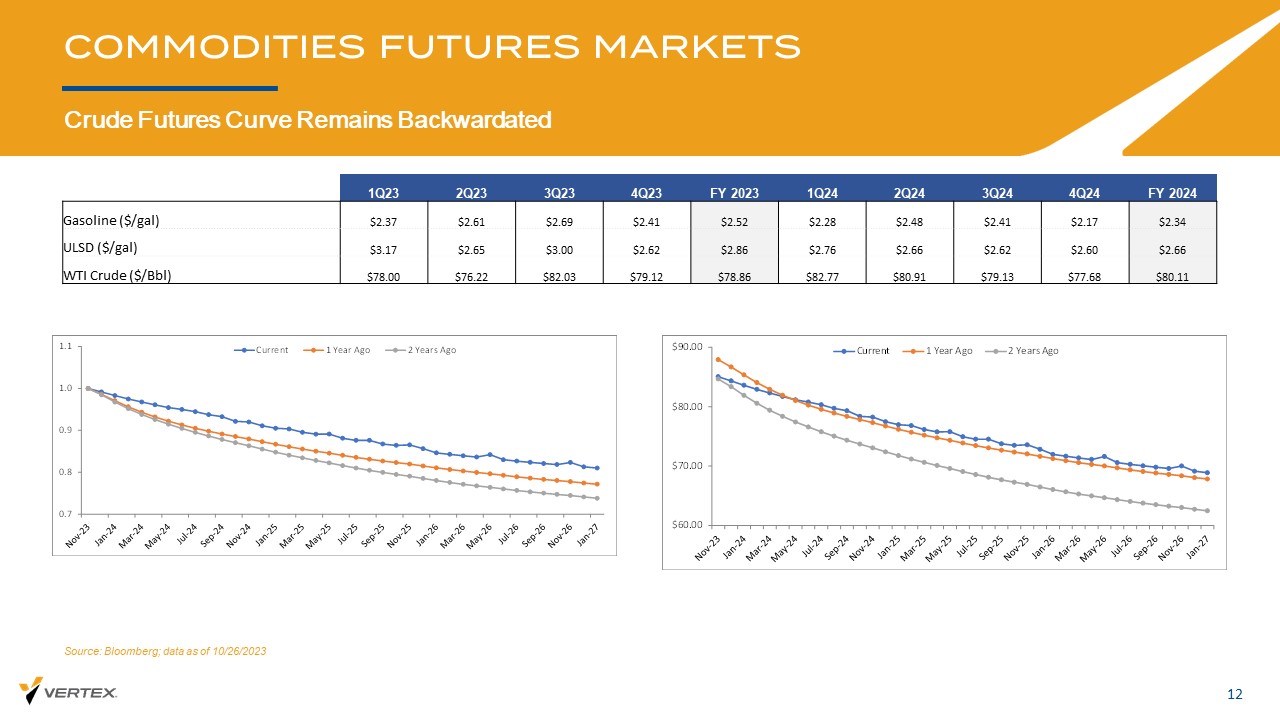
Crude Futures Curve Remains Backwardated 12 COMMODITIES FUTURES MARKETS FY 2024 4Q24 3Q24 2Q24 1Q24 FY 2023 4Q23 3Q23 2Q23 1Q23 $2.34 $2.17 $2.41 $2.48 $2.28 $2.52 $2.41 $2.69 $2.61 $2.37 Gasoline ($/gal) $2.66 $2.60 $2.62 $2.66 $2.76 $2.86 $2.62 $3.00 $2.65 $3.17 ULSD ($/gal) $80.11 $77.68 $79.13 $80.91 $82.77 $78.86 $79.12 $82.03 $76.22 $78.00 WTI Crude ($/Bbl) 0.7 0.8 0.9 1.0 1.1 Current 1 Year Ago 2 Years Ago $60.00 $70.00 $80.00 $90.00 Current 1 Year Ago 2 Years Ago Source: Bloomberg; data as of 10/26/2023
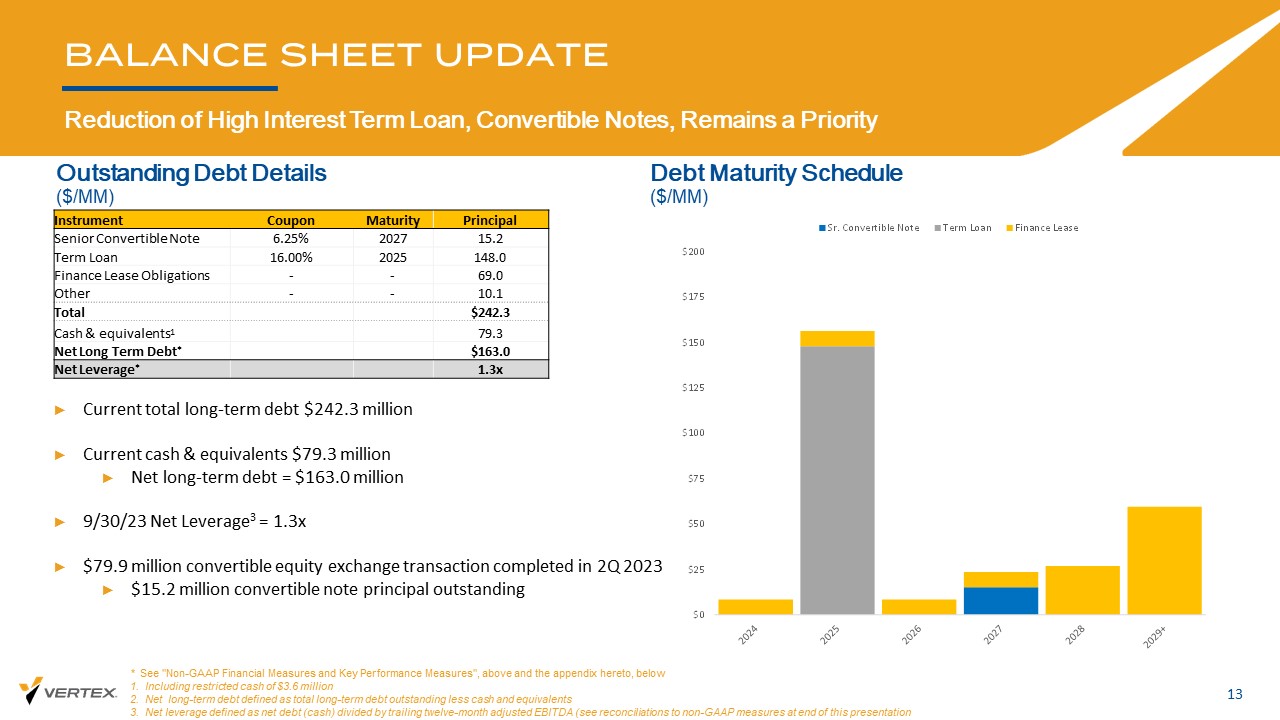
BALANCE SHEET UPDATE Reduction of High Interest Term Loan, Convertible Notes, Remains a Priority 13 Outstanding Debt Details ($/MM) Debt Maturity Schedule ($/MM) ► Current total long - term debt $242.3 million ► Current cash & equivalents $79.3 million ► Net long - term debt = $163.0 million ► 9/30/23 Net Leverage 3 = 1.3x ► $79.9 million convertible equity exchange transaction completed in 2Q 2023 ► $15.2 million convertible note principal outstanding * See "Non - GAAP Financial Measures and Key Performance Measures", above and the appendix hereto, below 1. Including restricted cash of $3.6 million 2. Net long - term debt defined as total long - term debt outstanding less cash and equivalents 3. Net leverage defined as net debt (cash) divided by trailing twelve - month adjusted EBITDA (see reconciliations to non - GAAP me asures at end of this presentation Principal Maturity Coupon Instrument 15.2 2027 6.25% Senior Convertible Note 148.0 2025 16.00% Term Loan 69.0 - - Finance Lease Obligations 10.1 - - Other $242.3 Total 79.3 Cash & equivalents 1 $163.0 Net Long Term Debt * 1.3x Net Leverage * $0 $25 $50 $75 $100 $125 $150 $175 $200 Sr. Convertible Note Term Loan Finance Lease
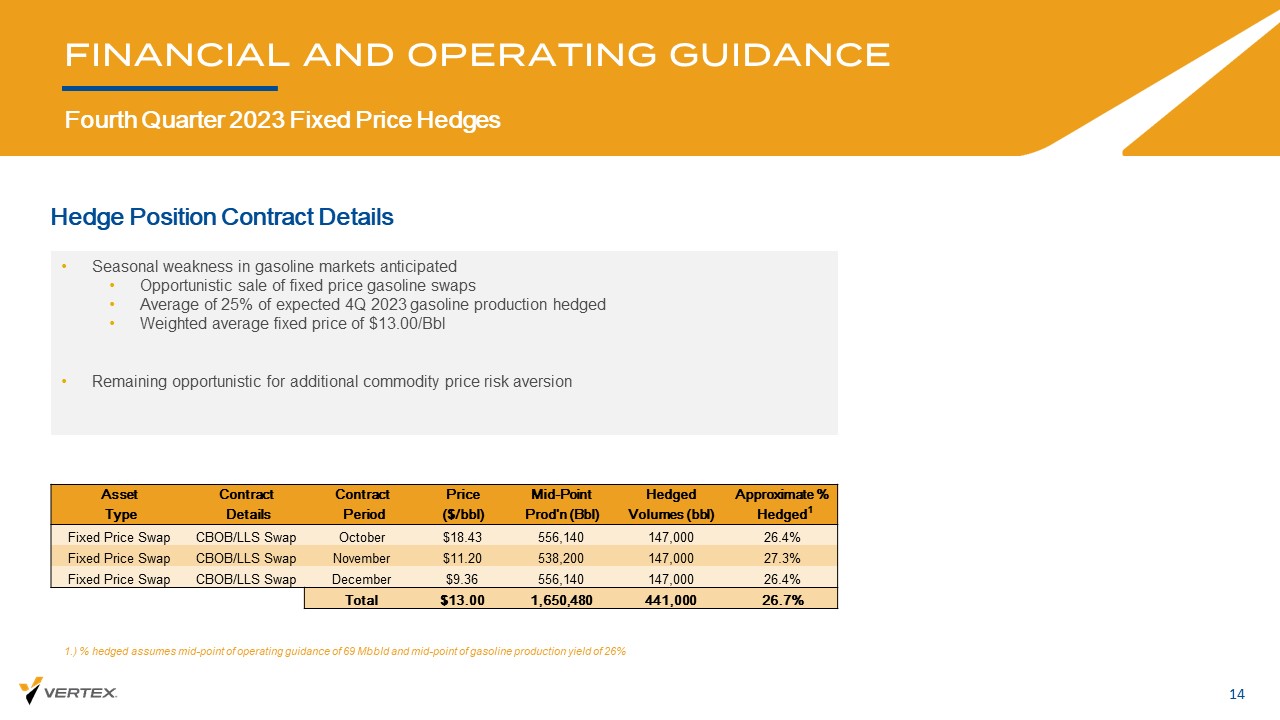
Hedge Position Contract Details FINANCIAL AND OPERATING GUIDANCE Fourth Quarter 2023 Fixed Price Hedges 14 • Seasonal weakness in gasoline markets anticipated • Opportunistic sale of fixed price gasoline swaps • Average of 25% of expected 4Q 2023 gasoline production hedged • Weighted average fixed price of $13.00/ Bbl • Remaining opportunistic for additional commodity price risk aversion 1.) % hedged assumes mid - point of operating guidance of 69 Mbbld and mid - point of gasoline production yield of 26% Approximate % Hedged Mid - Point Price Contract Contract Asset Hedged 1 Volumes (bbl) Prod'n (Bbl) ($/bbl) Period Details Type 26.4% 147,000 556,140 $18.43 October CBOB/LLS Swap Fixed Price Swap 27.3% 147,000 538,200 $11.20 November CBOB/LLS Swap Fixed Price Swap 26.4% 147,000 556,140 $9.36 December CBOB/LLS Swap Fixed Price Swap 26.7% 441,000 1,650,480 $13.00 Total

Projected Financial Guidance COMMODITY PRICE RISK MANAGEMENT Fourth Quarter 2023 Outlook 15 Management Commentary • For the fourth quarter 2023, the Company expects the Mobile Refinery to generate total throughput of between 68,000 to 71,000 bpd, reflecting between 91% and 95% total conventional facility capacity utilization. Reduced outlook for conventional throughput volumes reflects: • Planned downtime to proactively perform certain maintenance / repair operations • Downtime for Pitstop on crude unit #1 • Management expects 64% to 68% of its refined product output to be higher - value finished products such as gasoline, diesel and Jet fuel, with the remainder reflecting intermediate and other products • Vertex expects direct operating expense per barrel for consolidated operations of between $3.95 to $4.20 per barrel in the fourth quarter 2023 • Vertex anticipates total consolidated capital expenditures of between $15 million and $20 million in the fourth quarter 2023 Fourth Quarter 2023 Fourth Quarter 2023 1.) Finished products include gasoline, ULSD, and Jet A 2.) Intermediate & Other products include Vacuum Gas Oil (VGO), Liquified Petroleum Gases (LPGs), and Vacuum Tower Bottoms (V TBs ) 4Q 2023 Conventional Fuels High Low Operational: 71.0 68.0 Mobile Refinery Conventional Throughput Volume (Mbpd) 95% 91% Capacity Utilization Production Yield Profile: 68% 64% Percentage Finished Products 1 32% 36% Intermediate & Other Products 2 4Q 2023 Renewable Fuels High Low Operational: 6.0 4.0 Mobile Refinery Renewable Throughput Volume (Mbpd) 75% 50% Capacity Utilization 98% 97% Production Yield 2% 3% Yield Loss 4Q 2023 Consolidated High Low Operational: 77.0 72.0 Mobile Refinery Total Throughput Volume (Mbpd) 93% 87% Capacity Utilization Financial Guidance: $4.20 $3.95 Direct Operating Expense ($/bbl) $20.00 $15.00 Capital Expenditures ($/MM)
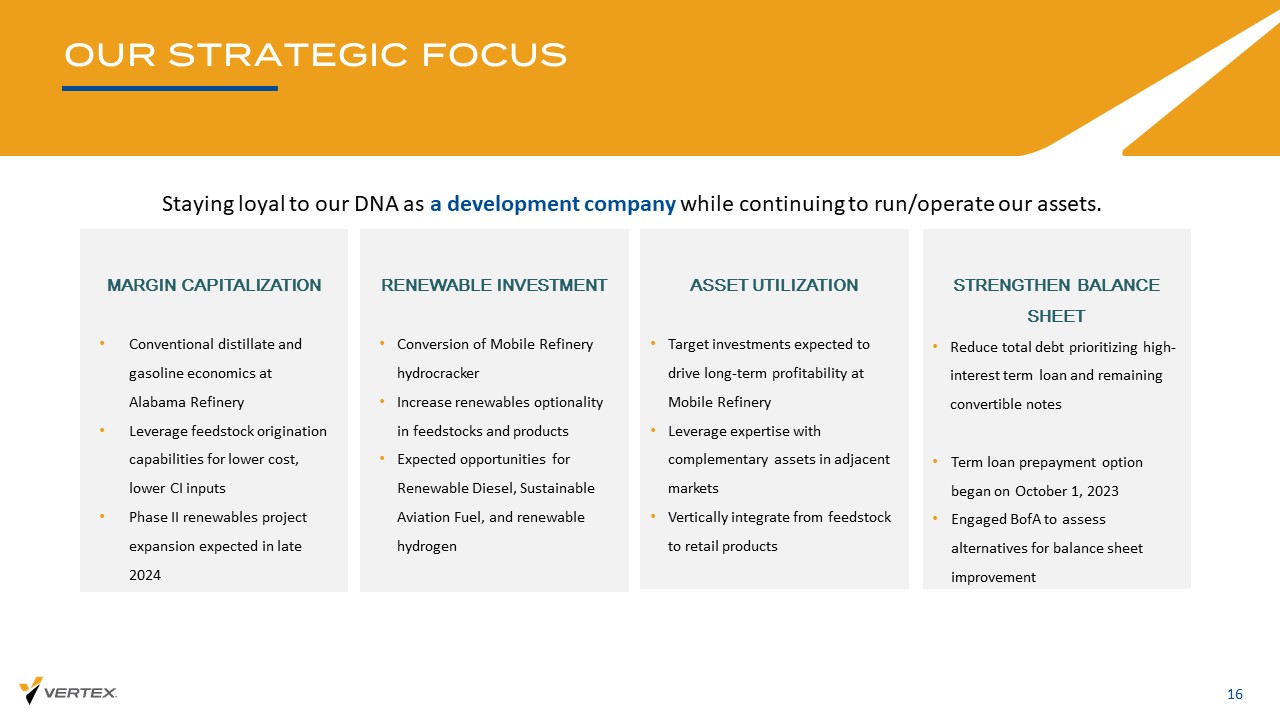
OUR STRATEGIC FOCUS 16 ASSET UTILIZATION • Target investments expected to drive long - term profitability at Mobile Refinery • Leverage expertise with complementary assets in adjacent markets • Vertically integrate from feedstock to retail products MARGIN CAPITALIZATION • Conventional distillate and gasoline economics at Alabama Refinery • Leverage feedstock origination capabilities for lower cost, lower CI inputs • Phase II renewables project expansion expected in late 2024 RENEWABLE INVESTMENT • Conversion of Mobile Refinery hydrocracker • Increase renewables optionality in feedstocks and products • Expected opportunities for Renewable Diesel, Sustainable Aviation Fuel, and renewable hydrogen STRENGTHEN BALANCE SHEET • Reduce total debt prioritizing high - interest term loan and remaining convertible notes • Term loan prepayment option began on October 1, 2023 • Engaged BofA to assess alternatives for balance sheet improvement Staying loyal to our DNA as a development company while continuing to run/operate our assets.

APPENDIX

NON - GAAP RECONCILIATION 18 Unaudited Reconciliation of Gross Profit (Loss) From Continued and Discontinued Operations to Adjusted Gross Margin, Fuel Gross Margin, Fuel Gross Margin Per Barrel of Throughput and Operating Expenses Per Barrel of Throughput. In thousands Conventional Renewable Mobile Refinery Total Gross profit 86,185$ (8,515)$ 77,670$ Unrealized (gain) loss on hedging activities (4,620) (3,622) (8,242) Inventory valuation adjustments 13,225 (3,851) 9,374 Adjusted gross margin 94,790$ (15,988)$ 78,802$ Variable production costs attributable to cost of revenues 26,847 12,958 39,805 Depreciation and amortization attributable to cost of revenues 2,982 3,320 6,302 RINs 7,058 - 7,058 Realized loss on hedging activities 2,854 2,401 5,255 Financing costs 1,772 205 1,977 Other revenues (6,804) (524) (7,328) Fuel gross margin 129,499$ 2,372$ 131,871$ Throughput (bpd) 80,171 5,397 85,568 Fuel gross margin per barrel of throughput 17.56$ 4.78$ 16.75$ Total OPEX 17,720$ 11,445$ 29,165$ Operating expenses per barrel of throughput 2.40$ 23.05$ 3.70$ Three Months Ended September 30, 2023
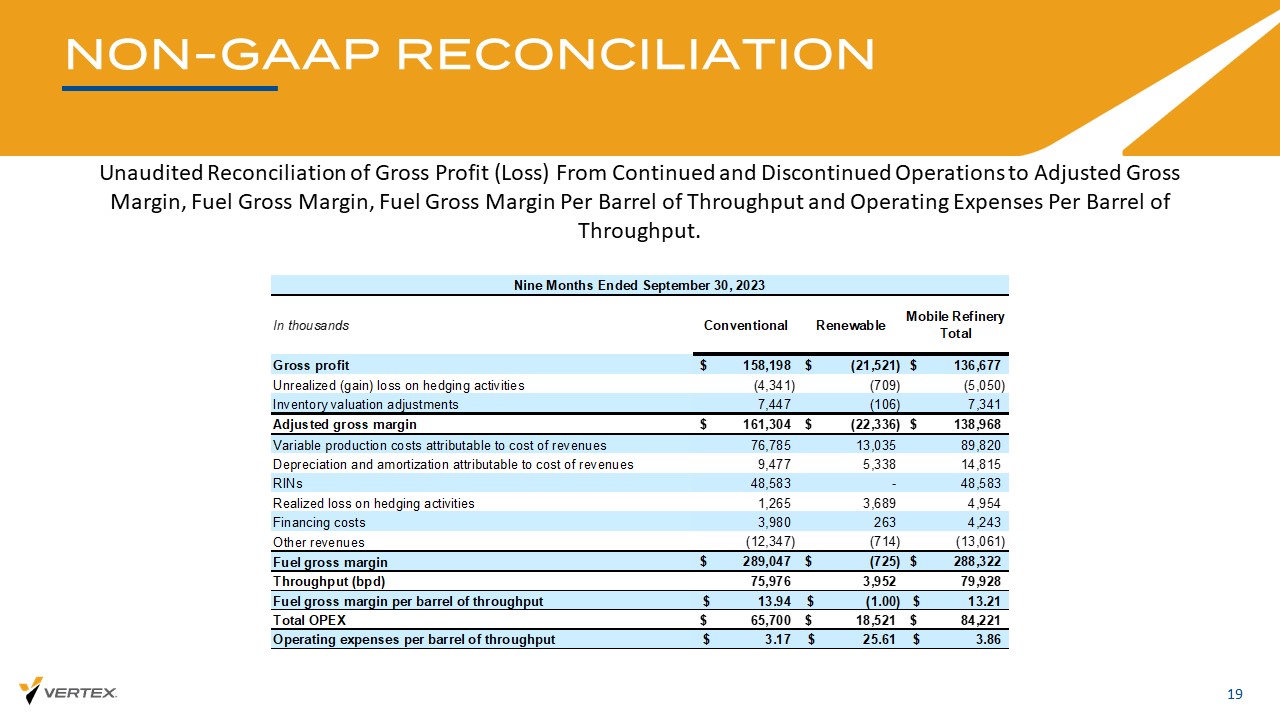
NON - GAAP RECONCILIATION 19 Unaudited Reconciliation of Gross Profit (Loss) From Continued and Discontinued Operations to Adjusted Gross Margin, Fuel Gross Margin, Fuel Gross Margin Per Barrel of Throughput and Operating Expenses Per Barrel of Throughput. In thousands Conventional Renewable Mobile Refinery Total Gross profit 158,198$ (21,521)$ 136,677$ Unrealized (gain) loss on hedging activities (4,341) (709) (5,050) Inventory valuation adjustments 7,447 (106) 7,341 Adjusted gross margin 161,304$ (22,336)$ 138,968$ Variable production costs attributable to cost of revenues 76,785 13,035 89,820 Depreciation and amortization attributable to cost of revenues 9,477 5,338 14,815 RINs 48,583 - 48,583 Realized loss on hedging activities 1,265 3,689 4,954 Financing costs 3,980 263 4,243 Other revenues (12,347) (714) (13,061) Fuel gross margin 289,047$ (725)$ 288,322$ Throughput (bpd) 75,976 3,952 79,928 Fuel gross margin per barrel of throughput 13.94$ (1.00)$ 13.21$ Total OPEX 65,700$ 18,521$ 84,221$ Operating expenses per barrel of throughput 3.17$ 25.61$ 3.86$ Nine Months Ended September 30, 2023

NON - GAAP RECONCILIATION 20 Unaudited Reconciliation of Gross Profit (Loss) From Continued and Discontinued Operations to Adjusted Gross Margin, Fuel Gross Margin, Fuel Gross Margin Per Barrel of Throughput and Operating Expenses Per Barrel of Throughput. In thousands Conventional Renewable Mobile Refinery Total Gross profit 6,544$ (13,006)$ (6,462)$ Unrealized (gain) loss on hedging activities 849 2,913 3,762 Inventory valuation adjustments (4,246) 3,745 (501) Adjusted gross margin 3,147$ (6,348)$ (3,201)$ Variable production costs attributable to cost of revenues 28,686 77 28,763 Depreciation and amortization attributable to cost of revenues 3,351 2,018 5,369 RINs 25,410 - 25,410 Realized loss on hedging activities (1,150) 1,288 138 Financing costs (87) 58 (29) Other revenues (3,610) (190) (3,800) Fuel gross margin 55,747$ (3,097)$ 52,650$ Throughput (bpd) 76,330 2,490 78,820 Fuel gross margin per barrel of throughput 8.03$ (13.66)$ 7.34$ Total OPEX 23,299$ 7,076$ 30,375$ Operating expenses per barrel of throughput 3.35$ 31.23$ 4.23$ Three Months Ended June 30, 2023
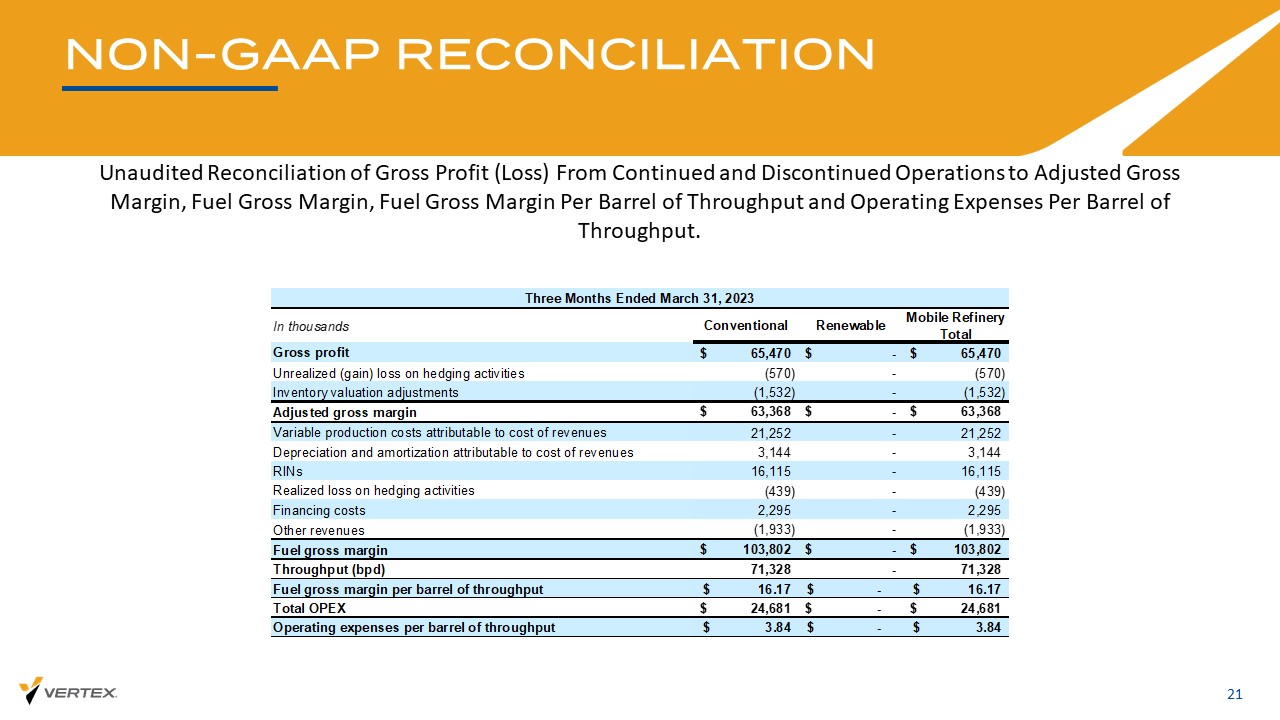
NON - GAAP RECONCILIATION 21 Unaudited Reconciliation of Gross Profit (Loss) From Continued and Discontinued Operations to Adjusted Gross Margin, Fuel Gross Margin, Fuel Gross Margin Per Barrel of Throughput and Operating Expenses Per Barrel of Throughput. In thousands Conventional Renewable Mobile Refinery Total Gross profit 65,470$ -$ 65,470$ Unrealized (gain) loss on hedging activities (570) - (570) Inventory valuation adjustments (1,532) - (1,532) Adjusted gross margin 63,368$ -$ 63,368$ Variable production costs attributable to cost of revenues 21,252 - 21,252 Depreciation and amortization attributable to cost of revenues 3,144 - 3,144 RINs 16,115 - 16,115 Realized loss on hedging activities (439) - (439) Financing costs 2,295 - 2,295 Other revenues (1,933) - (1,933) Fuel gross margin 103,802$ -$ 103,802$ Throughput (bpd) 71,328 - 71,328 Fuel gross margin per barrel of throughput 16.17$ -$ 16.17$ Total OPEX 24,681$ -$ 24,681$ Operating expenses per barrel of throughput 3.84$ -$ 3.84$ Three Months Ended March 31, 2023

NON - GAAP RECONCILIATION 22 Unaudited Reconciliation of EBITDA and Adjusted EBITDA to Net loss from Continued and Discontinued Operations In thousands September 30, 2023 September 30, 2022 September 30, 2023 September 30, 2022 September 30, 2023 September 30, 2022 Net income (loss) $ 19,534 $ 22,172 $ (8,107) $ (42,421) $ 36,310 $ (47,771) Depreciation and amortization 8,929 5,623 22,085 13,157 27,847 15,088 Income tax expense (benefit) 12,231 - 3,754 - 1,265 - Interest expense 13,523 13,129 103,536 65,069 118,493 67,921 EBITDA $ 54,217 $ 40,924 $ 121,268 $ 35,805 $ 183,915 $ 35,239 Unrealized (gain) loss on hedging activities (8,348) (47,756) (5,233) (1,123) (4,256) (1,375) Inventory valuation adjustments 9,374 17,972 7,341 41,152 16,955 41,152 Gain on change in value of derivative warrant liability (4,621) (12,312) (5,036) (7,788) (5,069) (3,483) Stock-based compensation 769 378 1,502 951 2,125 1,201 (Gain) loss on sale of assets - - (70,881) - (70,558) (1,041) Acquisition costs - 2,889 4,308 16,526 4,309 20,092 Environmental clean-up reserve - - - 1,428 - 1,428 Other 132 (417) (1,022) (1,042) (8) 2,106 Adjusted EBITDA $ 51,523 $ 1,678 $ 52,247 $ 85,909 $ 127,413 $ 95,318 Three Months Ended Nine Months Ended Twelve Months Ended

NON - GAAP RECONCILIATION 23 Unaudited Reconciliation of EBITDA and Adjusted EBITDA to Net loss from Continued and Discontinued Operations In thousands Conventional Renewable Net income (loss) $ 65,161 $ (21,807) $ (1,489) $ 41,865 $ 912 $ (42,443) $ 335 Depreciation and amortization 3,718 3,341 297 7,356 1,407 166 8,929 Income tax expense (benefit) - - - - - 31,430 31,430 Interest expense 2,568 1,826 - 4,394 41 9,089 13,523 EBITDA $ 71,447 $ (16,640) $ (1,192) $ 53,615 $ 2,360 $ (1,758) $ 54,217 Unrealized (gain) loss on hedging activities (4,620) (3,622) (40) (8,282) (66) - (8,348) Inventory valuation adjustments 13,225 (3,851) - 9,374 - - 9,374 Gain on change in value of derivative warrant liability - - - - - (4,621) (4,621) Stock-based compensation - - - - - 769 769 (Gain) loss on sale of assets - - - - - - - Acquisition costs - - - - - - - Other - - - - 167 (35) 132 Adjusted EBITDA $ 80,052 $ (24,113) $ (1,232) $ 54,707 $ 2,461 $ (5,645) $ 51,523 Three Months Ended September 30, 2023 Mobile Refinery Legacy Refining & Marketing Total Refining & Marketing Black Oil and Recovery Corporate Consolidated

NON - GAAP RECONCILIATION 24 Unaudited Reconciliation of EBITDA and Adjusted EBITDA to Net loss from Continued and Discontinued Operations In thousands Mobile Refinery Legacy Refining & Marketing Total Refining & Marketing Black Oil Corporate Consolidated Net income (loss) $ 18,369 $ (2,251) $ 16,118 $ 7,638 $ (1,585) $ 22,171 Depreciation and amortization 3,693 268 3,961 1,431 231 5,623 Interest expense 3,536 - 3,536 (2) 9,595 13,129 EBITDA $ 25,599 $ (1,983) $ 23,616 $ 9,067 $ 8,241 $ 40,924 Unrealized (gain) loss on hedging activities (46,977) (775) (47,752) (4) - (47,756) Inventory valuation adjustments 17,972 - 17,972 - - 17,972 Gain on change in value of derivative warrant liability - - - - (12,312) (12,312) Stock-based compensation - - - - 378 378 Acquisition costs 2,889 - 2,889 - - 2,889 Other - - - (417) - (417) Adjusted EBITDA $ (517) $ (2,758) $ (3,275) $ 8,646 $ (3,693) $ 1,678 Three Months Ended September 30, 2022

NON - GAAP RECONCILIATION 25 Unaudited Reconciliation of EBITDA and Adjusted EBITDA to Net loss from Continued and Discontinued Operations In thousands Conventional Renewable Net income (loss) $ 79,686 $ (42,272) $ (3,924) $ 33,490 $ 50,929 $ (111,726) $ (27,306) Depreciation and amortization 11,685 5,373 790 17,848 3,733 504 22,085 Income tax expense (benefit) - - - - 19,199 3,754 22,953 Interest expense 10,604 2,195 - 12,799 126 90,612 103,536 EBITDA $ 101,975 $ (34,704) $ (3,134) $ 64,137 $ 73,987 $ (16,856) $ 121,268 Unrealized (gain) loss on hedging activities (4,341) (709) (82) (5,132) (101) - (5,233) Inventory valuation adjustments 7,447 (106) - 7,341 - - 7,341 Gain on change in value of derivative warrant liability - - - - - (5,036) (5,036) Stock-based compensation - - - - - 1,502 1,502 (Gain) loss on sale of assets - - - - (70,884) 3 (70,881) Acquisition costs - - - - - 4,308 4,308 Other - - - - (984) (38) (1,022) Adjusted EBITDA $ 105,081 $ (35,519) $ (3,216) $ 66,346 $ 2,018 $ (16,117) $ 52,247 Nine Months Ended September 30, 2023 Mobile Refinery Legacy Refining & Marketing Total Refining & Marketing Black Oil and Recovery Corporate Consolidated

NON - GAAP RECONCILIATION 26 Unaudited Reconciliation of EBITDA and Adjusted EBITDA to Net loss from Continued and Discontinued Operations In thousands Mobile Refinery Legacy Refining & Marketing Total Refining & Marketing Black Oil Corporate Consolidated Net income (loss) $ (5,593) $ (2,147) $ (7,740) $ 40,399 $ (75,080) $ (42,421) Depreciation and amortization 7,416 707 8,123 4,305 729 13,157 Interest expense 6,768 - 6,768 4 58,297 65,069 EBITDA $ 8,591 $ (1,440) $ 7,151 $ 44,708 $ (16,054) $ 35,805 Unrealized (gain) loss on hedging activities (76) (68) (144) (979) - (1,123) Inventory valuation adjustments 41,152 - 41,152 - - 41,152 Gain on change in value of derivative warrant liability - - - - (7,788) (7,788) Stock-based compensation - - - - 951 951 Acquisition costs 11,967 - 11,967 - 4,559 16,526 Environmental clean-up reserve 1,428 - 1,428 - - 1,428 Other - - - (1,042) - (1,042) Adjusted EBITDA $ 63,062 $ (1,508) $ 61,554 $ 42,687 $ (18,332) $ 85,909 Nine Months Ended September 30, 2022

NON - GAAP RECONCILIATION 27 Unaudited Reconciliation of Long - Term Debt to Net Long - Term Debt and Net Leverage In thousands September 30, 2023 September 30, 2022 December 31, 2022 Long-Term Debt: Senior Convertible Note $ 15,230 $ 95,178 $ 95,178 Term Loan 2025 148,013 165,000 165,000 Finance lease liability long-term 66,751 44,339 45,164 Finance lease liability short-term 2,297 1,155 1,363 Insurance premiums financed 10,071 10,449 5,602 Long-Term Debt and Lease Obligations $ 242,362 $ 316,121 $ 312,307 Unamortized discount and deferred financing costs (29,983) (86,384) (81,918) Long-Term Debt and Lease Obligations per Balance Sheet 212,379$ 229,737$ 230,389$ Cash and Cash Equivalents (75,705) (117,464) (141,258) Restricted Cash (3,605) (4,929) (4,929) Total Cash and Cash Equivalents $ (79,310) $ (122,393) $ (146,187) Net Long-Term Debt 163,052$ 193,728$ 166,120$ Adjusted EBITDA $ 127,413 $ 95,318 $ 161,000 Net Leverage 1.3x 2.0x 1.0x As of
v3.23.3
| X |
- DefinitionBoolean flag that is true when the XBRL content amends previously-filed or accepted submission.
| Name: |
dei_AmendmentFlag |
| Namespace Prefix: |
dei_ |
| Data Type: |
xbrli:booleanItemType |
| Balance Type: |
na |
| Period Type: |
duration |
|
| X |
- DefinitionFor the EDGAR submission types of Form 8-K: the date of the report, the date of the earliest event reported; for the EDGAR submission types of Form N-1A: the filing date; for all other submission types: the end of the reporting or transition period. The format of the date is YYYY-MM-DD.
| Name: |
dei_DocumentPeriodEndDate |
| Namespace Prefix: |
dei_ |
| Data Type: |
xbrli:dateItemType |
| Balance Type: |
na |
| Period Type: |
duration |
|
| X |
- DefinitionThe type of document being provided (such as 10-K, 10-Q, 485BPOS, etc). The document type is limited to the same value as the supporting SEC submission type, or the word 'Other'.
| Name: |
dei_DocumentType |
| Namespace Prefix: |
dei_ |
| Data Type: |
dei:submissionTypeItemType |
| Balance Type: |
na |
| Period Type: |
duration |
|
| X |
- DefinitionAddress Line 1 such as Attn, Building Name, Street Name
| Name: |
dei_EntityAddressAddressLine1 |
| Namespace Prefix: |
dei_ |
| Data Type: |
xbrli:normalizedStringItemType |
| Balance Type: |
na |
| Period Type: |
duration |
|
| X |
- DefinitionAddress Line 2 such as Street or Suite number
| Name: |
dei_EntityAddressAddressLine2 |
| Namespace Prefix: |
dei_ |
| Data Type: |
xbrli:normalizedStringItemType |
| Balance Type: |
na |
| Period Type: |
duration |
|
| X |
- Definition
+ References
+ Details
| Name: |
dei_EntityAddressCityOrTown |
| Namespace Prefix: |
dei_ |
| Data Type: |
xbrli:normalizedStringItemType |
| Balance Type: |
na |
| Period Type: |
duration |
|
| X |
- DefinitionCode for the postal or zip code
| Name: |
dei_EntityAddressPostalZipCode |
| Namespace Prefix: |
dei_ |
| Data Type: |
xbrli:normalizedStringItemType |
| Balance Type: |
na |
| Period Type: |
duration |
|
| X |
- DefinitionName of the state or province.
| Name: |
dei_EntityAddressStateOrProvince |
| Namespace Prefix: |
dei_ |
| Data Type: |
dei:stateOrProvinceItemType |
| Balance Type: |
na |
| Period Type: |
duration |
|
| X |
- DefinitionA unique 10-digit SEC-issued value to identify entities that have filed disclosures with the SEC. It is commonly abbreviated as CIK. Reference 1: http://www.xbrl.org/2003/role/presentationRef
-Publisher SEC
-Name Exchange Act
-Number 240
-Section 12
-Subsection b-2
| Name: |
dei_EntityCentralIndexKey |
| Namespace Prefix: |
dei_ |
| Data Type: |
dei:centralIndexKeyItemType |
| Balance Type: |
na |
| Period Type: |
duration |
|
| X |
- DefinitionIndicate if registrant meets the emerging growth company criteria. Reference 1: http://www.xbrl.org/2003/role/presentationRef
-Publisher SEC
-Name Exchange Act
-Number 240
-Section 12
-Subsection b-2
| Name: |
dei_EntityEmergingGrowthCompany |
| Namespace Prefix: |
dei_ |
| Data Type: |
xbrli:booleanItemType |
| Balance Type: |
na |
| Period Type: |
duration |
|
| X |
- DefinitionCommission file number. The field allows up to 17 characters. The prefix may contain 1-3 digits, the sequence number may contain 1-8 digits, the optional suffix may contain 1-4 characters, and the fields are separated with a hyphen.
| Name: |
dei_EntityFileNumber |
| Namespace Prefix: |
dei_ |
| Data Type: |
dei:fileNumberItemType |
| Balance Type: |
na |
| Period Type: |
duration |
|
| X |
- DefinitionTwo-character EDGAR code representing the state or country of incorporation.
| Name: |
dei_EntityIncorporationStateCountryCode |
| Namespace Prefix: |
dei_ |
| Data Type: |
dei:edgarStateCountryItemType |
| Balance Type: |
na |
| Period Type: |
duration |
|
| X |
- DefinitionThe exact name of the entity filing the report as specified in its charter, which is required by forms filed with the SEC. Reference 1: http://www.xbrl.org/2003/role/presentationRef
-Publisher SEC
-Name Exchange Act
-Number 240
-Section 12
-Subsection b-2
| Name: |
dei_EntityRegistrantName |
| Namespace Prefix: |
dei_ |
| Data Type: |
xbrli:normalizedStringItemType |
| Balance Type: |
na |
| Period Type: |
duration |
|
| X |
- DefinitionThe Tax Identification Number (TIN), also known as an Employer Identification Number (EIN), is a unique 9-digit value assigned by the IRS. Reference 1: http://www.xbrl.org/2003/role/presentationRef
-Publisher SEC
-Name Exchange Act
-Number 240
-Section 12
-Subsection b-2
| Name: |
dei_EntityTaxIdentificationNumber |
| Namespace Prefix: |
dei_ |
| Data Type: |
dei:employerIdItemType |
| Balance Type: |
na |
| Period Type: |
duration |
|
| X |
- DefinitionLocal phone number for entity.
| Name: |
dei_LocalPhoneNumber |
| Namespace Prefix: |
dei_ |
| Data Type: |
xbrli:normalizedStringItemType |
| Balance Type: |
na |
| Period Type: |
duration |
|
| X |
- DefinitionBoolean flag that is true when the Form 8-K filing is intended to satisfy the filing obligation of the registrant as pre-commencement communications pursuant to Rule 13e-4(c) under the Exchange Act. Reference 1: http://www.xbrl.org/2003/role/presentationRef
-Publisher SEC
-Name Exchange Act
-Number 240
-Section 13e
-Subsection 4c
| Name: |
dei_PreCommencementIssuerTenderOffer |
| Namespace Prefix: |
dei_ |
| Data Type: |
xbrli:booleanItemType |
| Balance Type: |
na |
| Period Type: |
duration |
|
| X |
- DefinitionBoolean flag that is true when the Form 8-K filing is intended to satisfy the filing obligation of the registrant as pre-commencement communications pursuant to Rule 14d-2(b) under the Exchange Act. Reference 1: http://www.xbrl.org/2003/role/presentationRef
-Publisher SEC
-Name Exchange Act
-Number 240
-Section 14d
-Subsection 2b
| Name: |
dei_PreCommencementTenderOffer |
| Namespace Prefix: |
dei_ |
| Data Type: |
xbrli:booleanItemType |
| Balance Type: |
na |
| Period Type: |
duration |
|
| X |
- DefinitionTitle of a 12(b) registered security. Reference 1: http://www.xbrl.org/2003/role/presentationRef
-Publisher SEC
-Name Exchange Act
-Number 240
-Section 12
-Subsection b
| Name: |
dei_Security12bTitle |
| Namespace Prefix: |
dei_ |
| Data Type: |
dei:securityTitleItemType |
| Balance Type: |
na |
| Period Type: |
duration |
|
| X |
- DefinitionName of the Exchange on which a security is registered. Reference 1: http://www.xbrl.org/2003/role/presentationRef
-Publisher SEC
-Name Exchange Act
-Number 240
-Section 12
-Subsection d1-1
| Name: |
dei_SecurityExchangeName |
| Namespace Prefix: |
dei_ |
| Data Type: |
dei:edgarExchangeCodeItemType |
| Balance Type: |
na |
| Period Type: |
duration |
|
| X |
- DefinitionBoolean flag that is true when the Form 8-K filing is intended to satisfy the filing obligation of the registrant as soliciting material pursuant to Rule 14a-12 under the Exchange Act. Reference 1: http://www.xbrl.org/2003/role/presentationRef
-Publisher SEC
-Name Exchange Act
-Section 14a
-Number 240
-Subsection 12
| Name: |
dei_SolicitingMaterial |
| Namespace Prefix: |
dei_ |
| Data Type: |
xbrli:booleanItemType |
| Balance Type: |
na |
| Period Type: |
duration |
|
| X |
- DefinitionTrading symbol of an instrument as listed on an exchange.
| Name: |
dei_TradingSymbol |
| Namespace Prefix: |
dei_ |
| Data Type: |
dei:tradingSymbolItemType |
| Balance Type: |
na |
| Period Type: |
duration |
|
| X |
- DefinitionBoolean flag that is true when the Form 8-K filing is intended to satisfy the filing obligation of the registrant as written communications pursuant to Rule 425 under the Securities Act. Reference 1: http://www.xbrl.org/2003/role/presentationRef
-Publisher SEC
-Name Securities Act
-Number 230
-Section 425
| Name: |
dei_WrittenCommunications |
| Namespace Prefix: |
dei_ |
| Data Type: |
xbrli:booleanItemType |
| Balance Type: |
na |
| Period Type: |
duration |
|
Vertex Energy (NASDAQ:VTNR)
Historical Stock Chart
From May 2024 to Jun 2024

Vertex Energy (NASDAQ:VTNR)
Historical Stock Chart
From Jun 2023 to Jun 2024
