0001290476false00012904762024-01-262024-01-26

UNITED STATES

SECURITIES AND EXCHANGE COMMISSION

Washington, D.C. 20549

FORM 8-K

CURRENT REPORT

Pursuant to Section 13 or 15(d) of the Securities Exchange Act of 1934

Date of report (Date of earliest event reported): January 26, 2024

VILLAGE BANK AND TRUST FINANCIAL CORP.

(Exact Name of Registrant as Specified in Charter)

Virginia

0-50765

16-1694602

(State or Other Jurisdiction
of Incorporation)

(Commission File Number)

(IRS Employer
Identification No.)

13319 Midlothian Turnpike

Midlothian, Virginia

23113

(Address of Principal Executive Offices)

(Zip Code)

Registrant’s Telephone Number, Including Area Code: (804) 897-3900

Not Applicable

(Former Name or Former Address, if Changed Since Last Report)

Check the appropriate box below if the Form 8-K filing is intended to simultaneously satisfy the filing obligation of the registrant under any of the following provisions:

     Written communications pursuant to Rule 425 under the Securities Act (17 CFR 230.425)

     Soliciting material pursuant to Rule 14a-12 under the Exchange Act (17 CFR 240.14a-12)

     Pre-commencement communications pursuant to Rule 14d-2(b) under the Exchange Act (17 CFR 240.14d-2(b))

     Pre-commencement communications pursuant to Rule 13e-4(c) under the Exchange Act (17 CFR 240.13e-4(c))

Securities registered pursuant to Section 12(b) of the Act:

Title of each class

Trading Symbol(s)

Name of each exchange on which registered

Common Stock, par value $4.00 per share

VBFC

Nasdaq Capital Market

Indicate by check mark whether the registrant is an emerging growth company as defined in Rule 405 of the Securities Act of 1933 (17 CFR §230.405) or Rule 12b-2 of the Securities Exchange Act of 1934 (17 CFR §240.12b-2).

Emerging growth company

If an emerging growth company, indicate by check mark if the registrant has elected not to use the extended transition for complying with any new or revised financial accounting standards provided pursuant to Section 13(a) of the Exchange Act. 

Item 7.01Regulation FD Disclosure.

The attached investor presentation contains information that the members of Village Bank and Trust Financial Corp. (the “Company”) management will use during visits with investors, analysts, and other interested parties to assist their understanding of the Company at various investor presentations during the first quarter of 2024.


The presentation is attached as Exhibit 99.1 to this report and is being furnished, not filed, under Item 7.01 of this Form 8-K

Item 9.01Financial Statements and Exhibits.

(d)Exhibits.

Exhibit No.

Description

99.1

Village Bank and Trust Financial Crop. Investor Presentation

104

Cover Page Interactive Data File – the cover page iXBRL tags are embedded within the Inline XBRL document.

2

SIGNATURES

Pursuant to the requirements of the Securities Exchange Act of 1934, as amended, the Registrant has duly caused this report to be signed on its behalf by the undersigned hereunto duly authorized.

VILLAGE BANK AND TRUST FINANCIAL CORP.

(Registrant)

Date: January 26, 2024

By: /s/ Donald M. Kaloski, Jr.

Donald M. Kaloski, Jr.

Executive Vice President and CFO

3

Exhibit 99.1

GRAPHIC

You're a neighbor, not a number Q1 2024 Investor Presentation

GRAPHIC

Cautionary Statement Regarding Forward-Looking Statements In addition to historical information, this presentation may contain forward-looking statements. For this purpose, any statement that is not a statement of historical fact may be deemed to be a forward-looking statement. These forward-looking statements may include statements regarding profitability, liquidity, allowance for loan losses, interest rate sensitivity, market risk, growth strategy and financial and other goals. Forward-looking statements often use words such as “believes,” “expects,” “plans,” “may,” “will,” “should,” “projects,” “contemplates,” “anticipates,” “forecasts,” “intends” or other words of similar meaning. You can also identify them by the fact that they do not relate strictly to historical or current facts. Forward-looking statements are subject to numerous assumptions, risks and uncertainties, and actual results could differ materially from historical results or those anticipated by such statements. There are many factors that could have a material adverse effect on the operations and future prospects of the Company including, but not limited to: • changes in assumptions underlying the establishment of allowances for credit losses, and other estimates; • the risks of changes in interest rates on levels, composition and costs of deposits, loan demand, and the values and liquidity of loan collateral, securities, and interest sensitive assets and liabilities; • the ability to maintain adequate liquidity by retaining deposit customers and secondary funding sources, especially if the Company’s or banking industry’s reputation becomes damaged; • the effects of future economic, business and market conditions; • legislative and regulatory changes, including the Dodd-Frank Act and other changes in banking, securities, and tax laws and regulations and their application by our regulators, and changes in scope and cost of FDIC insurance and other coverages; • our inability to maintain our regulatory capital position; • the Company’s computer systems and infrastructure may be vulnerable to attacks by hackers or breached due to employee error, malfeasance, or other disruptions despite security measures implemented by the Company; • changes in market conditions, specifically declines in the residential and commercial real estate market, volatility and disruption of the capital and credit markets, and soundness of other financial institutions with which we do business; 1

GRAPHIC

Cautionary Statement Regarding Forward-Looking Statements • risks inherent in making loans such as repayment risks and fluctuating collateral values; • changes in operations of Village Bank Mortgage Corporation as a result of the activity in the residential real estate market; • exposure to repurchase loans sold to investors for which borrowers failed to provide full and accurate information on or related to their loan application or for which appraisals have not been acceptable or when the loan was not underwritten in accordance with the loan program specified by the loan investor; • governmental monetary and fiscal policies; • geopolitical conditions, including acts or threats of terrorism and/or military conflicts, or actions taken by the U.S. or other governments in response to acts or threats of terrorism and/or military conflicts, negatively impacting business and economic conditions in the U.S. and abroad; • changes in accounting policies, rules and practices; • reliance on our management team, including our ability to attract and retain key personnel; • competition with other banks and financial institutions, and companies outside of the banking industry, including those companies that have substantially greater access to capital and other resources; • demand, development and acceptance of new products and services; • problems with technology utilized by us; • the occurrence of significant natural disasters, including severe weather conditions, floods, health related issues, and other catastrophic events; • the impact of the COVID-19 pandemic, including the adverse impact on our business and operations and on our customers; • changing trends in customer profiles and behavior; and • other factors described from time to time in our reports filed with the SEC. These risks and uncertainties should be considered in evaluating the forward-looking statements contained herein, and readers are cautioned not to place undue reliance on such statements. Any forward-looking statement speaks only as of the date on which it is made, and the Company undertakes no obligation to update any forward-looking statement to reflect events or circumstances after the date on which it is made. In addition, past results of operations are not necessarily indicative of future results. 2

GRAPHIC

Non-GAAP Financial Measures The accounting and reporting polices of the Company conform to generally accepted accounting principles (“GAAP”) in the United States and prevailing practices in the banking industry. However, management uses certain non-GAAP measures to supplement the evaluation of the Company’s performance. These measures include core operating income, core earnings per share, and core return on tangible common equity for the consolidated entity, the commercial banking segment, and the mortgage banking segment, and pre-tax pre-provision income. Management believes presentations of these non-GAAP financial measures provide useful supplemental information that is essential to a proper understanding of the operating results of the Company’s core businesses. These non-GAAP disclosures should not be viewed as a substitute for operating results determined in accordance with GAAP, nor are they necessarily comparable to non-GAAP performance measures that may be presented by other companies. Reconciliations of GAAP to non-GAAP disclosures are included as tables at the end of this presentation. 3

GRAPHIC

Village Bank and Trust Financial Corp. (Nasdaq: VBFC) Market Areas 
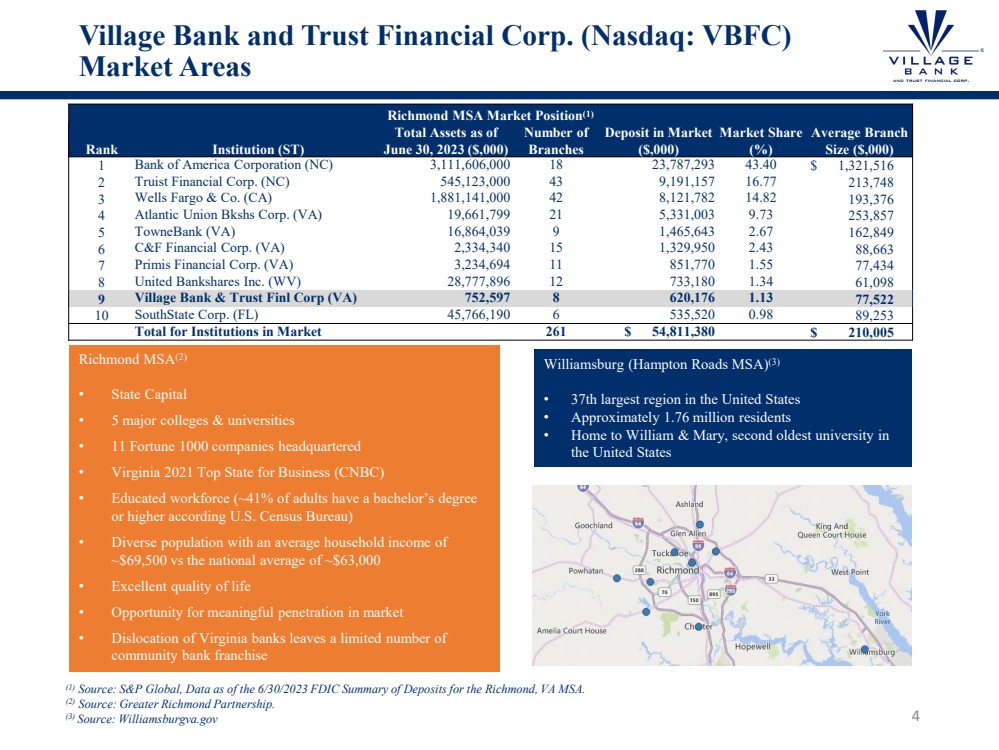
(1) Source: S&P Global, Data as of the 6/30/2023 FDIC Summary of Deposits for the Richmond, VA MSA. (2) Source: Greater Richmond Partnership. (3) Source: Williamsburgva.gov Richmond MSA(2) • State Capital • 5 major colleges & universities • 11 Fortune 1000 companies headquartered • Virginia 2021 Top State for Business (CNBC) • Educated workforce (~41% of adults have a bachelor’s degree or higher according U.S. Census Bureau) • Diverse population with an average household income of ~$69,500 vs the national average of ~$63,000 • Excellent quality of life • Opportunity for meaningful penetration in market • Dislocation of Virginia banks leaves a limited number of community bank franchise Williamsburg (Hampton Roads MSA)(3) • 37th largest region in the United States • Approximately 1.76 million residents • Home to William & Mary, second oldest university in the United States Richmond MSA Market Position(1) Rank Institution (ST) Total Assets as of June 30, 2023 ($,000) Number of Branches Deposit in Market ($,000) Market Share (%) Average Branch Size ($,000) 1 Bank of America Corporation (NC) 3,111,606,000 18 23,787,293 43.40 $ 1,321,516 2 Truist Financial Corp. (NC) 545,123,000 43 9,191,157 16.77 213,748 3 Wells Fargo & Co. (CA) 1,881,141,000 42 8,121,782 14.82 193,376 4 Atlantic Union Bkshs Corp. (VA) 19,661,799 21 5,331,003 9.73 253,857 5 TowneBank (VA) 16,864,039 9 1,465,643 2.67 162,849 6 C&F Financial Corp. (VA) 2,334,340 15 1,329,950 2.43 88,663 7 Primis Financial Corp. (VA) 3,234,694 11 851,770 1.55 77,434 8 United Bankshares Inc. (WV) 28,777,896 12 733,180 1.34 61,098 9 Village Bank & Trust Finl Corp (VA) 752,597 8 620,176 1.13 77,522 10 SouthState Corp. (FL) 45,766,190 6 535,520 0.98 89,253 Total for Institutions in Market 261 $ 54,811,380 $ 210,005 4

GRAPHIC

Financial Highlights Financial Highlights (dollars in thousands, except per share amounts) 2019 2020 2021 2022 2023 Balance Sheet Metrics Total Assets $ 540,313 $ 706,236 $ 748,401 $ 723,270 $ 736,616 Total Loans 430,059 558,955 526,024 539,015 575,811 Total Deposits 443,208 588,382 664,048 624,743 605,345 Total Equity $ 42,914 $ 51,996 $ 63,401 $ 61,111 $ 67,556 Loans to Deposits 97.03 % 95.00 % 79.21 % 86.28 % 95.12 % Capital Ratios Equity/Total Assets 7.94 % 7.36 % 8.47 % 8.45 % 9.17 % Bank Tier 1 Leverage Ratio 9.69 % 9.28 % 9.86 % 10.95 % 11.14 % Bank Tier 1 Capital Ratio 12.15 % 13.25 % 14.01 % 14.22 % 13.86 % BankTotal Risk Based Capital Ratio 12.56 % 14.20 % 14.66 % 14.81 % 14.49 % Profitablity Metrics ROAE* 11.16 % 17.98 % 21.02 % 13.54 % 3.00 % ROAA* 0.84 % 1.28 % 1.73 % 1.11 % 0.26 % Net Interest Margin* 3.68 % 3.41 % 3.76 % 3.67 % 3.65 % Efficiency Ratio* 74.86 % 62.76 % 59.39 % 69.06 % 77.15 % Per Share Metrics Book Value Per Share $ 29.53 $ 35.46 $ 43.03 $ 41.21 $ 45.25 Diluted Earnings Per Share $ 3.10 $ 5.86 $ 8.48 $ 5.62 % $ 1.29 Dividend Yield* -% -% 0.24 % 1.12 % 1.66 % Dividend Payout Ratio -% -% 1.65 % 10.32 % 51.16 % Asset Quality NPLs / Loans 0.49 % 0.41 % 0.30 % 0.13 % 0.06 % NPAs / Total Assets 0.44 % 0.27 % 0.18 % 0.09 % 0.04 % Reserves/NPLs (excluding PPP) 170.57 % 251.75 % 251.94 % 515.16 % 1,176.12 % NCOs / Average Loans -% 0.03 % 0.01 % (0.05)% (0.03)% 5 * Annualized

GRAPHIC

Major Items on Investors and Customers Minds Loan-to-Deposits 95.12% Deposit Costs Cost of total deposits 0.85%, total deposit beta of 19.62% since December 31, 2021. Average Deposit Per Account ~$33,000 as of December 31, 2023 Securities 14.43% of Earning Assets, all AFS status, Duration of 3.35, Book Yield of 3.52%, $20 million USTs maturing January 31, 2023, at a weighted average rate of 1.50%. Allowance for Credit Loss on Loans 0.59% - Adopted ASC 326 January 1, 2023, which resulted in a $150,000 increase to the allowance for credit losses. Asset Quality Nonperforming assets to total assets improved from 0.09% as of December 31, 2022 to 0.04% as of December 31, 2023. Borrowing Capacity Available credit of $157 million plus $17.7 million cash. TCE Ratio 9.17% including impact of AOCI (Bank Regulatory Leverage ratio of 11.14% and Risk Based ratio of 14.49%) 6

GRAPHIC

Our Value Proposition • We think and behave like long-term investors Vision, Discipline, Execution • Strong market position in a very attractive market Market Opportunity • Excellent opportunity to take market • A strong community bank with a successful mortgage company Differentiated Transparency and Candor • Effective shareholder communications • Excellent shareholder returns over the last five years We Deliver Results 7

GRAPHIC

Our Strategy Is Built Around Delivering Top Quartile Long Term Returns To Our Shareholders This Means… • Top Quartile Return on Tangible Common Equity • Sustained High Single Digit Earnings Per Share Growth • Best Quartile Asset Quality in Worst Part of Cycle • Best Quartile Earnings Volatility 8

GRAPHIC

Strategic Priorities and Objectives 1. Generate Top Quartile Returns a. Invest for long-term out performance (people, process and technology) b. Diversify and grow fee revenue c. Focus on deploying capital into growth opportunities 2. Grow Franchise a. Generate strong relationship growth b. Add revenue producers c. Expand presence in Richmond and eastern region markets 3. Enhance Customer Experience a. Continually improve the digital experience b. Access data for better decisions c. Instill customer first service standards 4. Maintain discipline approach to risk management a. Scale risk framework as we approach $1B b. Maintain asset quality through worst part of the credit cycle c. Strengthen fraud and data protection 5. Invest in Talent & Strengthen our Culture of Success a. Ensure staff have skills as we grow b. Develop leadership bench c. Build and reinforce culture 6. Engage and improve lives in our community 9

GRAPHIC

Core earnings over the past 5 years (1) Non-GAAP financial measure. See GAAP to Non-GAAP financial measure reconciliation at the end of this presentation. (2) Source: S&P Global – Southeast Public Banks under $1 billion in assets as of December 31, 2022. 12.72% 19.12% 21.02% 13.54% 9.35% (5.00%) 0.00% 5.00% 10.00% 15.00% 20.00% 25.00% 30.00% 35.00% 2019 2020 2021 2022 2023 Core ROTCE(1) Commercial Banking Segment Mortgage Banking Segment Top Quartile(2) $3.53 $6.23 $8.48 $5.62 $3.94 $(2.00) $- $2.00 $4.00 $6.00 $8.00 $10.00 2019 2020 2021 2022 2023 Core Earnings Per Share(1) Commercial Banking Segment Mortgage Banking Segment 37.86 12.77 (60) (40) (20) 0 20 40 60 80 100 Share Price Performance 5-year Horizon December 31, 2018 - December 31, 2023 VBFC-Share Price (Daily)(%) KBW Nasdaq Bank Index Price-Index Value (Daily)(%) 10

GRAPHIC

PTPP Income Growth (1) Non-GAAP financial measure. See GAAP to Non-GAAP financial measure reconciliation at the end of this presentation. $3,070 $2,267 $1,816 $1,967 $2,460 $2,682 $1,865 $1,513 $(3,307) $2,144 $(6,000) $(5,000) $(4,000) $(3,000) $(2,000) $(1,000) $- $1,000 $2,000 $3,000 $4,000 Q4 2022 Q1 2023 Q2 2023 Q3 2023 Q4 2023 Pre-Tax Pre-Provision Income Growth(1) (dollars in thousands) Banking Segment PTPP Loss Trade Impact Mortgage Segment Pre-Tax PTPP income increased by 25.06% from Q3 2023, primarily as a result of the loss trade completed near the end of Q3 2023. 11

GRAPHIC

Net Interest Margin • NIM driven by: • Strategically deploying excess liquidity to minimize negative arbitrage from the high levels of liquid assets. • Maintain our disciplined pricing approach to funding sources and loans. • Executed a securities repositioning during Q3 2023, which resulted in a one-time loss of $4,986,000; however, the transaction is expected to be 19.5% accretive to EPS, add 39 basis point to NIM, and 217 basis points to return on tangible common equity, with an earn-back of just over two and one half years. • Liquidity deployed in efficient manner by: • Looking to quality of earnings for the long-term vs. quantity of earnings in the short-term. • Opportunistic approach to deploying funds in the investment portfolio, with a focus on highly liquid assets that are directly or indirectly guaranteed by the U.S. government. • Focused on core loan growth and becoming the bank of choice for small business in our markets. • Balance sheet positioned managing the risk of falling rates in the next 12 – 18 months. 3.68% 3.41% 3.76% 3.67% 3.65% 4.75% 4.12% 4.08% 3.92% 4.80% 1.09% 0.72% 0.33% 0.26% 1.19% 0.00% 1.00% 2.00% 3.00% 4.00% 5.00% 6.00% 2019 2020 2021 2022 2023 Net Interest Margin Net Interest Margin Yield on Earning Assets Cost of Funds $506,202 $675,425 $715,434 $689,487 $702,051 13.45% 12.88% 27.40% 22.73% 14.70% 0.00% 5.00% 10.00% 15.00% 20.00% 25.00% 30.00% 35.00% 40.00% 45.00% $0 $100,000 $200,000 $300,000 $400,000 $500,000 $600,000 $700,000 $800,000 2019 2020 2021 2022 2023 Thousands Earnings Asset Mix Due from other banks Federal funds sold Investments LHFI LHFS Liquidity Ratio 12

GRAPHIC

Deposit Portfolio • Total deposits decreased by $19,398,000, or 3.10%, from December 31, 2022. • The decrease in deposits was driven by a combination of consumers and businesses drawing down balances due to increased pressure from high inflation, as well as seasonal reductions due to year-end payouts. • The increase in the cost of deposits during 2023 was the result of increased rate pressures in our market. Due to our strong core deposit base and disciplined approached to our funding strategy our beta on our cost of total deposits was 19.62% from December 31, 2021 through December 31, 2023. This period saw an increase in the Federal Funds Rate of 525 basis points. $443,208 $588,382 $664,048 $624,743 $605,345 0.85% 0.57% 0.25% 0.16% 0.85% 0.00% 0.50% 1.00% 1.50% 2.00% $- $100,000 $200,000 $300,000 $400,000 $500,000 $600,000 $700,000 2019 2022 2021 2022 2023 Deposit Growth (dollars in thousands) Non-interest bearing deposits Low cost interest bearing deposits Time deposits Cost of total deposits 0.71% 8.21% 19.60% 25.52% 32.38% 0.34% 0.70% 1.29% 1.65% 2.01% 0.00% 0.50% 1.00% 1.50% 2.00% 2.50% 0.00% 5.00% 10.00% 15.00% 20.00% 25.00% 30.00% 35.00% Q4 2022 Q1 2023 Q2 2023 Q3 2023 Q4 2023 Interest Bearing Deposit Beta History Cummulative Int-Bear Deposit Beta Average Rate 0.47% 4.84% 11.80% 15.62% 19.62% 0.20% 0.41% 0.77% 1.00% 1.21% 0.00% 0.20% 0.40% 0.60% 0.80% 1.00% 1.20% 1.40% 1.60% 0.00% 5.00% 10.00% 15.00% 20.00% 25.00% Q4 2022 Q1 2023 Q2 2023 Q3 2023 Q4 2023 Total Deposit Beta History Cummulative Total Deposit Beta Average Rate 13

GRAPHIC

Securities Portfolio $133,853 $135,953 $132,235 $104,046 $105,585 $147,603 $147,827 $145,421 $114,233 $112,678 2.10% 2.18% 2.14% 2.37% 3.87% 0.00% 1.00% 2.00% 3.00% 4.00% 5.00% 6.00% 7.00% $- $20,000 $40,000 $60,000 $80,000 $100,000 $120,000 $140,000 $160,000 Q4 2022 Q1 2023 Q2 2023 Q3 2023 Q4 2023 Book Value vs. Market Value (dollars in thousands) Market Value Mark Yiled on Securities The Company executed a securities repositioning during Q3 2023 of $55.2 million in securities with a weighted average rate of 1.48% at a pretax loss of $5.0 million. The transaction was structured to improve the forward run rate on earnings, add interest rate risk protection to a higher for longer and potential down rate environments, while improving tangible common equity and maintaining our strong liquidity position. Proceeds were used to pay down $15.0 million in outstanding borrowings and the remainder was re-invested at weighted average yield of 5.48%, with a duration of 3.4 years and a weighted average life of 5.0 years. As of December 31, 2023, all securities were classified as available for sale and the portfolio had a total duration of 3.26 years and weighted average life of 5.34 years. $20.0 million of U.S. Treasury securities are set to mature January 31, 2024. These securities carry a weighted average rate of 1.50%, and the Company anticipates using these funds to either paydown high costs borrowings or re-invest in higher yielding assets thus having a positive impact on net interest margin during the first quarter of 2024. 14

GRAPHIC

Loan Portfolio Core loans, which are total loans, excluding PPP loans, increased by $36,774,000, or 6.83%, from December 31, 2022. The commercial loan portfolio, excluding PPP loans, increased by $4,390,000, or 1.05%, from December 31, 2022. Growth in the portfolio was impacted by several large payoffs that occurred during the period, which carried below current market rates. These payoffs were supplemented by new originations at more attractive market rates. Non-Owner Occupied Office represents 3.57% of total loans and is predominately small suburban office space. The consumer/residential loan portfolio grew by $34,851,000, or 37.20%, from December 31, 2022. The growth was driven by growth in 1-4 family residential loans, which was primarily in purchase money adjustable-rate mortgages, and home equity loans. $429,295 $561,003 $526,457 $538,427 $575,008 5.12% 4.44% 4.71% 4.65% 5.27% 0.00% 1.00% 2.00% 3.00% 4.00% 5.00% 6.00% 7.00% 8.00% 9.00% 10.00% $- $100,000 $200,000 $300,000 $400,000 $500,000 $600,000 $700,000 2019 2020 2021 2022 2023 Loan Growth (dollars in thousands) Core Loans PPP Loans Yield on Loans 3.53% 5.26% 9.60% 11.24% 12.57% 4.91% 5.01% 5.24% 5.35% 5.42% 4.75% 4.95% 5.15% 5.35% 5.55% 5.75% 5.95% 0.00% 2.00% 4.00% 6.00% 8.00% 10.00% 12.00% 14.00% Q4 2022 Q1 2023 Q2 2023 Q3 2023 Q4 2023 Loan Beta History Cummulative Loan Beta Average Rate 15

GRAPHIC

Our credit strategy is to deliver best quartile asset quality in the worst part of the cycle… (1) Source - SNL data for VA Banks <$1 Billion in assets as of September 30, 2023. (2) Annualized. • We believe stable credit quality and improving economic factors and improved credit metrics support the adequacy of our allowance for loan and lease losses. • ASC 326 (CECL) was implemented January 1, 2023,which resulted in an increase of $150,000 to the allowance for credit losses (ACL). The ACL included an allowance for loan losses of $3.24 million and a reserve for unfunded commitments of $277,000, as of January 1, 2023. • As of December 31, 2023, the ACL included an allowance for loan losses of $3.42 million and a reserve for unfunded commitments of $306,000. • Credit metrics continue to compare favorably to our peer group. • Non-performing assets decreased to 0.04% of total assets as of December 31, 2023 compared to 0.09% as of December 31, 2022. • ACLL to Loans (excluding PPP loans) decreased to 0.60% as of December 31, 2023 compared to 0.62% as of December 31, 2022. $429,295 $561,003 $526,457 $538,427 $575,008 0.88% 0.95% 0.79% 0.62% 0.60% 0.00% 0.20% 0.40% 0.60% 0.80% 1.00% 1.20% 1.40% $- $100,000 $200,000 $300,000 $400,000 $500,000 $600,000 $700,000 2019 2020 2021 2022 2023 ACLL to Loans (excluding PPP) (dollars in thousands) Total loans ACLL to loans (excluding PPP) Asset Quality Metrics Metric Village Peer Group Q4 2023 Q3 2023 Q2 2023 Q1 2023 Q4 2022 Q3 2023(1) Allowance for Credit Losses on Loans/Total Loans 0.59% 0.59% 0.58% 0.61% 0.63% 1.10% Allowance for Credit Losses on Loans/Nonperforming Loans 1,176.12% 1,120.23% 1,139.05% 555.47% 515.16% 262.00% Net Charge-offs (recoveries) to Average Loans(2) (0.00%) (0.11%) (0.00%) (0.00%) (0.00%) 0.05% Nonperforming Loans/Loans (excluding Guaranteed Loans) 0.06% 0.06% 0.06% 0.12% 0.13% 0.51% Nonperforming Assets/Bank Total Assets 0.04% 0.04% 0.04% 0.08% 0.09% 0.26% 16

GRAPHIC

Mortgage Banking Segment Opportunities • Continue purchase money focus • Provide sales team tools and marketing to support in current environment • Portfolio product introduced November 2022 • Expense reduction initiatives to lower break even to match anticipated rates and volume in coming quarters • Counter cyclical business to commercial bank (1) Source - Mortgage Bankers Association * Mortgage Banking Segment $162,111 $203,497 $369,818 $163,444 $115,216 $0 $100,000 $200,000 $300,000 $400,000 2019 2020 2021 2022 2023 Mortgage Banking Segment Originations (dollars in thousands) Purchase Refinance 82% 66% 54% 55% 62% 41% 85% 70% 92% 81% 18% 34% 46% 45% 38% 59% 15% 30% 8% 19% 0% 10% 20% 30% 40% 50% 60% 70% 80% 90% 100% MBS* Industry Avg. MBS* Industry Avg. MBS* Industry Avg. MBS* Industry Avg. MBS* Industry Avg. 2019 2020 2021 2022 2023 Loan Originations - Purchase vs. Refinance(1) Purchase Refinance 17

GRAPHIC

Technology Roadmap • FedNOW – Real Time Payments • AutoBooks for small business • Webchat to support customer service • DNS-SEC • Internal data storage clean-up • ESign for retail acct opening • ESign for often used customer docs • Printer upgrades at each Branch • POE Switch Replacements • Phone System Replacement Analysis for 2025 • Improved Branch Physical Security • Core Operational Review • Windows 11 2025 • Implementing Fraud Detection Software • Conduct full operational reviews of processes, tools, data, and technology across all business lines to maximize efficiency • Expand API’s – Subscription Commerce • Wireless Access Point Upgrades • Begin review of Core Contract 2023 • Boardroom and meeting room tech refresh • SD-WAN Network Improvements • Expanded Backup, Archive and Email Protection • Expanded Vulnerability Scanning capabilities • ATM Fleet Overhaul complete • Contactless Debit & Credit Cards • Enhanced Data Protection & Reporting • Teller Equipment Replacements • Implemented Credit Manager for OLB • Enhanced Fraud Detection & Prevention • Data analytics • CRM/LOS 2024 2026 • Continue review of Core Contract • Seamless banking – Looking at what is next:: wearables and biometrics 18

GRAPHIC

Board of Directors Craig Bell Chairman Since 1998 Frank Jenkins Director Since 2017 Mike Katzen Director Since 2008 Mike Toalson Director Since 2004 Devon Henry Director Since 2018 Mary Margaret Kastelberg Director Since 2020 Jay Hendricks President & Chief Executive Officer Since 2020 Ron Carey Director Since 2023 Trudy Sanderson Director Since 2023 19

GRAPHIC

Management Team Jay Hendricks President & Chief Executive Officer Donnie Kaloski Chief Financial Officer & Chief Risk Officer Max Morehead Commercial Banking • CEO and President of the Company and the Bank since August 2020. • Previously Chief Operating Officer and Chief Risk Officer of the Bank since December 2016. • Joined as Chief Credit Officer of the Bank in September 2013. • 23 years with SunTrust/Crestar including roles as Chief Operational Risk Officer for mortgage and Credit and Compliance Officer for consumer banking. • Prior to 1990, served as Bank Examiner for the Comptroller of the Currency. • More than 30 years experience in the banking industry. • Chief Financial Officer of the Company and the Bank since May 2018. Chief Risk Officer of the Bank since August 2020. • Previously served as Senior Vice President of Accounting of the Bank. • From 2007 to 2013 supervised audit teams on financial institutions throughout the country with BDO USA, LLP. • Holds a BA in Accounting and an MBA from Troy University. • Is a Certified Public Accountant and Charted Global Management Accountant. • More than 15 years experience in the accounting and banking industry. • Executive Vice President – Commercial Banking since March 2014. • 25 years with SunTrust/Crestar including leadership roles in commercial banking. • More than 30 years experience in the banking industry. 20

GRAPHIC

Management Team, continued Jennifer Church Retail Banking Christy Quesenbery Operations Roy Barzel Chief Credit Officer Clif Winn President & CEO Village Bank Mortgage Corp • Executive Vice President – Retail Banking of the Bank since March 2022. • Prior to joining the Bank served as Vice President Market Leader with BB&T from September 2018 – March 2022, and prior thereto, she served in various positions with Union Bank & Trust from 2007 to 2018, including Retail Support Manager, Senior Retail Operations Consultant and Branch Manager. • More than 20 years experience in the banking industry. • President and Chief Executive Officer of Village Bank Mortgage Corporation since December 2017. • Member of mortgage leadership team since 2009. Served as Senior Vice President and Risk Manager. • From 1998 until 2009 served in several leadership roles with Benchmark Mortgage. • More than 20 years mortgage banking experience. • Executive Vice President – Operations since August 2020. • Prior to joining the Bank served as Chief Operations Officer at Touchstone Bank since 2016. • Held various leadership roles during her career around operations, information technology, compliance, and risk management. • More than 35 years experience in the banking industry. • Chief Credit Officer of the Bank since August 2020. • Previously served as Senior Vice President and Director of Strategic Initiatives since 2017. • Prior to joining the Bank served in commercial banking leadership roles with Bank of Virginia and SunTrust/Crestar. • More than 35 years experience in the banking industry. 21

GRAPHIC

Reconciliation of Non-GAAP Financial Measures Reconciliation of Non-GAAP Financial Measures (dollars in thousands, except per share amounts) * Reference notes on following page. 22 GAAP Operating Results by Segment 2019 2020 2021 2022 2023 Pre-tax earnings by segment Commercial banking $ 4,402 $ 6,058 $ 11,355 $ 10,894 $ 3,474 Mortgage banking 1,239 4,981 4,518 (599) (1,309) Income before income tax expense 5,641 11,039 15,873 10,295 2,165 Commercial banking income tax expense 904 1,439 2,472 2,116 522 Mortgage banking income tax expense (benefit) 260 1,046 948 (126) (275) Net Income $ 4,477 $ 8,554 $ 12,453 $ 8,305 $ 1,918 Core Operating Results by Segment(1) 2019 2020 2021 2022 2023 Commercial banking GAAP pre-tax earnings $ 4,402 $ 6,058 $ 11,355 $ 10,894 $ 3,474 Non-core (income) expense items Salaries and benefits(2) 760 - - - - Branch write-down 22 - - - - (Gain)/loss on sale of securities (101) (12) - - 4,986 Other non-core expense(3) 55 696 - - - Commercial banking operating income 5,138 6,742 11,355 10,894 8,460 Mortgage banking GAAP pre-tax earnings (loss) 1,239 4,981 4,518 (599) (1,309) Non-core expense items Salaries and benefits(2) 54 - - - - Mortgage banking operating income (loss) 1,293 4,981 4,518 (599) (1,309) Core operating income before income tax expense 6,431 11,723 15,873 10,295 7,151 Commercial banking income tax expense(4) 1,059 1,583 2,472 2,116 1,569 Mortgage banking income tax expense (benefit)(4) 271 1,046 948 (126) (275) Core operating net income $ 5,101 $ 9,094 $ 12,453 $ 8,305 $ 5,857

GRAPHIC

Reconciliation of Non-GAAP Financial Measures Reconciliation of Non-GAAP Financial Measures (dollars in thousands, except per share amounts) Reference notes for GAAP to Core Operating Income (1) Non-GAAP financial measure. (2) The Company recognized $814,000 in additional compensation expense during Q2 2019, as a result of the accelerated vesting of restricted stock awards and retirement benefits as disclosed in the Company's Form 8-K filed on June 25, 2019. (3) Other non-core expense is composed of the write-off of premiums associated with United States Department of Agriculture Loans, $139,000 during 2018, $12,000 during 2019, and additional audit and tax fees of $23,000 during 2018 and $43,000 during 2019 associated with the transition of our external auditors during 2018. 2020 includes $696,000 in prepayment fees associated with the early pay-off of the then $31 million outstanding in FHLB Advances. (4) Income tax expense was adjusted for the non-core items at the corporate tax rate of 21%. 23

GRAPHIC

Reconciliation of Non-GAAP Financial Measures Reconciliation of Non-GAAP Financial Measures (dollars in thousands, except per share amounts) (1) Non-GAAP financial measure (2) Derived from the Core Operating Results by Segment table. 2019 2020 2021 2022 2023 ROTCE Average shareholder's equity $ 40,111 $ 47,572 $ 59,256 $ 61,336 $ 63,862 Less: average preferred stock - - - - - Average tangible common equity $ 40,111 $ 47,572 $ 59,256 $ 61,336 $ 62,673 Net income available to common shareholders Consolidated $ 4,477 $ 8,554 $ 12,453 $ 8,305 $ 1,918 Commercial Banking Segment 3,498 4,619 8,883 8,778 2,952 Mortgage Banking Segment $ 979 $ 3,935 $ 3,570 $ (473) $ (1,034) Return on Tangible Common Equity Consolidated 11.16% 17.98% 21.02% 13.54% 3.06% Commercial Banking Segment 8.72% 9.71% 14.99% 14.31% 4.71% Mortgage Banking Segment 2.44% 8.27% 6.02% (0.77%) (1.65%) Core ROTCE Operating income available to common shareholders (1) Consolidated $ 5,101 $ 9,094 $ 12,453 $ 8,305 $ 5,857 Commercial Banking Segment $ 4,079 $ 5,159 $ 8,883 $ 8,778 $ 6,891 Mortgage Banking Segment $ 1,022 $ 3,935 $ 3,570 $ (473) $ (1,034) Return on Tangible Common Equity Consolidated 12.72% 19.12% 21.02% 13.54% 9.35% Commercial Banking Segment 10.17% 10.85% 14.99% 14.31% 11.00% Mortgage Banking Segment 2.55% 8.27% 6.02% (0.77%) (1.65%) 24

GRAPHIC

Reconciliation of Non-GAAP Financial Measures Reconciliation of Non-GAAP Financial Measures (in thousands, except per share amounts) (1) Derived from the Core Operating Results by Segment table. (2) Non-GAAP financial measure. 2019 2020 2021 2022 2023 GAAP earnings per share Weighted Average Share Outstanding 1,445 1,459 1,468 1,477 1,486 Net income (loss) available to common shareholders Consolidated $ 4,477 $ 8,554 $ 12,453 $ 8,305 $ 1,918 Commercial Banking Segment 3,498 4,619 8,883 8,778 2,952 Mortgage Banking Segment $ 979 $ 3,935 $ 3,570 $ (473) $ (1,034) GAAP earnings per share Consolidated $ 3.10 $ 5.86 $ 8.48 $ 5.62 $ 1.29 Commercial Banking Segment $ 2.42 $ 3.17 $ 6.05 $ 5.94 $ 1.99 Mortgage Banking Segment $ 0.68 $ 2.70 $ 2.43 $ (0.32) $ (0.70) Core earnings per share Operating income available to common shareholders (1)(2) Consolidated $ 5,101 $ 9,094 $ 12,453 $ 8,305 $ 5,857 Commercial Banking Segment 4,079 5,159 8,883 8,778 6,891 Mortgage Banking Segment $ 1,022 $ 3,935 $ 3,570 $ (473) $ (1,034) Core earnings per share Consolidated $ 3.53 $ 6.23 $ 8.48 $ 5.62 $ 3.94 Commercial Banking Segment $ 2.82 $ 3.54 $ 6.05 $ 5.94 $ 4.64 Mortgage Banking Segment $ 0.71 $ 2.70 $ 2.43 $ (0.32) $ (0.70) 25

GRAPHIC

Reconciliation of Non-GAAP Financial Measures Reconciliation of Non-GAAP Financial Measures (in thousands, except per share amounts) (1) Non-GAAP financial measure. Q4 2022 Q1 2023 Q2 2023 Q3 2023 Q4 2023 Pre-Tax Earnings by Segment Commercial banking - PTPP (ex. loss trade impact)(1) $ 3,070 $ 2,267 $ 1,816 $ 1,967 $ 2,410 Loss Trade Impact - - - (4,986) - Commercial banking income (loss) before income tax expense 3,070 2,267 1,816 (3,019) 2,410 Mortgage banking loss before income tax benefit (388) (402) (303) (288) (316) Income (loss) before provision for credit losses and income tax expense (benefit) 2,682 1,865 1,513 (3,307) 2,144 Provision for recovery of credit losses - - - - 50 GAAP income before income tax expense (benefit) $ 2,682 $ 1,865 $ 1,513 $ (3,307) $ 2,094 26

v3.23.4
Document and Entity Information
Jan. 26, 2024
Cover [Abstract]  
Document Type 8-K
Written Communications false
Soliciting Material false
Pre-commencement Tender Offer false
Pre-commencement Issuer Tender Offer false
Document Period End Date Jan. 26, 2024
Securities Act File Number 0-50765
Entity Registrant Name VILLAGE BANK AND TRUST FINANCIAL CORP.
Entity Incorporation, State or Country Code VA
Entity Tax Identification Number 16-1694602
Entity Address, State or Province VA
Entity Address, Address Line One 13319 Midlothian Turnpike
Entity Address, City or Town Midlothian
Entity Address, Postal Zip Code 23113
City Area Code 804
Local Phone Number 897-3900
Title of 12(b) Security Common Stock, par value $4.00 per share
Trading Symbol VBFC
Security Exchange Name NASDAQ
Entity Emerging Growth Company false
Entity Central Index Key 0001290476
Amendment Flag false
v3.23.4
N-2
Jan. 26, 2024
Cover [Abstract]  
Entity Central Index Key 0001290476
Amendment Flag false
Securities Act File Number 0-50765
Document Type 8-K
Entity Registrant Name VILLAGE BANK AND TRUST FINANCIAL CORP.
Entity Address, Address Line One 13319 Midlothian Turnpike
Entity Address, City or Town Midlothian
Entity Address, State or Province VA
Entity Address, Postal Zip Code 23113
City Area Code 804
Local Phone Number 897-3900
Entity Emerging Growth Company false

Village Bank and Trust F... (NASDAQ:VBFC)
Historical Stock Chart
From Mar 2024 to Apr 2024 Click Here for more Village Bank and Trust F... Charts.
Village Bank and Trust F... (NASDAQ:VBFC)
Historical Stock Chart
From Apr 2023 to Apr 2024 Click Here for more Village Bank and Trust F... Charts.