UNITED STATES
SECURITIES AND EXCHANGE COMMISSION
WASHINGTON, D.C. 20549
__________________
FORM 8-K
CURRENT REPORT PURSUANT
TO SECTION 13 OR 15(d) OF THE
SECURITIES EXCHANGE ACT OF 1934
__________________
Date of Report (Date of earliest event reported) January 28, 2016
AVNET, INC.
(Exact name of registrant as specified in its charter)
|
New York
|
|
1-4224
|
|
11-1890605
|
|
(State or other jurisdiction
|
|
(Commission
|
|
(IRS Employer
|
|
Of incorporation)
|
|
File Number)
|
|
Identification No.)
|
|
2211 South 47th Street, Phoenix, Arizona
|
|
85034
|
|
(Address of principal executive offices)
|
|
(Zip Code)
|
(480) 643-2000
(Registrant’s telephone number, including area code.)
N/A
(Former name and former address, if changed since last report.)
Check the appropriate box below if the Form 8-K filing is intended to simultaneously satisfy the filing obligation of the registrant under any of the following provisions (see General Instruction A.2. below):
☐Written communications pursuant to Rule 425 under the Securities Act (17 CFR 230.425)
☐Soliciting material pursuant to Rule 14a-12 under the Exchange Act (17 CFR 240.14a-12)
☐Pre-commencement communications pursuant to Rule 14d-2(b) under the Exchange Act (17 CFR 240.14d-2(b))
☐Pre-commencement communications pursuant to Rule 13e-4(c) under the Exchange Act (17 CFR 240.13.e-4(c))
Item 2.02.Results of Operations and Financial Condition.
On January 28, 2016, Avnet, Inc. issued a press release announcing its second quarter results of operations for fiscal 2016. A copy of the press release is attached hereto as Exhibit 99.1 and is incorporated by reference herein.
Also attached is the CFO Review of Fiscal 2016 Second Quarter Results as Exhibit 99.2 and is incorporated by reference herein.
The information in this Current Report on Form 8-K and the exhibits attached hereto are being furnished and shall not be deemed “filed” for purposes of Section 18 of the Securities Exchange Act of 1934 or otherwise subject to the liabilities of that section, nor shall they be deemed incorporated by reference in any filing under the Securities Act of 1933 except as shall be expressly set forth in such filing.
Item 9.01 Financial Statements and Exhibits.
(d) Exhibits.
The following materials are attached as exhibits to this Current Report on Form 8-K:
|
|
|
|
|
Exhibit
Number
|
|
Description
|
|
|
|
|
|
99.1
|
|
Press Release, dated January 28, 2016.
|
|
99.2
|
|
CFO Review of Fiscal 2016 Second Quarter Results.
|
SIGNATURES
Pursuant to the requirements of the Securities Exchange Act of 1934, the registrant has duly caused this report to be signed on its behalf by the undersigned hereunto duly authorized.
|
|
|
|
|
|
|
Date: January 28, 2016
|
|
AVNET, INC.
|
|
|
|
Registrant
|
|
|
|
|
|
|
|
By:
|
|
/s/ Kevin Moriarty
|
|
|
|
|
|
Name: Kevin Moriarty
|
|
|
|
|
|
Title: Senior Vice President and
|
|
|
|
|
|
Chief Financial Officer
|
Exhibit 99.1
|
|
|
|
|
|
|
Avnet, Inc.
2211 South 47th Street
Phoenix, AZ 85034
|
|
PRESS RELEASE
|
|
|
Avnet, Inc. Reports Second Quarter Fiscal Year 2016 Results
Year-Over-Year Margin Expansion
Despite Softer Demand in the Americas Region
Phoenix, January 28, 2016 - Avnet, Inc. (NYSE:AVT) today announced results for the second quarter fiscal year 2016 ended January 2, 2016.
Q2 Fiscal 2016 Results
|
|
|
|
|
|
|
|
|
|
|
|
|
|
SECOND QUARTERS ENDED
|
|
|
|
|
January 2, 2016
|
|
December 27, 2014
|
|
Change
|
|
|
|
|
$ in millions, except per share data
|
|
|
Sales
|
|
$
|
6,848.1
|
|
$
|
7,551.9
|
|
(9.3)
|
%
|
|
Constant Currency (1)
|
|
|
|
|
|
|
|
(5.1)
|
%
|
|
|
|
|
|
|
|
|
|
|
|
|
GAAP Operating Income
|
|
|
226.1
|
|
|
250.3
|
|
(9.7)
|
%
|
|
Adjusted Operating Income (2)
|
|
|
255.3
|
|
|
274.6
|
|
(7.0)
|
%
|
|
|
|
|
|
|
|
|
|
|
|
|
GAAP Net Income
|
|
|
156.0
|
|
|
163.7
|
|
(4.7)
|
%
|
|
Adjusted Net Income (2)
|
|
|
164.3
|
|
|
176.0
|
|
(6.6)
|
%
|
|
|
|
|
|
|
|
|
|
|
|
|
GAAP Diluted EPS
|
|
$
|
1.16
|
|
$
|
1.18
|
|
(1.7)
|
%
|
|
Adjusted Diluted EPS (2)
|
|
$
|
1.22
|
|
$
|
1.27
|
|
(3.9)
|
%
|
|
(1)
| |
Year-over-year sales growth rate excluding the impact of changes in foreign currency exchange rates. |
|
(2)
| |
A reconciliation of non-GAAP financial measures to GAAP financial measures is presented in the Non-GAAP Financial Information section in this press release. |
|
·
| |
Sales for the quarter ended January 2, 2016, decreased 9.3% year over year and 5.1% in constant currency to $6.85 billion, organic sales (as defined later in this release) declined 9.7% year over year and 5.5% in constant currency |
|
·
| |
Adjusted operating income of $255.3 million decreased 7.0% year over year and adjusted operating income margin of 3.7% increased 9 basis points year over year |
|
·
| |
Adjusted net income of $164.3 million decreased 6.6% and adjusted diluted earnings per share of $1.22 decreased 3.9% year over year |
|
·
| |
Adjusted diluted earnings per share was negatively impacted by approximately $0.07, or 5.5%, from the impact of changes in foreign currency exchange rates from the year ago quarter |
|
·
| |
The Company repurchased approximately 900,000 shares during the second quarter representing an aggregate investment of $39.9 million and has invested an additional $65 million thus far in the third quarter |
Rick Hamada, Chief Executive Officer, commented, “Our team stayed focused on profitability as both gross profit and adjusted operating income margins expanded year over year even as revenue came in near the low end of expectations due to weaker demand in the Americas region. This softness resulted in below seasonal sequential growth and revenue declined 5.1% year over year in constant currency. Our EMEA region continued their multi-quarter growth trend as revenue increased 3.5% year over year in constant currency led by continued strength in our Electronics Marketing (EM) business. The focus on profitable growth and continued portfolio management at Technology Solutions (TS) helped drive enterprise gross profit margin up 27 basis points year over year. This improvement in gross profit margin and continued expense reductions were offset by the translation impact of the stronger U.S. Dollar as operating income declined 7% year over year in reported dollars and 0.8% in constant currency. While economic indicators suggest a slower growth environment as we enter calendar 2016, we continue to invest in our organic growth initiatives including Internet of Things, embedded solutions, and third platform technologies. Finally, given our strong cash flow and disciplined share repurchase program, we are taking advantage of the current market pullback to increase the investment in our equity."
Avnet Electronics Marketing Results
|
|
|
|
|
|
|
|
|
|
|
|
|
|
|
|
|
|
|
Year-over-Year Growth Rates
|
|
|
|
|
Q2 FY16
|
|
Reported
|
|
|
Organic
|
|
|
|
|
Sales
|
|
Sales
|
|
|
Sales
|
|
|
|
|
|
(in millions)
|
|
|
|
|
|
|
|
|
EM Total
|
|
$
|
4,114.6
|
|
|
(7.2)
|
%
|
|
(7.2)
|
%
|
|
Constant Currency (1)
|
|
|
|
|
|
(3.4)
|
%
|
|
(3.4)
|
%
|
|
Americas
|
|
$
|
1,125.1
|
|
|
(6.3)
|
%
|
|
(6.3)
|
%
|
|
EMEA
|
|
$
|
1,141.1
|
|
|
(5.3)
|
%
|
|
(5.3)
|
%
|
|
Constant Currency (1)
|
|
|
|
|
|
7.5
|
%
|
|
7.5
|
%
|
|
Asia
|
|
$
|
1,848.4
|
|
|
(8.9)
|
%
|
|
(8.9)
|
%
|
|
Constant Currency (1)
|
|
|
|
|
|
(8.3)
|
%
|
|
(8.3)
|
%
|
|
|
|
|
|
|
|
|
|
|
|
|
|
|
|
|
Q2 FY16
|
|
Q2 FY15
|
|
Change
|
|
Operating Income
|
|
$
|
174.0
|
|
|
$
|
191.4
|
|
|
(9.1)
|
%
|
|
Operating Income Margin
|
|
|
4.2
|
%
|
|
|
4.3
|
%
|
|
(9)
|
bps
|
|
(1)
| |
Year-over-year sales growth rate excluding the impact of changes in foreign currency exchange rates. |
|
·
| |
Sales decreased 3.4% in constant currency and reported sales decreased 7.2% year over year to $4.11 billion |
|
·
| |
Operating income decreased 9.1% year over year to $174.0 million and operating income margin decreased 9 basis points as strength in the EMEA region was offset by weakness in Americas and Asia |
|
·
| |
Working capital (defined as receivables plus inventories less accounts payables) was essentially flat sequentially and inventory declined 5.6% from the September quarter |
Mr. Hamada added, “In our December quarter, EM’s revenue was at the low end of expectations due to slower than expected sequential growth in our high volume supply chain engagements in Asia and weaker demand in industrial markets in our Americas region. As a result, revenue declined 7.6% sequentially in constant currency (1% excluding the extra week in our September quarter) and 3.4% year over year. Year-over-year declines in our Asia and Americas regions were partially offset by
another strong quarter in our EMEA region where revenue grew 7.5% in constant currency. Our EMEA team leveraged their multi-quarter trend of organic growth into improved profitability as operating income grew nearly twice as fast as revenue in constant currency and operating income margin expanded year over year for the seventh consecutive quarter. Despite this performance in EMEA, EM’s operating income declined 9.1% from the year ago quarter driven by the declines in the other regions and the translation impact of the stronger U.S. Dollar. Our book to bill ratio of 0.98 to 1.0 finished below parity for the third consecutive quarter. In this environment of slower growth and mixed economic signals, we will continue to focus on aligning our resources with current market conditions.”
Avnet Technology Solutions Results
|
|
|
|
|
|
|
|
|
|
|
|
|
|
|
|
|
|
|
Year-over-Year Growth Rates
|
|
|
|
|
Q2 FY16
|
|
Reported
|
|
|
Organic
|
|
|
|
|
Sales
|
|
Sales
|
|
|
Sales
|
|
|
|
|
(in millions)
|
|
|
|
|
|
|
|
TS Total
|
|
$
|
2,733.4
|
|
|
(12.3)
|
%
|
|
(13.2)
|
%
|
|
Constant Currency (1)
|
|
|
|
|
|
(7.6)
|
%
|
|
(8.5)
|
%
|
|
Americas
|
|
$
|
1,625.4
|
|
|
(12.2)
|
%
|
|
(12.2)
|
%
|
|
EMEA
|
|
$
|
794.4
|
|
|
(7.3)
|
%
|
|
(10.6)
|
%
|
|
Constant Currency (1)
|
|
|
|
|
|
1.7
|
%
|
|
(2.0)
|
%
|
|
Asia
|
|
$
|
313.6
|
|
|
(23.3)
|
%
|
|
(23.3)
|
%
|
|
Constant Currency (1)
|
|
|
|
|
|
(15.5)
|
%
|
|
(15.5)
|
%
|
|
|
|
|
|
|
|
|
|
|
|
|
|
|
|
|
Q2 FY16
|
|
Q2 FY15
|
|
Change
|
|
Operating Income
|
|
$
|
117.1
|
|
|
$
|
117.6
|
|
|
(0.4)
|
%
|
|
Operating Income Margin
|
|
|
4.3
|
%
|
|
|
3.8
|
%
|
|
51
|
bps
|
|
(1)
| |
Year-over-year sales growth rate excluding the impact of changes in foreign currency exchange rates. |
|
·
| |
Reported sales decreased 7.6% in constant currency and reported sales decreased 12.3% year over year to $2.73 billion, organic sales declined 13.2% year over year and 8.5% in constant currency |
|
·
| |
Operating income decreased 0.4% to $117.1 million and operating income margin increased 51 basis points year over year to 4.3% |
|
·
| |
ROWC increased 318 basis points year over year primarily due to continued progress in EMEA and the realized benefits from portfolio actions taken in prior quarters |
|
·
| |
At a product level, year-over-year growth in networking, software, and services was offset by a decline in storage and computing components |
Mr. Hamada further added, "TS experienced a weaker than expected close in our Americas region, which led to below seasonal growth in the typically strong December quarter. Revenue declined 12.2% year over year in our Americas region driven by declines in storage and computing components, coupled with softer demand in Latin America. This resulted in TS sequential growth of 19.6% (after adjusting for currency and the extra week in the September quarter) as compared with our typical seasonal growth of 26% to 30%. TS EMEA’s organic revenue declined 2% year over year in constant currency as 5% growth in our core business was offset by a decline in our computing components business. TS Asia’s revenue declined 23% year over year with a third of this decline related to the translation impact of the stronger U.S. Dollar. Despite this revenue decline, our ongoing
portfolio and expense management had a positive impact on profitability as both gross profit and operating income margins improved year over year in all three regions. For calendar 2015, TS’ operating income margin improved 40 basis points over calendar 2014 to 3.3%, representing meaningful progress toward our target range of 3.4% to 3.9%. With continued momentum at TS EMEA and our investments in higher growth third platform technologies gaining traction, we expect to drive further improvements in margins and returns over time.”
Cash Flow/Dividend
|
·
| |
Cash generated from operations was $118.0 million in the December quarter and for the trailing twelve months cash generated from operations was $443.7 million |
|
·
| |
Cash and cash equivalents at the end of the quarter was $916.1 million; net debt (total debt less cash and cash equivalents) was $1.29 billion |
|
·
| |
During the past twelve months, the Company repurchased 5.7 million shares, or 4.1% of diluted shares outstanding, representing an aggregate investment of $239.6 million |
|
·
| |
Entering the third fiscal quarter, the Company had $367.4 million remaining under the current repurchase authorization |
|
·
| |
The Company paid a dividend of $0.17 per share or $22.4 million during the quarter |
Kevin Moriarty, Chief Financial Officer, stated, “Cash flow from operations for the December quarter was approximately $118 million and $444 million for the trailing twelve months. During the quarter, we repurchased $40 million of our shares and following the recent decline in equity markets, we have invested an additional $65 million in our share repurchase program quarter to date. We still have approximately $303 million remaining in our share repurchase program and are prepared to continue to invest in our stock when it presents a compelling value. Our focus on operating efficiencies, including our Avnet Advantage initiative, contributed toward operating leverage in the first half of fiscal 2016 as adjusted operating expense as a percentage of gross profit declined 106 basis points to 68.4%, compared to the first half of fiscal 2015. We ended the quarter with approximately $916 million in cash, which when combined with our strong cash flow generation, provides ample liquidity to invest in profitable growth going forward.”
Outlook for Third Quarter of Fiscal 2016 Ending on April 2, 2016
|
·
| |
EM sales are expected to be in the range of $3.85 billion to $4.15 billion and TS sales are expected to be in the range of $2.15 billion to $2.45 billion |
|
·
| |
Avnet sales are expected to be in the range of $6.0 billion to $6.6 billion. |
|
·
| |
Adjusted diluted earnings per share is expected to be in the range of $0.93 to $1.03 per share |
|
·
| |
The guidance assumes 134 million average diluted shares outstanding and a tax rate of 26% to 30% |
The above guidance excludes the amortization of intangibles and any potential restructuring, integration and other expenses. In addition, the above guidance assumes that the average U.S. Dollar to Euro currency exchange rate is $1.09 to €1.00. This compares with an average exchange rate of $1.13 to €1.00 in the third quarter of fiscal 2015.
Forward-Looking Statements
This document contains certain “forward-looking statements” within the meaning of Section 27A of the Securities Act of 1933, as amended, and Section 21E of the Securities Exchange Act of 1934, as amended. These statements are based on management’s current expectations and are subject to uncertainty and changes in facts and circumstances. The forward-looking statements herein include statements addressing future financial and operating results of Avnet and may include words such as “will,” “anticipate,” “intend,” “estimate,” “forecast,” “expect,” "feel," “believe,” and “should,” and other words and terms of similar meaning in connection with any discussions of future operating or financial performance, business prospects or market conditions. Actual results may differ materially from the expectations contained in the forward-looking statements.
The following factors, among others, could cause actual results to differ materially from those described in the forward-looking statements: the Company’s ability to retain and grow market share and to generate additional cash flow, risks associated with any acquisition activities and the successful integration of acquired companies, declines in sales, changes in business conditions and the economy in general, changes in market demand and pricing pressures, any material changes in the allocation of product or product rebates by suppliers, and other competitive and/or regulatory factors affecting the businesses of Avnet generally.
More detailed information about these and other factors is set forth in Avnet’s filings with the Securities and Exchange Commission, including the Company’s reports on Form 10-K, Form 10-Q and Form 8-K. Except as required by law, Avnet is under no obligation to update any forward-looking statements, whether as a result of new information, future events or otherwise.
Non-GAAP Financial Information
In addition to disclosing financial results that are determined in accordance with generally accepted accounting principles in the United States (“GAAP”), the Company also discloses in this document certain non-GAAP financial information including adjusted operating income, adjusted operating expenses, adjusted net income and adjusted diluted earnings per share, as well as sales adjusted for the impact of acquisitions and other items (as defined in the Organic Sales section of this document). There are also references to the impact of foreign currency in the discussion of the Company’s results of operations. When the U.S. Dollar strengthens and the stronger exchange rates of the current year are used to translate the results of operations of Avnet’s subsidiaries denominated in foreign currencies, the resulting impact is a decrease in U.S. Dollars of reported results. Conversely, when the U.S. Dollar weakens and the weaker exchange rates of the current year are used to translate the results of operations of Avnet’s subsidiaries denominated in foreign currencies, the resulting impact is an increase in U.S. Dollars of reported results. In the discussion of the Company’s results of operations, results excluding this impact are referred to as “excluding the impact of changes in foreign currency exchange rates” or “constant currency.” Management believes organic sales and sales in constant currency are useful measures for evaluating current period performance as compared with prior periods and for understanding underlying trends. In order to determine the translation impact of changes in foreign currency exchange rates for sales, income or expense items, the Company adjusts the exchange rates used in current periods to be consistent with the exchange rates in effect during prior periods.
Management believes that operating income and operating expenses adjusted for (i) restructuring, integration and other expenses and (ii) amortization of acquired intangible assets and other, are useful measures to help investors better assess and understand the Company’s operating performance, especially when comparing results with previous periods or forecasting performance
for future periods, primarily because management views the excluded items to be outside of Avnet’s normal operating results or non-cash in nature. Management analyzes operating income and operating expenses without the impact of these items as an indicator of ongoing margin performance and underlying trends in the business. Management also uses these non-GAAP measures to establish operational goals and, in many cases, for measuring performance for compensation purposes.
Additional non-GAAP metrics management uses are adjusted operating income margin, which is defined as adjusted operating income (as defined above) divided by sales and adjusted operating expense to gross profit ratio, which is defined as adjusted operating expenses (as defined above) divided by gross profit.
Management also believes net income and diluted EPS adjusted for (i) the impact of the items described above, (ii) certain items impacting other expense and (iii) certain items impacting income tax expense is useful to investors because it provides a measure of the Company’s net profitability on a more comparable basis to historical periods and provides a more meaningful basis for forecasting future performance. Additionally, because of management’s focus on generating shareholder value, of which net profitability is a primary driver, management believes net income and diluted EPS excluding the impact of these items provides an important measure of the Company’s net profitability for the investing public.
Other metrics management monitors in its assessment of business performance include return on working capital (ROWC), return on capital employed (ROCE) and working capital velocity (WC velocity).
|
·
| |
ROWC is defined as annualized adjusted operating income (as defined above) divided by the sum of the monthly average balances of receivables and inventories less accounts payable. |
|
·
| |
ROCE is defined as annualized, tax effected adjusted operating income (as defined above) divided by the monthly average balances of interest-bearing debt and equity (including the impact of adjustments to operating income discussed above) less cash and cash equivalents. |
|
·
| |
WC velocity is defined as annualized sales divided by the sum of the monthly average balances of receivables and inventories less accounts payable. |
Any analysis of results and outlook on a non-GAAP basis should be used as a complement to, and in conjunction with, results presented in accordance with GAAP.
Fiscal 2016
|
|
|
|
|
|
|
|
|
|
|
|
|
|
|
|
|
Fiscal Year 2016
|
|
|
|
|
|
|
Quarters Ended
|
|
|
|
|
|
|
|
January 2,
|
|
October 3,
|
|
|
|
|
Fiscal 2016*
|
|
2016
|
|
2015
|
|
|
|
|
$ in thousands, except per share amounts
|
|
|
GAAP selling, general and administrative expenses
|
|
$
|
1,089,387
|
|
$
|
530,831
|
|
$
|
558,556
|
|
|
Amortization of intangible assets and other
|
|
|
15,412
|
|
|
7,921
|
|
|
7,491
|
|
|
Adjusted operating expenses
|
|
$
|
1,073,975
|
|
$
|
522,910
|
|
$
|
551,065
|
|
|
|
|
|
|
|
|
|
|
|
|
|
|
GAAP operating income
|
|
$
|
433,077
|
|
$
|
226,115
|
|
$
|
206,962
|
|
|
Restructuring, integration and other expenses
|
|
|
47,180
|
|
|
21,222
|
|
|
25,958
|
|
|
Amortization of intangible assets and other
|
|
|
15,412
|
|
|
7,921
|
|
|
7,491
|
|
|
Total adjustments
|
|
|
62,592
|
|
|
29,143
|
|
|
33,449
|
|
|
Adjusted operating income
|
|
$
|
495,669
|
|
$
|
255,258
|
|
$
|
240,411
|
|
|
|
|
|
|
|
|
|
|
|
|
|
|
GAAP net income
|
|
$
|
286,266
|
|
$
|
156,012
|
|
$
|
130,254
|
|
|
Restructuring, integration and other expenses (net of tax)
|
|
|
31,225
|
|
|
14,100
|
|
|
17,125
|
|
|
Amortization of intangible assets and other (net of tax)
|
|
|
10,697
|
|
|
5,513
|
|
|
5,184
|
|
|
Income tax adjustments
|
|
|
(10,916)
|
|
|
(11,295)
|
|
|
379
|
|
|
Total adjustments to net income (net of tax)
|
|
|
31,006
|
|
|
8,318
|
|
|
22,688
|
|
|
Adjusted net income
|
|
$
|
317,273
|
|
$
|
164,330
|
|
$
|
152,942
|
|
|
|
|
|
|
|
|
|
|
|
|
|
|
GAAP diluted EPS
|
|
$
|
2.11
|
|
$
|
1.16
|
|
$
|
0.96
|
|
|
Restructuring, integration and other expenses (net of tax)
|
|
|
0.23
|
|
|
0.10
|
|
|
0.12
|
|
|
Amortization of intangible assets and other (net of tax)
|
|
|
0.08
|
|
|
0.04
|
|
|
0.04
|
|
|
Income tax adjustments
|
|
|
(0.08)
|
|
|
(0.08)
|
|
|
-
|
|
|
Total adjustments to diluted EPS (net of tax)
|
|
|
0.23
|
|
|
0.06
|
|
|
0.16
|
|
|
Adjusted EPS
|
|
$
|
2.34
|
|
$
|
1.22
|
|
$
|
1.12
|
|
* Does not foot due to rounding
Fiscal 2015
|
|
|
|
|
|
|
|
|
|
|
|
|
|
|
|
|
|
|
|
|
|
|
|
Fiscal 2015
|
|
|
|
|
|
|
|
Quarters Ended
|
|
|
|
|
|
|
June 27,
|
|
March 28,
|
|
|
December 27,
|
|
September 27,
|
|
|
|
|
Fiscal 2015*
|
|
2015
|
|
2015
|
|
2014
|
|
2014
|
|
|
|
|
$ in thousands, except per share amounts
|
|
|
GAAP selling, general and administrative expenses
|
|
$
|
2,274,642
|
|
$
|
561,585
|
|
$
|
555,148
|
|
$
|
573,962
|
|
$
|
583,946
|
|
|
Amortization of intangible assets and other
|
|
|
54,049
|
|
|
19,603
|
|
|
11,187
|
|
|
11,052
|
|
|
12,208
|
|
|
Adjusted operating expenses
|
|
$
|
2,220,593
|
|
$
|
541,982
|
|
$
|
543,961
|
|
$
|
562,910
|
|
$
|
571,738
|
|
|
|
|
|
|
|
|
|
|
|
|
|
|
|
|
|
|
|
|
GAAP operating income
|
|
$
|
827,673
|
|
$
|
180,477
|
|
$
|
203,712
|
|
$
|
250,287
|
|
$
|
193,197
|
|
|
Restructuring, integration and other expenses
|
|
|
90,805
|
|
|
43,734
|
|
|
15,494
|
|
|
13,257
|
|
|
18,320
|
|
|
Amortization of intangible assets and other
|
|
|
54,049
|
|
|
19,603
|
|
|
11,187
|
|
|
11,052
|
|
|
12,208
|
|
|
Total adjustments
|
|
|
144,854
|
|
|
63,337
|
|
|
26,681
|
|
|
24,309
|
|
|
30,528
|
|
|
Adjusted operating income
|
|
$
|
972,527
|
|
$
|
243,814
|
|
$
|
230,393
|
|
$
|
274,596
|
|
$
|
223,725
|
|
|
|
|
|
|
|
|
|
|
|
|
|
|
|
|
|
|
|
|
GAAP other (expense) income, net
|
|
$
|
(19,043)
|
|
$
|
(3,080)
|
|
$
|
(8,945)
|
|
$
|
(5,524)
|
|
$
|
(1,493)
|
|
|
Venezuela foreign currency loss
|
|
|
3,737
|
|
|
3,737
|
|
|
-
|
|
|
-
|
|
|
-
|
|
|
Adjusted other (expense) income, net
|
|
$
|
(15,306)
|
|
$
|
657
|
|
$
|
(8,945)
|
|
$
|
(5,524)
|
|
$
|
(1,493)
|
|
|
|
|
|
|
|
|
|
|
|
|
|
|
|
|
|
|
|
|
Total adjustments to income before income taxes
|
|
$
|
148,591
|
|
$
|
67,074
|
|
$
|
26,681
|
|
$
|
24,309
|
|
$
|
30,528
|
|
|
|
|
|
|
|
|
|
|
|
|
|
|
|
|
|
|
|
|
GAAP net income
|
|
$
|
571,913
|
|
$
|
158,733
|
|
$
|
121,529
|
|
$
|
163,706
|
|
$
|
127,946
|
|
|
Restructuring, integration and other expenses (net of tax)
|
|
|
65,897
|
|
|
30,514
|
|
|
12,035
|
|
|
10,188
|
|
|
13,160
|
|
|
Amortization of intangible assets and other (net of tax)
|
|
|
36,643
|
|
|
12,287
|
|
|
7,708
|
|
|
7,675
|
|
|
8,973
|
|
|
Venezuela foreign currency loss (net of tax)
|
|
|
3,737
|
|
|
3,737
|
|
|
-
|
|
|
-
|
|
|
-
|
|
|
Income tax adjustments
|
|
|
(55,101)
|
|
|
(45,770)
|
|
|
2,192
|
|
|
(5,597)
|
|
|
(5,926)
|
|
|
Total adjustments to net income (net of tax)
|
|
|
51,176
|
|
|
768
|
|
|
21,935
|
|
|
12,266
|
|
|
16,207
|
|
|
Adjusted net income
|
|
$
|
623,089
|
|
$
|
159,501
|
|
$
|
143,464
|
|
$
|
175,972
|
|
$
|
144,153
|
|
|
|
|
|
|
|
|
|
|
|
|
|
|
|
|
|
|
|
|
GAAP diluted EPS
|
|
$
|
4.12
|
|
$
|
1.15
|
|
$
|
0.88
|
|
$
|
1.18
|
|
$
|
0.91
|
|
|
Restructuring, integration and other expenses (net of tax)
|
|
|
0.47
|
|
|
0.22
|
|
|
0.09
|
|
|
0.07
|
|
|
0.09
|
|
|
Amortization of intangible assets and other (net of tax)
|
|
|
0.26
|
|
|
0.09
|
|
|
0.06
|
|
|
0.06
|
|
|
0.07
|
|
|
Venezuela foreign currency loss (net of tax)
|
|
|
0.03
|
|
|
0.03
|
|
|
-
|
|
|
-
|
|
|
-
|
|
|
Income tax adjustments
|
|
|
(0.39)
|
|
|
(0.33)
|
|
|
0.02
|
|
|
(0.04)
|
|
|
(0.04)
|
|
|
Total adjustments to diluted EPS (net of tax)
|
|
|
0.37
|
|
|
0.01
|
|
|
0.16
|
|
|
0.09
|
|
|
0.12
|
|
|
Adjusted EPS*
|
|
$
|
4.49
|
|
$
|
1.16
|
|
$
|
1.04
|
|
$
|
1.27
|
|
$
|
1.02
|
|
* Does not foot due to rounding
Organic Sales
Organic sales is defined as reported sales adjusted for the impact of more than insignificant acquisitions and divestitures by adjusting Avnet’s prior periods to include the sales of acquired businesses and exclude the sales of divested businesses as if the acquisitions and divestitures had occurred at the beginning of the earliest period presented. In addition, fiscal 2016 sales are adjusted for the estimated impact of the extra week of sales in the first quarter of fiscal 2016 due to it being a 14-week quarter and 53-week fiscal year. Organic sales in constant currency is defined as organic sales (as defined above) excluding the impact of changes in foreign currency exchange rates as discussed above.
The following tables present the reconciliation of reported sales to organic sales for the second quarter and first six months of fiscal 2016 and fiscal 2015.
|
|
|
|
|
|
|
|
|
|
|
|
|
|
|
|
|
|
|
|
|
|
|
|
Second Quarter Ended
|
|
Six Months Ended
|
|
|
|
|
|
|
|
|
|
|
|
|
Acquisitions/
|
|
|
|
|
|
|
As
|
|
|
|
|
|
|
As
|
|
Divestitures (1)/
|
|
|
|
|
|
|
|
Reported -
|
|
Acquisitions/
|
|
Organic Sales -
|
|
Reported -
|
|
Estimated
|
|
Organic Sales -
|
|
|
|
|
Fiscal 2016
|
|
Divestitures (1)
|
|
Fiscal 2016
|
|
Fiscal 2016
|
|
Extra Week (2)
|
|
Fiscal 2016
|
|
|
|
|
(in thousands)
|
|
|
Avnet, Inc.
|
|
$
|
6,848,057
|
|
$
|
7,184
|
|
$
|
6,855,241
|
|
$
|
13,817,751
|
|
$
|
(477,986)
|
|
$
|
13,339,765
|
|
|
EM
|
|
|
4,114,614
|
|
|
—
|
|
|
4,114,614
|
|
|
8,586,016
|
|
|
(300,000)
|
|
|
8,286,016
|
|
|
TS
|
|
|
2,733,443
|
|
|
7,184
|
|
|
2,740,627
|
|
|
5,231,735
|
|
|
(177,986)
|
|
|
5,053,749
|
|
|
EM
|
|
|
|
|
|
|
|
|
|
|
|
|
|
|
|
|
|
|
|
|
Americas
|
|
$
|
1,125,160
|
|
$
|
—
|
|
$
|
1,125,160
|
|
$
|
2,390,368
|
|
$
|
(82,000)
|
|
$
|
2,308,368
|
|
|
EMEA
|
|
|
1,141,076
|
|
|
—
|
|
|
1,141,076
|
|
|
2,467,512
|
|
|
(92,000)
|
|
|
2,375,512
|
|
|
Asia
|
|
|
1,848,378
|
|
|
—
|
|
|
1,848,378
|
|
|
3,728,136
|
|
|
(126,000)
|
|
|
3,602,136
|
|
|
TS
|
|
|
|
|
|
|
|
|
|
|
|
|
|
|
|
|
|
|
|
|
Americas
|
|
$
|
1,625,400
|
|
$
|
—
|
|
$
|
1,625,400
|
|
$
|
3,134,135
|
|
$
|
(137,000)
|
|
$
|
2,997,135
|
|
|
EMEA
|
|
|
794,373
|
|
|
7,184
|
|
|
801,557
|
|
|
1,483,156
|
|
|
(17,986)
|
|
|
1,465,170
|
|
|
Asia
|
|
|
313,670
|
|
|
—
|
|
|
313,670
|
|
|
614,444
|
|
|
(23,000)
|
|
|
591,444
|
|
|
|
|
|
|
|
|
|
|
|
|
|
|
|
|
|
|
|
|
|
|
|
|
|
Second Quarter Ended
|
|
Six Months Ended
|
|
|
|
|
As Reported -
|
|
Acquisitions/
|
|
Organic Sales -
|
|
As Reported -
|
|
Acquisitions/
|
|
Organic Sales -
|
|
|
|
|
Fiscal 2015
|
|
Divestitures (1)
|
|
Fiscal 2015
|
|
Fiscal 2015
|
|
Divestitures (1)
|
|
Fiscal 2015
|
|
|
|
|
(in thousands)
|
|
|
Avnet, Inc.
|
|
$
|
7,551,880
|
|
$
|
39,561
|
|
$
|
7,591,441
|
|
$
|
14,391,467
|
|
$
|
62,069
|
|
$
|
14,453,536
|
|
|
EM
|
|
|
4,435,190
|
|
|
—
|
|
|
4,435,190
|
|
|
8,809,285
|
|
|
—
|
|
|
8,809,285
|
|
|
TS
|
|
|
3,116,690
|
|
|
39,561
|
|
|
3,156,251
|
|
|
5,582,182
|
|
|
62,069
|
|
|
5,644,251
|
|
|
EM
|
|
|
|
|
|
|
|
|
|
|
|
|
|
|
|
|
|
|
|
|
Americas
|
|
$
|
1,200,871
|
|
$
|
—
|
|
$
|
1,200,871
|
|
$
|
2,414,902
|
|
$
|
—
|
|
$
|
2,414,902
|
|
|
EMEA
|
|
|
1,205,310
|
|
|
—
|
|
|
1,205,310
|
|
|
2,507,805
|
|
|
—
|
|
|
2,507,805
|
|
|
Asia
|
|
|
2,029,009
|
|
|
—
|
|
|
2,029,009
|
|
|
3,886,578
|
|
|
—
|
|
|
3,886,578
|
|
|
TS
|
|
|
|
|
|
|
|
|
|
|
|
|
|
|
|
|
|
|
|
|
Americas
|
|
$
|
1,851,017
|
|
$
|
—
|
|
$
|
1,851,017
|
|
$
|
3,284,108
|
|
$
|
—
|
|
$
|
3,284,108
|
|
|
EMEA
|
|
|
856,742
|
|
|
39,561
|
|
|
896,303
|
|
|
1,529,626
|
|
|
62,069
|
|
|
1,591,695
|
|
|
Asia
|
|
|
408,931
|
|
|
—
|
|
|
408,931
|
|
|
768,448
|
|
|
—
|
|
|
768,448
|
|
|
(1)
| |
Includes the following acquisitions: |
|
·
| |
Orchestra Service Gmbh acquired in November 2015 in the TS EMEA Region. |
|
·
| |
ExitCertified acquired in January 2016 in the TS America Region (no impact on organic sales as it was acquired at the end of the second quarter of fiscal 2016.) |
|
(2)
| |
The impact of the additional week of sales in the first quarter of fiscal 2016 is estimated. |
|
|
|
|
|
|
|
|
|
|
|
|
|
|
|
|
|
|
|
|
|
|
|
|
|
|
|
|
|
Sales
|
|
|
|
|
|
|
Organic
|
|
|
|
|
|
|
|
|
|
|
As Reported
|
|
|
|
|
|
|
|
Sales
|
|
|
|
|
Sales
|
|
Sales
|
|
Year-Year %
|
|
Organic
|
|
Organic
|
|
Year-Year %
|
|
|
|
|
As Reported
|
|
As Reported
|
|
Change in
|
|
Sales
|
|
Sales
|
|
Change in
|
|
|
|
|
Q2-Fiscal
|
|
Year-Year
|
|
Constant
|
|
Q2-Fiscal
|
|
Year-Year
|
|
Constant
|
|
|
|
|
2016
|
|
% Change
|
|
Currency
|
|
2016
|
|
% Change
|
|
Currency
|
|
|
|
|
(Dollars in thousands)
|
|
|
Avnet, Inc.
|
|
$
|
6,848,057
|
|
(9.3)
|
%
|
|
(5.1)
|
%
|
|
$
|
6,855,241
|
|
(9.7)
|
%
|
|
(5.5)
|
%
|
|
EM
|
|
|
4,114,614
|
|
(7.2)
|
|
|
(3.4)
|
|
|
|
4,114,614
|
|
(7.2)
|
|
|
(3.4)
|
|
|
TS
|
|
|
2,733,443
|
|
(12.3)
|
|
|
(7.6)
|
|
|
|
2,740,627
|
|
(13.2)
|
|
|
(8.5)
|
|
|
EM
|
|
|
|
|
|
|
|
|
|
|
|
|
|
|
|
|
|
|
|
Americas
|
|
$
|
1,125,160
|
|
(6.3)
|
%
|
|
—
|
|
|
$
|
1,125,160
|
|
(6.3)
|
%
|
|
—
|
|
|
EMEA
|
|
|
1,141,076
|
|
(5.3)
|
|
|
7.5
|
%
|
|
|
1,141,076
|
|
(5.3)
|
|
|
7.5
|
%
|
|
Asia/Pacific
|
|
|
1,848,378
|
|
(8.9)
|
|
|
(8.3)
|
|
|
|
1,848,378
|
|
(8.9)
|
|
|
(8.3)
|
|
|
TS
|
|
|
|
|
|
|
|
|
|
|
|
|
|
|
|
|
|
|
|
Americas
|
|
$
|
1,625,400
|
|
(12.2)
|
%
|
|
—
|
|
|
$
|
1,625,400
|
|
(12.2)
|
%
|
|
—
|
|
|
EMEA
|
|
|
794,373
|
|
(7.3)
|
|
|
1.7
|
%
|
|
|
801,557
|
|
(10.6)
|
|
|
(2.0)
|
%
|
|
Asia/Pacific
|
|
|
313,670
|
|
(23.3)
|
|
|
(15.5)
|
|
|
|
313,670
|
|
(23.3)
|
|
|
(15.5)
|
|
ROWC, ROCE and WC Velocity
The following tables (in thousands) presents the calculation for ROWC, ROCE and WC velocity.
|
|
|
|
|
|
|
|
|
|
|
|
|
|
|
|
|
|
|
|
|
FY16
|
|
|
Q2 FY16
|
|
|
Q1 FY16
|
|
|
Sales
|
|
|
|
$
|
13,817,751
|
|
|
$
|
6,848,057
|
|
|
$
|
6,969,694
|
|
|
Sales, annualized (1)
|
|
(a)
|
|
|
27,123,733
|
|
|
|
27,392,228
|
|
|
|
26,385,270
|
|
|
Adjusted operating income (2)
|
|
|
|
|
495,669
|
|
|
|
255,258
|
|
|
|
240,411
|
|
|
Adjusted annualized operating income (1)
|
|
(b)
|
|
|
972,980
|
|
|
|
1,021,032
|
|
|
|
910,127
|
|
|
Adjusted effective tax rate (3)
|
|
|
|
|
27.5
|
%
|
|
|
27.5
|
%
|
|
|
27.5
|
%
|
|
Adjusted annualized operating income, after tax
|
|
(c)
|
|
|
705,411
|
|
|
|
740,759
|
|
|
|
659,842
|
|
|
Average monthly working capital
|
|
|
|
|
|
|
|
|
|
|
|
|
|
|
|
Accounts receivable
|
|
|
|
|
4,882,049
|
|
|
|
4,982,198
|
|
|
|
4,787,201
|
|
|
Inventories
|
|
|
|
|
2,737,935
|
|
|
|
2,747,160
|
|
|
|
2,745,479
|
|
|
Accounts payable
|
|
|
|
|
(3,202,239)
|
|
|
|
(3,256,725)
|
|
|
|
(3,182,154)
|
|
|
Average working capital
|
|
(d)
|
|
$
|
4,417,745
|
|
|
$
|
4,472,633
|
|
|
$
|
4,350,526
|
|
|
Average monthly capital employed
|
|
(e)
|
|
$
|
5,974,843
|
|
|
$
|
6,026,327
|
|
|
$
|
5,909,334
|
|
|
ROWC = (b) / (d)
|
|
|
|
|
22.0
|
%
|
|
|
22.8
|
%
|
|
|
20.9
|
%
|
|
WC Velocity = (a) / (d)
|
|
|
|
|
6.1
|
|
|
|
6.1
|
|
|
|
6.1
|
|
|
ROCE = (c) / (e)
|
|
|
|
|
11.8
|
%
|
|
|
12.3
|
%
|
|
|
11.2
|
%
|
|
|
|
|
|
|
|
|
|
|
|
|
|
|
|
|
|
|
|
|
|
|
|
|
|
|
|
|
|
FY15
|
|
|
Q4 FY15
|
|
|
Q3 FY15
|
|
|
Q2 FY15
|
|
|
Q1 FY15
|
|
|
Sales
|
|
|
|
$
|
27,924,657
|
|
|
$
|
6,796,331
|
|
|
$
|
6,736,860
|
|
|
$
|
7,551,880
|
|
|
$
|
6,839,587
|
|
|
Sales, annualized
|
|
(a)
|
|
|
27,924,657
|
|
|
|
27,185,324
|
|
|
|
26,947,440
|
|
|
|
30,207,520
|
|
|
|
27,358,348
|
|
|
Adjusted operating income (2)
|
|
|
|
|
972,527
|
|
|
|
243,814
|
|
|
|
230,393
|
|
|
|
274,596
|
|
|
|
223,725
|
|
|
Adjusted annualized operating income
|
|
(b)
|
|
|
972,527
|
|
|
|
975,256
|
|
|
|
921,572
|
|
|
|
1,098,384
|
|
|
|
894,900
|
|
|
Adjusted effective tax rate (3)
|
|
|
|
|
27.7
|
%
|
|
|
27.7
|
%
|
|
|
27.7
|
%
|
|
|
27.7
|
%
|
|
|
27.7
|
%
|
|
Adjusted annualized operating income, after tax
|
|
(c)
|
|
|
703,332
|
|
|
|
705,305
|
|
|
|
666,481
|
|
|
|
794,351
|
|
|
|
647,192
|
|
|
Average monthly working capital
|
|
|
|
|
|
|
|
|
|
|
|
|
|
|
|
|
|
|
|
|
|
|
|
Accounts receivable
|
|
|
|
|
5,109,326
|
|
|
|
4,979,668
|
|
|
|
5,251,882
|
|
|
|
5,318,083
|
|
|
|
4,993,653
|
|
|
Inventories
|
|
|
|
|
2,667,351
|
|
|
|
2,593,545
|
|
|
|
2,564,071
|
|
|
|
2,700,424
|
|
|
|
2,729,194
|
|
|
Accounts payable
|
|
|
|
|
(3,274,382)
|
|
|
|
(3,234,283)
|
|
|
|
(3,344,479)
|
|
|
|
(3,437,897)
|
|
|
|
(3,231,037)
|
|
|
Average working capital
|
|
(d)
|
|
$
|
4,502,295
|
|
|
$
|
4,338,930
|
|
|
$
|
4,471,474
|
|
|
$
|
4,580,610
|
|
|
$
|
4,491,810
|
|
|
Average monthly capital employed
|
|
(e)
|
|
$
|
6,077,926
|
|
|
$
|
5,898,475
|
|
|
$
|
6,028,015
|
|
|
$
|
6,161,858
|
|
|
$
|
6,101,274
|
|
|
ROWC = (b) / (d)
|
|
|
|
|
21.6
|
%
|
|
|
22.5
|
%
|
|
|
20.6
|
%
|
|
|
24.0
|
%
|
|
|
19.9
|
%
|
|
WC Velocity = (a) / (d)
|
|
|
|
|
6.2
|
|
|
|
6.3
|
|
|
|
6.0
|
|
|
|
6.6
|
|
|
|
6.1
|
|
|
ROCE = (c) / (e)
|
|
|
|
|
11.6
|
%
|
|
|
12.0
|
%
|
|
|
11.1
|
%
|
|
|
12.9
|
%
|
|
|
10.6
|
%
|
|
(1)
| |
Annualized amounts are based on a 53-week fiscal year. |
|
(2)
| |
See reconciliation to GAAP amounts in the preceding tables in this Non-GAAP Financial Information section. |
|
(3)
| |
Adjusted effective tax rate for each quarterly period in a fiscal year is based upon the currently anticipated annual effective tax rate, excluding the tax effect of the income tax adjustments quantified above in the reconciliation to GAAP amounts in this Non-GAAP Financial Information section. |
Teleconference and Upcoming Events
Avnet will host a quarterly teleconference today at 2:00 p.m. Eastern Time. Financial information including financial statement reconciliations of GAAP to non-GAAP financial measures, will be available through www.ir.avnet.com. Please log onto the site 15 minutes prior to the start of the event to register or download any necessary software. An archive copy of the teleconference will also be available after the call.
For a listing of Avnet’s upcoming events and other information, please visit Avnet’s investor relations website at www.ir.avnet.com.
About Avnet
From components to cloud and design to disposal, Avnet, Inc. (NYSE: AVT) accelerates the success of customers who build, sell and use technology globally by providing them with a comprehensive portfolio of innovative products, services and solutions. Avnet is a Fortune 500 company with revenues of $27.9 billion in fiscal year 2015. For more information, visit www.avnet.com. (AVT_IR)
Investor Relations Contact
Avnet, Inc.
Vincent Keenan
Investor Relations
(480) 643-7053
investorrelations@avnet.com
AVNET, INC.
CONSOLIDATED STATEMENTS OF OPERATIONS
(UNAUDITED)
|
|
|
|
|
|
|
|
|
|
|
|
|
|
|
|
|
|
Second Quarters Ended
|
|
Six Months Ended
|
|
|
|
|
January 2,
|
|
December 27,
|
|
January 2,
|
|
December 27,
|
|
|
|
|
2016
|
|
2014
|
|
2016
|
|
2014
|
|
|
|
|
(Thousands, except per share data)
|
|
|
Sales
|
|
$
|
6,848,057
|
|
$
|
7,551,880
|
|
$
|
13,817,751
|
|
$
|
14,391,466
|
|
|
Cost of sales
|
|
|
6,069,889
|
|
|
6,714,374
|
|
|
12,248,107
|
|
|
12,758,497
|
|
|
Gross profit
|
|
|
778,168
|
|
|
837,506
|
|
|
1,569,644
|
|
|
1,632,969
|
|
|
Selling, general and administrative expenses
|
|
|
530,831
|
|
|
573,962
|
|
|
1,089,387
|
|
|
1,157,908
|
|
|
Restructuring, integration and other expenses
|
|
|
21,222
|
|
|
13,257
|
|
|
47,180
|
|
|
31,577
|
|
|
Operating income
|
|
|
226,115
|
|
|
250,287
|
|
|
433,077
|
|
|
443,484
|
|
|
Other expense, net
|
|
|
(6,485)
|
|
|
(5,524)
|
|
|
(12,338)
|
|
|
(7,017)
|
|
|
Interest expense
|
|
|
(22,423)
|
|
|
(24,666)
|
|
|
(46,025)
|
|
|
(48,066)
|
|
|
Income before income taxes
|
|
|
197,207
|
|
|
220,097
|
|
|
374,714
|
|
|
388,401
|
|
|
Income tax expense
|
|
|
41,195
|
|
|
56,391
|
|
|
88,448
|
|
|
96,749
|
|
|
Net income
|
|
$
|
156,012
|
|
$
|
163,706
|
|
$
|
286,266
|
|
$
|
291,652
|
|
|
Earnings per share:
|
|
|
|
|
|
|
|
|
|
|
|
|
|
|
Basic
|
|
$
|
1.18
|
|
$
|
1.20
|
|
$
|
2.15
|
|
$
|
2.12
|
|
|
Diluted
|
|
$
|
1.16
|
|
$
|
1.18
|
|
$
|
2.11
|
|
$
|
2.08
|
|
|
Shares used to compute earnings per share:
|
|
|
|
|
|
|
|
|
|
|
|
|
|
|
Basic
|
|
|
131,909
|
|
|
136,541
|
|
|
132,846
|
|
|
137,425
|
|
|
Diluted
|
|
|
134,918
|
|
|
138,972
|
|
|
135,622
|
|
|
139,911
|
|
|
Cash dividends paid per common share
|
|
$
|
0.17
|
|
$
|
0.16
|
|
$
|
0.34
|
|
$
|
0.32
|
|
AVNET, INC.
CONDENSED CONSOLIDATED BALANCE SHEETS
(UNAUDITED)
|
|
|
|
|
|
|
|
|
|
|
|
January 2,
|
|
June 27,
|
|
|
|
|
2016
|
|
2015
|
|
|
|
|
(Thousands)
|
|
|
ASSETS
|
|
|
|
|
|
|
|
|
Current assets:
|
|
|
|
|
|
|
|
|
Cash and cash equivalents
|
|
$
|
916,088
|
|
$
|
932,553
|
|
|
Receivables, net
|
|
|
5,395,005
|
|
|
5,054,307
|
|
|
Inventories
|
|
|
2,650,220
|
|
|
2,482,183
|
|
|
Prepaid and other current assets
|
|
|
181,074
|
|
|
173,030
|
|
|
Total current assets
|
|
|
9,142,387
|
|
|
8,642,073
|
|
|
Property, plant and equipment, net
|
|
|
587,216
|
|
|
568,779
|
|
|
Goodwill
|
|
|
1,283,408
|
|
|
1,278,756
|
|
|
Intangible assets, net
|
|
|
91,371
|
|
|
99,731
|
|
|
Other assets
|
|
|
197,970
|
|
|
210,614
|
|
|
Total assets
|
|
$
|
11,302,352
|
|
$
|
10,799,953
|
|
|
LIABILITIES AND SHAREHOLDERS’ EQUITY
|
|
|
|
|
|
|
|
|
Current liabilities:
|
|
|
|
|
|
|
|
|
Short-term debt
|
|
$
|
1,136,218
|
|
$
|
331,115
|
|
|
Accounts payable
|
|
|
3,628,073
|
|
|
3,338,052
|
|
|
Accrued expenses and other
|
|
|
599,007
|
|
|
603,129
|
|
|
Total current liabilities
|
|
|
5,363,298
|
|
|
4,272,296
|
|
|
Long-term debt
|
|
|
1,072,188
|
|
|
1,646,501
|
|
|
Other liabilities
|
|
|
192,864
|
|
|
196,135
|
|
|
Total liabilities
|
|
|
6,628,350
|
|
|
6,114,932
|
|
|
Shareholders’ equity
|
|
|
4,674,002
|
|
|
4,685,021
|
|
|
Total liabilities and shareholders’ equity
|
|
$
|
11,302,352
|
|
$
|
10,799,953
|
|
AVNET, INC.
CONSOLIDATED STATEMENTS OF CASH FLOWS
(UNAUDITED)
|
|
|
|
|
|
|
|
|
|
|
|
Six Months Ended
|
|
|
|
|
January 2,
|
|
December 27,
|
|
|
|
|
2016
|
|
2014
|
|
|
|
|
(Thousands)
|
|
|
Cash flows from operating activities:
|
|
|
|
|
|
|
|
|
Net income
|
|
$
|
286,266
|
|
$
|
291,652
|
|
|
Non-cash and other reconciling items:
|
|
|
|
|
|
|
|
|
Depreciation
|
|
|
47,612
|
|
|
46,972
|
|
|
Amortization
|
|
|
14,307
|
|
|
21,990
|
|
|
Deferred income taxes
|
|
|
(708)
|
|
|
15,275
|
|
|
Stock-based compensation
|
|
|
38,424
|
|
|
36,130
|
|
|
Other, net
|
|
|
28,596
|
|
|
34,523
|
|
|
Changes in (net of effects from businesses acquired):
|
|
|
|
|
|
|
|
|
Receivables
|
|
|
(413,149)
|
|
|
(711,060)
|
|
|
Inventories
|
|
|
(197,800)
|
|
|
(5,957)
|
|
|
Accounts payable
|
|
|
323,447
|
|
|
583,337
|
|
|
Accrued expenses and other, net
|
|
|
(42,753)
|
|
|
(88,438)
|
|
|
Net cash flows provided by operating activities
|
|
|
84,242
|
|
|
224,424
|
|
|
|
|
|
|
|
|
|
|
|
Cash flows from financing activities:
|
|
|
|
|
|
|
|
|
Repayment of notes
|
|
|
(250,000)
|
|
|
—
|
|
|
Borrowings under accounts receivable securitization program, net
|
|
|
40,000
|
|
|
77,000
|
|
|
Borrowings (repayments) of bank and revolving debt, net
|
|
|
444,343
|
|
|
(37,414)
|
|
|
Repurchases of common stock
|
|
|
(184,704)
|
|
|
(109,129)
|
|
|
Dividends paid on common stock
|
|
|
(45,020)
|
|
|
(43,875)
|
|
|
Other, net
|
|
|
(1,080)
|
|
|
(5,439)
|
|
|
Net cash flows provided (used) for financing activities
|
|
|
3,539
|
|
|
(118,857)
|
|
|
|
|
|
|
|
|
|
|
|
Cash flows from investing activities:
|
|
|
|
|
|
|
|
|
Purchases of property, plant and equipment
|
|
|
(74,806)
|
|
|
(83,642)
|
|
|
Acquisitions of businesses, net of cash acquired
|
|
|
(19,199)
|
|
|
—
|
|
|
Other, net
|
|
|
7,736
|
|
|
(8,795)
|
|
|
Net cash flows used for investing activities
|
|
|
(86,269)
|
|
|
(92,437)
|
|
|
|
|
|
|
|
|
|
|
|
Effect of exchange rate changes on cash and cash equivalents
|
|
|
(17,977)
|
|
|
(38,770)
|
|
|
|
|
|
|
|
|
|
|
|
Cash and cash equivalents:
|
|
|
|
|
|
|
|
|
— (decrease)
|
|
|
(16,465)
|
|
|
(25,640)
|
|
|
— at beginning of period
|
|
|
932,553
|
|
|
928,971
|
|
|
— at end of period
|
|
$
|
916,088
|
|
$
|
903,331
|
|
AVNET, INC.
SEGMENT INFORMATION
(UNAUDITED)
|
|
|
|
|
|
|
|
|
|
|
|
|
|
|
|
|
|
Second Quarters Ended
|
|
Six Months Ended
|
|
|
|
|
January 2,
|
|
December 27,
|
|
January 2,
|
|
December 27,
|
|
|
|
|
2016
|
|
2014
|
|
2016*
|
|
2014
|
|
|
|
|
(Millions)
|
|
|
Sales:
|
|
|
|
|
|
|
|
|
|
|
|
|
|
|
Electronics Marketing
|
|
$
|
4,114.6
|
|
$
|
4,435.2
|
|
$
|
8,586.0
|
|
$
|
8,809.3
|
|
|
Technology Solutions
|
|
|
2,733.4
|
|
|
3,116.7
|
|
|
5,231.7
|
|
|
5,582.2
|
|
|
Avnet Sales
|
|
$
|
6,848.0
|
|
$
|
7,551.9
|
|
$
|
13,817.7
|
|
$
|
14,391.5
|
|
|
Operating Income (Expense):
|
|
|
|
|
|
|
|
|
|
|
|
|
|
|
Electronics Marketing
|
|
$
|
174.0
|
|
$
|
191.4
|
|
$
|
387.0
|
|
$
|
394.2
|
|
|
Technology Solutions
|
|
|
117.1
|
|
|
117.6
|
|
|
191.6
|
|
|
180.0
|
|
|
Corporate
|
|
|
(35.8)
|
|
|
(34.4)
|
|
|
(83.0)
|
|
|
(75.8)
|
|
|
|
|
|
255.3
|
|
|
274.6
|
|
|
495.6
|
|
|
498.4
|
|
|
Restructuring, integration and other expenses
|
|
|
(21.2)
|
|
|
(13.3)
|
|
|
(47.2)
|
|
|
(31.6)
|
|
|
Amortization of intangible assets and other
|
|
|
(7.9)
|
|
|
(11.1)
|
|
|
(15.4)
|
|
|
(23.3)
|
|
|
Operating Income
|
|
$
|
226.1
|
|
$
|
250.2
|
|
$
|
433.1
|
|
$
|
443.5
|
|
*Sub-totals and totals may not foot due to rounding
Exhibit 99.2
Avnet, Inc. Q2 Fiscal Year 2016
$ in millions - except per share data
January 28, 2016
CFO Review of Fiscal 2016 Second Quarter Results
|
|
|
|
|
|
|
|
|
|
|
|
|
|
|
|
|
|
|
|
|
Q2' FY15
|
Q1' FY16
|
Q2' FY16
|
Y/Y Chg
|
Seq. Chg
|
|
Sales
|
|
$
|
7,551.9
|
|
$
|
6,969.7
|
|
$
|
6,848.1
|
|
$
|
(703.8)
|
|
$
|
(121.6)
|
|
|
Gross Profit
|
|
$
|
837.5
|
|
$
|
791.5
|
|
$
|
778.2
|
|
$
|
(59.3)
|
|
$
|
(13.3)
|
|
|
GP Margin
|
|
|
11.1
|
%
|
|
11.4
|
%
|
|
11.4
|
%
|
|
27
|
bps
|
|
—
|
bps
|
|
|
|
|
|
|
|
|
|
|
|
|
|
|
|
|
|
|
|
GAAP SG&A Expenses
|
|
$
|
574.0
|
|
$
|
558.6
|
|
$
|
530.8
|
|
$
|
(43.1)
|
|
$
|
(27.7)
|
|
|
Adjusted Operating Expenses (1)
|
|
$
|
562.9
|
|
$
|
551.1
|
|
$
|
522.9
|
|
$
|
(40.0)
|
|
$
|
(28.2)
|
|
|
Adjusted Operating Expenses as % of Sales (1)
|
|
|
7.5
|
%
|
|
7.9
|
%
|
|
7.6
|
%
|
|
19
|
bps
|
|
(27)
|
bps
|
|
Adjusted Operating Expenses as % of Gross Profit (1)
|
|
|
67.2
|
%
|
|
69.6
|
%
|
|
67.2
|
%
|
|
(1)
|
bps
|
|
(242)
|
bps
|
|
|
|
|
|
|
|
|
|
|
|
|
|
|
|
|
|
|
|
GAAP Operating Income
|
|
$
|
250.3
|
|
$
|
207.0
|
|
$
|
226.1
|
|
$
|
(24.2)
|
|
$
|
19.2
|
|
|
Adjusted Operating Income (1)
|
|
$
|
274.6
|
|
$
|
240.4
|
|
$
|
255.3
|
|
$
|
(19.3)
|
|
$
|
14.8
|
|
|
Adjusted Operating Income Margin (1)
|
|
|
3.6
|
%
|
|
3.5
|
%
|
|
3.7
|
%
|
|
9
|
bps
|
|
28
|
bps
|
|
|
|
|
|
|
|
|
|
|
|
|
|
|
|
|
|
|
|
GAAP Net Income
|
|
$
|
163.7
|
|
$
|
130.3
|
|
$
|
156.0
|
|
$
|
(7.7)
|
|
$
|
25.8
|
|
|
Adjusted Net Income (1)
|
|
$
|
176.0
|
|
$
|
152.9
|
|
$
|
164.3
|
|
$
|
(11.6)
|
|
$
|
11.4
|
|
|
|
|
|
|
|
|
|
|
|
|
|
|
|
|
|
|
|
|
GAAP Diluted EPS
|
|
$
|
1.18
|
|
$
|
0.96
|
|
$
|
1.16
|
|
|
(1.7)
|
%
|
|
20.8
|
%
|
|
Adjusted Diluted EPS (1)
|
|
$
|
1.27
|
|
$
|
1.12
|
|
$
|
1.22
|
|
|
(3.9)
|
%
|
|
8.9
|
%
|
|
|
|
|
|
|
|
|
|
|
|
|
|
|
|
|
|
|
|
Return on Working Capital (ROWC) (1)
|
|
|
24.0
|
%
|
|
20.9
|
%
|
|
22.8
|
%
|
|
(115)
|
bps
|
|
191
|
bps
|
|
Return on Capital Employed (ROCE) (1)
|
|
|
12.9
|
%
|
|
11.2
|
%
|
|
12.3
|
%
|
|
(60)
|
bps
|
|
112
|
bps
|
|
Working Capital Velocity (1)
|
|
|
6.6
|
|
|
6.1
|
|
|
6.1
|
|
|
(0.5)
|
|
|
0.1
|
|
|
(1)
| |
A reconciliation of non-GAAP financial measures is presented in the Non-GAAP Financial Information section of the press release attached as Exhibit 99.1 included in this Current Report on Form 8-K. |
Key Highlights
|
·
| |
As highlighted on the October earnings call, the Company’s fiscal 2016 is a 53-week year and the additional week impacts the first quarter of fiscal 2016. When discussing sequential organic sales (defined later in this document), the first quarter of fiscal 2016 reported sales have been reduced to adjust for the estimated impact of the extra week. |
|
·
| |
Sales for the second quarter of fiscal 2016, decreased 9.3% year over year to $6.8 billion. Excluding the translation impact of changes in foreign currency exchange rates (also referred to as “constant currency” or “CC” in the graphs that follow) sales decreased 5.1% year over year due to declines at both operating groups. |
|
o
| |
Sequentially, reported sales decreased 1.8% (1.1% in constant currency) as an increase at Technology Solutions (TS) was offset by a decline at Electronics Marketing (EM). Sequentially, organic sales which exclude the impact of the extra week in the September quarter, increased 6.4% in constant currency, below the normal seasonal range of +10% to +14% primarily due to below seasonal growth at TS. |
|
·
| |
Gross profit margin increased 27 basis points from the year ago quarter to 11.4% and was essentially flat sequentially. The year-over-year increase was primarily due to an improvement at TS. |
|
·
| |
Adjusted operating income decreased 7.0% year over year to $255.3 million and adjusted operating income margin increased 9 basis points to 3.7% as an improvement at TS was partially offset by a decline at EM. |
|
o
| |
Sequentially, adjusted operating income increased 6.2% and adjusted operating income margin increased 28 basis points driven by an increase at TS. |
|
·
| |
Adjusted diluted earnings per share of $1.22 decreased $0.05, or 3.9% year over year, primarily due to the decline in operating income and was negatively impacted by approximately $0.07, or 5.5%, due to the translation impact of changes in foreign currency exchange rates. |
|
·
| |
Cash generated from operations was $118.0 million in the second quarter of fiscal 2016 and cash generated from operations for the trailing twelve months was $443.7 million. |
|
·
| |
During the second quarter of fiscal 2016, the Company paid a dividend $0.17 per share or $22.4 million, and has paid $45.0 million fiscal year to date. |
|
·
| |
During the second quarter of fiscal 2016, the Company repurchased $39.9 million worth of stock, or 0.9 million shares, and has repurchased $185 million worth of stock, or 4.4 million shares fiscal year to date. |
|
o
| |
The Company repurchased an additional $65 million worth of stock quarter to date and still has approximately $303 million remaining in the authorized share repurchase program. |
Avnet, Inc. Q2 Fiscal Year 2016
$ in millions - except per share data
January 28, 2016
Sales
|
|
|
|
|
|
|
|
|
|
|
|
|
|
|
|
|
|
|
|
|
|
|
|
|
|
|
|
|
|
|
|
|
|
|
|
|
|
Year-over-
|
|
|
|
|
|
|
|
|
|
|
|
|
|
|
|
|
|
|
Year Growth
|
|
|
|
|
|
|
|
|
|
|
|
|
|
|
|
|
|
|
Rates
|
|
|
|
Q2' FY15
|
Q3' FY15
|
Q4' FY15
|
Q1' FY16
|
Q2' FY16
|
Reported
|
|
Avnet, Inc.
|
|
$
|
7,551.9
|
|
$
|
6,736.9
|
|
$
|
6,796.3
|
|
$
|
6,969.7
|
|
$
|
6,848.1
|
|
(9.3)
|
%
|
|
Constant Currency (1)
|
|
|
|
|
|
|
|
|
|
|
|
|
|
|
|
|
(5.1)
|
%
|
|
|
|
|
|
|
|
|
|
|
|
|
|
|
|
|
|
|
|
|
|
Electronics Marketing (EM)
|
|
$
|
4,435.2
|
|
$
|
4,219.5
|
|
$
|
4,315.9
|
|
$
|
4,471.4
|
|
$
|
4,114.6
|
|
(7.2)
|
%
|
|
Constant Currency (1)
|
|
|
|
|
|
|
|
|
|
|
|
|
|
|
|
|
(3.4)
|
%
|
|
Americas
|
|
$
|
1,200.9
|
|
$
|
1,237.2
|
|
$
|
1,269.9
|
|
$
|
1,265.2
|
|
$
|
1,125.1
|
|
(6.3)
|
%
|
|
EMEA
|
|
$
|
1,205.3
|
|
$
|
1,251.9
|
|
$
|
1,245.0
|
|
$
|
1,326.4
|
|
$
|
1,141.1
|
|
(5.3)
|
%
|
|
Constant Currency (1)
|
|
|
|
|
|
|
|
|
|
|
|
|
|
|
|
|
7.5
|
%
|
|
Asia
|
|
$
|
2,029.0
|
|
$
|
1,730.4
|
|
$
|
1,801.0
|
|
$
|
1,879.8
|
|
$
|
1,848.4
|
|
(8.9)
|
%
|
|
Constant Currency (1)
|
|
|
|
|
|
|
|
|
|
|
|
|
|
|
|
|
(8.3)
|
%
|
|
|
|
|
|
|
|
|
|
|
|
|
|
|
|
|
|
|
|
|
|
Technology Solutions (TS)
|
|
$
|
3,116.7
|
|
$
|
2,517.3
|
|
$
|
2,480.5
|
|
$
|
2,498.3
|
|
$
|
2,733.4
|
|
(12.3)
|
%
|
|
Constant Currency (1)
|
|
|
|
|
|
|
|
|
|
|
|
|
|
|
|
|
(7.6)
|
%
|
|
Americas
|
|
$
|
1,851.0
|
|
$
|
1,440.5
|
|
$
|
1,497.3
|
|
$
|
1,508.7
|
|
$
|
1,625.4
|
|
(12.2)
|
%
|
|
EMEA
|
|
$
|
856.8
|
|
$
|
717.2
|
|
$
|
624.8
|
|
$
|
688.8
|
|
$
|
794.4
|
|
(7.3)
|
%
|
|
Constant Currency (1)
|
|
|
|
|
|
|
|
|
|
|
|
|
|
|
|
|
1.7
|
%
|
|
Asia
|
|
$
|
408.9
|
|
$
|
359.6
|
|
$
|
358.4
|
|
$
|
300.8
|
|
$
|
313.6
|
|
(23.3)
|
%
|
|
Constant Currency (1)
|
|
|
|
|
|
|
|
|
|
|
|
|
|
|
|
|
(15.5)
|
%
|
|
(1)
| |
Year-over-year sales growth rate excluding the impact of changes in foreign currency exchange rates. |
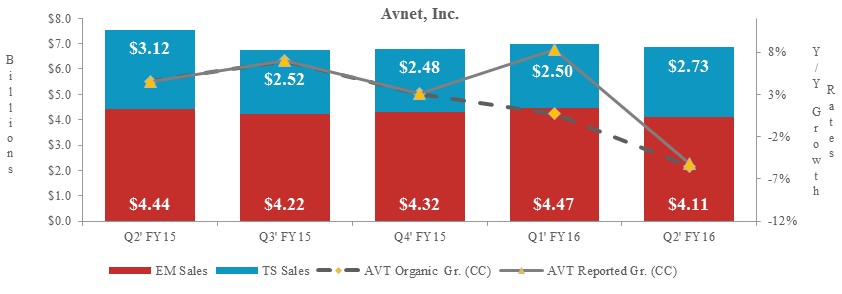
|
·
| |
Avnet’s second quarter fiscal 2016 reported sales decreased 5.1% in constant currency (9.3% in reported dollars) year over year to $6.85 billion with both operating groups contributing toward this decline. Organic sales, decreased 5.5% in constant currency primarily due to declines in the Americas and the Asia regions. |
|
o
| |
Year over year, the change in foreign currency exchange rates negatively impacted Avnet sales by $316 million or approximately 4.2%, with a majority of this impact in the EMEA region. |
|
o
| |
On a sequential basis, excluding the impact of the extra week in the September quarter, Avnet organic sales increased 6.4% in constant currency, which was below the normal seasonal range of +10% to +14% primarily due to weak demand in the Americas region at both operating groups. |
Avnet, Inc. Q2 Fiscal Year 2016
$ in millions - except per share data
January 28, 2016
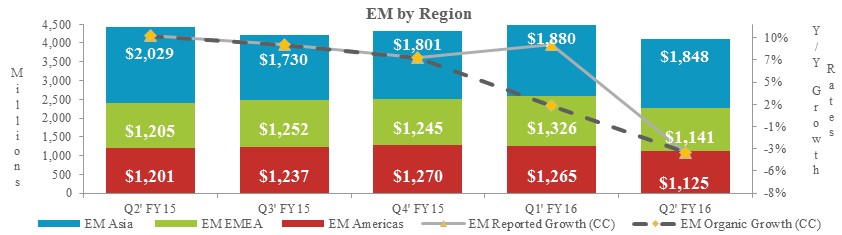
|
·
| |
EM’s second quarter fiscal 2016 sales of $4.1 billion decreased 3.4% year over year in constant currency (7.2% in reported dollars) primarily due to slower than expected sequential growth in high volume supply chain engagements in Asia and weaker demand in industrial markets in the Americas region. |
|
o
| |
Americas’ sales declined 6.3% year over year. |
|
o
| |
EMEA’s sales increased 7.5% year over year in constant currency and reported sales decreased 5.3%. The year-over-year growth in constant currency marks the tenth consecutive quarter of at least high single digit growth. |
|
o
| |
Asia’s sales decreased 8.3% year over year in constant currency and reported sales decreased 8.9% primarily due to a decline in high volume supply chain engagements and a decline in computing components. |
|
·
| |
EM’s organic sales, which excludes the impact of the extra week in the September quarter, declined 1.4% (1% in constant currency), which is below the low end of the normal seasonal range of 0% to +3%. |
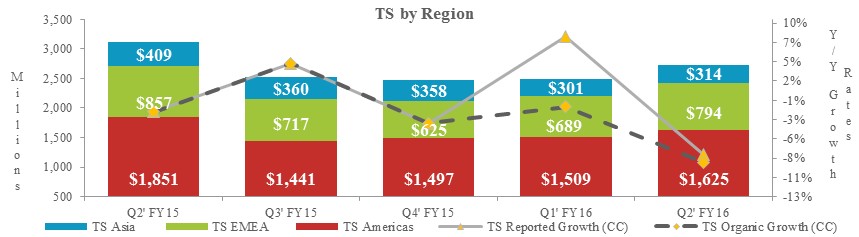
|
·
| |
TS’ second quarter fiscal 2016 reported sales of $2.7 billion decreased 7.6% year over year in constant currency (12.3% in reported dollars) primarily due to a weaker than expected close in the Americas region and continued weakness in the Asia region driven by computing components and the translation impact of the stronger U.S. Dollar. Organic sales, declined 8.5% in constant currency. |
|
o
| |
America’s sales decreased 12.2% year over year primarily due to declines in storage and computing components, coupled with softer demand in Latin America. |
|
o
| |
EMEA’s organic sales decreased 2.0% year over year in constant currency and reported sales declined 10.6%. |
|
o
| |
Asia’s sales decreased 15.5% year over year in constant currency and reported sales declined 23.3% primarily due to a decline in the computing components business and the strengthening of the U.S. Dollar against local currencies. |
|
·
| |
TS’ sequential organic sales, which excludes the impact of the extra week of sales in the September quarter and the acquisition of Orchestra GmbH in EMEA, increased 19.6% in constant currency, below the normal seasonal range of +26% to +30% primarily due to the weaker than expected close in the Americas region. |
|
·
| |
At a product level, year-over-year growth in networking, software and services was offset by a decline in storage and computing components. |
Avnet, Inc. Q2 Fiscal Year 2016
$ in millions - except per share data
January 28, 2016
Gross Profit
|
|
|
|
|
|
|
|
|
|
|
|
|
|
|
|
|
|
|
|
|
|
|
|
Q2' FY15
|
Q3' FY15
|
Q4' FY15
|
Q1' FY16
|
Q2' FY16
|
Y/Y Change
|
|
Gross Profit
|
|
$
|
837.5
|
|
$
|
774.4
|
|
$
|
785.8
|
|
$
|
791.5
|
|
$
|
778.2
|
|
$
|
(59.3)
|
|
|
Gross Profit Margin
|
|
|
11.1
|
%
|
|
11.5
|
%
|
|
11.6
|
%
|
|
11.4
|
%
|
|
11.4
|
%
|
|
27
|
bps
|
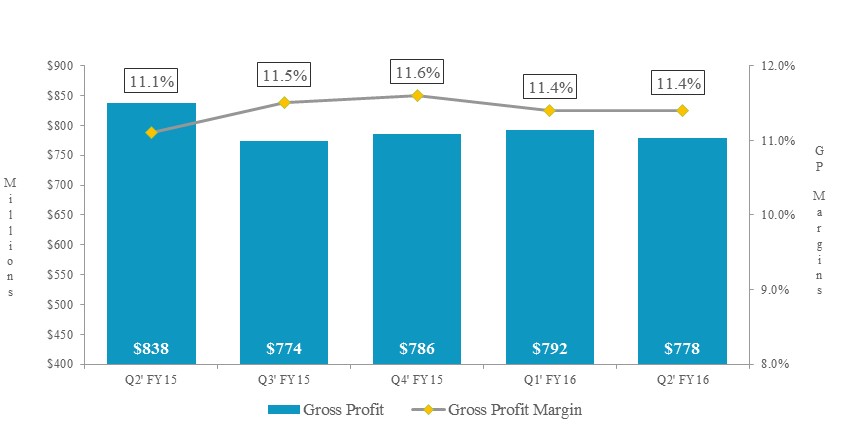
|
·
| |
Gross profit of $778.2 million, decreased 7.1% year over year primarily due to decreased sales and the translation impact of the strengthening of the U.S. Dollar year over year, partially offset by gross profit margin improvements at TS. |
|
o
| |
Gross profit margin of 11.4%, increased 27 basis points from the year ago quarter primarily due to improvements at TS partially offset by a modest decline at EM. |
|
o
| |
Gross profit margin was essentially flat sequentially. |
|
·
| |
EM gross profit margin declined year over year and sequentially. |
|
o
| |
The year-over-year decline was primarily due to a decline in the EMEA region partially offset by an increase in the Americas region. |
|
o
| |
The sequential decrease was primarily due to a decrease in the Asia region related to an increase in the high volume supply chain engagements, partially offset by an increase in the EMEA and Americas regions. |
|
·
| |
TS gross profit margin increased year over year and sequentially primarily due to improvements across all three regions as a result of portfolio management and product mix difference between years. |
Avnet, Inc. Q2 Fiscal Year 2016
$ in millions - except per share data
January 28, 2016
Operating Expenses
|
|
|
|
|
|
|
|
|
|
|
|
|
|
|
|
|
|
|
|
|
|
|
|
Q2' FY15
|
Q3' FY15
|
Q4' FY15
|
Q1' FY16
|
Q2' FY16
|
Y/Y Change
|
|
Selling, General and Administrative Expenses
|
|
$
|
574.0
|
|
$
|
555.1
|
|
$
|
561.6
|
|
$
|
558.6
|
|
$
|
530.8
|
|
$
|
(43.1)
|
|
|
Amortization of Intangible Assets and Other
|
|
|
(11.1)
|
|
|
(11.2)
|
|
|
(19.6)
|
|
|
(7.5)
|
|
|
(7.9)
|
|
|
3.1
|
|
|
Adjusted Operating Expenses (1)
|
|
$
|
562.9
|
|
$
|
543.9
|
|
$
|
542.0
|
|
$
|
551.1
|
|
$
|
522.9
|
|
$
|
(40.0)
|
|
|
Adjusted Operating Expenses as a % of Gross Profit (1)
|
|
|
67.2
|
%
|
|
70.3
|
%
|
|
69.0
|
%
|
|
69.6
|
%
|
|
67.2
|
%
|
|
(1)
|
bps
|
|
(1)
| |
A reconciliation of non-GAAP financial measures is presented in the Non-GAAP Financial Information section of the press release attached as Exhibit 99.1 included in this Current Report on Form 8-K. |
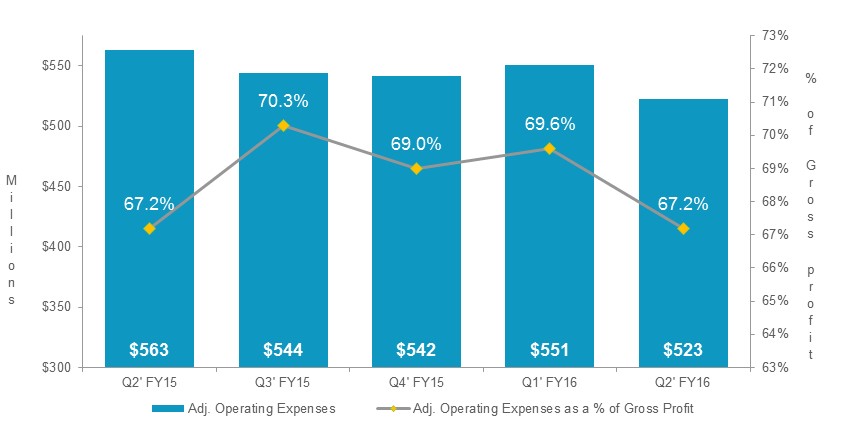
|
·
| |
Adjusted operating expenses were $522.9 million in the second quarter of fiscal 2016, a decrease of $40 million, or 7.1%, from the second quarter of fiscal 2015. |
|
o
| |
The year-over-year decrease in adjusted operating expenses was primarily due to the translation impact of changes in foreign currency exchange rates and from the impact of prior restructuring actions and expense efficiencies including from the Avnet Advantage initiative. |
|
o
| |
Sequentially, adjusted operating expenses decreased $28.2 million, or 5.1%, primarily due to the impact of the extra week of sales in the September quarter. |
|
·
| |
Adjusted operating expenses as a percentage of gross profit of 67.2% was essentially flat from the year ago quarter. |
|
o
| |
EM operating expenses as a percentage of gross profit increased 38 basis points from the year ago quarter primarily due to lower gross profit related to the decline in revenue. |
|
o
| |
TS operating expenses as a percentage of gross profit decreased 212 basis points from the year ago quarter primarily due to portfolio and expense management initiatives in prior quarters. |
Avnet, Inc. Q2 Fiscal Year 2016
$ in millions - except per share data
January 28, 2016
Operating Income
|
|
|
|
|
|
|
|
|
|
|
|
|
|
|
|
|
|
|
|
|
|
|
|
Q2' FY15
|
Q3' FY15
|
Q4' FY15
|
Q1' FY16
|
Q2' FY16
|
Y/Y Change
|
|
GAAP Operating Income
|
|
$
|
250.3
|
|
$
|
203.7
|
|
$
|
180.5
|
|
$
|
207.0
|
|
$
|
226.1
|
|
$
|
(24.2)
|
|
|
Adjusted Operating Income (1)
|
|
$
|
274.6
|
|
$
|
230.4
|
|
$
|
243.8
|
|
$
|
240.4
|
|
$
|
255.3
|
|
$
|
(19.3)
|
|
|
Adjusted Operating Income Margin (1)
|
|
|
3.6
|
%
|
|
3.4
|
%
|
|
3.6
|
%
|
|
3.5
|
%
|
|
3.7
|
%
|
|
9
|
bps
|
|
|
|
|
|
|
|
|
|
|
|
|
|
|
|
|
|
|
|
|
|
|
Electronics Marketing (EM) Total
|
|
|
|
|
|
|
|
|
|
|
|
|
|
|
|
|
|
|
|
|
Operating Income
|
|
$
|
191.4
|
|
$
|
197.3
|
|
$
|
205.9
|
|
$
|
213.0
|
|
$
|
174.0
|
|
$
|
(17.5)
|
|
|
Operating Income Margin
|
|
|
4.3
|
%
|
|
4.7
|
%
|
|
4.8
|
%
|
|
4.8
|
%
|
|
4.2
|
%
|
|
(9)
|
bps
|
|
|
|
|
|
|
|
|
|
|
|
|
|
|
|
|
|
|
|
|
|
|
Technology Solutions (TS) Total
|
|
|
|
|
|
|
|
|
|
|
|
|
|
|
|
|
|
|
|
|
Operating Income
|
|
$
|
117.6
|
|
$
|
68.1
|
|
$
|
77.6
|
|
$
|
74.5
|
|
$
|
117.1
|
|
$
|
(0.5)
|
|
|
Operating Income Margin
|
|
|
3.8
|
%
|
|
2.7
|
%
|
|
3.1
|
%
|
|
3.0
|
%
|
|
4.3
|
%
|
|
51
|
bps
|
|
(1)
| |
A reconciliation of non-GAAP financial measures is presented in the Non-GAAP Financial Information section of the press release attached as Exhibit 99.1 included in this Current Report on Form 8-K. |
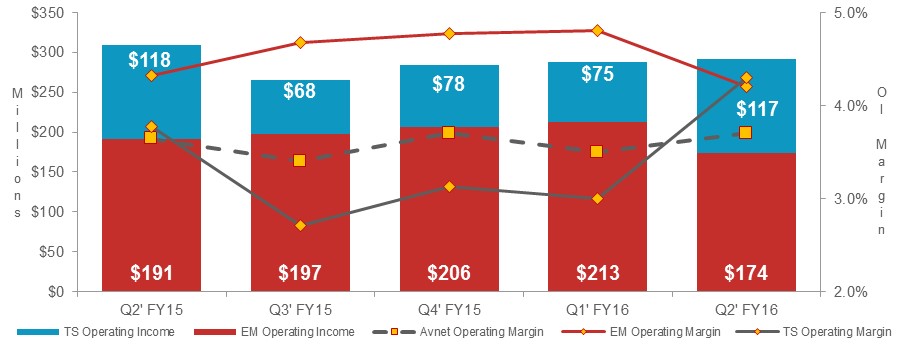
|
·
| |
Avnet’s adjusted operating income of $255.3 million decreased 7.0% year over year primarily due to the translation impact of the stronger U.S. Dollar. Adjusted operating income, increased $14.8 million, or 6.2% sequentially primarily due to the seasonal sequential increase at TS partially offset by a decline at EM. |
|
o
| |
Avnet adjusted operating income margin of 3.7% increased 9 basis points year over year and 28 basis points sequentially. |
|
·
| |
EM operating income margin of 4.2% decreased 9 basis points from the year ago quarter primarily due to the translation impact of the strengthening U.S. Dollar and declines in sales year over year, partially offset by a decline in SG&A expenses. Sequentially, operating income margin declined 53 basis points primarily due to the seasonal revenue decline in the western regions. |
|
·
| |
TS operating income margin of 4.3% increased 51 basis points from the year ago quarter as a result of improvements in gross profit margin and a decline in SG&A expenses, partially offset by a decline in sales. Operating income margin increased 130 basis points sequentially primarily due to the seasonal growth in sales all three regions. |
Avnet, Inc. Q2 Fiscal Year 2016
$ in millions - except per share data
January 28, 2016
Interest Expense, Other Income (Expense) and Income Taxes
|
|
|
|
|
|
|
|
|
|
|
|
|
|
|
|
|
|
|
|
|
|
|
|
Q2' FY15
|
Q3' FY15
|
Q4' FY15
|
Q1' FY16
|
Q2' FY16
|
Y/Y Change
|
|
Interest Expense
|
|
$
|
24.7
|
|
$
|
23.9
|
|
$
|
23.7
|
|
$
|
23.6
|
|
$
|
22.4
|
|
$
|
(2.2)
|
|
|
Other Income (Expense)
|
|
$
|
(5.5)
|
|
$
|
(8.9)
|
|
$
|
(3.1)
|
|
$
|
(5.9)
|
|
$
|
(6.5)
|
|
$
|
1.0
|
|
|
|
|
|
|
|
|
|
|
|
|
|
|
|
|
|
|
|
|
|
|
|
GAAP Income Tax Expense (Benefit)
|
|
$
|
56.4
|
|
$
|
49.4
|
|
$
|
(5.1)
|
|
$
|
47.3
|
|
$
|
41.2
|
|
$
|
(15.2)
|
|
|
Adjusted Income Tax Expense (1)
|
|
$
|
68.4
|
|
$
|
54.1
|
|
$
|
61.2
|
|
$
|
58.0
|
|
$
|
62.0
|
|
$
|
(6.4)
|
|
|
GAAP Effective Tax Rate
|
|
|
25.6
|
%
|
|
28.9
|
%
|
|
(3.3)
|
%
|
|
26.6
|
%
|
|
20.9
|
%
|
|
(473)
|
bps
|
|
Adjusted Effective Tax Rate (1)
|
|
|
28.0
|
%
|
|
27.4
|
%
|
|
27.7
|
%
|
|
27.5
|
%
|
|
27.4
|
%
|
|
(60)
|
bps
|
|
(1)
| |
A reconciliation of non-GAAP financial measures is presented in the Non-GAAP Financial Information section of the press release attached as Exhibit 99.1 included in this Current Report on Form 8-K. |
|
·
| |
Interest expense of $22.4 million decreased $2.2 million from the year ago quarter primarily due to the repayment at maturity of the $250.0 million 6.0% Notes in September 2015 and a corresponding lower average borrowing rate. |
|
·
| |
The Company incurred $6.5 million of other expense in the second quarter of fiscal 2016 compared with $5.5 million of other expense in the second quarter of fiscal 2015. The increase in other expense was primarily due to the strengthening of the U.S. Dollar relative to foreign currencies versus the year ago quarter and the corresponding higher costs incurred to hedge foreign currency exposures. |
|
·
| |
The GAAP effective tax rate was 20.9% in the second quarter of fiscal 2016 as compared with 25.6% in the second quarter of fiscal 2015. The Company’s effective tax rate was favorably impacted by (i) the mix of income in lower tax jurisdictions, (ii) the release of valuation allowances against deferred tax assets that were determined to be realizable and (iii) the release of reserves related to audit settlements and the expiration of statutes of limitation. |
Avnet, Inc. Q2 Fiscal Year 2016
$ in millions - except per share data
January 28, 2016
Net Income and EPS
|
|
|
|
|
|
|
|
|
|
|
|
|
|
|
|
|
|
|
|
|
|
|
|
Q2' FY15
|
Q3' FY15
|
Q4' FY15
|
Q1' FY16
|
Q2' FY16
|
Y/Y Change
|
|
GAAP Net Income
|
|
$
|
163.7
|
|
$
|
121.5
|
|
$
|
158.7
|
|
$
|
130.3
|
|
$
|
156.0
|
|
$
|
(7.7)
|
|
|
Adjusted Net Income (1)
|
|
$
|
176.0
|
|
$
|
143.5
|
|
$
|
159.5
|
|
$
|
152.9
|
|
$
|
164.3
|
|
$
|
(11.6)
|
|
|
|
|
|
|
|
|
|
|
|
|
|
|
|
|
|
|
|
|
|
|
|
GAAP Diluted EPS
|
|
$
|
1.18
|
|
$
|
0.88
|
|
$
|
1.15
|
|
$
|
0.96
|
|
$
|
1.16
|
|
|
(1.7)
|
%
|
|
Adjusted Diluted EPS (1)
|
|
$
|
1.27
|
|
$
|
1.04
|
|
$
|
1.16
|
|
$
|
1.12
|
|
$
|
1.22
|
|
|
(3.9)
|
%
|
|
(1)
| |
A reconciliation of non-GAAP financial measures is presented in the Non-GAAP Financial Information section of the press release attached as Exhibit 99.1 included in this Current Report on Form 8-K. |
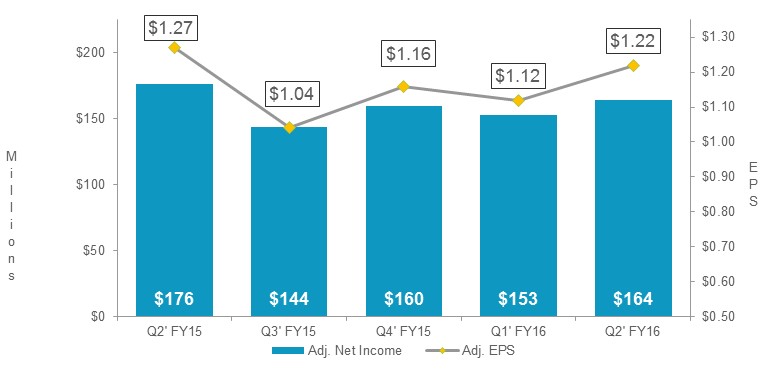
|
·
| |
GAAP net income decreased by 4.7% year over year to $156.0 million or $1.16 per share on a diluted basis, primarily due to the decrease in operating income. |
|
·
| |
Adjusted net income for the second quarter of fiscal 2016 was $164.3 million, or $1.22 per share on a diluted basis. |
|
o
| |
Adjusted net income decreased 6.6% from the year ago quarter primarily due to the decline in operating income and the negative impact of foreign currency when translating the results into U.S. Dollars. Adjusted diluted earnings per share declined $0.05, or 3.9% from the year ago quarter. The year-over-year change was negatively impacted by approximately $0.07 due to the translation impact of changes in foreign currency exchange rates. |
|
o
| |
Adjusted diluted earnings per share of $1.22 increased $0.10, or 8.9%, sequentially primarily due to the improvement in profitability at TS. |
Avnet, Inc. Q2 Fiscal Year 2016
$ in millions - except per share data
January 28, 2016
Working Capital
|
|
|
|
|
|
|
|
|
|
|
|
|
|
|
|
|
|
|
|
|
|
|
|
Q2' FY15
|
Q3' FY15
|
Q4' FY15
|
Q1' FY16
|
Q2' FY16
|
Y/Y Change
|
|
Accounts Receivable
|
|
$
|
5,696.6
|
|
$
|
4,994.8
|
|
$
|
5,054.3
|
|
$
|
4,903.2
|
|
$
|
5,395.0
|
|
$
|
(301.6)
|
|
|
Inventories
|
|
$
|
2,493.6
|
|
$
|
2,474.4
|
|
$
|
2,482.2
|
|
$
|
2,805.0
|
|
$
|
2,650.2
|
|
$
|
156.6
|
|
|
Accounts Payable
|
|
$
|
(3,850.3)
|
|
$
|
(3,272.0)
|
|
$
|
(3,338.1)
|
|
$
|
(3,339.8)
|
|
$
|
(3,628.1)
|
|
$
|
222.2
|
|
|
Working Capital
|
|
$
|
4,339.9
|
|
$
|
4,197.2
|
|
$
|
4,198.4
|
|
$
|
4,368.4
|
|
$
|
4,417.1
|
|
$
|
77.2
|
|
|
Working Capital Velocity (1)
|
|
|
6.59
|
|
|
6.03
|
|
|
6.27
|
|
|
6.06
|
|
|
6.12
|
|
|
(0.47)
|
|
|
(1)
| |
A reconciliation of non-GAAP financial measures is presented in the Non-GAAP Financial Information section of the press release attached as Exhibit 99.1 included in this Current Report on Form 8-K. |
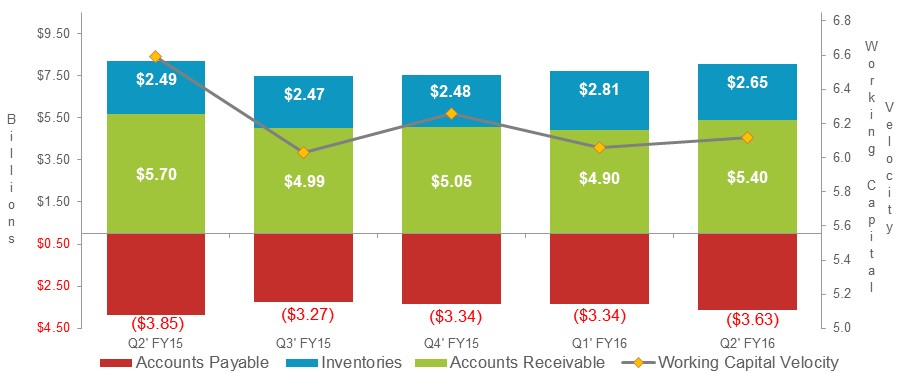
|
·
| |
Working capital (accounts receivable plus inventories less accounts payable) increased $77.2 million, or 1.8%, and $256.5 million, or 5.9%, year over year in constant currency, primarily due to an increase in inventory at EM. |
|
o
| |
On a sequential basis, working capital increased $48.7 million, or 1.1%, and 2.1% when adjusted for the translation impact of changes in foreign currency exchange rates, primarily due to an increase in working capital at TS to support the seasonal sequential growth. |
|
·
| |
Working capital velocity was essentially flat sequentially and declined 0.47 turns from the year ago quarter due to the decrease in sales. |
|
·
| |
Inventories increased $156.6 million, or 6.3%, year over year and increased 11.0% in constant currency primarily due to an increase at EM. |
|
o
| |
On a sequential basis, inventories decreased $154.8 million, or 5.5%, and decreased 4.6% in constant currency, primarily due to a decline at EM Asia related to high volume supply chain engagements. |
Avnet, Inc. Q2 Fiscal Year 2016
$ in millions - except per share data
January 28, 2016
Returns
|
|
|
|
|
|
|
|
|
|
|
|
|
|
|
|
|
|
Q2' FY15
|
Q3' FY15
|
Q4' FY15
|
Q1' FY16
|
Q2' FY16
|
Y/Y Change
|
|
Return on Working Capital (ROWC) (1)
|
|
24.0
|
%
|
20.6
|
%
|
22.5
|
%
|
20.9
|
%
|
22.8
|
%
|
(115)
|
bps
|
|
Return on Capital Employed (ROCE) (1)
|
|
12.9
|
%
|
11.1
|
%
|
12.0
|
%
|
11.2
|
%
|
12.3
|
%
|
(60)
|
bps
|
|
(1)
| |
A reconciliation of non-GAAP financial measures is presented in the Non-GAAP Financial Information section of the press release attached as Exhibit 99.1 included in this Current Report on Form 8-K. |
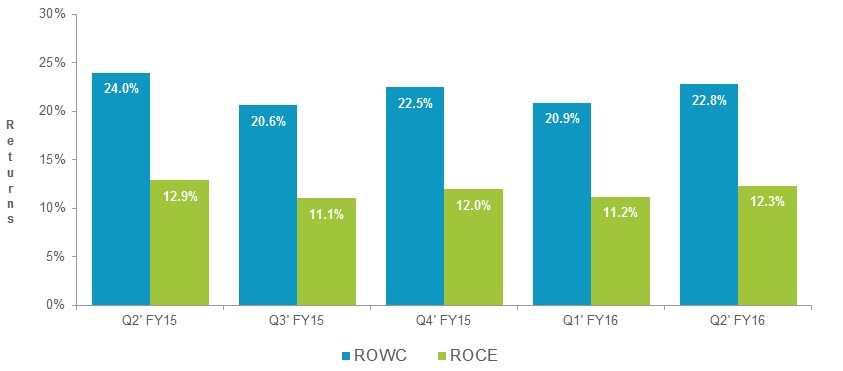
|
·
| |
ROWC for the second quarter of fiscal 2016 was 22.8%, a decrease of 115 basis points year over year and an increase of 191 basis points sequentially. The year-over-year decrease is primarily related to the decline in profitability at EM. |
|
·
| |
ROCE of 12.3% decreased 60 basis points year over year and increased 112 basis points sequentially. |
Avnet, Inc. Q2 Fiscal Year 2016
$ in millions - except per share data
January 28, 2016
Cash Flow
|
|
|
|
|
|
|
|
|
|
|
|
|
|
|
|
|
|
|
|
|
|
|
|
Q2' FY15
|
|
Q3' FY15
|
|
Q4' FY15
|
|
Q1' FY16
|
|
Q2' FY16
|
|
Y/Y Change
|
|
|
Net Income
|
|
$
|
163.7
|
|
$
|
121.5
|
|
$
|
158.7
|
|
$
|
130.3
|
|
$
|
156.0
|
|
$
|
(7.7)
|
|
|
Non-Cash Items
|
|
$
|
70.5
|
|
$
|
84.8
|
|
$
|
75.7
|
|
$
|
74.8
|
|
$
|
53.4
|
|
$
|
(17.1)
|
|
|
Working Capital and Other
|
|
$
|
30.9
|
|
$
|
(146.2)
|
|
$
|
64.9
|
|
$
|
(238.8)
|
|
$
|
(91.4)
|
|
$
|
(122.3)
|
|
|
Cash Flow from Operations
|
|
$
|
265.1
|
|
$
|
60.1
|
|
$
|
299.3
|
|
$
|
(33.7)
|
|
$
|
118.0
|
|
$
|
(147.1)
|
|
|
TTM CF from Operations
|
|
$
|
616.0
|
|
$
|
318.1
|
|
$
|
583.9
|
|
$
|
590.8
|
|
$
|
443.7
|
|
$
|
(172.3)
|
|
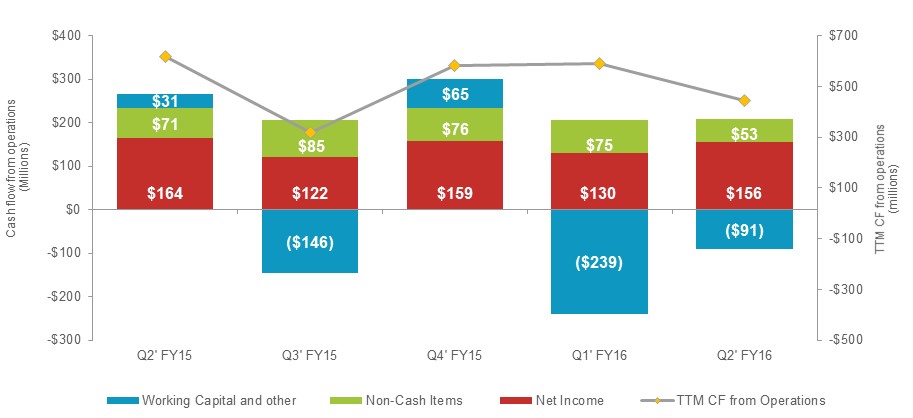
|
·
| |
During the second quarter of fiscal 2016, cash flow from operations of $118.0 million declined from the year ago quarter primarily due to the sequential increase in working capital at TS as compared with a decline in working capital in the prior year at EM. The trailing twelve month cash flow generated from operations was $443.7 million and over the past four quarters, our trailing twelve month cash flow from operations has averaged $484 million. |
|
·
| |
During the second quarter of fiscal 2016, the Company repurchased approximately 900,000 shares representing an aggregate investment of $39.9 million. In addition, the Company purchased an additional $65 million worth of shares quarter to date and still has approximately $303 million remaining in the current authorization program. |
|
·
| |
During the second quarter of fiscal 2016, the Company paid a dividend of $0.17 per share, or $22.4 million in total. |
|
·
| |
Cash and cash equivalents at the end of the quarter were $916.1 million, of which $798.5 million was held outside the United States; net debt (total debt less cash and cash equivalents) was approximately $1.3 billion. |
Avnet, Inc. Q2 Fiscal Year 2016
$ in millions - except per share data
January 28, 2016
Forward-Looking Statements
This document contains certain “forward-looking statements” within the meaning of Section 27A of the Securities Act of 1933, as amended, and Section 21E of the Securities Exchange Act of 1934, as amended. These statements are based on management’s current expectations and are subject to uncertainty and changes in facts and circumstances. The forward-looking statements herein include statements addressing future financial and operating results of Avnet and may include words such as “will,” “anticipate,” “estimate,” “forecast,” “expect,” “believe,” and “should,” and other words and terms of similar meaning in connection with any discussions of future operating or financial performance, business prospects or market conditions. Actual results may differ materially from the expectations contained in the forward-looking statements.
The following factors, among others, could cause actual results to differ materially from those described in the forward-looking statements: the Company’s ability to retain and grow market share and to generate additional cash flow, risks associated with any acquisition activities and the successful integration of acquired companies, declines in sales, changes in business conditions and the economy in general, changes in market demand and pricing pressures, any material changes in the allocation of product or product rebates by suppliers, and other competitive and/or regulatory factors affecting the businesses of Avnet generally.
More detailed information about these and other factors is set forth in Avnet’s filings with the Securities and Exchange Commission, including the Company’s reports on Form 10-K, Form 10-Q and Form 8-K. Except as required by law, Avnet is under no obligation to update any forward-looking statements, whether as a result of new information, future events or otherwise.
Organic Sales
Organic sales is defined as reported sales adjusted for the impact of more than insignificant acquisitions and divestitures by adjusting Avnet’s prior periods to include the sales of acquired businesses and exclude the sales of divested businesses as if the acquisitions and divestitures had occurred at the beginning of the earliest period presented. Additionally, fiscal 2016 sales are adjusted for the estimated impact of the extra week of sales in the first quarter of fiscal 2016 due to the 14-week fiscal first quarter and the 53-week fiscal year. Organic sales in constant currency is defined as organic sales excluding the impact of changes in foreign currency exchange rates.
Non-GAAP Financial Information
In addition to disclosing financial results that are determined in accordance with generally accepted accounting principles in the United States (“GAAP”), the Company also discloses in this document certain non-GAAP financial information including adjusted operating income, adjusted operating expenses, adjusted net income and adjusted diluted earnings per share, as well as sales adjusted for the impact of acquisitions and other items (as defined in the Organic Sales section of this document). There are also references to the impact of foreign currency in the discussion of the Company’s results of operations. When the U.S. Dollar strengthens and the stronger exchange rates of the current year are used to translate the results of operations of Avnet’s subsidiaries denominated in foreign currencies, the resulting impact is a decrease in U.S. Dollars of reported results. Conversely, when the U.S. Dollar weakens and the weaker exchange rates of the current year are used to translate the results of operations of Avnet’s subsidiaries denominated in foreign currencies, the resulting impact is an increase in U.S. Dollars of reported results. In the discussion of the Company’s results of operations, results excluding this impact are referred to as “excluding the translation impact of changes in foreign currency exchange rates” or “constant currency.” In order to determine the translation impact of changes in foreign currency exchange rates for sales, income or expense items, the Company adjusts the exchange rates used in current periods to be consistent with the exchange rates in effect during prior periods. Management believes organic sales and sales in constant currency are useful measures for evaluating current period performance as compared with prior periods and for understanding underlying trends. Management believes that operating income and operating expenses adjusted for (i) restructuring, integration and other expenses and (ii) amortization of acquired intangible assets and other, are useful measures to help investors better assess and understand the Company’s operating performance, especially when comparing results with previous periods or forecasting performance for future periods, primarily because management views the excluded items to be outside of Avnet’s normal operating results or non-cash in nature. Management analyzes operating income and operating expenses without the impact of these items as an indicator of ongoing margin performance and underlying trends in the business. Management also uses these non-GAAP measures to establish operational goals and, in many cases, for measuring performance for compensation purposes.
Additional non-GAAP metrics management uses are adjusted operating income margin, which is defined as adjusted operating income (as defined above) divided by sales and adjusted operating expense to gross profit ratio, which is defined as adjusted operating expenses (as defined above) divided by gross profit.
Management believes net income and diluted EPS adjusted for (i) the impact of the items described above, (ii) certain items impacting other expense and (iii) certain items impacting income tax expense is useful to investors because it provides a measure of the Company’s net profitability on a more comparable basis to historical periods and provides a more meaningful basis for forecasting future performance. Additionally, because of management’s focus on generating shareholder value, of which net profitability is a primary driver, management believes net income and diluted EPS excluding the impact of these items provides an important measure of the Company’s net results for the investing public.
Avnet, Inc. Q2 Fiscal Year 2016
$ in millions - except per share data
January 28, 2016
Other metrics management monitors in its assessment of business performance include return on working capital (ROWC), return on capital employed (ROCE) and working capital velocity (WC velocity).
|
·
| |
ROWC is defined as annualized adjusted operating income (as defined above) divided by the sum of the monthly average balances of receivables and inventories less accounts payable. |
|
·
| |
ROCE is defined as annualized, tax effected adjusted operating income (as defined above) divided by the monthly average balances of interest-bearing debt and equity (including the impact of adjustments to operating income discussed above) less cash and cash equivalents. |
|
·
| |
WC velocity is defined as annualized sales divided by the sum of the monthly average balances of receivables and inventories less accounts payable. |
Any analysis of results and outlook on a non-GAAP basis should be used as a complement to, and in conjunction with, results presented in accordance with GAAP. A reconciliation of the GAAP financial measures to the non-GAAP financial measures is included in the Company’s press release dated January 28, 2016 (Exhibit 99.1) in this Current Report on Form 8-K.
Avnet (NASDAQ:AVT)
Historical Stock Chart
From Mar 2024 to Apr 2024

Avnet (NASDAQ:AVT)
Historical Stock Chart
From Apr 2023 to Apr 2024
