CommerceWest Bank (OTCBB: CWBK) reported earnings for the three
months ended June 30, 2012 of $1,016,000 or $0.24 per basic common
share and $0.23 per diluted common share, compared with net income
of $343,000 or $0.08 per basic common share and $0.08 per diluted
common share for the three months ended June 30, 2011, an increase
of 200% and 188% respectively. The bank reported earnings for the
six months ended June 30, 2012 of $1,598,000 million or $0.37 per
basic common share and $0.36 per diluted common share, compared
with net income of $725,000 or $0.16 per basic common share and
$0.16 per diluted common share for the six months ended June 30,
2011, an increase of 131% and 125% respectively.
Financial performance highlights for the three months ended June
30, 2012 as compared to the three months ended June 30, 2011:
- Earnings growth of 195%
- Return on average assets of 1.30%, an
increase of 189%
- Non-interest income growth of 79%
- Non-interest expense reduction of
10%
- Cost of funds reduced 22%
- Loan growth of 19%
- Nonperforming assets reduced 75%, from
1.40% to 0.34% of total assets
- Non-interest bearing deposit growth of
30%
- A fortress balance sheet, with a tier 1
leverage ratio of 13.38% and total risk based capital ratio of
22.07%
- No TARP
Financial performance highlights for the three months ended June
30, 2012 as compared to the three months ended March 31, 2012:
- Earnings growth of 74%
- Non-interest income growth of 19%
- Non-interest expense reduction of
8%
- Nonperforming assets reduced 57%, from
0.83% to 0.34% of total assets
- Asset growth of 5%
- Loan growth of 8%
- Non-interest bearing deposit growth of
12%
- Total deposit growth of 7%
Mr. Ivo Tjan, Chairman and CEO stated, "The team has again
demonstrated the strength of our business model, core competency
and ability to grow with profitability. Our team members are
talented, passionate and will continue the mission to build the
best business banking franchise in California. Our proven business
model has allowed us to materially improve asset quality, while at
the same time growing core deposits and total loans. The Bank
continues to execute on our strategic approach of balancing between
offense and defense, which resulted in a 75% reduction in
non-performing assets, 19% growth in loans, a 30% increase in
non-interest bearing deposits and a 37% increase in non-interest
income year over year; while at the same time reducing non-interest
expense by 11%. Our results for the second quarter were highlighted
by strong earnings growth of 195% as compared to the same three
month period one year ago and 120% earnings growth for the six
months ended June 30, 2012, as compared to the same six month
period one year ago."
Mr. Tjan continued, "As we stated earlier in the year, the
runway is clear and we have begun to execute on delivering results
for our shareholders and clients. We are confident in our future
and our ability to grow the franchise value by managing growth with
profitability, which focuses on top line revenue, fee income
generation, quality loan growth, expanding the mixture in
non-interest bearing deposits and increasing core earnings."
Total assets increased $13.8 million as of June 30, 2012, an
increase of 4% as compared to the same period one year ago. Total
loans increased $26.1 million as of June 30, 2012, an increase of
19% over the prior year. Cash and due from banks decreased $10.7
million or 17% from the prior year. Total investment securities
decreased $7.5 million or 8% from the prior year.
Total deposits increased $11 million as of June 30, 2012, an
increase of 4% from June 30, 2011. Non-interest bearing deposits
grew $22.2 million as of June 30, 2012, an increase of 30% over the
prior year.
Stockholders’ equity on June 30, 2012 was $46.7 million, an
increase of 5% as compared to stockholders’ equity of $44.5 million
a year ago.
Total nonperforming assets decreased $3.3 million as of June 30,
2012, a decrease of 75% as compared to the same period one year
ago, from 1.40% to 0.34% of total assets. Provision for loan losses
for the three months ended June 30, 2012 was $75,000 compared to
$60,000 for the three months ended June 30, 2012, an increase of
25%. Provision for loan losses for the six months ended June 30,
2012 was $195,000 compared to $160,000 for the six months ended
June 30, 2012, an increase of 22%.
Non-interest income for the three months ended June 30, 2012 was
$945,000 compared to $529,000 for the same period last year, an
increase of 79%. Non-interest income for the six months ended June
30, 2012 was $1,737,000 compared to $1,267,000 for the same period
last year, an increase of 37%.
Non-interest expense for the three months ended June 30, 2012
was $2,332,000 compared to $2,579,000 for the same period last
year, a decrease of 10%. Non-interest expense for the six months
ended June 30, 2012 was $4,857,000 compared to $5,429,000 for the
same period last year, a decrease of 11%.
The Bank’s efficiency ratio for the three months ended June 30,
2012 was 59.01% compared to 83.78% in 2011, which represents a
decrease of 30%. The efficiency ratio illustrates, that for every
dollar the Bank made for the three month period ending June 30,
2012, the Bank spent $0.59 to make it, as compared to $0.84 one
year ago.
Capital ratios for the Bank remain well above the levels
required for a “well capitalized” institution as designated by
regulatory agencies. As of June 30, 2012, the leverage ratio was
13.38%, the tier 1 capital ratio was 20.82%, and the total
risk-based capital ratio was 22.07%.
CommerceWest Bank is headquartered at 2111 Business Center Drive
in Irvine, CA, with Regional Offices in Orange County, Riverside
County, Los Angeles County and San Diego County. We are a full
service business bank and offer a wide range of commercial banking
services, including concierge services, remote deposit solution,
full-service internet banking, lines of credit, term loans,
commercial real estate lending, SBA lending, and full cash
management.
Mission Statement: CommerceWest Bank will create a complete
banking experience for each client, catering to businesses and
their specific banking needs, while accommodating our clients and
providing them high-quality, low stress and personally tailored
banking and financial services.
Please visit www.cwbk.com to learn more about the bank. “BANK ON
THE DIFFERENCE”
Statements concerning future performance, developments or
events, expectations for growth and income forecasts, and any other
guidance on future periods, constitute forward-looking statements
that are subject to a number of risks and uncertainties. Actual
results may differ materially from stated expectations. Specific
factors include, but are not limited to, loan production, balance
sheet management, expanded net interest margin, the ability to
control costs and expenses, interest rate changes, financial
policies of the United States government and general economic
conditions. The Company disclaims any obligation to update any such
factors or to publicly announce the results of any revisions to any
forward-looking statements contained in this release to reflect
future events or developments.
SECOND QUARTER REPORT - JUNE 30, 2012 (Unaudited)
BALANCE SHEET Increase (dollars
in thousands)
June 30, 2012 June 30, 2011
(Decrease) ASSETS Cash and due from banks
51,371 62,063 -17 % Securities 83,980 91,449 -8 % Loans 164,013
137,880 19 % Less allowance for loan losses (3,081 ) (3,967 ) -22 %
Loans, net 160,932 133,913 20 % Bank premises and equipment,
net 380 740 -49 % Other assets 30,969 25,670 21 %
Total assets 327,632 313,835 4 %
LIABILITIES AND STOCKHOLDERS' EQUITY Non-interesting bearing
deposits 95,872 73,698 30 % Interest bearing deposits 182,585
193,752 -6 % Total deposits 278,457 267,450 4 % Total
borrowings 500 500 0 % Other liabilities 1,911 1,415
35 % 280,868 269,365 4 % Stockholders' equity 46,764 44,470
5 % Total liabilities and stockholders' equity 327,632
313,835 4 %
CAPITAL
RATIOS:
Tier 1 leverage ratio 13.38 % 12.94 % 3 % Tier 1 risk-based capital
ratio 20.82 % 21.01 % -1 % Total risk-based capital ratio 22.07 %
22.27 % -1 %
STATEMENT OF
EARNINGS Three Months Ended
Increase Six Months Ended
Increase (dollars in thousands except share and per
share data)
June 30, 2012 June 30,
2011 (Decrease) June 30, 2012
June 30, 2011 (Decrease) Interest
income 3,071 3,192 -4 % 6,116 6,502 -6 % Interest expense
593 738 -20 % 1,203 1,455
-17 % Net interest income 2,478 2,454 1 % 4,913 5,047 -3 %
Provision for loan losses 75 60 25 % 195 160 22 % Non-interest
income 945 529 79 % 1,737 1,267 37 % Non-interest expense
2,332 2,579 -10 % 4,857
5,429 -11 % Earnings before income taxes 1,016 344 195 %
1,598 725 120 % Income taxes 0 0 0 %
0 0 0 % Net earnings 1,016
344 195 % 1,598 725
120 % Basic earnings per share $ 0.24 $ 0.08 200 % $
0.37 $ 0.16 131 % Diluted earnings per share $ 0.23 $ 0.08 188 % $
0.36 $ 0.16 125 % Return on Assets (annualized) 1.30 % 0.45 % 189 %
1.05 % 0.48 % 119 % Return on Equity (annualized) 8.76 % 3.10 % 183
% 6.89 % 3.33 % 107 % Efficiency Ratio 59.01 % 83.78 % -30 % 63.48
% 83.45 % -24 % Net Interest Margin 3.71 % 3.68 % 1 % 3.74 % 3.82 %
-2 %
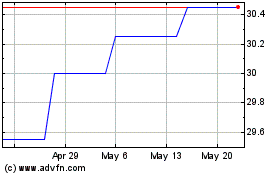
CW Bancorp (QX) (USOTC:CWBK)
Historical Stock Chart
From Mar 2024 to Apr 2024

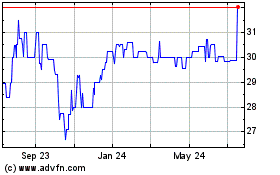
CW Bancorp (QX) (USOTC:CWBK)
Historical Stock Chart
From Apr 2023 to Apr 2024
