Crown Castle Down Nearly 7%, on Pace for Largest Percent Decrease Since August 2011 -- Data Talk
February 27 2020 - 12:36PM
Dow Jones News
Crown Castle International Corp (CCI) is currently at $151.57,
down $11.12 or 6.84%
-- Would be lowest close since Feb. 7, 2020, when it closed at
$150.49
-- On pace for largest percent decrease since Aug. 4, 2011, when
it fell 6.94%
-- On Wednesday, Crown Castle said it was re-stating multiple
years of results citing errors in when revenue from tower
installation services was recognized
-- The company said fourth-quarter net revenue rose to $1.43
billion from $1.41 billion a year earlier. Analysts expected $1.42
billion. Net income, after $28 million in preferred stock
dividends, rose to $180 million, or 43 cents a share
-- Currently down four consecutive days; down 9.81% over this
period
-- Longest losing streak since Nov. 5, 2019, when it fell for
four straight trading days
-- Worst four day stretch since the four days ending March 3,
2009, when it fell 10.81%
-- Up 6.63% year-to-date
-- Down 9.81% from its all-time closing high of $168.06 on Feb.
21, 2020
-- Up 27.64% from its 52 week closing low of $118.75 on Feb. 28,
2019
-- Traded as low as $147.00; lowest intraday level since Jan.
21, 2020, when it hit $145.12
-- Down 9.64% at today's intraday low; largest intraday percent
decrease since Feb. 17, 2009, when it fell as much as 9.7%
-- Fifth worst performer in the S&P 500 today
All data as of 11:48:58 AM
Source: Dow Jones Market Data, FactSet
(END) Dow Jones Newswires
February 27, 2020 12:21 ET (17:21 GMT)
Copyright (c) 2020 Dow Jones & Company, Inc.
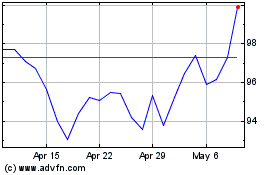
Crown Castle (NYSE:CCI)
Historical Stock Chart
From Mar 2024 to Apr 2024

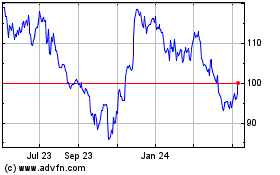
Crown Castle (NYSE:CCI)
Historical Stock Chart
From Apr 2023 to Apr 2024
