0001612630 False 0001612630 2024-03-07 2024-03-07 iso4217:USD xbrli:shares iso4217:USD xbrli:shares
UNITED STATES
SECURITIES AND EXCHANGE COMMISSION
Washington, D.C. 20549
_________________
FORM 8-K
_________________
CURRENT REPORT
Pursuant to Section 13 or 15(d)
of the Securities Exchange Act of 1934
Date of Report (Date of earliest event reported): March 7, 2024
_______________________________
The Joint Corp.
(Exact name of registrant as specified in its charter)
_______________________________
| Delaware | 001-36724 | 90-0544160 |
| (State or Other Jurisdiction of Incorporation) | (Commission File Number) | (I.R.S. Employer Identification No.) |
16767 N. Perimeter Drive, Suite 110
Scottsdale, Arizona 85260
(Address of Principal Executive Offices) (Zip Code)
(480) 245-5960
(Registrant's telephone number, including area code)
(Former name or former address, if changed since last report)
_______________________________
Check the appropriate box below if the Form 8-K filing is intended to simultaneously satisfy the filing obligation of the registrant under any of the following provisions:
| ☐ | Written communications pursuant to Rule 425 under the Securities Act (17 CFR 230.425) |
| ☐ | Soliciting material pursuant to Rule 14a-12 under the Exchange Act (17 CFR 240.14a-12) |
| ☐ | Pre-commencement communications pursuant to Rule 14d-2(b) under the Exchange Act (17 CFR 240.14d-2(b)) |
| ☐ | Pre-commencement communications pursuant to Rule 13e-4(c) under the Exchange Act (17 CFR 240.13e-4(c)) |
Securities registered pursuant to Section 12(b) of the Act:
| Title of each class | Trading Symbol(s) | Name of each exchange on which registered |
| Common Stock, $0.001 Par Value Per Share | JYNT | The NASDAQ Capital Market LLC |
Indicate by check mark whether the registrant is an emerging growth company as defined in Rule 405 of the Securities Act of 1933 (§230.405 of this chapter) or Rule 12b-2 of the Securities Exchange Act of 1934 (§240.12b-2 of this chapter).
Emerging growth company ☐
If an emerging growth company, indicate by check mark if the registrant has elected not to use the extended transition period for complying with any new or revised financial accounting standards provided pursuant to Section 13(a) of the Exchange Act. ☐
Item 2.02. Results of Operations and Financial Condition.
On March 7, 2024, The Joint Corp. (the “Company”) issued a press release announcing its financial results for the fourth quarter and full year ended December 31, 2023. The press release is furnished as Exhibit 99.1 to this Current Report on Form 8-K.
The information furnished in this Item 2.02 and Exhibit 99.1 shall not be deemed “filed” for purposes of Section 18 of the Securities Exchange Act of 1934, as amended (the “Exchange Act”), or otherwise subject to the liabilities of that section, nor shall it be incorporated by reference in any filing under the Securities Act of 1933, as amended, or the Exchange Act, except as expressly set forth by specific reference in such a filing.
Item 7.01. Regulation FD Disclosure.
The Company is posting an earnings presentation to its website at https://ir.thejoint.com/. A copy of the earnings presentation is being furnished herewith as Exhibit 99.2. The Company will use the earnings presentation during its earnings conference call on March 7, 2024 and also may use the earnings presentation from time to time in conversations with analysts, investors and others.
The information furnished in this Item 7.01 and Exhibit 99.2 shall not be deemed “filed” for purposes of Section 18 of the Exchange Act, or otherwise subject to the liabilities of that section, nor shall it be incorporated by reference in any filing under the Securities Act of 1933, as amended, or the Exchange Act, except as expressly set forth by specific reference in such a filing.
The information contained in Exhibit 99.2 is summary information that is intended to be considered in the context of the Company’s filings with the SEC. The Company undertakes no duty or obligation to publicly update or revise the information contained in this report, although it may do so from time to time as its management believes is warranted. Any such updating may be made through the filing of other reports or documents with the SEC, through press releases or through other public disclosure.
Item 9.01. Financial Statements and Exhibits.
SIGNATURE
Pursuant to the requirements of the Securities Exchange Act of 1934, the registrant has duly caused this report to be signed on its behalf by the undersigned hereunto duly authorized.
| | The Joint Corp. |
| | | |
| | | |
| Date: March 7, 2024 | By: | /s/ Peter D. Holt |
| | | Peter D. Holt |
| | | President and Chief Executive Officer |
| | | |
EXHIBIT 99.1
The Joint Corp. Reports Fourth Quarter and Year-end 2023 Financial Results
- Grew 2023 Revenue 16%, System-wide Sales 12%, and System-wide Comp Sales 4% vs. 2022 -
- Increased Clinic Count to 935 at Year-end 2023, Initiating Refranchising Program -
SCOTTSDALE, Ariz., March 07, 2024 (GLOBE NEWSWIRE) -- The Joint Corp. (NASDAQ: JYNT), a national operator, manager, and franchisor of chiropractic clinics, reported its financial results for the quarter and year ended December 31, 2023.
Financial Highlights: Q4 2023 Compared to Q4 2022
- Grew revenue 11% to $30.6 million.
- Recorded net loss on disposition or impairment of $1.5 million, compared to $50,000.
- Recorded operating loss of $147,000, compared to operating income of $1.5 million.
- Recorded non-cash valuation allowance against deferred tax assets of $10.8 million.
- Reported net loss, including the non-cash valuation allowance, of $11.0 million. This compares to net income of $763,000.
- Increased system-wide sales1 by 11% to $133.1 million.
- Reported system-wide comp sales2 of 5%.
- Reported Adjusted EBITDA of $4.0 million, compared to $4.0 million.
Financial Highlights: 2023 Compared to 2022
- Grew revenue 16% to $117.7 million.
- Recorded net loss on disposition or impairment of $2.6 million, compared to $410,000.
- Reported operating loss of $2.1 million, compared to operating income of $828,000.
- Reported net loss, including the non-cash valuation allowance, of $9.8 million. This compares to net income of $627,000.
- Increased system-wide sales1 12% to $488.0 million.
- Reported comp sales2 of 4%.
- Reported Adjusted EBITDA of $12.2 million, compared to $11.5 million.
2023 Full Year Operating Highlights
- Performed 13.6 million patient visits, compared to 12.2 million in 2022.
- Treated 932,000 new patients, compared to 845,000 in 2022.
- 36% of the new patients in 2023 were new to chiropractic prior to visiting The Joint.
- Increased system-wide sales1 12%, compared to 21% in 2022.
- Delivered comp sales2 of 4%, compared to 9% in 2022.
- Sold 55 franchise licenses, compared to 75 in 2022.
- Expanded total clinic count to 935, up from 838 clinics at December 31, 2022.
- Franchised clinics: Opened 104, closed 13, and sold three to corporate, bringing the total to 800 franchised clinics in operation at December 31, 2023, compared to 712 at December 31, 2022.
- Company-owned or managed clinics: Opened 10, closed four, and acquired three, bringing the total to 135 company-owned or managed clinics in operation at December 31, 2023, compared to 126 at December 31, 2022.
_____________________________________
1 System-wide sales include revenues at all clinics, whether operated or managed by the company or by franchisees. While franchised sales are not recorded as revenues by the company, management believes the information is important in understanding the company’s financial performance, because these revenues are the basis on which the company calculates and records royalty fees and are indicative of the financial health of the franchisee base.
2 Comp sales include the revenues from both company-owned or managed clinics and franchised clinics that in each case have been open at least 13 full months and exclude any clinics that have closed.
“During 2023, our team delivered growth in system-wide sales, revenue, Adjusted EBITDA, the number of patient visits, and the number of patients treated as well as improved new patient conversion and existing patient attrition rates in a market of ongoing uncertainty among our patient demographic,” said Peter D. Holt, President and Chief Executive Officer of The Joint Corp. “Yet, we aim to do better and are implementing marketing initiatives to drive top-line growth through increased new patient count and patient engagement. Simultaneously, we are refranchising the majority of our corporate clinics, which we expect to ultimately increase our bottom line and cash flow. These actions will create opportunities for us to reinvest in The Joint and strengthen the health of our franchise network. As we advance our vision to be the Champions of Chiropractic, we expect to generate value for all of our stakeholders.”
Financial Results for Fourth Quarter Ended December 31: 2023 Compared to 2022
Revenue was $30.6 million in the fourth quarter of 2023, compared to $27.7 million in the fourth quarter of 2022. The increase reflects a greater number of franchised and corporate clinics and continued organic growth. Cost of revenue was $2.9 million, compared to $2.5 million in the fourth quarter of 2022, reflecting the associated higher regional developer royalties and commissions.
Selling and marketing expenses were $3.4 million, up 2%, reflecting cost management efforts and the timing of the national marketing fund. Depreciation and amortization expenses decreased 18% for the fourth quarter of 2023, as compared to the prior year period, primarily due to the impact of corporate clinics that are being held for sale in connection with the refranchising efforts.
General and administrative expenses were $21.3 million, compared to $18.3 million in the fourth quarter of 2022, reflecting increases in costs to support clinic growth and in payroll to remain competitive in the tight labor market.
Loss on disposition or impairment was $1.5 million dollars, compared to $50,000 in the fourth quarter of 2022. The increase is related to our refranchising efforts, which includes those additional corporate clinics that were announced to be held for sale in November 2023. Operating loss, including the aforementioned impairment charge, was $147,000, compared to operating income of $1.5 million in the fourth quarter of 2022.
Income tax expense, including non-cash valuation allowance recorded against deferred tax assets of $10.8 million, was $10.9 million. This compares to income tax expense of $629,000 in the fourth quarter of 2022. Net loss including the non-cash valuation allowance was $11.0 million, or $0.75 per basic share. This compares to net income of $763,000, or $0.05 per diluted share, in the fourth quarter of 2022.
Adjusted EBITDA was $4.0 million for both the fourth quarter of 2023 and 2022.
Financial Results for Year Ended December 31: 2023 Compared to 2022
Revenue was $117.7 million in 2023, compared to $101.3 million in 2022. Net loss including the non-cash valuation allowance was $9.8 million, or $0.66 per basic share. This compares to 2022 net income of $627,000, or $0.04 per diluted share.
Balance Sheet Liquidity
Unrestricted cash was $18.2 million at December 31, 2023, compared to $9.7 million at December 31, 2022. The increase during 2023 reflects $14.7 million cash flow from operations, including the receipt of the employee retention credits of $4.8 million, partially offset by $6.2 million invested in clinic acquisitions, development of greenfield clinics, and improvements of existing clinics and corporate assets.
2024 Guidance
Because the timing of the corporate clinic sales is uncertain and will impact revenue and Adjusted EBITDA, the company has modified the financial guidance metrics to be system-wide gross sales and system-wide sales comps. The company will continue to provide guidance on new franchise openings excluding the impact of refranchised clinics.
- 2024 System-wide sales are expected to be between $530 and $545 million dollars, compared to $488.0 million dollars in 2023.
- System-wide comp sales for all clinics open 13 months or more are expected to be in the mid-single digits in 2024.
- 2024 new franchised clinic openings, excluding the impact of refranchised clinics, are expected to be between 60 and 75, compared to 104 in 2023.
Conference Call
The Joint Corp. management will host a conference call at 5:00 p.m. ET on Thursday, March 7, 2024 to discuss the fourth quarter and year-end 2023 financial results. Shareholders and interested participants may listen to a live broadcast of the conference call by dialing (833) 630-0823 or (412) 317-1831 and ask to be joined into the ‘The Joint’ call approximately 15 minutes prior to the start time.
The live webcast of the call with accompanying slide presentation can be accessed in the IR events section https://ir.thejoint.com/events and will be available for approximately one year. An audio archive can be accessed for one week by dialing (877) 344-7529 or (412) 317-0088 and entering conference ID 5448318.
Commonly Discussed Performance Metrics
This release includes a presentation of commonly discussed performance metrics. System-wide sales include revenues at all clinics, whether operated by the company or by franchisees. While franchised sales are not recorded as revenues by the company, management believes the information is important in understanding the company’s financial performance, because these sales are the basis on which the company calculates and records royalty fees and are indicative of the financial health of the franchisee base. System-wide comp sales include the revenues from both company-owned or managed clinics and franchised clinics that in each case have been open at least 13 full months and exclude any clinics that have closed.
Non-GAAP Financial Information
This release also includes a presentation of non-GAAP financial measures. EBITDA and Adjusted EBITDA are presented because they are important measures used by management to assess financial performance, as management believes they provide a more transparent view of the company’s underlying operating performance and operating trends. Reconciliation of historical net income/(loss) to EBITDA and Adjusted EBITDA is presented in the table below. The company defines EBITDA as net income/(loss) before net interest, tax expense, depreciation, and amortization expenses. The company defines Adjusted EBITDA as EBITDA before acquisition-related expenses (which includes contract termination costs associated with reacquired regional developer rights), net (gain)/loss on disposition or impairment, stock-based compensation expenses, costs related to restatement filings, restructuring costs and other income related to employee retention credits.
EBITDA and Adjusted EBITDA do not represent and should not be considered alternatives to net income or cash flows from operations, as determined by accounting principles generally accepted in the United States, or GAAP. While EBITDA and Adjusted EBITDA are used as measures of financial performance and the ability to meet debt service requirements, they are not necessarily comparable to other similarly titled captions of other companies due to potential inconsistencies in the methods of calculation. EBITDA and Adjusted EBITDA should be reviewed in conjunction with the company’s financial statements filed with the SEC.
Forward-Looking Statements
This press release contains statements about future events and expectations that constitute forward-looking statements. Forward-looking statements are based on our beliefs, assumptions and expectations of industry trends, our future financial and operating performance and our growth plans, taking into account the information currently available to us. These statements are not statements of historical fact. Words such as, "anticipates," "believes," "continues," "estimates," "expects," "goal," "objectives," "intends," "may," "opportunity," "plans," "potential," "near-term," "long-term," "projections," "assumptions," "projects," "guidance," "forecasts," "outlook," "target," "trends," "should," "could," "would," "will," and similar expressions are intended to identify such forward-looking statements. Specific forward looking statements made in this press release include, among others, our aim to do better and our implementation of marketing initiatives to drive top-line growth through increased new patient count and patient engagement; our expectation that refranchising of the majority of our corporate clinics will ultimately increase our bottom line and cash flow; our belief that such actions will create opportunities for us to reinvest in The Joint and strengthen the health of our franchise network; our expectation that as we advance our vision to be the Champions of Chiropractic, we will generate value for all of our stakeholders; our expectation of high variability timing of the corporate clinic sales and their impact to revenue and Adjusted EBITDA during the execution of the refranchising strategy; our plan to continue to provide guidance on new franchise openings excluding the impact of refranchised clinics; and our expectations for 2024 system-wide sales, system-wide comp sales, and new franchised clinic openings, excluding the impact of refranchised clinics. Forward-looking statements involve risks and uncertainties that may cause our actual results to differ materially from the expectations of future results we express or imply in any forward-looking statements, and you should not place undue reliance on such statements. Factors that could contribute to these differences include, but are not limited to, our inability to identify and recruit enough qualified chiropractors and other personnel to staff our clinics, due in part to the nationwide labor shortage and an increase in operating expenses due to measures we may need to take to address such shortage; inflation, which has increased our costs and which could otherwise negatively impact our business; our failure to profitably operate company-owned or managed clinics; our failure to refranchise as planned; short-selling strategies and negative opinions posted on the internet, which could drive down the market price of our common stock and result in class action lawsuits; our failure to remediate future material weaknesses in our internal control over financial reporting, which could negatively impact our ability to accurately report our financial results, prevent fraud, or maintain investor confidence; and other factors described in our filings with the SEC, including in the section entitled “Risk Factors” in our Annual Report on Form 10-K/A for the year ended December 31, 2022 filed with the SEC on September 26, 2023 and subsequently-filed current and quarterly reports. We qualify any forward-looking statements entirely by these cautionary factors. We assume no obligation to update or revise any forward-looking statements for any reason or to update the reasons actual results could differ materially from those anticipated in these forward-looking statements, even if new information becomes available in the future. Comparisons of results for current and any prior periods are not intended to express any future trends or indications of future performance, unless expressed as such, and should only be viewed as historical data.
About The Joint Corp. (NASDAQ: JYNT)
The Joint Corp. (NASDAQ: JYNT) revolutionized access to chiropractic care when it introduced its retail healthcare business model in 2010. Today, it is the nation's largest operator, manager and franchisor of chiropractic clinics through The Joint Chiropractic network. The company is making quality care convenient and affordable, while eliminating the need for insurance for millions of patients seeking pain relief and ongoing wellness. With over 900 locations nationwide and more than 13 million patient visits annually, The Joint Chiropractic is a key leader in the chiropractic industry. Consistently named to Franchise Times "Top 500+ Franchises" and Entrepreneur's "Franchise 500" lists and recognized by FRANdata with the TopFUND award, as well as Franchise Business Review's "Top Franchise for 2023," "Most Profitable Franchises" and "Top Franchises for Veterans" ranking, The Joint Chiropractic is an innovative force, where healthcare meets retail. For more information, visit www.thejoint.com. To learn about franchise opportunities, visit www.thejointfranchise.com.
Business Structure
The Joint Corp. is a franchisor of clinics and an operator of clinics in certain states. In Arkansas, California, Colorado, District of Columbia, Florida, Illinois, Kansas, Kentucky, Maryland, Michigan, Minnesota, New Jersey, New York, North Carolina, Oregon, Pennsylvania, Tennessee, Washington, and West Virginia, The Joint Corp. and its franchisees provide management services to affiliated professional chiropractic practices.
Media Contact: Margie Wojciechowski, The Joint Corp., margie.wojciechowski@thejoint.com
Investor Contact: Kirsten Chapman, LHA Investor Relations, 415-433-3777, thejoint@lhai.com
– Financial Tables Follow –
| THE JOINT CORP. |
| CONSOLIDATED BALANCE SHEETS |
| |
| | Dec. 31, 2023 | | Dec. 31,2022 |
| ASSETS | | | |
| Current assets: | | | |
| Cash and cash equivalents | $ | 18,153,609 | | | $ | 9,745,066 | |
| Restricted cash | | 1,060,683 | | | | 805,351 | |
| Accounts receivable | | 3,718,924 | | | | 3,911,272 | |
| Deferred franchise and regional development costs, current portion | | 1,047,430 | | | | 1,054,060 | |
| Prepaid expenses and other current assets | | 2,439,837 | | | | 2,098,359 | |
| Assets held for sale | | 17,915,055 | | | | — | |
| Total current assets | | 44,335,538 | | | | 17,614,108 | |
| Property and equipment, net | | 11,044,317 | | | | 17,475,152 | |
| Operating lease right-of-use asset | | 12,413,221 | | | | 20,587,199 | |
| Deferred franchise and regional development costs, net of current portion | | 5,203,936 | | | | 5,707,678 | |
| Intangible assets, net | | 5,020,926 | | | | 10,928,295 | |
| Goodwill | | 7,352,879 | | | | 8,493,407 | |
| Deferred tax assets ($1.1 million and $1.0 million attributable to VIEs as of Dec. 31, 2023 and 2022) | | 1,031,648 | | | | 11,928,152 | |
| Deposits and other assets | | 748,394 | | | | 756,386 | |
| Total assets | $ | 87,150,859 | | | $ | 93,490,377 | |
| | | | |
| LIABILITIES AND STOCKHOLDERS' EQUITY | | | |
| Current liabilities: | | | |
| Accounts payable | $ | 1,625,088 | | | $ | 2,966,589 | |
| Accrued expenses | | 1,963,009 | | | | 1,069,610 | |
| Co-op funds liability | | 1,060,683 | | | | 805,351 | |
| Payroll liabilities ($0.7 million and $0.6 million attributable to VIEs as of Dec. 31, 2023 and 2022) | | 3,485,744 | | | | 2,030,510 | |
| Operating lease liability, current portion | | 3,756,328 | | | | 5,295,830 | |
| Finance lease liability, current portion | | 25,491 | | | | 24,433 | |
| Deferred franchise fee revenue, current portion | | 2,516,554 | | | | 2,468,601 | |
| Deferred revenue from company clinics ($1.6 million and $4.7 million attributable to VIEs as of Dec. 31, 2023 and 2022) | | 4,463,747 | | | | 7,471,549 | |
| Upfront regional developer fees, current portion | | 362,326 | | | | 487,250 | |
| Other current liabilities | | 483,249 | | | | 597,294 | |
| Liabilities to be disposed of ($3.6 million attributable to VIEs as of Dec. 31, 2023) | | 13,831,863 | | | | — | |
| Total current liabilities | | 33,574,082 | | | | 23,217,017 | |
| Operating lease liability, net of current portion | | 10,914,997 | | | | 18,672,719 | |
| Finance lease liability, net of current portion | | 38,016 | | | | 63,507 | |
| Debt under the Credit Agreement | | 2,000,000 | | | | 2,000,000 | |
| Deferred franchise fee revenue, net of current portion | | 13,597,325 | | | | 14,161,134 | |
| Upfront regional developer fees, net of current portion | | 1,019,316 | | | | 1,500,278 | |
| Other liabilities | | 1,235,241 | | | | 1,287,879 | |
| Total liabilities | | 62,378,977 | | | | 60,902,534 | |
| Commitments and contingencies (note 10) | | | |
| Stockholders' equity: | | | |
| Series A preferred stock, $0.001 par value; 50,000 shares authorized, 0 issued and outstanding, as of Dec. 31, 2023 and 2022 | | — | | | | — | |
| Common stock, $0.001 par value; 20,000,000 shares authorized, 14,783,757 shares issued and 14,751,633 shares outstanding as of Dec. 31, 2023 and 14,560,353 shares issued and 14,528,487 outstanding as of Dec. 31, 2022 | | 14,783 | | | | 14,560 | |
| Additional paid-in capital | | 47,498,151 | | | | 45,558,305 | |
| Treasury stock 32,124 shares as of Dec. 31, 2023 and 31,866 shares as of Dec. 31, 2022, at cost | | (860,475 | ) | | | (856,642 | ) |
| Accumulated deficit | | (21,905,577 | ) | | | (12,153,380 | ) |
| Total The Joint Corp. stockholders' equity | | 24,746,882 | | | | 32,562,843 | |
| Non-controlling Interest | | 25,000 | | | | 25,000 | |
| Total equity | | 24,771,882 | | | | 32,587,843 | |
| Total liabilities and stockholders' equity | $ | 87,150,859 | | | $ | 93,490,377 | |
| | | | | | | | |
| THE JOINT CORP. |
| CONSOLIDATED INCOME STATEMENTS |
| |
| | Three Months Ended
December 31, | | Year Ended
December 31, |
| | 2023 | | 2022 | | 2023 | | 2022 |
| | | | | | | | |
| Revenues: | | | | | | | |
| Revenues from company-owned or managed clinics | $ | 17,905,781 | | | $ | 16,485,996 | | | $ | 70,718,880 | | | $ | 59,422,294 | |
| Royalty fees | | 7,978,859 | | | | 7,165,732 | | | | 29,160,831 | | | | 26,190,531 | |
| Franchise fees | | 703,073 | | | | 471,070 | | | | 2,882,895 | | | | 2,441,325 | |
| Advertising fund revenue | | 2,277,481 | | | | 2,038,855 | | | | 8,321,043 | | | | 7,456,696 | |
| Software fees | | 1,340,168 | | | | 1,124,007 | | | | 5,086,562 | | | | 4,290,739 | |
| Other revenues | | 409,041 | | | | 392,719 | | | | 1,526,145 | | | | 1,450,725 | |
| Total revenues | | 30,614,403 | | | | 27,678,379 | | | | 117,696,356 | | | | 101,252,310 | |
| Cost of revenues: | | | | | | | |
| Franchise and regional development cost of revenues | | 2,457,409 | | | | 2,108,682 | | | | 9,063,375 | | | | 7,803,404 | |
| IT cost of revenues | | 414,852 | | | | 357,211 | | | | 1,483,183 | | | | 1,367,659 | |
| Total cost of revenues | | 2,872,261 | | | | 2,465,893 | | | | 10,546,558 | | | | 9,171,063 | |
| Selling and marketing expenses | | 3,372,911 | | | | 3,296,210 | | | | 16,541,990 | | | | 13,962,709 | |
| Depreciation and amortization | | 1,688,675 | | | | 2,068,172 | | | | 8,582,203 | | | | 6,646,622 | |
| General and administrative expenses | | 21,310,066 | | | | 18,332,914 | | | | 81,466,088 | | | | 70,233,447 | |
| Total selling, general and administrative expenses | | 26,371,652 | | | | 23,697,296 | | | | 106,590,281 | | | | 90,842,778 | |
| Net loss on disposition or impairment | | 1,517,865 | | | | 50,075 | | | | 2,632,604 | | | | 410,215 | |
| Income (loss) from operations | | (147,375 | ) | | | 1,465,115 | | | | (2,073,087 | ) | | | 828,254 | |
| Other income (expense), net | | 3,444 | | | | (72,433 | ) | | | 3,711,843 | | | | (133,101 | ) |
| Income (loss) before income tax (benefit) expense | | (143,931 | ) | | | 1,392,682 | | | | 1,638,756 | | | | 695,153 | |
| Income tax (benefit) expense | | 10,897,667 | | | | 629,425 | | | | 11,390,953 | | | | 68,448 | |
| Net (loss) income | $ | (11,041,598 | ) | | $ | 763,257 | | | $ | (9,752,197 | ) | | $ | 626,705 | |
| | | | | | | | |
| | | | | | | | |
| Basic (loss) earnings per share | $ | (0.75 | ) | | $ | 0.05 | | | $ | (0.66 | ) | | $ | 0.04 | |
| Diluted (loss) earnings per share | $ | (0.75 | ) | | $ | 0.05 | | | $ | (0.65 | ) | | $ | 0.04 | |
| | | | | | | | |
| Basic weighted average shares | | 14,753,079 | | | | 14,529,829 | | | | 14,688,115 | | | | 14,488,314 | |
| Diluted weighted average shares | | 14,933,539 | | | | 14,817,591 | | | | 14,935,217 | | | | 14,868,093 | |
| | | | | | | | | | | | | | | | |
| THE JOINT CORP. |
| CONSOLIDATED STATEMENTS OF CASH FLOWS |
| |
| | Year Ended December 31, |
| | 2023
| | 2022
|
| | | | |
| Cash flows from operating activities: | | | |
| Net (loss) income | $ | (9,752,197 | ) | | $ | 626,705 | |
| Adjustments to reconcile net (loss) income to net cash provided by operating activities: | | | |
| Depreciation and amortization | | 8,582,203 | | | | 6,646,622 | |
| Net loss on disposition or impairment (non-cash portion) | | 2,632,604 | | | | 410,215 | |
| Net franchise fees recognized upon termination of franchise agreements | | (217,827 | ) | | | (68,537 | ) |
| Deferred income taxes | | 10,896,504 | | | | (441,353 | ) |
| Stock based compensation expense | | 1,737,682 | | | | 1,273,989 | |
| Changes in operating assets and liabilities: | | | |
| Accounts receivable | | 192,348 | | | | (154,672 | ) |
| Prepaid expenses and other current assets | | (341,478 | ) | | | 183,406 | |
| Deferred franchise costs | | 355,952 | | | | (351,151 | ) |
| Deposits and other assets | | 1,492 | | | | (189,184 | ) |
| Accounts payable | | (1,381,836 | ) | | | 818,265 | |
| Accrued expenses | | 793,679 | | | | (1,170,070 | ) |
| Payroll liabilities | | 1,455,234 | | | | (1,875,807 | ) |
| Upfront regional developer fees | | (598,778 | ) | | | (1,288,134 | ) |
| Deferred revenue | | 301,095 | | | | 2,889,139 | |
| Other liabilities | | 20,912 | | | | 900,151 | |
| Net cash provided by operating activities | | 14,677,589 | | | | 8,209,584 | |
| | | | |
| Cash flows from investing activities: | | | |
| Acquisition of AZ clinics | | — | | | | (6,966,923 | ) |
| Acquisition of NC clinics | | — | | | | (3,289,312 | ) |
| Acquisition of CA clinics | | (1,188,765 | ) | | | (1,850,000 | ) |
| Proceeds from sale of clinics | | — | | | | 105,200 | |
| Purchase of property and equipment | | (4,999,070 | ) | | | (5,899,080 | ) |
| Net cash used in investing activities | | (6,187,835 | ) | | | (17,900,115 | ) |
| | | | |
| Cash flows from financing activities: | | | |
| Payments of finance lease obligation | | (24,432 | ) | | | (49,855 | ) |
| Purchases of treasury stock under employee stock plans | | (3,833 | ) | | | (5,804 | ) |
| Proceeds from exercise of stock options | | 202,386 | | | | 384,269 | |
| Net cash provided by financing activities | | 174,121 | | | | 328,610 | |
| | | | |
| Increase (decrease) in cash | | 8,663,875 | | | | (9,361,921 | ) |
| Cash, cash equivalents and restricted cash, beginning of period | | 10,550,417 | | | | 19,912,338 | |
| Cash, cash equivalents and restricted cash, end of period | $ | 19,214,292 | | | $ | 10,550,417 | |
| | | | |
| | December 31,
2023 | | December 31,
2022 |
| Reconciliation of cash, cash equivalents and restricted cash: | | | |
| Cash and cash equivalents | $ | 18,153,609 | | | $ | 9,745,066 | |
| Restricted cash | | 1,060,683 | | | | 805,351 | |
| | $ | 19,214,292 | | | $ | 10,550,417 | |
| | | | | | | | |
| THE JOINT CORP. |
| RECONCILIATION FOR GAAP TO NON-GAAP |
| (unaudited) |
| | | | |
| | Three Months Ended
December 31, | | Year Ended
December 31, |
| | 2023 | | 2022 | | 2023 | | 2022 |
| | | | | | | | |
| Non-GAAP Financial Data: | | | | | | | |
| Net income (loss) | $ | (11,041,598 | ) | | $ | 763,257 | | $ | (9,752,197 | ) | | $ | 626,705 |
| Net interest expense (income) | | (3,444 | ) | | | 72,433 | | | 67,461 | | | | 133,101 |
| Depreciation and amortization expense | | 1,688,674 | | | | 2,068,172 | | | 8,582,203 | | | | 6,646,622 |
| Tax expense | | 10,897,667 | | | | 629,425 | | | 11,390,953 | | | | 68,448 |
| EBITDA | | 1,541,299 | | | | 3,533,287 | | | 10,288,420 | | | | 7,474,876 |
| Stock compensation expense | | 528,386 | | | | 304,427 | | | 1,737,682 | | | | 1,273,989 |
| Acquisition related expenses | | — | | | | 80,669 | | | 873,214 | | | | 2,356,049 |
| Loss on disposition or impairment | | 1,517,866 | | | | 50,075 | | | 2,632,604 | | | | 410,215 |
| Costs related to restatement filings | | 380,221 | | | | — | | | 380,221 | | | | — |
| Restructuring Costs | | 72,880 | | | | — | | | 72,880 | | | | — |
| Other income related to the ERC | | — | | | | — | | | (3,779,304 | ) | | | — |
| Adjusted EBITDA | $ | 4,040,652 | | | $ | 3,968,458 | | $ | 12,205,717 | | | $ | 11,515,129 |
EXHIBIT 99.2

Q4 2023 Financial Results As of December 31, 2023 | Reported on March 7, 2024 Exhibit 99.2

Safe Harbor Statements Certain statements contained in this presentation are "forward - looking statements” about future events and expectations. Forward - looking statements are based on our beliefs, assumptions and expectations of industry trends, our future financial and operating performance and our growth plans, taking into account the information currently available to us. These statements are not statements of historical fact. Words such as, "anticipates," "believes," "continues," "estimates," "expects," "goal," "objectives," "intends," "may," "opportunity," "plans," "potential," "near - term," "long - term," "projections," "assumptions," "projects," "guidance," "forecasts," "outlook," "target," "trends," "should," "could," "would," "will," and similar expressions are intended to identify such forward - looking statements. . Specific forward looking statements made in this presentation include, among others our refranchising strategy; our implementation of new marketing programs; 2024 guidance for system - wide sales, system - wide comp sales for all clinics open 13 months or more, and new franchised clinic openings excluding the impact of refranchised clinics; our belief that people will continue to seek more noninvasive, holistic ways to manage their pain and that we’ll be there to treat them; our leading chiropractic care franchise concept; our mission to improve quality of life through routine and affordable chiropractic care; our upside for future growth; our substantial opportunity for market share growth; and our growing market opportunity. Forward - looking statements involve risks and uncertainties that may cause our actual results to differ materially from the expectations of future results we express or imply in any forward - looking statements, and you should not place undue reliance on such statements. Factors that could contribute to these differences include, but are not limited to, our inability to identify and recruit enough qualified chiropractors and other personnel to staff our clinics, due in part to the nationwide labor shortage and an increase in operating expenses due to measures we may need to take to address such shortage; inflation, and the current war in Ukraine, which has increased our costs and which could otherwise negatively impact our business; the potential for disruption to our operations and the unpredictable impact on our business of outbreaks of contagious diseases; our failure to profitably operate company - owned or managed clinics; short - selling strategies and negative opinions posted on the internet, which could drive down the market price of our common stock and result in class action lawsuits; our failure to remediate future material weaknesses in our internal control over financial reporting, which could negatively impact our ability to accurately report our financial results, prevent fraud, or maintain investor confidence; and other factors described in our filings with the SEC, including in the section entitled “Risk Factors” in our Annual Report on Form 10 - K/A for the year ended December 31, 2022 filed with the SEC on September 26, 2023 and subsequently - filed current and quarterly reports. We qualify any forward - looking statements entirely by these cautionary factors. We assume no obligation to update or revise any forward - looking statements for any reason or to update the reasons actual results could differ materially from those anticipated in these forward - looking statements, even if new information becomes available in the future. Comparisons of results for current and any prior periods are not intended to express any future trends or indications of future performance, unless expressed as such, and should only be viewed as historical data. Business Structure The Joint Corp. is a franchisor of clinics and an operator of clinics in certain states. In Arkansas, California, Colorado, District of Columbia, Florida, Illinois, Kansas, Kentucky, Maryland, Michigan, Minnesota, New Jersey, New York, North Carolina, Oregon, Pennsylvania, Rhode Island, South Dakota, Tennessee, Washington, West Virginia and Wyoming. The Joint Corp. and its franchisees provide management services to affiliated professional chiropractic practices. 2 © 2024 The Joint Corp. All Rights Reserved.

Strong Operational KPIs 1 New patient survey completed early 2024. 1.7M unique patients treated in 2023 932K new patients in 2023 13.6M adjustments in 2023 36% of new patients were new to chiropractic in 2023 1 85% system - wide gross sales from monthly memberships in 2023 Up from 1.6M in 2022 ~336K patients in 2023 had never been to a chiropractor before Compared to 845K in 2022 Up from 12.2M in 2022 Compared to 84% in 2022 3 © 2024 The Joint Corp. All Rights Reserved.

Building upon Foundation for Growth 1 System - wide sales include revenues at all clinics, whether operated or managed by the company or by franchisees. While franchised sales are not recorded as revenues by the company, management believes the information is important in understanding the company’s financial performance, because these revenues are the basis on which the company calculates and records royalty fees and are indicative of the financial health of the franchisee base. | 2 Comparable sales include only the sales from clinics that have been open at least 13 or 48 full months and exclude any clinics that have permanently closed. | 3 Loss on disposition or impairment, including those corporate clinics that were announced to be held for sale in November 2023. | 4 Recorded non - cash valuation allowance against deferred tax assets of $10.8 million in Q4 2023. | 5 Net (loss) income included the receipt of the employee retention credits of $4.8 million in 2023. | 5 Adjusted net loss excludes the non - cash valuation allowance. |6 Reconciliation of Adjusted EBITDA to GAAP earnings is included in the Appendix. 12% Increase in system - wide sales 1 2023 over 2022 4% Increase in system – wide comp sales 2 for all clinics >13 months in operation 2023 over 2022 FY 2022 FY 2023 Q4 2022 Q4 2023 $101.3M $117.7M $27.7M $30.6M Revenue $410k $2.6M $50k $1.5M (1)% Loss on disposition or impairment 3 $828k $(2.1)M $1.5M $(147)k Decrease in Operating (loss) / inc. system – wide comp sales 2 $68k $11.4M $629k $10.9M for all clinics >48 months in operation Tax expense 4 $627k $(9.8)M $763k $(11.0)M 2023 over 2022 Net (loss) / inc. 5 $11.5M $12.2M $4.0M $4.0M Adjusted EBITDA 6 Unrestricted cash $18.2M at Dec. 31, 2023, compared to $9.7M at Dec. 31, 2022 © 2024 The Joint Corp. All Rights Reserved. 4
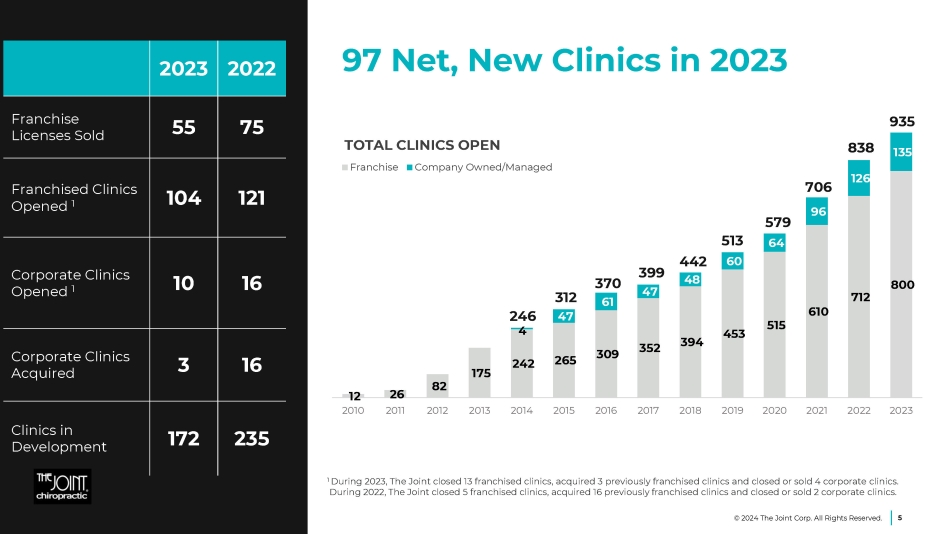
97 Net, New Clinics in 2023 2022 2023 75 55 Franchise Licenses Sold 121 104 Franchised Clinics Opened 1 16 10 Corporate Clinics Opened 1 16 3 Corporate Clinics Acquired 235 172 Clinics in Development 12 26 82 175 242 265 309 352 394 453 515 610 712 800 4 47 61 47 48 60 64 96 126 135 2010 2011 2012 2013 2014 2015 2016 2017 2018 2019 2020 2021 2022 2023 TOTAL CLINICS OPEN Franchise Company Owned/Managed 370 399 442 513 312 246 579 706 838 935 1 During 2023, The Joint closed 13 franchised clinics, acquired 3 previously franchised clinics and closed or sold 4 corporate clinics. During 2022, The Joint closed 5 franchised clinics, acquired 16 previously franchised clinics and closed or sold 2 corporate clinics. 5 © 2024 The Joint Corp. All Rights Reserved.

Refranchising Strategy Majority of corporate clinics: • Quality assets of value • Methodical clustering Prepared framework for sales • 100+ Requests from existing franchisees • Broadening the scope to prospective new franchisees Value maximization: • Generates capital • Increases franchise revenue • Reduces corporate costs 6 © 2024 The Joint Corp. All Rights Reserved.
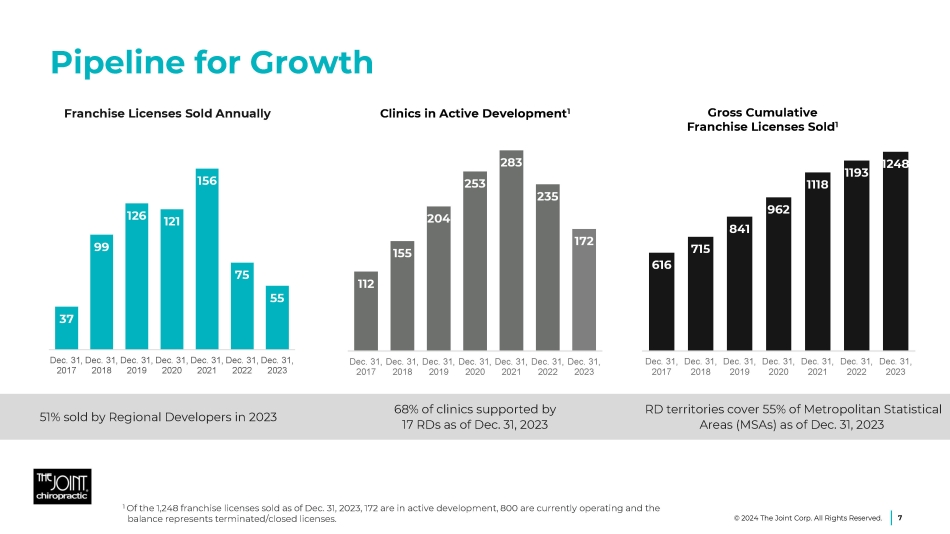
RD territories cover 55% of Metropolitan Statistical Areas (MSAs) as of Dec. 31, 2023 68% of clinics supported by 17 RDs as of Dec. 31, 2023 51% sold by Regional Developers in 2023 37 99 126 121 156 75 55 Dec. 31, Dec. 31, Dec. 31, Dec. 31, Dec. 31, Dec. 31, Dec. 31, 2017 2018 2019 2020 2021 2022 2023 616 715 841 962 1118 1193 1248 Dec. 31, Dec. 31, Dec. 31, Dec. 31, Dec. 31, Dec. 31, Dec. 31, 2017 2018 2019 2020 2021 2022 2023 112 155 204 253 283 235 172 Dec. 31, Dec. 31, Dec. 31, Dec. 31, Dec. 31, Dec. 31, Dec. 31, 2017 2018 2019 2020 2021 2022 2023 Pipeline for Growth 1 Of the 1,248 franchise licenses sold as of Dec. 31, 2023, 172 are in active development, 800 are currently operating and the balance represents terminated/closed licenses. Gross Cumulative Franchise Licenses Sold 1 Franchise Licenses Sold Annually Clinics in Active Development 1 7 © 2024 The Joint Corp. All Rights Reserved.

Key Performance Indicators 12.0% 11.2% 11.0% 2021 2022 2023 Attrition Avg. per Clinic 8 © 2024 The Joint Corp. All Rights Reserved. Total Conversion Avg. per Clinic 50.1% 50.5% 52.1% 2021 2022 2023 New Patients Avg. per Clinic 105 91 86 2021 2022 2023 200 bpt.s increase in Conversion and 100 bpt.s improvement in Attrition

Implementing New Marketing Programs Increasing membership and package sales and with strong annual year - end promotions Driving new patients with new media and advertising Increasing existing and lapsed patient engagement Expanding brand architecture 9 © 2024 The Joint Corp. All Rights Reserved.
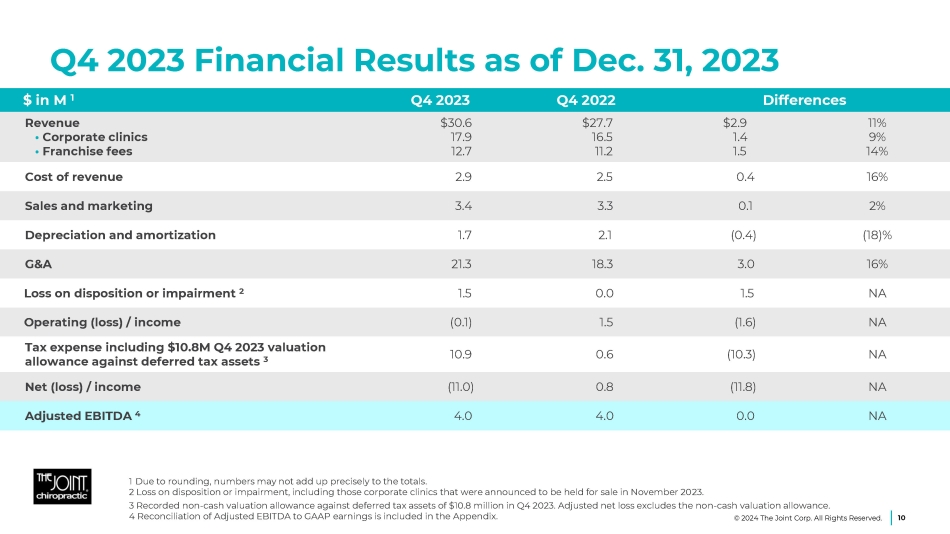
Q4 2023 Financial Results as of Dec. 31, 2023 Differences Q4 2022 Q4 2023 $ in M 1 11% 9% 14% $2.9 1.4 1.5 $27.7 16.5 11.2 $30.6 17.9 12.7 Revenue • Corporate clinics • Franchise fees 16% 0.4 2.5 2.9 Cost of revenue 2% 0.1 3.3 3.4 Sales and marketing (18)% (0.4) 2.1 1.7 Depreciation and amortization 16% 3.0 18.3 21.3 G&A NA 1.5 0.0 1.5 Loss on disposition or impairment 2 NA (1.6) 1.5 (0.1) Operating (loss) / income NA (10.3) 0.6 10.9 Tax expense including $10.8M Q4 2023 valuation allowance against deferred tax assets 3 NA (11.8) 0.8 (11.0) Net (loss) / income NA 0.0 4.0 4.0 Adjusted EBITDA 4 1 Due to rounding, numbers may not add up precisely to the totals. 2 Loss on disposition or impairment, including those corporate clinics that were announced to be held for sale in November 2023. 3 Recorded non - cash valuation allowance against deferred tax assets of $10.8 million in Q4 2023. Adjusted net loss excludes the non - cash valuation allowance. 4 Reconciliation of Adjusted EBITDA to GAAP earnings is included in the Appendix. 10 © 2024 The Joint Corp. All Rights Reserved.

2023 Financial Results as of Dec. 31, 2023 Differences FY 2022 FY 2023 $ in M 1 16% 19% 12% $16.4 11.3 5.2 $101.3 59.4 41.8 $117.7 70.7 47.0 Revenue • Corporate clinics • Franchise fees 15% 1.4 9.2 10.5 Cost of revenue 18% 2.6 14.0 16.5 Sales and marketing 29% 1.9 6.6 8.6 Depreciation and amortization 16% 11.2 70.2 81.5 G&A NA 2.2 0.4 2.6 Loss on disposition or impairment 2 NA (2.9) 0.8 (2.1) Operating (loss) / income NA (11.3) 0.1 11.4 Tax expense including $10.8M Q4 2023 valuation allowance against deferred tax assets 3 NA 3.8 (0.1) 3.7 Other expense, net 4 NA (9.2) 0.6 (9.8) Net (loss) / income 6% 0.7 11.5 12.2 Adjusted EBITDA 5 1 Due to rounding, numbers may not add up precisely to the totals. | 2 Loss on disposition or impairment, including those corporate clinics that were announced to be held for sale in November 2023. |3 Recorded non - cash valuation allowance against deferred tax assets of $10.8 million in Q4 2023. Adjusted net loss excludes the non - cash valuation allowance | 4 Net (loss) income – included the receipt of the employee retention credits of $4.8 million in 2023. | 5 Reconciliation of Adjusted EBITDA to GAAP earnings is included in the Appendix. 11 © 2024 The Joint Corp. All Rights Reserved.
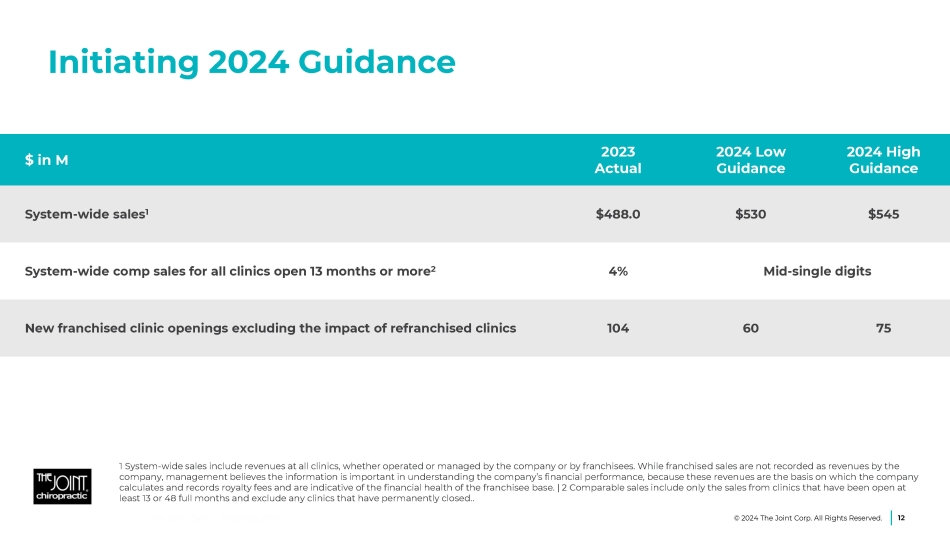
Initiating 2024 Guidance 2024 High Guidance 2024 Low Guidance 2023 Actual $ in M $545 $530 $488.0 System - wide sales 1 Mid - single digits 4% System - wide comp sales for all clinics open 13 months or more 2 75 60 104 New franchised clinic openings excluding the impact of refranchised clinics 1 System - wide sales include revenues at all clinics, whether operated or managed by the company or by franchisees. While franchised sales are not recorded as revenues by the company, management believes the information is important in understanding the company’s financial performance, because these revenues are the basis on which the company calculates and records royalty fees and are indicative of the financial health of the franchisee base. | 2 Comparable sales include only the sales from clinics that have been open at least 13 or 48 full months and exclude any clinics that have permanently closed.. © 2024 The Joint Corp. All Rights Reserved. 12
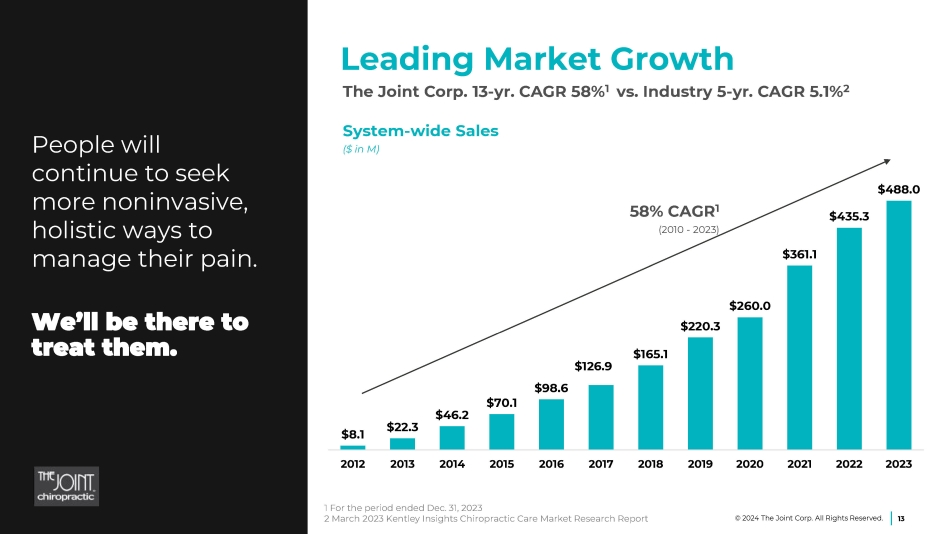
$8.1 $22.3 $70.1 $46.2 $126.9 $98.6 $165.1 $220.3 $260.0 $361.1 $435.3 $488.0 2012 2013 2014 2015 2016 2017 2018 2019 2020 2021 2022 2023 Leading Market Growth The Joint Corp. 13 - yr. CAGR 58% 1 vs. Industry 5 - yr. CAGR 5.1% 2 People will continue to seek more noninvasive, holistic ways to manage their pain. We’ll be there to treat them. 1 For the period ended Dec. 31, 2023 2 March 2023 Kentley Insights Chiropractic Care Market Research Report 13 © 2024 The Joint Corp. All Rights Reserved. System - wide Sales ($ in M) 58% CAGR 1 (2010 - 2023)
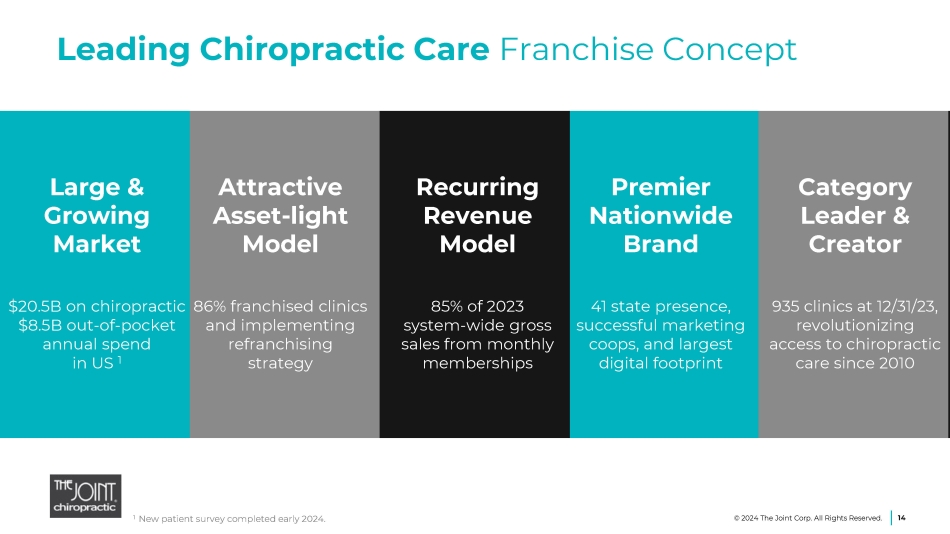
Leading Chiropractic Care Franchise Concept 1 New patient survey completed early 2024. Attractive Asset - light Model and implementing refranchising strategy 14 © 2024 The Joint Corp. All Rights Reserved. Category Leader & Creator 935 clinics at 12/31/23, revolutionizing access to chiropractic care since 2010 Large & Growing Market $20.5B on chiropractic 86% franchised clinics $8.5B out - of - pocket annual spend in US 1 Recurring Revenue Model 85% of 2023 system - wide gross sales from monthly memberships Premier Nationwide Brand 41 state presence, successful marketing coops, and largest digital footprint

15 Appendix © 2024 The Joint Corp. All Rights Reserved.
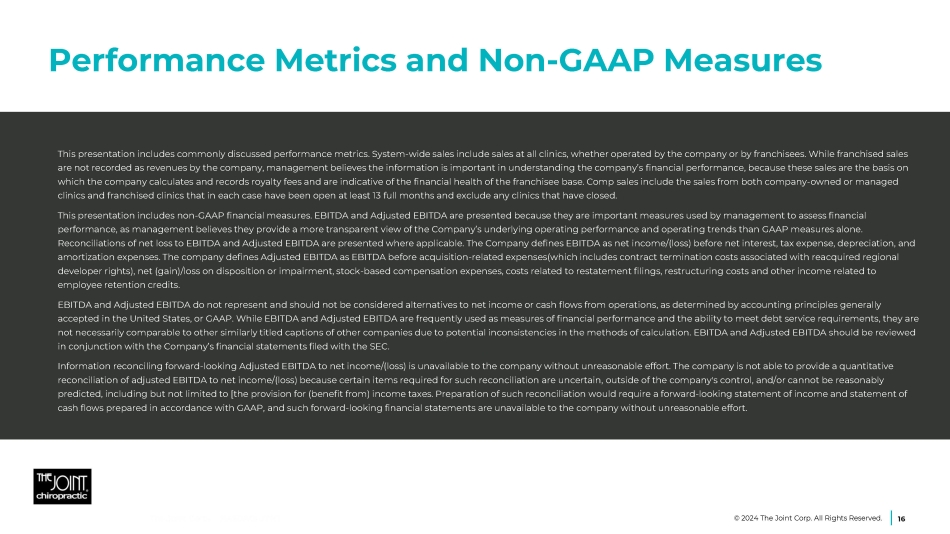
Performance Metrics and Non - GAAP Measures 16 This presentation includes commonly discussed performance metrics. System - wide sales include sales at all clinics, whether operated by the company or by franchisees. While franchised sales are not recorded as revenues by the company, management believes the information is important in understanding the company’s financial performance, because these sales are the basis on which the company calculates and records royalty fees and are indicative of the financial health of the franchisee base. Comp sales include the sales from both company - owned or managed clinics and franchised clinics that in each case have been open at least 13 full months and exclude any clinics that have closed. This presentation includes non - GAAP financial measures. EBITDA and Adjusted EBITDA are presented because they are important measures used by management to assess financial performance, as management believes they provide a more transparent view of the Company’s underlying operating performance and operating trends than GAAP measures alone. Reconciliations of net loss to EBITDA and Adjusted EBITDA are presented where applicable. The Company defines EBITDA as net income/(loss) before net interest, tax expense, depreciation, and amortization expenses. The company defines Adjusted EBITDA as EBITDA before acquisition - related expenses(which includes contract termination costs associated with reacquired regional developer rights), net (gain)/loss on disposition or impairment, stock - based compensation expenses, costs related to restatement filings, restructuring costs and other income related to employee retention credits. EBITDA and Adjusted EBITDA do not represent and should not be considered alternatives to net income or cash flows from operations, as determined by accounting principles generally accepted in the United States, or GAAP. While EBITDA and Adjusted EBITDA are frequently used as measures of financial performance and the ability to meet debt service requirements, they are not necessarily comparable to other similarly titled captions of other companies due to potential inconsistencies in the methods of calculation. EBITDA and Adjusted EBITDA should be reviewed in conjunction with the Company’s financial statements filed with the SEC. Information reconciling forward - looking Adjusted EBITDA to net income/(loss) is unavailable to the company without unreasonable effort. The company is not able to provide a quantitative reconciliation of adjusted EBITDA to net income/(loss) because certain items required for such reconciliation are uncertain, outside of the company's control, and/or cannot be reasonably predicted, including but not limited to [the provision for (benefit from) income taxes. Preparation of such reconciliation would require a forward - looking statement of income and statement of cash flows prepared in accordance with GAAP, and such forward - looking financial statements are unavailable to the company without unreasonable effort. © 2024 The Joint Corp. All Rights Reserved.
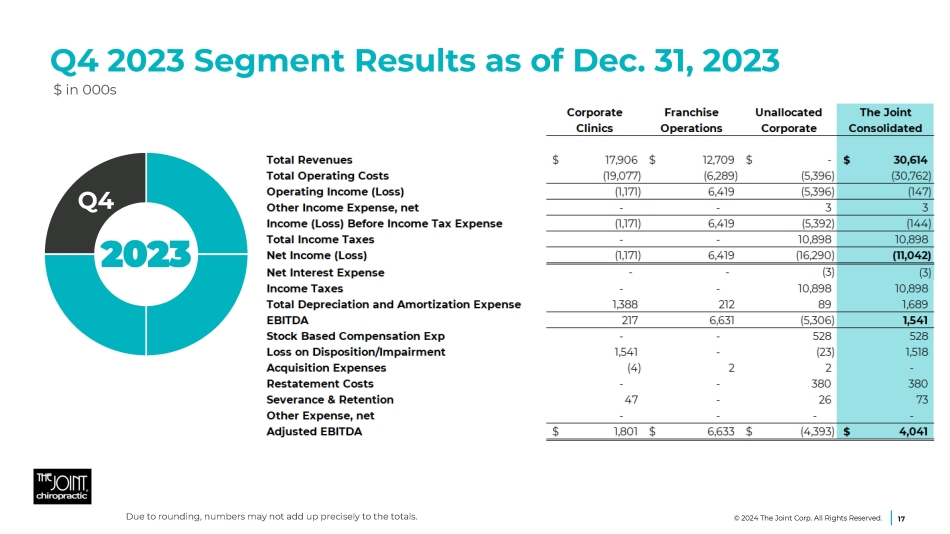
Q4 2023 Segment Results as of Dec. 31, 2023 $ in 000s 17 Q4 2023 © 2024 The Joint Corp. All Rights Reserved. Due to rounding, numbers may not add up precisely to the totals.

2023 Segment Results through Dec. 31, 2023 $ in 000s 18 2023 © 2024 The Joint Corp. All Rights Reserved. Due to rounding, numbers may not add up precisely to the totals.
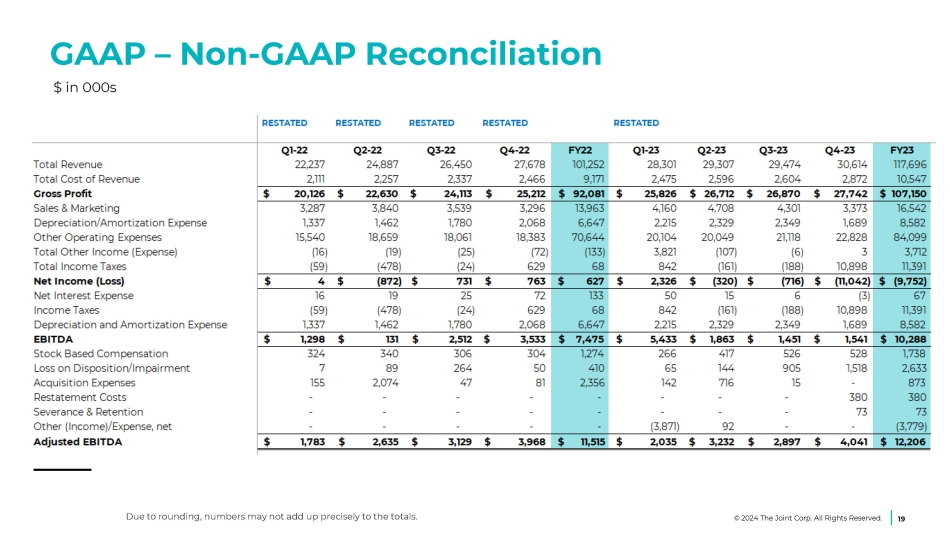
GAAP – Non - GAAP Reconciliation $ in 000s 19 © 2024 The Joint Corp. All Rights Reserved. Due to rounding, numbers may not add up precisely to the totals.

Jake Singleton, CFO jake.singleton@thejoint.com The Joint Corp. | 16767 N. Perimeter Dr., Suite 110, Scottsdale, AZ 85260 | (480) 245 - 5960 https://www.facebook.com/thejointchiro @thejointchiro https://twitter.com/thejointchiro @thejointchiro https://www.youtube.com/thejointcorp @thejointcorp Peter D. Holt, President & CEO peter.holt@thejoint.com The Joint Corp. | 16767 N. Perimeter Dr., Suite 110, Scottsdale, AZ 85260 | (480) 245 - 5960 Kirsten Chapman, LHA Investor Relations thejoint@lhai.com LHA Investor Relations | 50 California Street, Suite 1500 | San Francisco, CA 94111| (415) 433 - 3777 Contact Information 20 © 2024 The Joint Corp. All Rights Reserved.
v3.24.0.1
| X |
- DefinitionBoolean flag that is true when the XBRL content amends previously-filed or accepted submission.
| Name: |
dei_AmendmentFlag |
| Namespace Prefix: |
dei_ |
| Data Type: |
xbrli:booleanItemType |
| Balance Type: |
na |
| Period Type: |
duration |
|
| X |
- DefinitionFor the EDGAR submission types of Form 8-K: the date of the report, the date of the earliest event reported; for the EDGAR submission types of Form N-1A: the filing date; for all other submission types: the end of the reporting or transition period. The format of the date is YYYY-MM-DD.
| Name: |
dei_DocumentPeriodEndDate |
| Namespace Prefix: |
dei_ |
| Data Type: |
xbrli:dateItemType |
| Balance Type: |
na |
| Period Type: |
duration |
|
| X |
- DefinitionThe type of document being provided (such as 10-K, 10-Q, 485BPOS, etc). The document type is limited to the same value as the supporting SEC submission type, or the word 'Other'.
| Name: |
dei_DocumentType |
| Namespace Prefix: |
dei_ |
| Data Type: |
dei:submissionTypeItemType |
| Balance Type: |
na |
| Period Type: |
duration |
|
| X |
- DefinitionAddress Line 1 such as Attn, Building Name, Street Name
| Name: |
dei_EntityAddressAddressLine1 |
| Namespace Prefix: |
dei_ |
| Data Type: |
xbrli:normalizedStringItemType |
| Balance Type: |
na |
| Period Type: |
duration |
|
| X |
- Definition
+ References
+ Details
| Name: |
dei_EntityAddressCityOrTown |
| Namespace Prefix: |
dei_ |
| Data Type: |
xbrli:normalizedStringItemType |
| Balance Type: |
na |
| Period Type: |
duration |
|
| X |
- DefinitionCode for the postal or zip code
| Name: |
dei_EntityAddressPostalZipCode |
| Namespace Prefix: |
dei_ |
| Data Type: |
xbrli:normalizedStringItemType |
| Balance Type: |
na |
| Period Type: |
duration |
|
| X |
- DefinitionName of the state or province.
| Name: |
dei_EntityAddressStateOrProvince |
| Namespace Prefix: |
dei_ |
| Data Type: |
dei:stateOrProvinceItemType |
| Balance Type: |
na |
| Period Type: |
duration |
|
| X |
- DefinitionA unique 10-digit SEC-issued value to identify entities that have filed disclosures with the SEC. It is commonly abbreviated as CIK. Reference 1: http://www.xbrl.org/2003/role/presentationRef
-Publisher SEC
-Name Exchange Act
-Number 240
-Section 12
-Subsection b-2
| Name: |
dei_EntityCentralIndexKey |
| Namespace Prefix: |
dei_ |
| Data Type: |
dei:centralIndexKeyItemType |
| Balance Type: |
na |
| Period Type: |
duration |
|
| X |
- DefinitionIndicate if registrant meets the emerging growth company criteria. Reference 1: http://www.xbrl.org/2003/role/presentationRef
-Publisher SEC
-Name Exchange Act
-Number 240
-Section 12
-Subsection b-2
| Name: |
dei_EntityEmergingGrowthCompany |
| Namespace Prefix: |
dei_ |
| Data Type: |
xbrli:booleanItemType |
| Balance Type: |
na |
| Period Type: |
duration |
|
| X |
- DefinitionCommission file number. The field allows up to 17 characters. The prefix may contain 1-3 digits, the sequence number may contain 1-8 digits, the optional suffix may contain 1-4 characters, and the fields are separated with a hyphen.
| Name: |
dei_EntityFileNumber |
| Namespace Prefix: |
dei_ |
| Data Type: |
dei:fileNumberItemType |
| Balance Type: |
na |
| Period Type: |
duration |
|
| X |
- DefinitionTwo-character EDGAR code representing the state or country of incorporation.
| Name: |
dei_EntityIncorporationStateCountryCode |
| Namespace Prefix: |
dei_ |
| Data Type: |
dei:edgarStateCountryItemType |
| Balance Type: |
na |
| Period Type: |
duration |
|
| X |
- DefinitionThe exact name of the entity filing the report as specified in its charter, which is required by forms filed with the SEC. Reference 1: http://www.xbrl.org/2003/role/presentationRef
-Publisher SEC
-Name Exchange Act
-Number 240
-Section 12
-Subsection b-2
| Name: |
dei_EntityRegistrantName |
| Namespace Prefix: |
dei_ |
| Data Type: |
xbrli:normalizedStringItemType |
| Balance Type: |
na |
| Period Type: |
duration |
|
| X |
- DefinitionThe Tax Identification Number (TIN), also known as an Employer Identification Number (EIN), is a unique 9-digit value assigned by the IRS. Reference 1: http://www.xbrl.org/2003/role/presentationRef
-Publisher SEC
-Name Exchange Act
-Number 240
-Section 12
-Subsection b-2
| Name: |
dei_EntityTaxIdentificationNumber |
| Namespace Prefix: |
dei_ |
| Data Type: |
dei:employerIdItemType |
| Balance Type: |
na |
| Period Type: |
duration |
|
| X |
- DefinitionLocal phone number for entity.
| Name: |
dei_LocalPhoneNumber |
| Namespace Prefix: |
dei_ |
| Data Type: |
xbrli:normalizedStringItemType |
| Balance Type: |
na |
| Period Type: |
duration |
|
| X |
- DefinitionBoolean flag that is true when the Form 8-K filing is intended to satisfy the filing obligation of the registrant as pre-commencement communications pursuant to Rule 13e-4(c) under the Exchange Act. Reference 1: http://www.xbrl.org/2003/role/presentationRef
-Publisher SEC
-Name Exchange Act
-Number 240
-Section 13e
-Subsection 4c
| Name: |
dei_PreCommencementIssuerTenderOffer |
| Namespace Prefix: |
dei_ |
| Data Type: |
xbrli:booleanItemType |
| Balance Type: |
na |
| Period Type: |
duration |
|
| X |
- DefinitionBoolean flag that is true when the Form 8-K filing is intended to satisfy the filing obligation of the registrant as pre-commencement communications pursuant to Rule 14d-2(b) under the Exchange Act. Reference 1: http://www.xbrl.org/2003/role/presentationRef
-Publisher SEC
-Name Exchange Act
-Number 240
-Section 14d
-Subsection 2b
| Name: |
dei_PreCommencementTenderOffer |
| Namespace Prefix: |
dei_ |
| Data Type: |
xbrli:booleanItemType |
| Balance Type: |
na |
| Period Type: |
duration |
|
| X |
- DefinitionTitle of a 12(b) registered security. Reference 1: http://www.xbrl.org/2003/role/presentationRef
-Publisher SEC
-Name Exchange Act
-Number 240
-Section 12
-Subsection b
| Name: |
dei_Security12bTitle |
| Namespace Prefix: |
dei_ |
| Data Type: |
dei:securityTitleItemType |
| Balance Type: |
na |
| Period Type: |
duration |
|
| X |
- DefinitionName of the Exchange on which a security is registered. Reference 1: http://www.xbrl.org/2003/role/presentationRef
-Publisher SEC
-Name Exchange Act
-Number 240
-Section 12
-Subsection d1-1
| Name: |
dei_SecurityExchangeName |
| Namespace Prefix: |
dei_ |
| Data Type: |
dei:edgarExchangeCodeItemType |
| Balance Type: |
na |
| Period Type: |
duration |
|
| X |
- DefinitionBoolean flag that is true when the Form 8-K filing is intended to satisfy the filing obligation of the registrant as soliciting material pursuant to Rule 14a-12 under the Exchange Act. Reference 1: http://www.xbrl.org/2003/role/presentationRef
-Publisher SEC
-Name Exchange Act
-Section 14a
-Number 240
-Subsection 12
| Name: |
dei_SolicitingMaterial |
| Namespace Prefix: |
dei_ |
| Data Type: |
xbrli:booleanItemType |
| Balance Type: |
na |
| Period Type: |
duration |
|
| X |
- DefinitionTrading symbol of an instrument as listed on an exchange.
| Name: |
dei_TradingSymbol |
| Namespace Prefix: |
dei_ |
| Data Type: |
dei:tradingSymbolItemType |
| Balance Type: |
na |
| Period Type: |
duration |
|
| X |
- DefinitionBoolean flag that is true when the Form 8-K filing is intended to satisfy the filing obligation of the registrant as written communications pursuant to Rule 425 under the Securities Act. Reference 1: http://www.xbrl.org/2003/role/presentationRef
-Publisher SEC
-Name Securities Act
-Number 230
-Section 425
| Name: |
dei_WrittenCommunications |
| Namespace Prefix: |
dei_ |
| Data Type: |
xbrli:booleanItemType |
| Balance Type: |
na |
| Period Type: |
duration |
|
Joint (NASDAQ:JYNT)
Historical Stock Chart
From Mar 2024 to Apr 2024

Joint (NASDAQ:JYNT)
Historical Stock Chart
From Apr 2023 to Apr 2024
