Transcontinental Realty Investors, Inc. (NYSE: TCI), a
Dallas-based real estate investment company, today reported results
of operations for the second quarter ended June 30, 2018. For the
three months ended June 30, 2018, we reported net income applicable
to common shares of $7.0 million or ($0.81) per share compared to a
net loss applicable to common shares of $10.6 million or ($1.22)
per share for the same period ended 2017.
The Company maintained its overall focus on growing its
portfolio and is working on several strategic initiatives that we
previously announced earlier this year. Overall, management remains
very encouraged about the overall performance of the company;
especially tied to the quality of our assets in our portfolio, and
the new multifamily apartment projects under various stages of
development.
Revenues
Rental and other property revenues were $31.6 million for the
three months ended June 30, 2018. This represents an increase of
$0.3 million compared to the prior period revenues of $31.3
million. The increase is driven primarily by an increase in
revenues of $1.2 million from our apartment operating segment,
offset by a decrease of $0.9 million from our commercial
segment.
Expense
Property operating expenses were $15.5 million for the three
months ended June 30, 2018. This represents an increase of $0.3
million compared to the prior period operating expenses of $15.2
million. The increase is due to increases in operating expenses in
the apartment portfolio of $1.0 million, offset by a decrease in
the commercial portfolio of $0.5 million and a decrease in the land
portfolio of $0.1 million.
Depreciation and amortization expense was $6.5 million for the
three months ended June 30, 2018 for an increase of $0.1 million as
compared to the prior period expense of $6.4 million. The change is
attributable to the depreciation on acquired apartments.
General and Administrative expenses were $2.2 million for the
three months ended June 30, 2018. This represents an increase of
$0.9 million compared to the prior period expense of $1.3 million.
The increase is due to an increase in expense reimbursements
paid to our advisor of approximately $0.7 million and professional
fees for audit and tax services of approximately $0.2 million.
Other income (expense)
Mortgage and loan interest expense was $14.2 million for the
three months ended June 30, 2018. This represents a decrease of
$1.6 million compared to the prior period expense of $15.8 million.
The change by segment is a decrease in the other portfolio of $1.2
million, land portfolio of $0.5 million and a decrease in the
commercial portfolio of $0.2 million, offset by an increase in the
apartment portfolio of $0.3 million. Within the other portfolio,
the decrease is primarily due to $1.2 million of interest expense
savings related to maturing notes payable paid during the first
quarter of 2018.
Other income was $7.5 million for the three months ended June
30, 2018. This represents an increase of $7.6 million compared to
prior period other expense of $0.1 million. The increase is the
result of insurance proceeds of approximately $6.6 million received
subsequent to the "as is" sale of a property damaged by a
hurricane, and other miscellaneous income of approximately $1.0
million.
Foreign currency transaction was a gain of $5.9 million for the
three months ended June 30, 2018. This represents an increase of
$9.3 million compared to prior period foreign currency transaction
loss of $3.4 million. The increase is the result of a gain in
foreign currency exchange as a result of the favorable exchange
rate between the Israel Shekels and the U.S. Dollar related to our
Bond program.
For the three months ended June 30, 2018, we sold a golf course
for a total sales price of $2.3 million and recorded no gain or
loss on the sale. For the same period in 2017, the Company recorded
a loss of approximately $0.5 million from the sale of 8.3 acres of
land for a sales price of $0.5 million.
About Transcontinental Realty Investors, Inc.
Transcontinental Realty Investors, Inc., a Dallas-based real
estate investment company, holds a diverse portfolio of equity real
estate located across the U.S., including apartments, office
buildings, shopping centers, and developed and undeveloped land.
The Company invests in real estate through direct ownership, leases
and partnerships and invests in mortgage loans on real estate. For
more information, visit the Company’s website at
www.transconrealty-invest.com.
TRANSCONTINENTAL REALTY INVESTORS, INC.
CONSOLIDATED STATEMENTS OF OPERATIONS (unaudited)
Three Months Ended
Six Months Ended June 30,
June 30,
2018 2017 2018
2017 (dollars in thousands, except share and par value
amounts) Revenues: Rental and other property revenues
(including $208 and $199 for the three months and $415 and $389 for
the six months ended 2018 and 2017, respectively, from related
parties) $ 31,607 $ 31,302 $ 62,689 $ 62,837
Expenses: Property operating expenses (including $231 and
$232 for the three months and $458 and $460 for the six months
ended 2018 and 2017, respectively, from related parties) 15,492
15,210 29,947 31,099 Depreciation and amortization 6,522 6,378
12,968 12,681 General and administrative (including $1,187 and $558
for the three months and $2,280 and $1,072 for the six months ended
2018 and 2017, respectively, from related parties) 2,173 1,295
4,365 3,075 Net income fee to related party 53 76 106 136 Advisory
fee to related party 2,726 2,501
5,474 4,806 Total operating expenses
26,966 25,460 52,860
51,797 Net operating income 4,641 5,842 9,829 11,040
Other income (expenses):
Interest income (including $3,486 and
$3,070 for the three months and $6,722 and $6,502 for the six
months ended 2018 and 2017, respectively, from related parties)
3,544 3,709 7,420 7,130 Other income (expense) 7,482 (104 ) 9,308
1,338 Mortgage and loan interest (including $327 and $283 for the
three months and $645 and $836 for the six months ended 2018 and
2017, respectively, from related parties) (14,175 ) (15,783 )
(28,268 ) (30,973 ) Foreign currency transaction gain (loss) 5,889
(3,425 ) 7,645 (3,748 ) Earnings (losses) from unconsolidated joint
ventures and investees (9 ) (10 ) 2
(18 ) Total other income (expenses) 2,731
(15,613 ) (3,893 ) (26,271 ) Gain (Loss)
before gain on land sales, non-controlling interest, and taxes
7,372 (9,771 ) 5,936 (15,231 ) (Loss) gain on land sales -
(476 ) 1,335 (31 ) Net income
(loss) from continuing operations before taxes 7,372
(10,247 ) 7,271 (15,262 ) Net income
(loss) from continuing operations 7,372 (10,247 ) 7,271 (15,262 )
Net income (loss) 7,372 (10,247 ) 7,271 (15,262 ) Net (income)
attributable to non-controlling interest (126 ) (163
) (258 ) (282 ) Net income (loss) attributable to
Transcontinental Realty Investors, Inc. 7,246 (10,410 ) 7,013
(15,544 ) Preferred dividend requirement (224 ) (224
) (446 ) (446 ) Net income (loss )applicable to
common shares $ 7,022 $ (10,634 ) $ 6,567 $ (15,990 )
Earnings per share - basic
Net income (loss) from continuing operations $ 0.81 $
(1.22 ) $ 0.75 $ (1.83 )
Earnings per share -
diluted Net income (loss) from
continuing operations $ 0.81 $ (1.22 ) $ 0.75 $ (1.83
) Weighted average common shares used in computing earnings
per share 8,717,767 8,717,767 8,717,767 8,717,767 Weighted average
common shares used in computing diluted earnings per share
8,717,767 8,717,767 8,717,767 8,717,767
Amounts
attributable to Transcontinental Realty Investors, Inc. Net
income (loss) from continuing operations $ 7,246 $ (10,410 )
$ 7,013 $ (15,544 ) Net income (loss) applicable to
Transcontinental Realty, Investors, Inc. $ 7,246 $ (10,410 )
$ 7,013 $ (15,544 )
TRANSCONTINENTAL REALTY
INVESTORS, INC. CONSOLIDATED BALANCE SHEETS
June 30, December 31,
2018 2017 (unaudited) (audited)
(dollars in thousands, except share and par value amounts)
Assets Real estate, at cost $ 1,150,055 $ 1,112,721 Real
estate subject to sales contracts at cost 43,767 45,739 Less
accumulated depreciation (184,741 ) (178,590 ) Total
real estate 1,009,081 979,870 Notes and interest receivable
(including $50,020 in 2018 and $45,155 in 2017 from related
parties) 83,463 70,166 Cash and cash equivalents 28,105
42,705 Restricted cash 64,669 45,637 Investments in unconsolidated
joint ventures and investees 2,474 2,472 Receivable from related
party 126,181 111,665 Other assets 54,772
60,907 Total assets $ 1,368,745 $ 1,313,422
Liabilities and Shareholders’ Equity Liabilities:
Notes and interest payable $ 915,183 $ 892,149 Notes related to
real estate held for sale 376 376 Notes related to real estate
subject to sales contracts - 1,957 Bond and bond interest payable
143,897 113,047 Deferred revenue (including $40,907 in 2018 and
$40,574 in 2017 to related parties) 62,166 60,949
Accounts payable and other liabilities
(including $6,930 in 2018 and $7,236 in 2017 to related
parties)
32,037 36,683 Total liabilities
1,153,659 1,105,161 Shareholders’ equity: Preferred stock,
Series C: $0.01 par value, authorized 10,000,000 shares; issued and
outstanding zero shares in 2018 and 2017. Series D: $0.01 par
value, authorized, issued and outstanding 100,000 shares in 2018
and 2017 (liquidation preference $100 per share) 1 1 Common stock,
$0.01 par value, authorized 10,000,000 shares; issued 8,717,967
shares in 2018 and 2017; outstanding 8,717,767 shares in 2018 and
2017 87 87 Treasury stock at cost, 200 shares in 2018 and 2017 (2 )
(2 ) Paid-in capital 268,503 268,949 Retained deficit
(72,852 ) (79,865 ) Total Transcontinental Realty Investors,
Inc. shareholders' equity 195,737 189,170 Non-controlling interest
19,349 19,091 Total shareholders'
equity 215,086 208,261 Total
liabilities and shareholders' equity $ 1,368,745 $ 1,313,422
View source
version on businesswire.com: https://www.businesswire.com/news/home/20180814005732/en/
Transcontinental Realty Investors, Inc.Investor
RelationsGene Bertcher,
800-400-6407investor.relations@transconrealty-invest.com
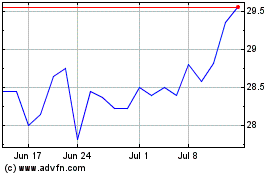
Transcontinental Realty ... (NYSE:TCI)
Historical Stock Chart
From Mar 2024 to Apr 2024

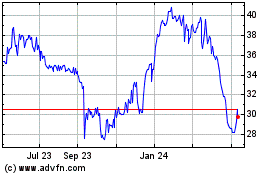
Transcontinental Realty ... (NYSE:TCI)
Historical Stock Chart
From Apr 2023 to Apr 2024
