false
0000811156
0000201533
false
8-K
2024-02-01
false
false
false
false
0000811156
2024-02-01
2024-02-01
0000811156
cms:ConsumersEnergyCompanyMember
2024-02-01
2024-02-01
0000811156
us-gaap:CommonStockMember
2024-02-01
2024-02-01
0000811156
cms:A5.625JuniorSubordinatedNotesDue2078Member
2024-02-01
2024-02-01
0000811156
cms:A5.875JuniorSubordinatedNotesDue2078Member
2024-02-01
2024-02-01
0000811156
cms:A5.875JuniorSubordinatedNotesDue2079Member
2024-02-01
2024-02-01
0000811156
cms:CMSEnergyCorporationDepositaryShareseachrepresentinga11000thinterestinashareof4200percentCumulativeRedeemablePerpetualPreferredStockSeriesCMember
2024-02-01
2024-02-01
iso4217:USD
xbrli:shares
iso4217:USD
xbrli:shares
UNITED STATES
SECURITIES AND
EXCHANGE COMMISSION
Washington, D.C. 20549
FORM 8-K
CURRENT REPORT
PURSUANT TO SECTION 13
OR 15(d) OF
THE SECURITIES
EXCHANGE ACT OF 1934
Date of Report (Date of earliest event reported)
February 1, 2024
| Commission |
|
Registrant; State of Incorporation; |
|
IRS Employer |
| File Number |
|
Address; and Telephone Number |
|
Identification No. |
| |
|
|
|
|
| 1-9513 |
|
CMS ENERGY CORPORATION
(A Michigan Corporation)
One Energy Plaza
Jackson, Michigan 49201
(517) 788-0550 |
|
38-2726431 |
| |
|
|
|
|
| 1-5611 |
|
CONSUMERS ENERGY COMPANY
(A
Michigan Corporation)
One Energy Plaza
Jackson, Michigan 49201
(517) 788-0550 |
|
38-0442310 |
Check the appropriate box below if the Form 8-K filing
is intended to simultaneously satisfy the filing obligation of the registrant under any of the following provisions:
¨ Written communications pursuant
to Rule 425 under the Securities Act (17 CFR 230.425)
¨ Soliciting material pursuant
to Rule 14a-12 under the Exchange Act (17 CFR 240.14a-12)
¨ Pre-commencement communications
pursuant to Rule 14d-2(b) under the Exchange Act (17 CFR 240.14d-2(b))
¨ Pre-commencement communications pursuant to Rule 13e-4(c) under the Exchange
Act (17 CFR 240.13e-4(c))
Securities registered pursuant to Section 12(b) of the Act:
| Title of each class |
|
Trading Symbol(s) |
|
Name of each exchange
on which registered |
| CMS Energy Corporation Common Stock, $0.01 par value |
|
CMS |
|
New York Stock Exchange |
| CMS Energy Corporation 5.625% Junior Subordinated Notes due 2078 |
|
CMSA |
|
New York Stock Exchange |
| CMS Energy Corporation 5.875% Junior Subordinated Notes due 2078 |
|
CMSC |
|
New York Stock Exchange |
| CMS Energy Corporation 5.875% Junior Subordinated Notes due 2079 |
|
CMSD |
|
New York Stock Exchange |
| CMS Energy Corporation, Depositary Shares,
each representing a 1/1,000th interest in a share of 4.200% Cumulative Redeemable Perpetual Preferred Stock, Series C |
|
CMS PRC |
|
New York Stock Exchange |
| Consumers
Energy Company Cumulative Preferred Stock, $1.00 par value: $4.50 Series |
|
CMS-PB |
|
New York Stock Exchange |
Indicate
by check mark whether the registrant is an emerging growth company as defined in Rule 405 of the Securities Act of 1933 (§230.405
of this chapter) or Rule 12b-2 of the Securities Exchange Act of 1934 (§240.12b-2 of this chapter). Emerging growth
company: CMS Energy Corporation ¨ Consumers
Energy Company ¨
If
an emerging growth company, indicate by check mark if the registrant has elected not to use the extended transition period for complying
with any new or revised financial accounting standards provided pursuant to Section 13(a) of the Exchange Act. CMS
Energy Corporation ¨ Consumers
Energy Company ¨
| Co-Registrant CIK |
0000201533 |
| Co-Registrant Amendment Flag |
false |
| Co-Registrant Form Type |
8-K |
| Co-Registrant DocumentPeriodEndDate |
2024-02-01 |
| Co-Registrant Written Communications |
false |
| Co-Registrant Solicitating Materials |
false |
| Co-Registrant PreCommencement Tender Offer |
false |
| Co-Registrant PreCommencement Issuer Tender Offer |
false |
| Emerging Growth Company |
false |
Item 2.02. Results of Operations and Financial Condition.
On February 1, 2024, CMS Energy Corporation (“CMS Energy”)
issued a News Release, in which it announced its 2023 results. Attached as Exhibit 99.1 to
this report and incorporated herein by reference is a copy of the CMS Energy News Release, furnished as a part of this report.
Exhibit 99.1 contains certain financial measures that are considered
“non-GAAP financial measures” as defined in Securities and Exchange Commission rules. Other than forward-looking earnings
guidance, Exhibit 99.1 contains a reconciliation of these non-GAAP financial measures to their most directly comparable financial measures
calculated and presented in accordance with accounting principles generally accepted in the United States. Adjustments could include items
such as discontinued operations, asset sales, impairments, restructuring costs, business optimization
initiative, changes in accounting principles, voluntary separation program, changes in federal tax policy, regulatory items from prior
years, unrealized gains or losses from mark-to-market adjustments, recognized in net income related to NorthStar Clean Energy’s
interest expense, or other items. Management views adjusted earnings as a key measure of the company’s present operating
financial performance and uses adjusted earnings for external communications with analysts and investors. Internally, the company uses
adjusted earnings to measure and assess performance. Because CMS Energy is not able to estimate the impact of specific line items, which
have the potential to significantly impact, favorably or unfavorably, reported earnings in future periods, Exhibit 99.1 does not contain
reported earnings guidance nor a reconciliation for the comparable future period earnings. The adjusted earnings should be considered
supplemental information to assist in understanding our business results, rather than as a substitute for the reported earnings. All
references to net income refer to net income available to common stockholders and references to earnings per share are on a diluted basis.
Item 7.01. Regulation FD Disclosure.
The information set forth in the CMS Energy News Release dated February
1, 2024, attached as Exhibit 99.1, is incorporated by reference in response to this Item 7.01.
CMS Energy will hold a webcast to discuss its 2023 results and provide
a business and financial outlook on February 1at 9:30 a.m. (ET). A copy of the CMS Energy presentation is furnished as Exhibit 99.2
to this report. A webcast of the presentation will be available on the CMS Energy website, www.cmsenergy.com.
In accordance with General Instruction B.2 of Form 8-K, the information
in this Current Report on Form 8-K, including Exhibits 99.1 and 99.2, shall not be deemed “filed” for the purposes of
Section 18 of the Securities Exchange Act of 1934, or otherwise subject to the liabilities of that section, nor shall it be deemed
incorporated by reference in any filing under the Securities Act of 1933.
Investors and others should note that CMS Energy routinely posts important
information on its website and considers the Investor Relations section, www.cmsenergy.com/investor-relations, a channel of distribution.
Item 9.01. Financial Statements and Exhibits.
(d) Exhibits.
SIGNATURES
Pursuant to the requirements of the Securities
Exchange Act of 1934, the Registrants have duly caused this report to be signed on their behalf by the undersigned hereunto duly authorized.
| |
|
CMS ENERGY CORPORATION |
| |
|
| Dated: February 1, 2024 |
By: |
/s/ Rejji P. Hayes |
| |
|
Rejji P. Hayes |
| |
|
Executive Vice President and Chief Financial Officer |
| |
|
CONSUMERS ENERGY COMPANY |
| |
|
| Dated: February 1, 2024 |
By: |
/s/ Rejji P. Hayes |
| |
|
Rejji P. Hayes |
| |
|
Executive Vice President and Chief Financial Officer |
Exhibit 99.1

CMS Energy Announces
Strong 2023 Results for the 21st Consecutive Year and Raises 2024 Adjusted EPS Guidance
JACKSON, Mich.,
Feb. 1, 2024 – CMS Energy announced today reported earnings per share of $3.01 for 2023, compared to $2.85 per share for 2022.
The company’s adjusted earnings per share for 2023 were $3.11, compared to $2.89 per share for 2022. CMS Energy also announced
the increase of its annual dividend by 11 cents per share to $2.06 for 2024.
CMS Energy raised
its 2024 adjusted earnings guidance to $3.29 to $3.35 per share from $3.27 to $3.33 per share (*See below for important information about
non-GAAP measures) and reaffirmed long-term adjusted EPS growth of 6 to 8 percent, with continued confidence toward the high end.
“In a challenging
year with unfavorable weather and significant storms, we responded and delivered for our customers, communities and investors,”
said Garrick Rochow, President and CEO of CMS Energy and Consumers Energy. “I’m proud of the team’s efforts in 2023
and our success positions CMS Energy well for the long-term.”
CMS Energy (NYSE:
CMS) is a Michigan-based energy provider featuring Consumers Energy as its primary business. It also owns and operates independent power
generation businesses.
# # #
CMS
Energy will hold a webcast to discuss its 2023 year-end results and provide a business and financial outlook on Thursday, February 1
at 9:30 a.m. (EST). To participate in the webcast, go to CMS Energy’s homepage (cmsenergy.com)
and select “Events and Presentations.”
Important information for investors
about non-GAAP measures and other disclosures.
This news release contains non-Generally
Accepted Accounting Principles (non-GAAP) measures, such as adjusted earnings. All references to net income refer to net income available
to common stockholders and references to earnings per share are on a diluted basis. Adjustments could include items such as discontinued
operations, asset sales, impairments, restructuring costs, business optimization initiative, changes in accounting principles, voluntary
separation program, changes in federal tax policy, regulatory items from prior years, unrealized gains or losses from mark-to-market
adjustments recognized in net income related to NorthStar Clean Energy's interest expense, or other items. Management views
adjusted earnings as a key measure of the company's present operating financial performance and uses adjusted earnings for external communications
with analysts and investors. Internally, the company uses adjusted earnings to measure and assess performance. Because the company is
not able to estimate the impact of specific line items, which have the potential to significantly impact, favorably or unfavorably, the
company's reported earnings in future periods, the company is not providing reported earnings guidance nor is it providing a reconciliation
for the comparable future period earnings. The company's adjusted earnings should be considered supplemental information to assist in
understanding our business results, rather than as a substitute for the reported earnings.
This news release contains "forward-looking
statements." The forward-looking statements are subject to risks and uncertainties that could cause CMS Energy’s and Consumers
Energy’s results to differ materially. All forward-looking statements should be considered in the context of the risk and other
factors detailed from time to time in CMS Energy's and Consumers Energy's Securities and Exchange Commission filings.
Investors
and others should note that CMS Energy routinely posts important information on its website and considers the Investor Relations section,
www.cmsenergy.com/investor-relations,
a channel of distribution.
For
more information on CMS Energy, please visit our website at cmsenergy.com.
To sign up for email alert notifications,
please visit the Investor Relations section of our website.
Media Contacts: Katie Carey, 517/740-1739
Investment Analyst Contact: Travis
Uphaus, 517/817-9241
Page 1 of 3
CMS
ENERGY CORPORATION
Consolidated
Statements of Income
(Unaudited)
| | |
In Millions, Except Per Share Amounts | |
| | |
Three Months Ended | | |
Twelve Months Ended | |
| | |
12/31/23 | | |
12/31/22 | | |
12/31/23 | | |
12/31/22 | |
| Operating revenue | |
$ | 1,950 | | |
$ | 2,278 | | |
$ | 7,462 | | |
$ | 8,596 | |
| | |
| | | |
| | | |
| | | |
| | |
| Operating expenses | |
| 1,544 | | |
| 2,007 | | |
| 6,227 | | |
| 7,372 | |
| | |
| | | |
| | | |
| | | |
| | |
| Operating Income | |
| 406 | | |
| 271 | | |
| 1,235 | | |
| 1,224 | |
| | |
| | | |
| | | |
| | | |
| | |
| Other income | |
| 83 | | |
| 52 | | |
| 362 | | |
| 197 | |
| | |
| | | |
| | | |
| | | |
| | |
| Interest charges | |
| 172 | | |
| 139 | | |
| 643 | | |
| 519 | |
| | |
| | | |
| | | |
| | | |
| | |
| Income Before Income Taxes | |
| 317 | | |
| 184 | | |
| 954 | | |
| 902 | |
| | |
| | | |
| | | |
| | | |
| | |
| Income tax expense | |
| 66 | | |
| 21 | | |
| 147 | | |
| 93 | |
| | |
| | | |
| | | |
| | | |
| | |
| Income From Continuing Operations | |
| 251 | | |
| 163 | | |
| 807 | | |
| 809 | |
| | |
| | | |
| | | |
| | | |
| | |
| Income from discontinued operations, net of tax | |
| - | | |
| - | | |
| 1 | | |
| 4 | |
| | |
| | | |
| | | |
| | | |
| | |
| Net Income | |
| 251 | | |
| 163 | | |
| 808 | | |
| 813 | |
| | |
| | | |
| | | |
| | | |
| | |
| Loss attributable to noncontrolling interests | |
| (58 | ) | |
| (8 | ) | |
| (79 | ) | |
| (24 | ) |
| | |
| | | |
| | | |
| | | |
| | |
| Net Income Attributable to CMS Energy | |
| 309 | | |
| 171 | | |
| 887 | | |
| 837 | |
| | |
| | | |
| | | |
| | | |
| | |
| Preferred stock dividends | |
| 3 | | |
| 3 | | |
| 10 | | |
| 10 | |
| | |
| | | |
| | | |
| | | |
| | |
| Net Income Available to Common Stockholders | |
$ | 306 | | |
$ | 168 | | |
$ | 877 | | |
$ | 827 | |
| | |
| | | |
| | | |
| | | |
| | |
| Diluted Earnings Per Average Common Share | |
| | | |
| | | |
| | | |
| | |
| Income from continuing operations per average common share available to common stockholders | |
$ | 1.05 | | |
$ | 0.58 | | |
$ | 3.01 | | |
$ | 2.84 | |
| Income from discontinued operations per average common share available to common stockholders | |
| - | | |
| - | | |
| - | | |
| 0.01 | |
| Diluted earnings per average common share | |
$ | 1.05 | | |
$ | 0.58 | | |
$ | 3.01 | | |
$ | 2.85 | |
Page 2 of 3
CMS
ENERGY CORPORATION
Summarized
Consolidated Balance Sheets
(Unaudited)
| | |
In Millions | |
| | |
As of | |
| | |
12/31/23 | | |
12/31/22 | |
| Assets | |
| | | |
| | |
| Current assets | |
| | | |
| | |
| Cash and cash equivalents | |
$ | 227 | | |
$ | 164 | |
| Restricted cash and cash equivalents | |
| 21 | | |
| 18 | |
| Other current assets | |
| 2,591 | | |
| 3,251 | |
| Total current assets | |
| 2,839 | | |
| 3,433 | |
| Non-current assets | |
| | | |
| | |
| Plant, property, and equipment | |
| 25,072 | | |
| 22,713 | |
| Other non-current assets | |
| 5,606 | | |
| 5,207 | |
| Total Assets | |
$ | 33,517 | | |
$ | 31,353 | |
| | |
| | | |
| | |
| Liabilities and Equity | |
| | | |
| | |
| Current liabilities (1) | |
$ | 1,822 | | |
$ | 1,866 | |
| Non-current liabilities (1) | |
| 7,927 | | |
| 7,583 | |
| Capitalization | |
| | | |
| | |
| Debt and finance leases (excluding securitization debt) (2) | |
| 14,856 | | |
| 14,139 | |
| Preferred stock and securities | |
| 224 | | |
| 224 | |
| Noncontrolling interests | |
| 581 | | |
| 580 | |
| Common stockholders' equity | |
| 7,320 | | |
| 6,791 | |
| Total capitalization (excluding securitization debt) | |
| 22,981 | | |
| 21,734 | |
| Securitization debt (2) | |
| 787 | | |
| 170 | |
| Total Liabilities and Equity | |
$ | 33,517 | | |
$ | 31,353 | |
| (1) |
Excludes
debt and finance leases. |
| |
|
| (2) |
Includes
current and non-current portions. |
CMS ENERGY CORPORATION
Summarized Consolidated Statements of Cash Flows
(Unaudited)
| | |
In Millions | |
| | |
Twelve Months Ended | |
| | |
12/31/23 | | |
12/31/22 | |
| Beginning of Period Cash and Cash Equivalents, Including Restricted Amounts | |
$ | 182 | | |
$ | 476 | |
| | |
| | | |
| | |
| Net cash provided by operating activities | |
| 2,309 | | |
| 855 | |
| Net cash used in investing activities | |
| (3,386 | ) | |
| (2,476 | ) |
| Cash flows from operating and investing activities | |
| (1,077 | ) | |
| (1,621 | ) |
| Net cash provided by financing activities | |
| 1,143 | | |
| 1,327 | |
| | |
| | | |
| | |
| Total Cash Flows | |
$ | 66 | | |
$ | (294 | ) |
| | |
| | | |
| | |
| End of Period Cash and Cash Equivalents, Including Restricted Amounts | |
$ | 248 | | |
$ | 182 | |
Page 3 of 3
CMS ENERGY CORPORATION
Reconciliation
of GAAP Net Income to Non-GAAP Adjusted Net Income
(Unaudited)
| | |
In Millions, Except Per Share Amounts | |
| | |
Three Months Ended | | |
Twelve Months Ended | |
| | |
12/31/23 | | |
12/31/22 | | |
12/31/23 | | |
12/31/22 | |
| Net Income Available to Common Stockholders | |
$ | 306 | | |
$ | 168 | | |
$ | 877 | | |
$ | 827 | |
| Reconciling items: | |
| | | |
| | | |
| | | |
| | |
| Disposal of discontinued operations gain | |
| * | | |
| - | | |
| (1 | ) | |
| (5 | ) |
| Tax impact | |
| (* | ) | |
| - | | |
| * | | |
| 1 | |
| Other exclusions from adjusted earnings** | |
| 3 | | |
| 9 | | |
| 9 | | |
| 8 | |
| Tax impact | |
| (1 | ) | |
| (2 | ) | |
| (3 | ) | |
| (2 | ) |
| Voluntary separation program | |
| * | | |
| 1 | | |
| 33 | | |
| 12 | |
| Tax impact | |
| (* | ) | |
| (* | ) | |
| (8 | ) | |
| (3 | ) |
| | |
| | | |
| | | |
| | | |
| | |
| Adjusted net income – non-GAAP | |
$ | 308 | | |
$ | 176 | | |
$ | 907 | | |
$ | 838 | |
| | |
| | | |
| | | |
| | | |
| | |
| Average Common Shares Outstanding - Diluted | |
| 292.7 | | |
| 290.1 | | |
| 291.7 | | |
| 290.0 | |
| | |
| | | |
| | | |
| | | |
| | |
| Diluted Earnings Per Average Common Share | |
| | | |
| | | |
| | | |
| | |
| Reported net income per share | |
$ | 1.05 | | |
$ | 0.58 | | |
$ | 3.01 | | |
$ | 2.85 | |
| Reconciling items: | |
| | | |
| | | |
| | | |
| | |
| Disposal of discontinued operations gain | |
| * | | |
| - | | |
| (* | ) | |
| (0.01 | ) |
| Tax impact | |
| (* | ) | |
| - | | |
| * | | |
| * | |
| Other exclusions from adjusted earnings** | |
| 0.01 | | |
| 0.03 | | |
| 0.03 | | |
| 0.03 | |
| Tax impact | |
| (0.01 | ) | |
| (0.01 | ) | |
| (0.01 | ) | |
| (0.01 | ) |
| Voluntary separation program | |
| * | | |
| * | | |
| 0.11 | | |
| 0.04 | |
| Tax impact | |
| (* | ) | |
| (* | ) | |
| (0.03 | ) | |
| (0.01 | ) |
| | |
| | | |
| | | |
| | | |
| | |
| Adjusted net income per share – non-GAAP | |
$ | 1.05 | | |
$ | 0.60 | | |
$ | 3.11 | | |
$ | 2.89 | |
| * |
Less
than $0.5 million or $0.01 per share. |
| ** |
Includes
restructuring costs, business optimization initiative, and unrealized gains or losses from mark-to-market adjustments, recognized
in net income related to NorthStar Clean Energy's interest expense. |
Management
views adjusted (non-Generally Accepted Accounting Principles) earnings as a key measure of the Company's present operating financial
performance and uses adjusted earnings for external communications with analysts and investors. Internally, the Company uses
adjusted earnings to measure and assess performance. Adjustments could include items such as discontinued operations, asset
sales, impairments, restructuring costs, business optimization initiative, changes in accounting principles, voluntary separation program,
changes in federal tax policy, regulatory items from prior years, unrealized gains or losses from mark-to-market adjustments, recognized
in net income related to NorthStar Clean Energy’s interest expense, or other items. The adjusted earnings should be
considered supplemental information to assist in understanding our business results, rather than as a substitute for reported earnings.
Exhibit 99.2

2023 Year - End Earnings Call February 1, 2024
2 Enter “so what” if necessary – Century Gothic, Bold, Size 18 or smaller This presentation is made as of the date hereof and contains “forward - looking statements” as defined in Rule 3b - 6 of the Securit ies Exchange Act of 1934, Rule 175 of the Securities Act of 1933, and relevant legal decisions. The forward - looking statements are subject to risks and uncertainties. All forward - lo oking statements should be considered in the context of the risk and other factors detailed from time to time in CMS Energy’s and Consumers Energy’s Securities and Exchange Commissi on filings. Forward - looking statements should be read in conjunction with “FORWARD - LOOKING STATEMENTS AND INFORMATION” and “RISK FACTORS” sections of CMS Energy’s and Consumers Energy’s most recent Form 10 - K and as updated in reports CMS Energy and Consumers Energy file with the Securities and Exchange Commission. CMS Energy’s and Cons ume rs Energy’s “FORWARD - LOOKING STATEMENTS AND INFORMATION” and “RISK FACTORS” sections are incorporated herein by reference and discuss important factors th at could cause CMS Energy’s and Consumers Energy’s results to differ materially from those anticipated in such statements. CMS Energy and Consumers Energy undertake no ob ligation to update any of the information presented herein to reflect facts, events or circumstances after the date hereof. The presentation also includes non - GAAP measures when describing CMS Energy’s results of operations and financial performance. A reconciliation of each of these measures to the most directly comparable GAAP measure is included in the appendix and posted on our website at www.cmsenergy.com . Investors and others should note that CMS Energy routinely posts important information on its website and considers the Inves tor Relations section, www.cmsenergy.com/investor - relations , a channel of distribution. Presentation endnotes are included after the appendix. 2
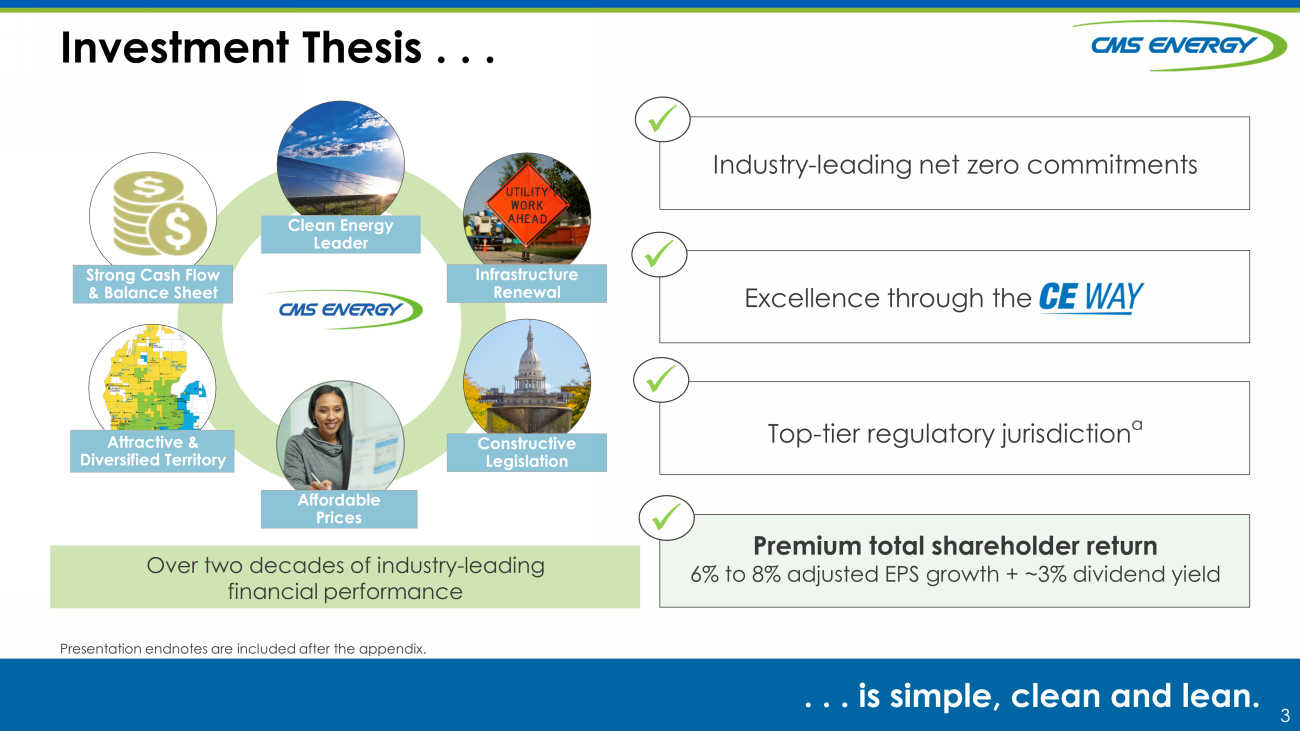
3 Investment Thesis . . . . . . is simple, clean and lean. Infrastructure Renewal Constructive Legislation Strong Cash Flow & Balance Sheet Clean Energy Leader Attractive & Diversified Territory Over tw o decades of industry - leading financial performance Affordable Prices Industry - leading net zero commitments Excellence through the Top - tier regulatory jurisdiction a Premium total shareholder r eturn 6% to 8% adjusted EPS growth + ~3% dividend yield Presentation endnotes are included after the appendix. x x x x
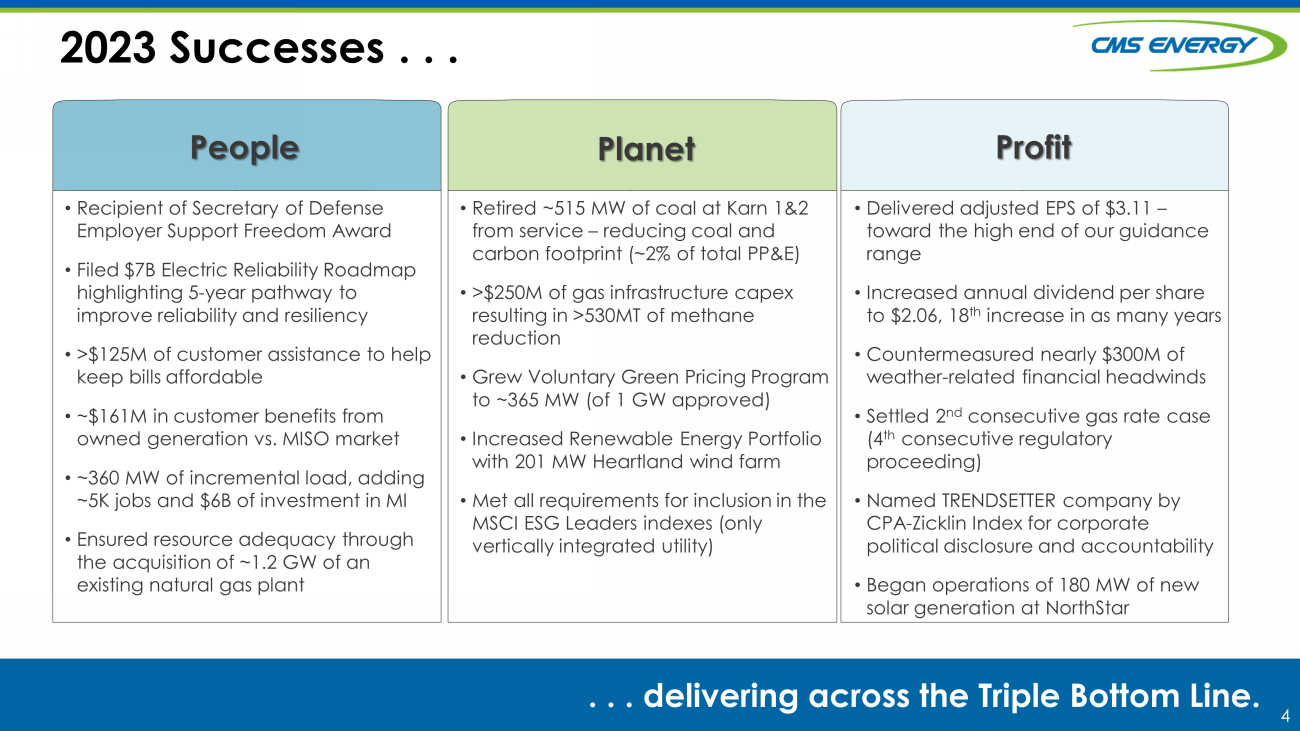
4 2023 Successes . . . . . . delivering across the Triple Bottom Line. • Delivered adjusted EPS of $3.11 – toward the high end of our guidance range • Increased annual dividend per share to $ 2.06 , 18 th increase in as many years • C ountermeasured nearly $300M of weather - related financial headwinds • Settled 2 nd consecutive gas rate case (4 th consecutive regulatory proceeding) • Named TRENDSETTER company by CPA - Zicklin Index for corporate political disclosure and accountability • Began operations of 180 MW of new solar generation at NorthStar Profit • Recipient of Secretary of Defense Employer Support Freedom Award • Filed $7B Electric Reliability Roadmap highlighting 5 - year pathway to improve reliability and resiliency • >$125M of customer assistance to help keep bills affordable • ~$161M in customer benefits from owned generation vs. MISO market • ~360 MW of incremental load, adding ~5K jobs and $6B of investment in MI • Ensured resource adequacy through the acquisition of ~1.2 GW of an existing natural gas plant • Retired ~515 MW of coal at Karn 1&2 from service – reducing coal and carbon footprint (~2% of total PP&E) • >$250M of gas infrastructure capex resulting in >530MT of methane reduction • Grew Voluntary Green Pricing Program to ~365 MW (of 1 GW approved) • Increased Renewable Energy Portfolio with 201 MW Heartland wind farm • Met all requirements for inclusion in the MSCI ESG Leaders indexes (only vertically integrated utility) People Planet
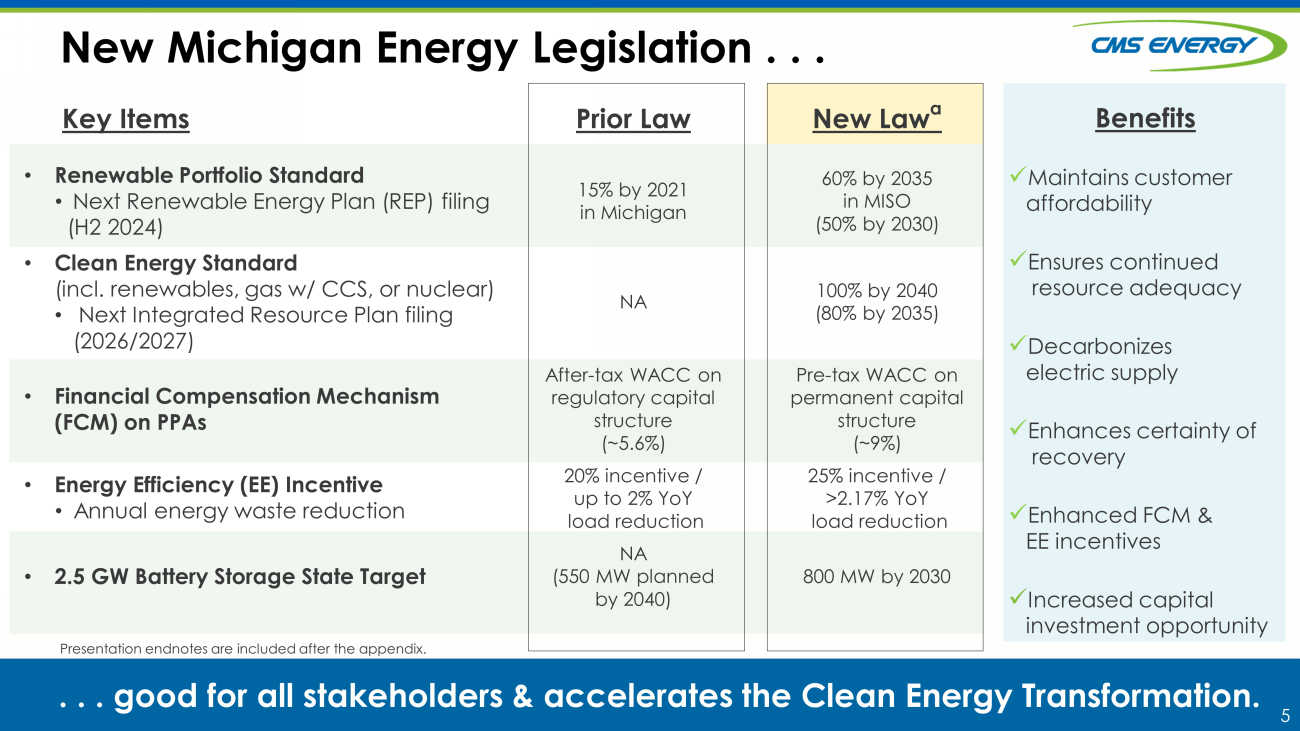
5 New Michigan Energy Legislation . . . . . . good for all stakeholders & a ccelerates the Clean Energy Transformation. Key Items Prior Law New Law a • Renewable Portfolio Standard • Next Renewable Energy Plan (REP) filing (H2 2024) 15% by 2021 in Michigan 60% by 2035 in MISO (50% by 2030) • Clean Energy Standard (incl. renewables, gas w/ CCS, or nuclear) • Next Integrated Resource Plan filing (2026/ 2027) NA 100% by 2040 (80% by 2035) • Financial Compensation Mechanism (FCM) on PPAs After - tax WACC on regulatory capital structure (~5.6%) Pre - tax WACC on permanent capital structure (~9%) • Energy Efficiency (EE) Incentive • Annual energy waste reduction 20% incentive / up to 2% YoY load reduction 25% incentive / >2.17% YoY load reduction • 2.5 GW Battery Storage State Target NA (550 MW planned by 2040) 800 MW by 2030 x Maintains customer affordability x Ensures continued resource adequacy x Decarbonizes electric supply x Enhances certainty of recovery x Enhanced FCM & EE incentives x Increased capital investment opportunity Benefits Presentation endnotes are included after the appendix.
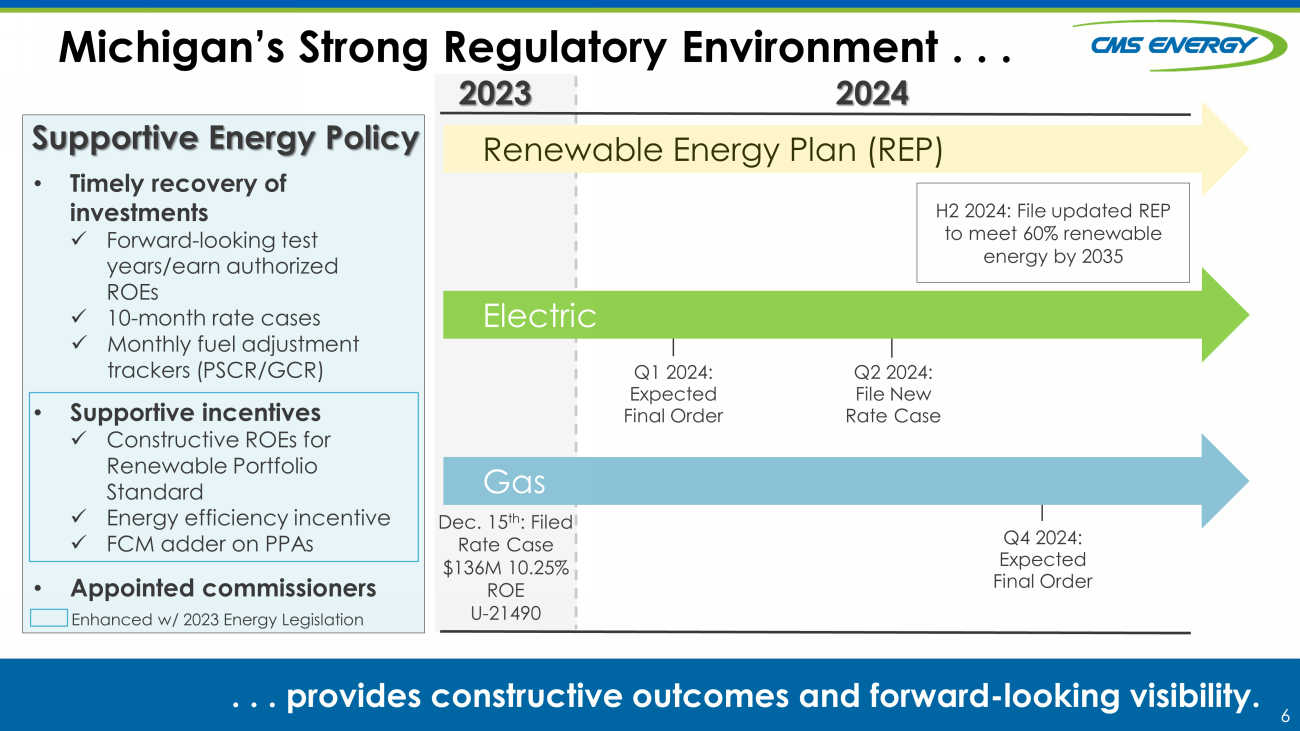
6 2024 Michigan’s Strong Regulatory Environment . . . . . . p rovides constructive outcomes and forward - looking visibility. 2023 Renewable Energy Plan (REP) Electric Dec. 15 th : Filed Rate Case $ 136M 10.25 % ROE U - 21490 H2 2024: File updated REP to meet 60% renewable energy by 2035 Supportive Energy Policy • Timely recovery of investments x Forward - looking test years/earn authorized ROEs x 10 - month rate cases x Monthly fuel adjustment trackers (PSCR/GCR) • Supportive incentives x Constructive ROEs for Renewable Portfolio Standard x Energy efficiency incentive x FCM adder on PPAs • Appointed commissioners Gas Q4 2024: Expected Final Order Enhanced w/ 2023 Energy Legislation Q1 2024: Expected Final Order Q2 2024: File New Rate Case
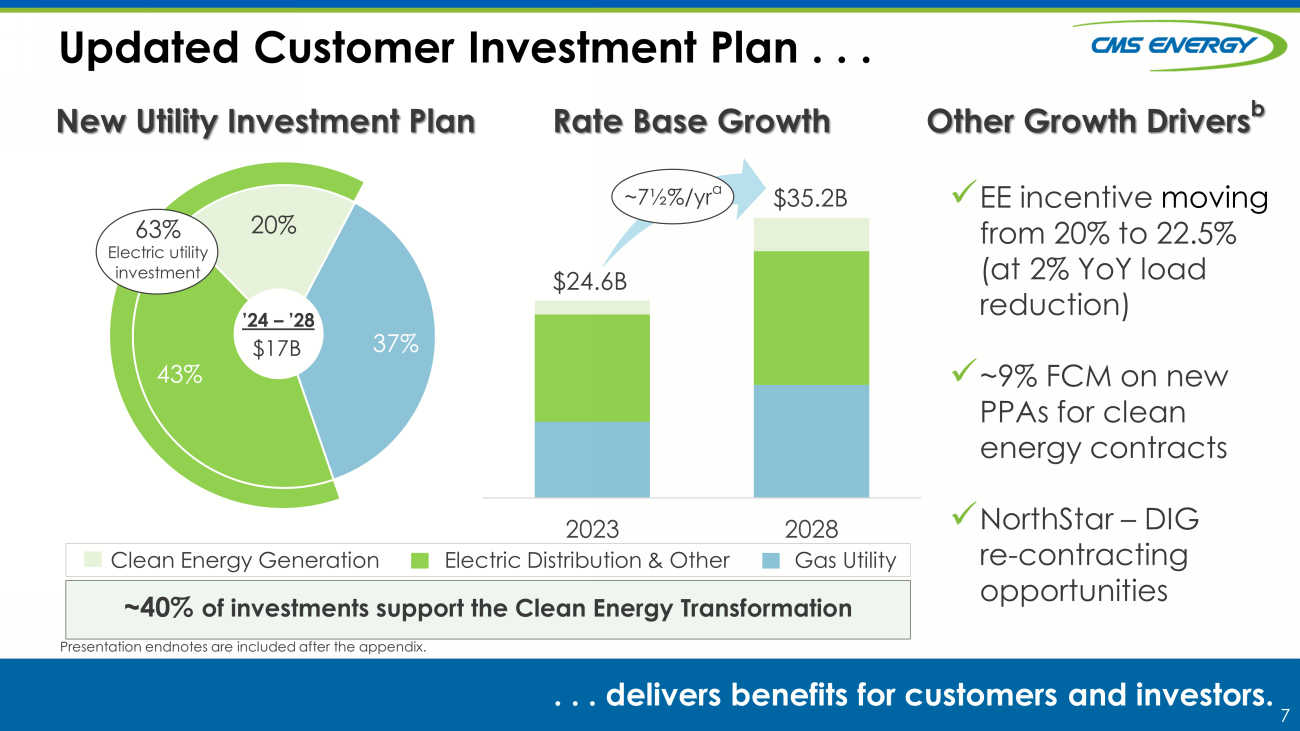
7 43% 20% 37% Updated Customer Investment Plan . . . . . . delivers benefits for customers and investors. New Utility Investment Plan Rate Base Growth Presentation endnotes are included after the appendix. Clean Energy Generation Electric Distribution & Other Gas Utility $17B ’24 – ’28 63 % Electric utility investment x EE incentive moving from 20% to 22.5% (at 2% YoY load reduction) x ~9% FCM on new PPAs for clean energy contracts x NorthStar – DIG re - contracting opportunities Other Growth Drivers b 2023 2028 $ 24.6 B $35.2B ~ 7½%/ yr a ~ 40 % of investments support the Clean Energy Transformation
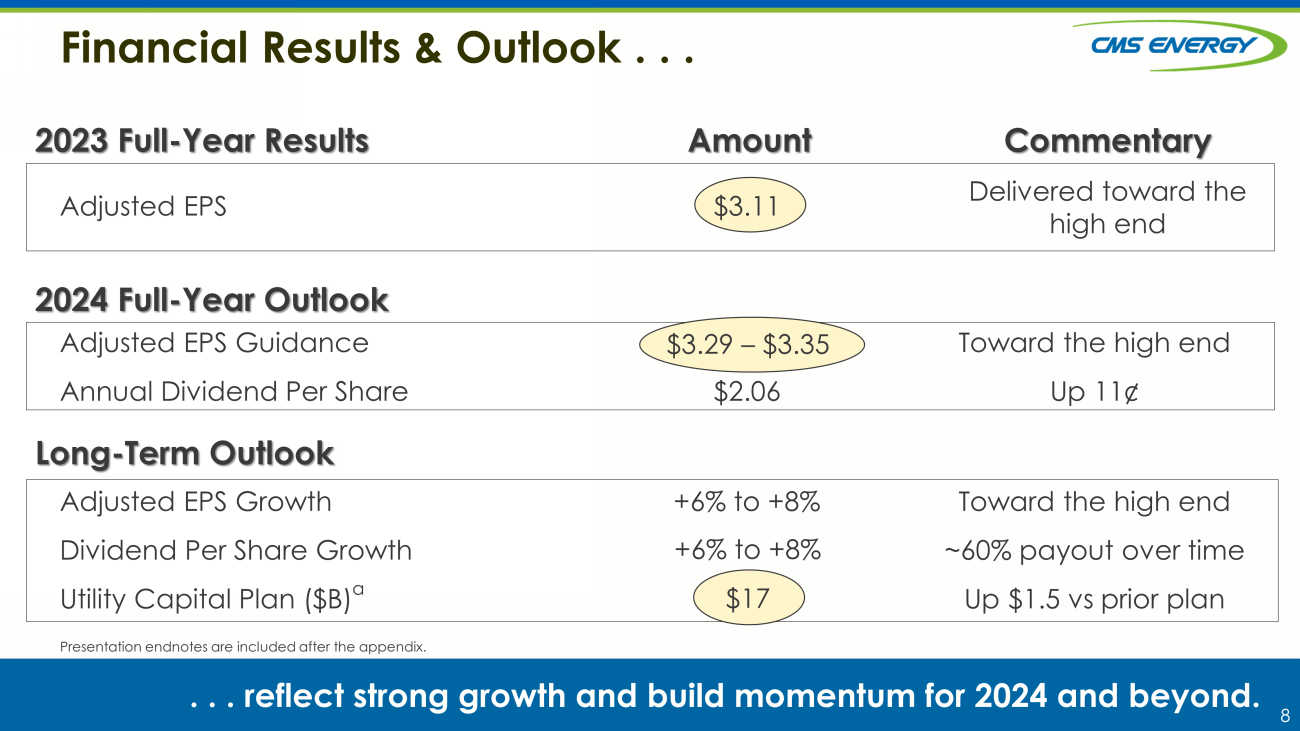
8 Commentary Amount Financial Results & Outlook . . . . . . reflect strong growth and build momentum for 2024 and beyond. Long - Term Outlook 2024 Full - Year Outlook 2023 Full - Year Results Adjusted EPS $3.11 Adjusted EPS Guidance Annual Dividend Per Share $3.06 – $3.12 $2.06 Toward the high end Up 11¢ Adjusted EPS Growth Dividend Per Share Growth Utility Capital Plan ($B) a +6% to +8% Toward the high end ~60% payout over time Up $1.5 vs prior plan $17 $3.29 – $3.35 Delivered toward the high end +6% to +8% Presentation endnotes are included after the appendix.
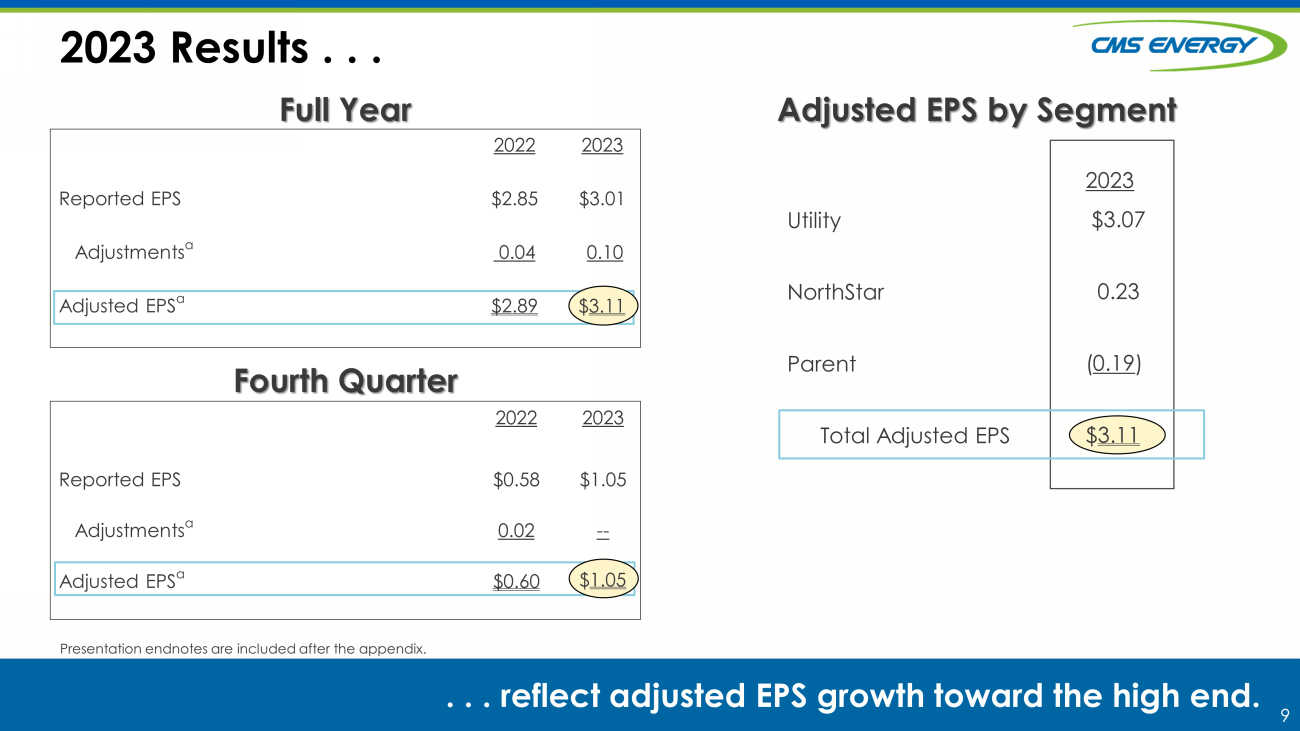
9 2022 2023 Reported EPS $0.58 $1.05 Adjustments a 0.02 -- Adjusted EPS a $0.60 Adjusted EPS by Segment Full Year 2023 Results . . . Fourth Quarter . . . reflect adjusted EPS growth toward the high end . 2022 2023 Reported EPS $2.85 $3.01 Adjustments a 0.04 0.10 Adjusted EPS a $2.89 35X Utility NorthStar Parent Total Adjusted EPS $ 1.05 Presentation endnotes are included after the appendix. 2023 $3.07 0. 23 ( 0. 19 ) $ 3 . 11 $ 3 .11
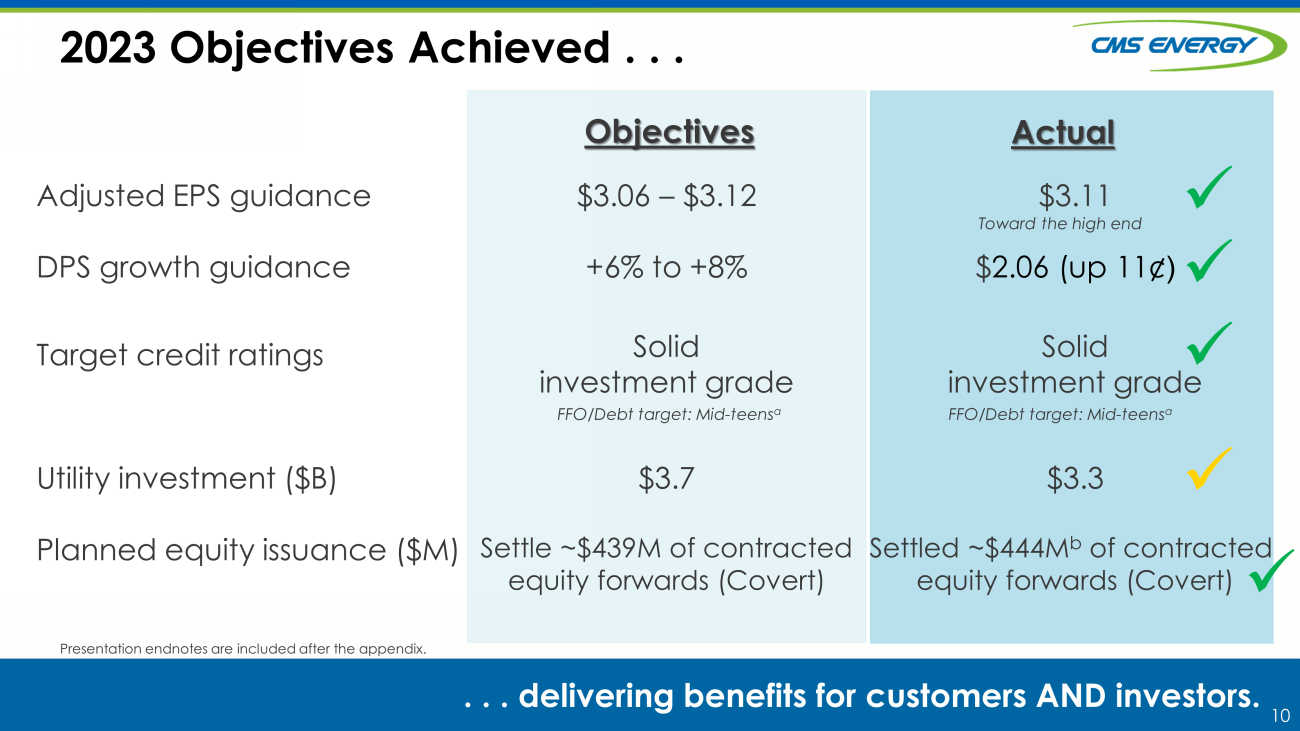
10 Actual 2023 Objectives Achieved . . . . . . d elivering benefits for customers AND investors. Presentation endnotes are included after the appendix. Adjusted EPS guidance DPS growth guidance Target credit ratings Utility investment ($B) Planned equity issuance ($M) $ 3.06 – $ 3.12 +6% to +8% Solid investment grade $ 3.7 Settle ~$439M of contracted equity forwards (Covert) Objectives $3. 11 $ 2.06 (up 11¢ ) Solid investment grade $3.3 Settled ~$444M b of contracted equity forwards (Covert) FFO/Debt target: Mid - teens a FFO/Debt target: Mid - teens a Toward the high end x x x x x
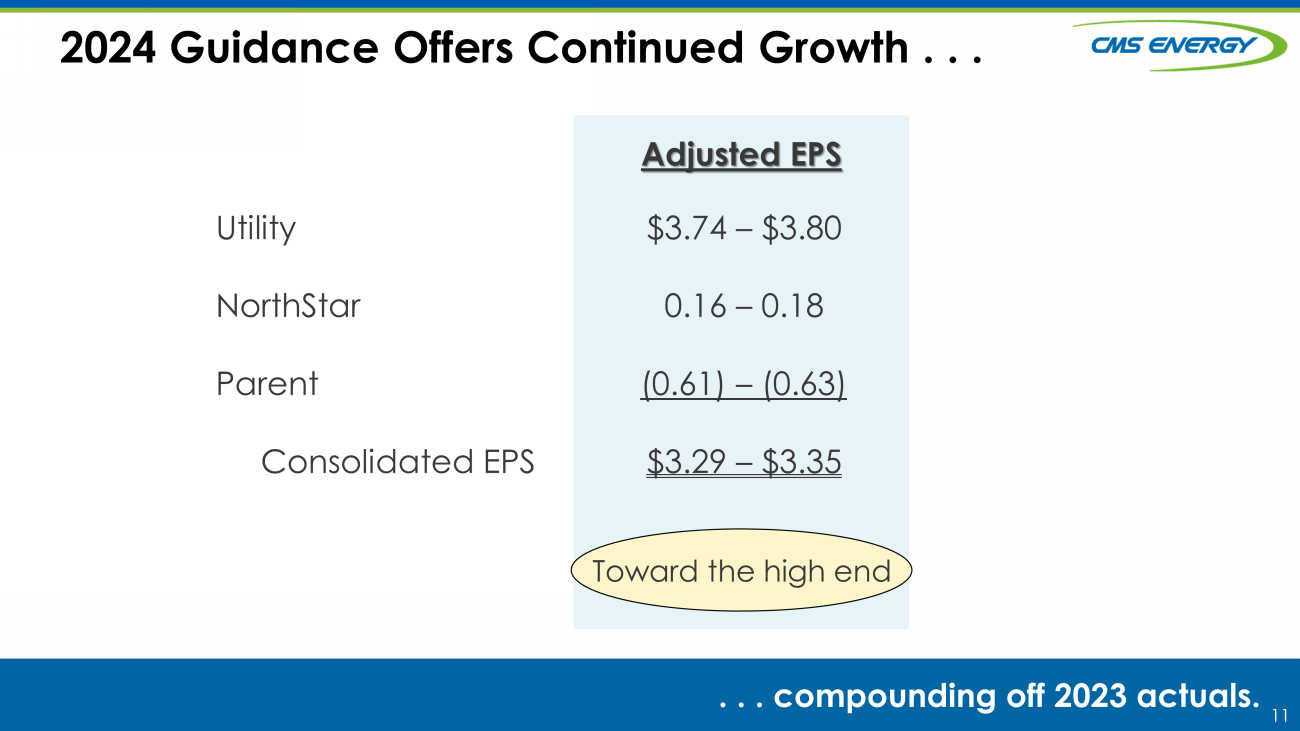
11 2024 Guidance Offers Continued Growth . . . . . . c ompounding off 2023 actuals. Utility NorthStar Parent Consolidated EPS $3. 74 – $3. 80 0. 16 – 0. 18 (0.61) – (0. 63 ) $3 . 29 – $ 3 . 35 Adjusted EPS Toward the high end
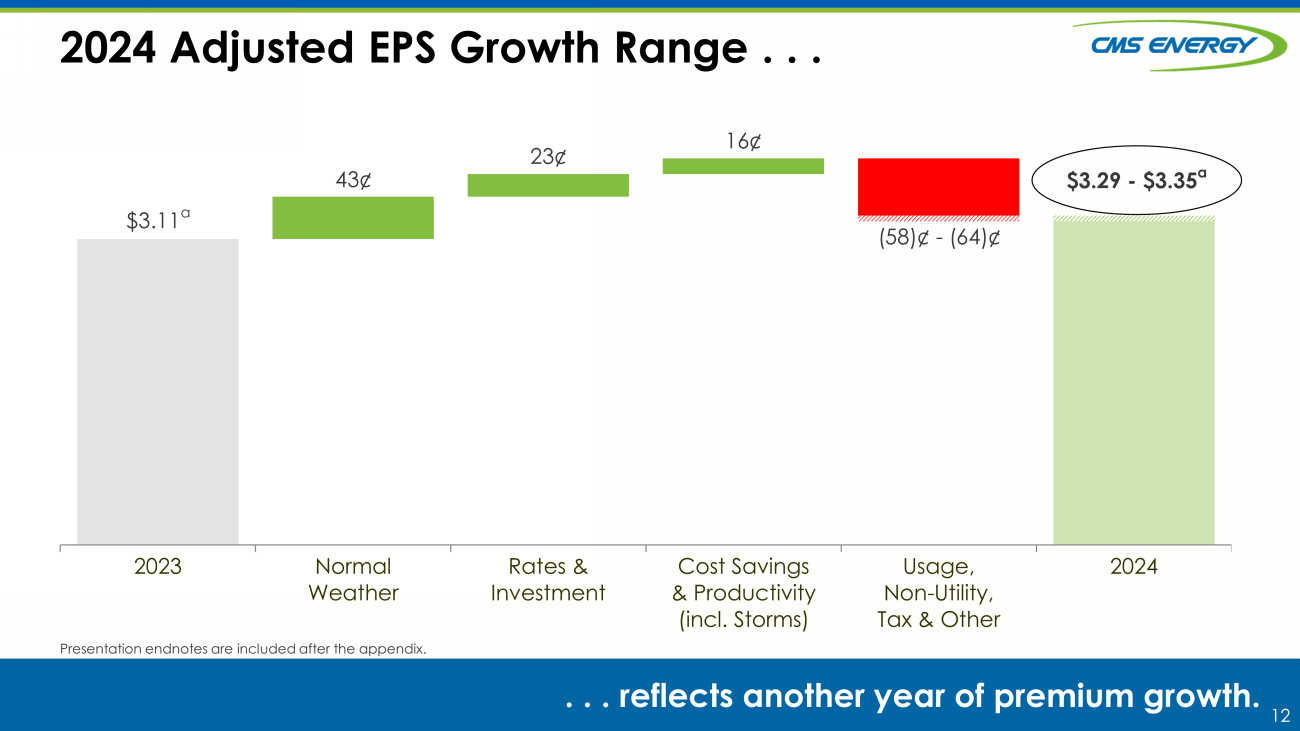
12 2024 Adjusted EPS Growth Range . . . . . . managing through COVID - 19 risks. 2023 Normal Weather Rates & Investment Cost Savings & Productivity (incl. Storms) Usage, Non-Utility, Tax & Other 2024 (58)¢ - (64 ) ¢ 23 ¢ 16¢ 43¢ $3. 11 a . . . reflects another year of premium growth. Presentation endnotes are included after the appendix. $3.29 - $3. 35 a
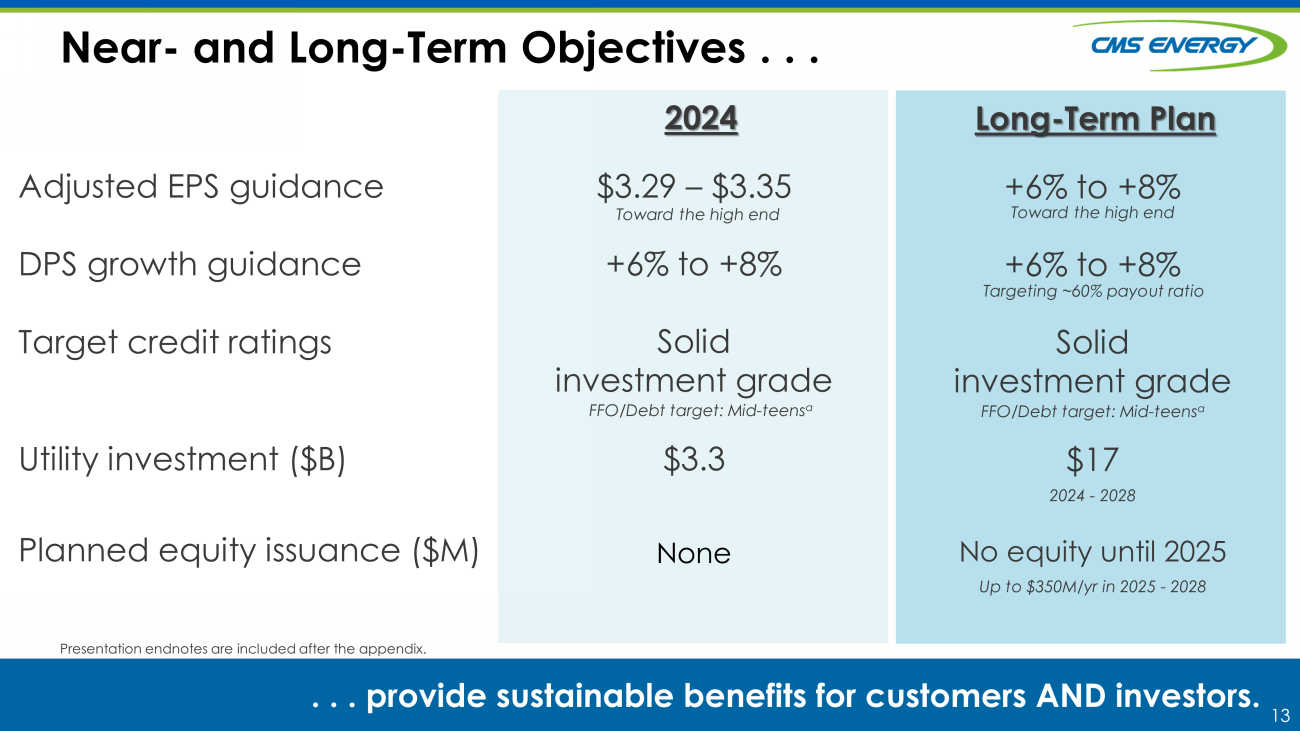
13 Near - and Long - Term Objectives . . . . . . p rovide sustainable benefits for customers AND investors. Presentation endnotes are included after the appendix. Adjusted EPS guidance DPS growth guidance Target credit ratings Utility investment ($B) Planned equity issuance ($M) $ 3.29 – $3.35 +6% to +8% Solid investment grade $ 3.3 None 2024 +6% to +8% +6% to +8% Solid investment grade $17 No equity until 2025 Long - Term Plan FFO/Debt target: Mid - teens a FFO/Debt target: Mid - teens a Up to $350M/ yr in 2025 - 2028 Toward the high end 2024 - 2028 Toward the high end Targeting ~60% payout ratio
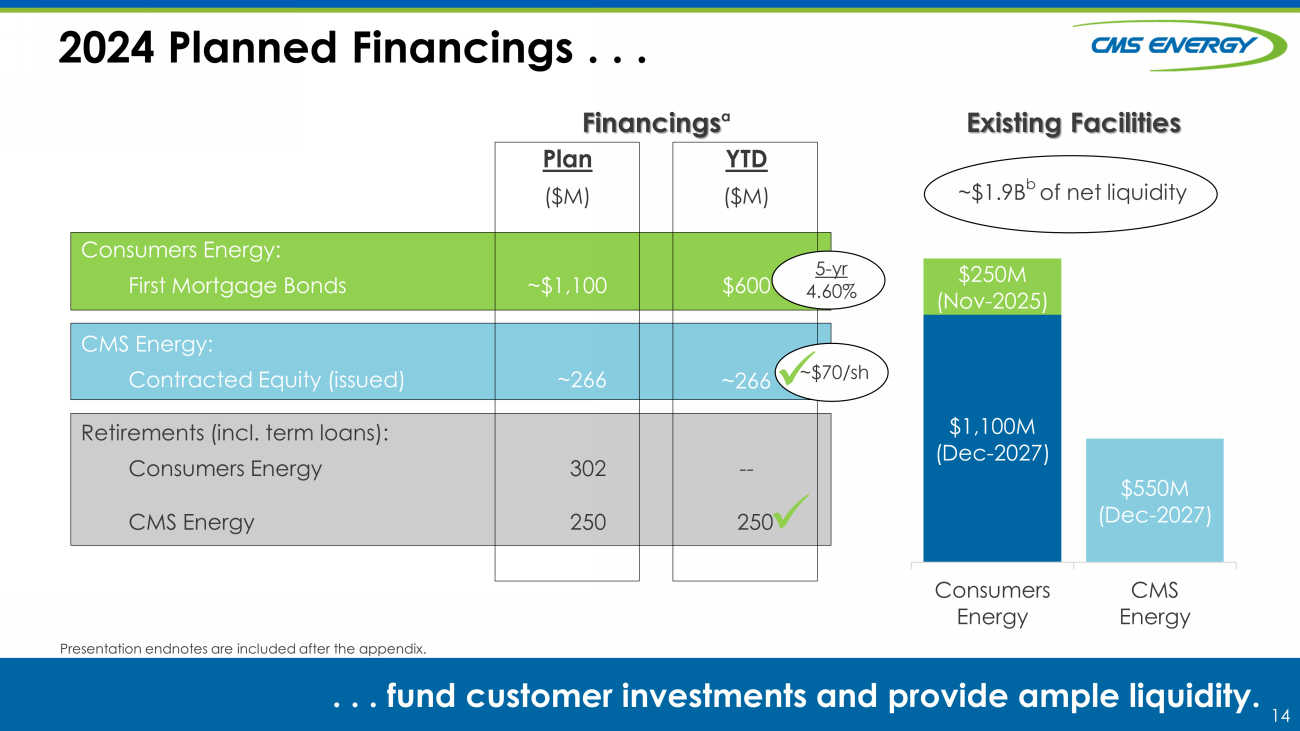
14 Plan YTD ($M) ($M) Consumers Energy: First Mortgage Bonds ~$1,100 $600 CMS Energy: Contracted Equity (issued) ~266 ~266 Retirements (incl. term loans): Consumers Energy 302 -- CMS Energy 250 250 Existing Facilities $1,100M (Dec - 2027) $550M (Dec - 2027) $250M (Nov - 2025) Consumers Energy CMS Energy Financings a 2024 Planned Financings . . . . . . fund customer investments and provide ample liquidity. Presentation endnotes are included after the appendix. ~$ 1.9 B b of net liquidity 5 - yr 4.60% x ~$70/ sh x
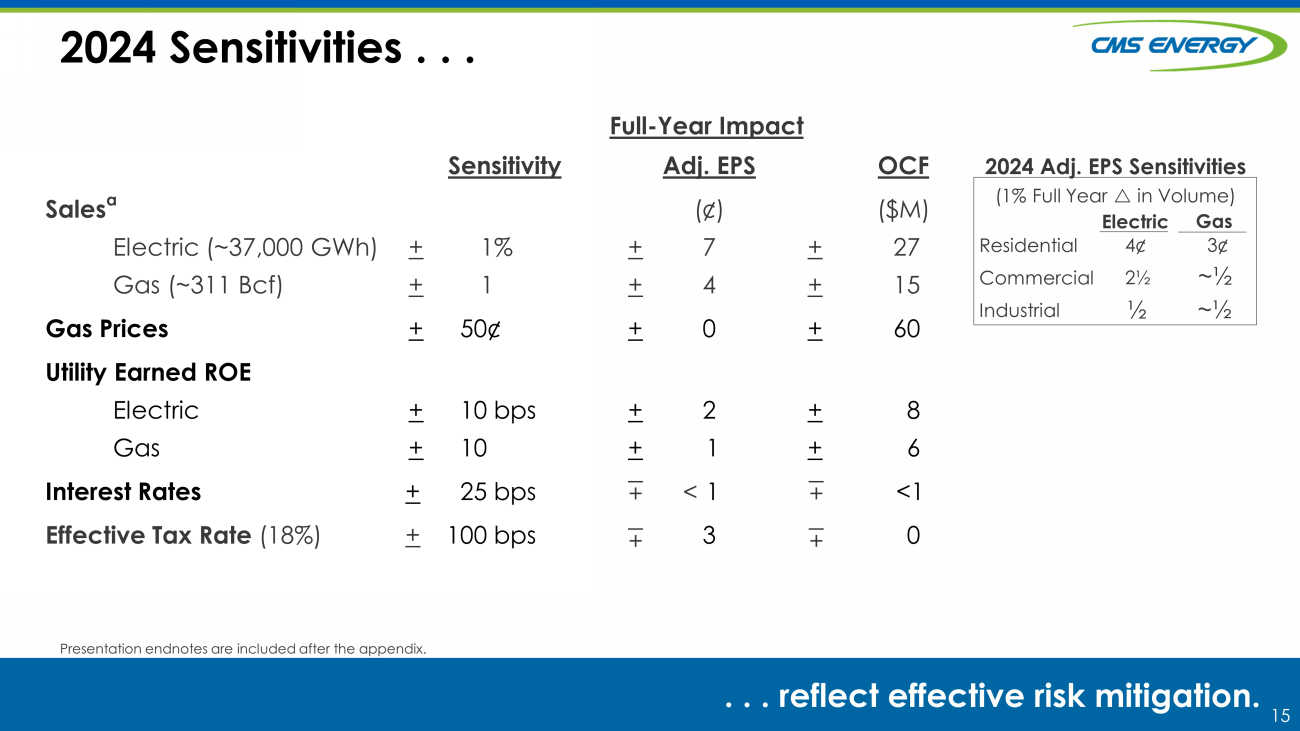
15 2024 Sensitivities . . . . . . r eflect effective risk mitigation. Presentation endnotes are included after the appendix. Full - Year Impact Sensitivity Adj. EPS OCF Sales a Electric (~37,000 GWh) Gas (~311 Bcf) + + 1% 1 + + ( ¢) 7 4 + + ($M) 27 15 Gas Prices + 50 ¢ + 0 + 60 Utility Earned ROE Electric Gas + + 10 bps 10 + + 2 1 + + 8 6 Interest Rates + 25 bps 1 <1 Effective Tax Rate (18%) + 100 bps 3 0 + + + + Electric Residential Commercial Industrial 4¢ 2½ 3 ¢ (1% Full Year in Volume) 2024 Adj. EPS Sensitivities Gas ½ ~½ ~½ <
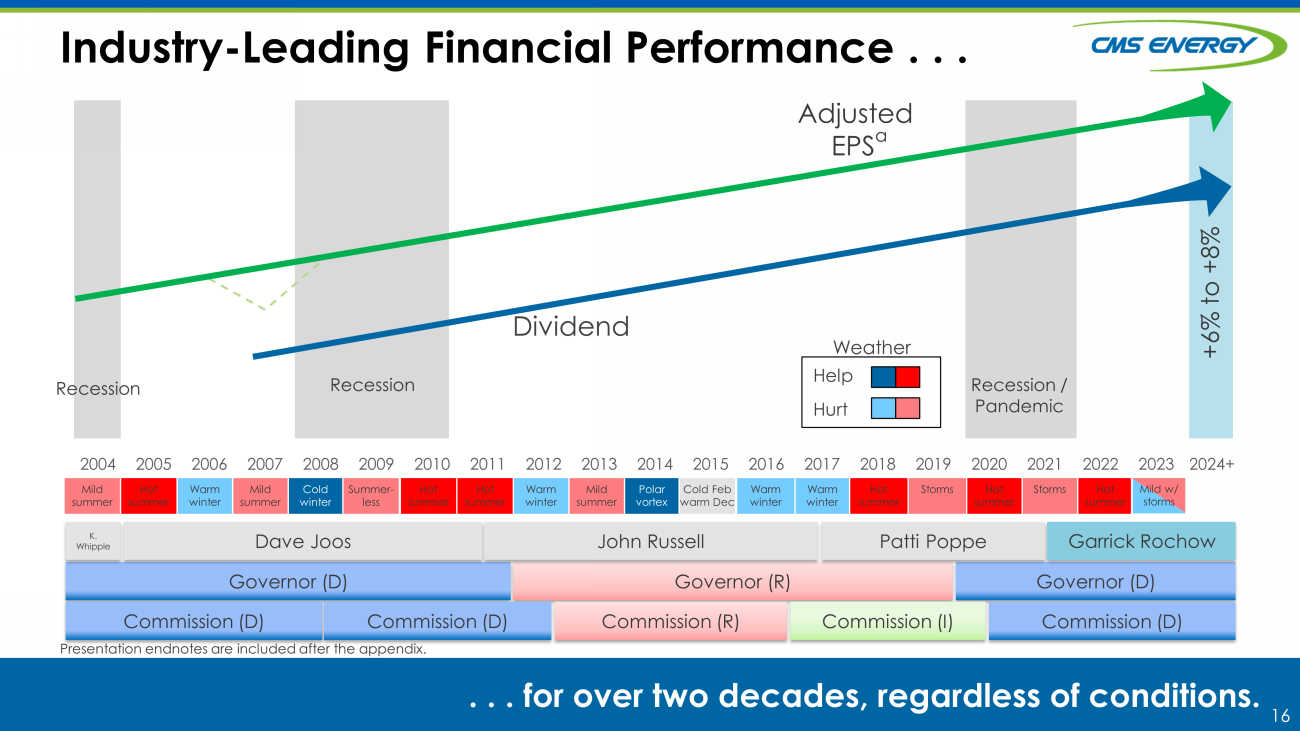
16 Recession Industry - Leading Financial Performance . . . . . . for over two decades, regardless of conditions. 2004 2005 2006 2007 2008 2009 2010 2011 2012 2013 2014 2015 2016 2017 2018 2019 2020 2021 2022 2023 2024+ Recession Adjusted EPS a Dividend +6% to +8% Weather Help Hurt Mild summer Hot summer Warm winter Mild summer Cold winter Summer - less Warm winter Warm winter Hot summer Storms Hot summer Storms Hot summer Governor (D) Governor (R) Governor (D) Commission (D) Commission (D) Commission (R) Commission (I) Commission (D) Dave Joos John Russell Patti Poppe K. Whipple Recession / Pandemic Presentation endnotes are included after the appendix. Mild w/ storms Garrick Rochow Hot summer Hot summer Warm winter Mild summer Polar vortex Cold Feb warm Dec Mild w/ storms

17 17 Q&A Thank You!
18 18 Appendix
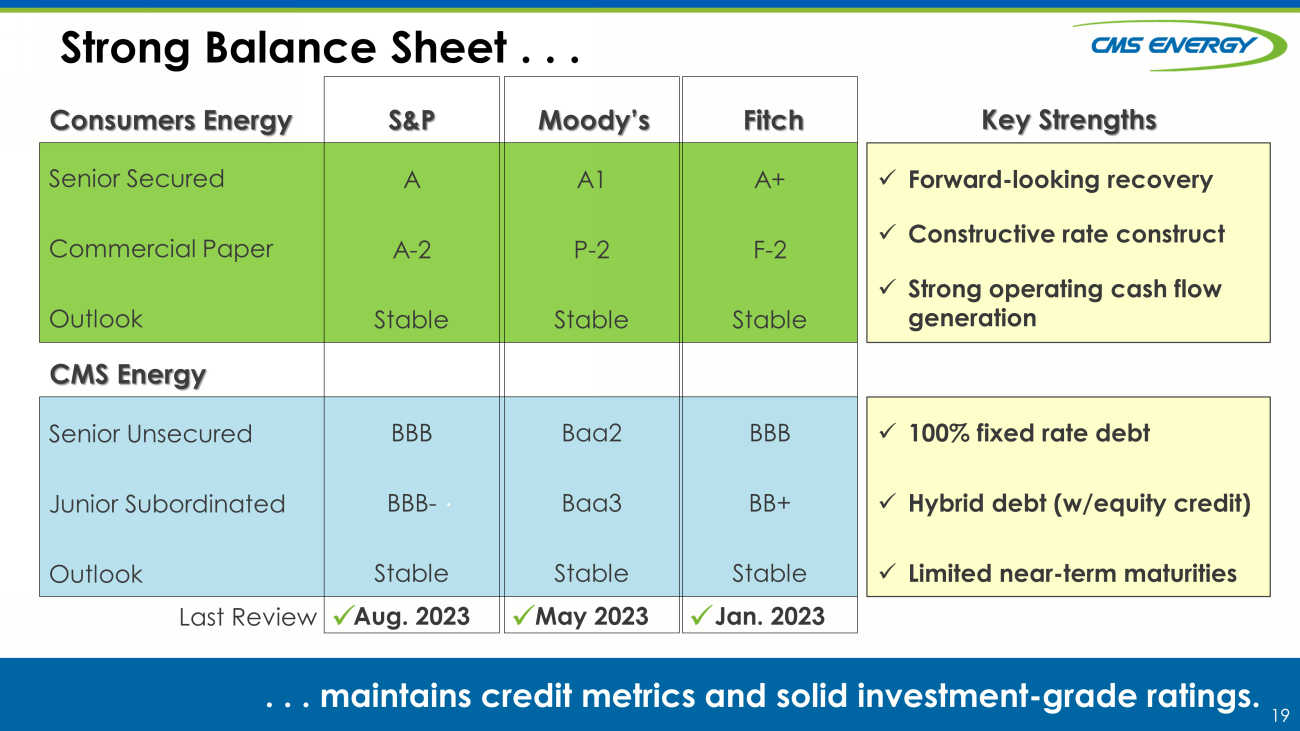
19 . Strong Balance Sheet . . . Consumers Energy CMS Energy Senior Secured Commercial Paper Outlook Senior Unsecured Junior Subordinated Outlook Last Review A A - 2 Stable BBB BBB - Stable Aug . 2023 A1 P - 2 Stable Baa2 Baa3 Stable May 2023 A+ F - 2 Stable BBB BB+ Stable Jan. 2023 S&P Moody’s Fitch . . . m aintains credit metrics and solid investment - grade ratings. x x x x Forward - looking recovery x Constructive rate construct x Strong operating cash flow generation x 100 % fixed rate debt x Hybrid debt (w/equity credit) x Limited near - term maturities Key Strengths
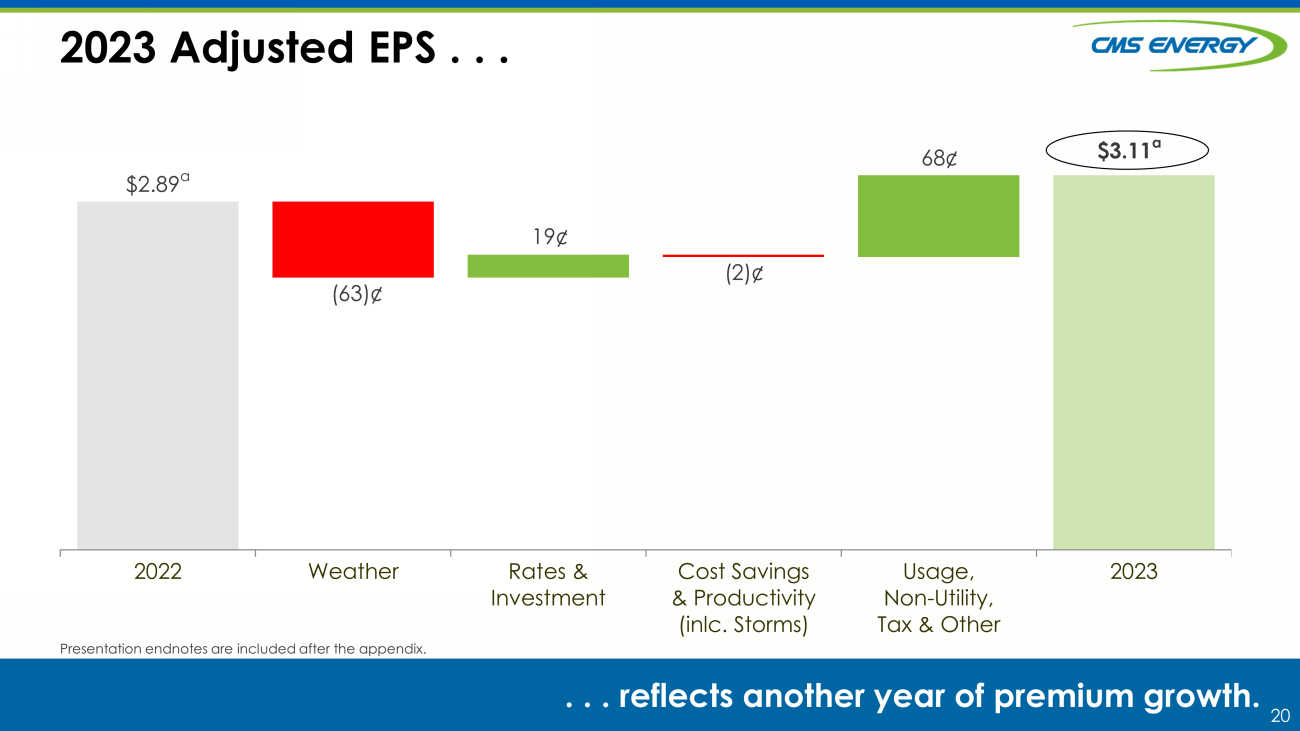
20 2023 Adjusted EPS . . . . . . managing through COVID - 19 risks. 2022 Weather Rates & Investment Cost Savings & Productivity (inlc. Storms) Usage, Non-Utility, Tax & Other 2023 68 ¢ 19¢ (2)¢ ( 63 )¢ $2.89 a . . . reflects another year of premium growth. $ 3.11 a Presentation endnotes are included after the appendix.
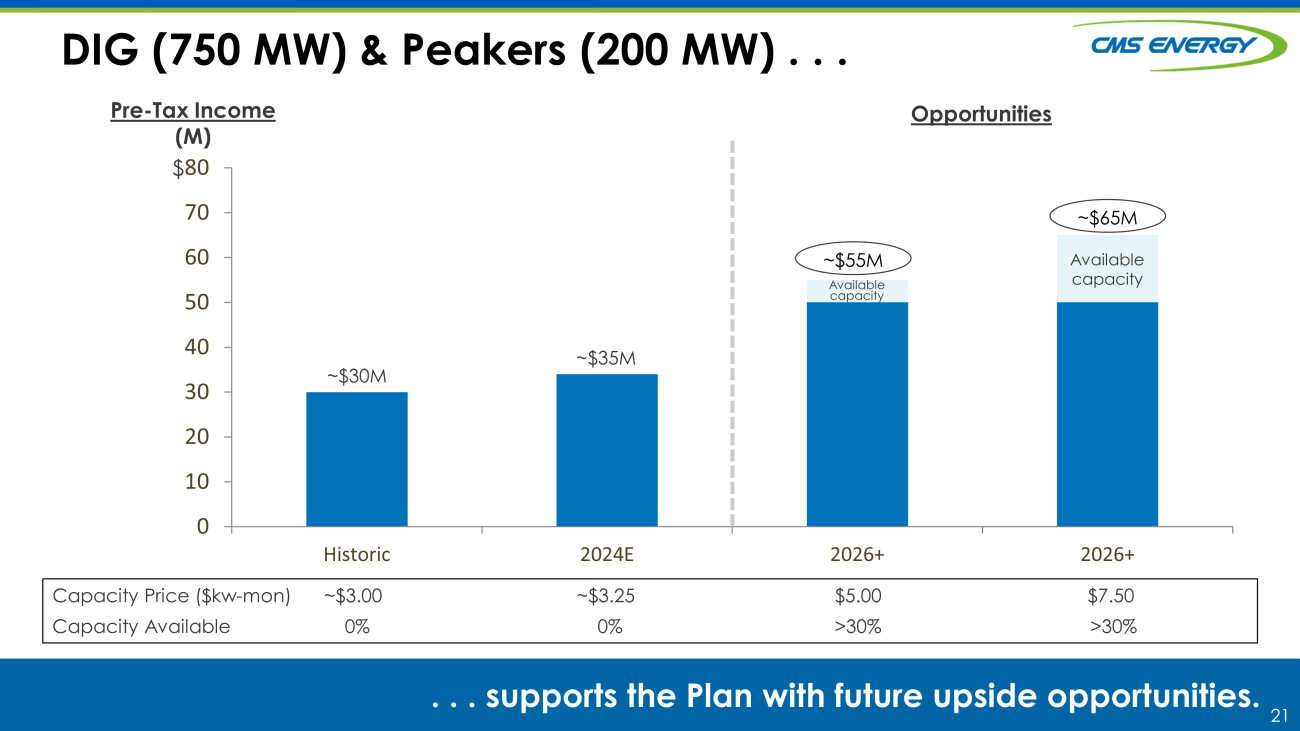
21 0 10 20 30 40 50 60 70 80 Historic 2024E 2026+ 2026+ DIG (750 MW) & Peakers (200 MW) . . . . . . supports the Plan with future upside opportunities. ~$ 55M ~$30M ~$35M Pre - Tax Income (M) Capacity Price ($kw - mon ) ~$3.00 ~$3.25 $5.00 $7.50 Capacity Available 0% 0% >30% >30% $ Available capacity Available capacity ~$ 65M Opportunities
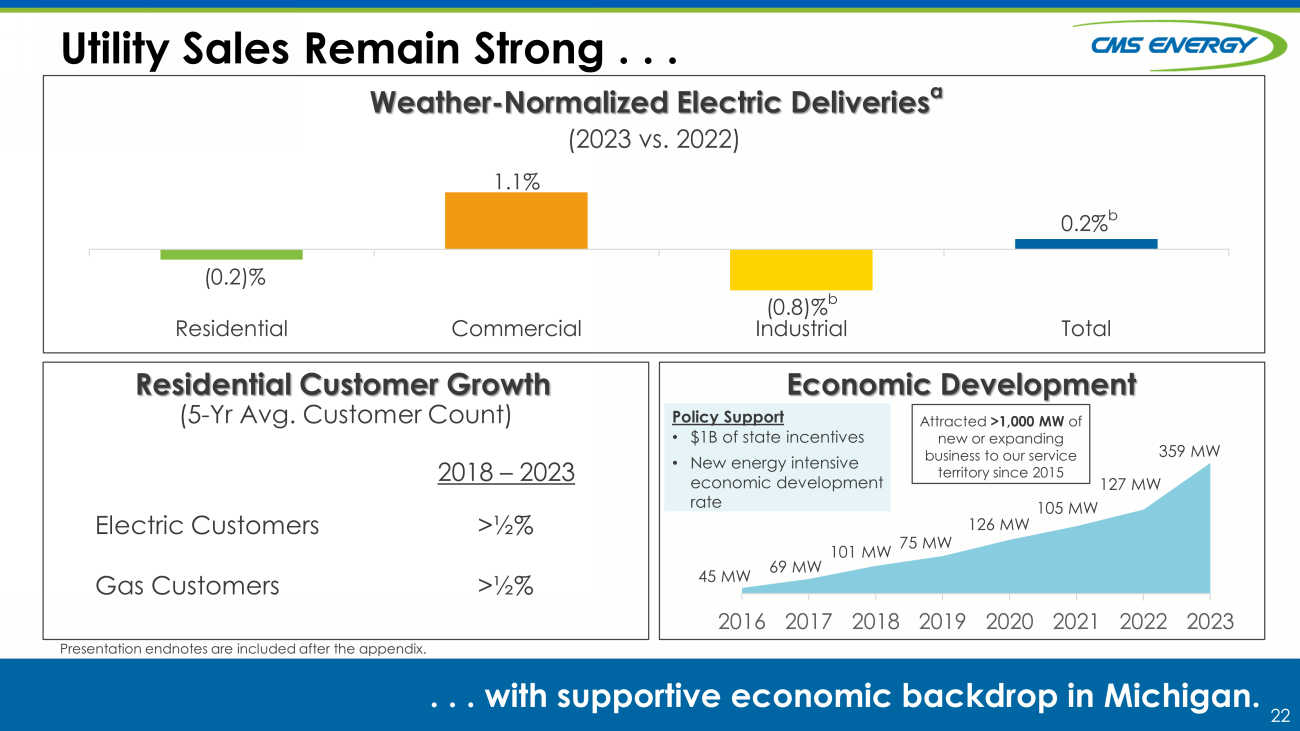
22 Utility Sales Remain Strong . . . . . . w ith supportive economic backdrop in Michigan. Weather - Normalized Electric Deliveries a Residential Commercial Industrial Total ( 0.2 )% 1.1 % (0.8) % b 0.2 % b Presentation endnotes are included after the appendix. (2023 vs. 2022) Economic Development Electric Customers Gas Customers >½ % >½ % (5 - Yr Avg. Customer Count) Residential Customer Growth 2018 – 2023 2016 2017 2018 2019 2020 2021 2022 2023 105 MW 126 MW 75 MW 45 MW 101 MW 69 MW Attracted >1,000 MW of new or expanding business to our service territory since 2015 • $1B of state incentives • New energy intensive economic development rate Policy Support 359 MW 127 MW
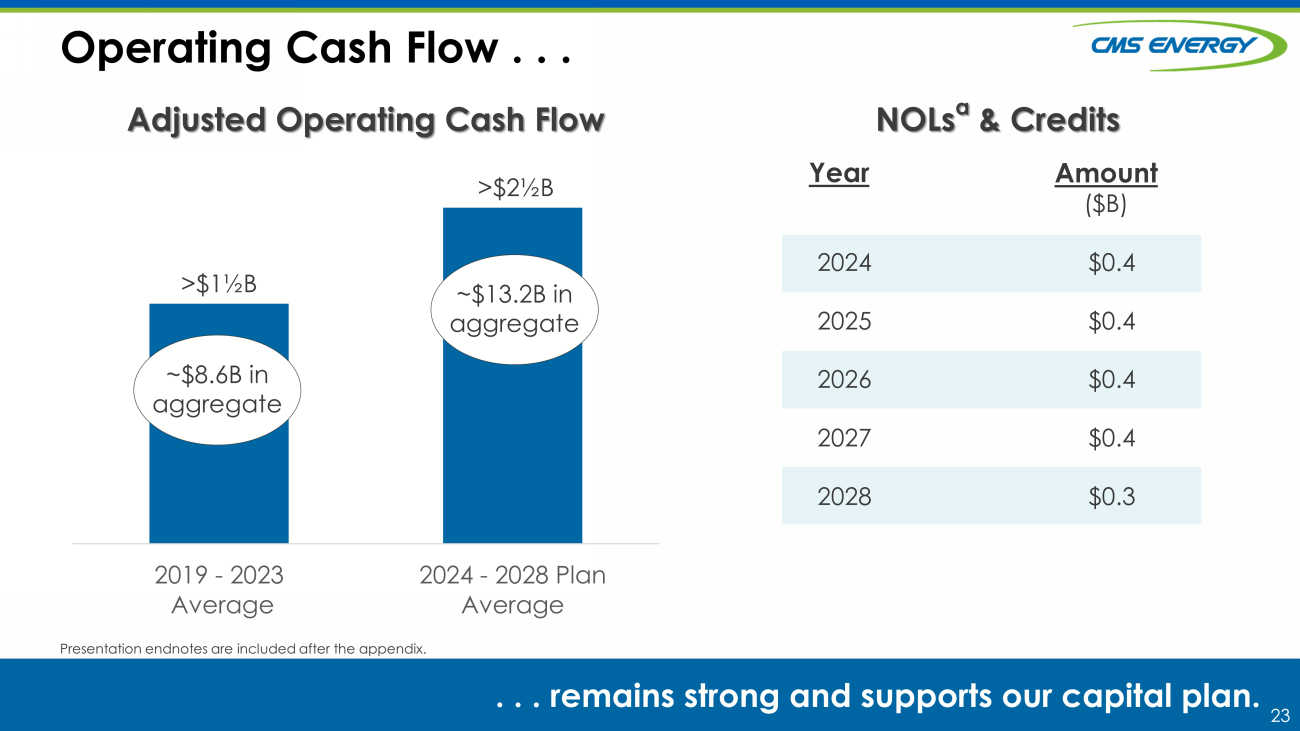
23 Operating Cash Flow . . . . . . remains strong and supports our capital plan. Presentation endnotes are included after the appendix. 2024 2025 2026 2027 2028 NOLs a & Credits Adjusted Operating Cash Flow $0.4 $0.4 $ 0.4 $ 0.4 $ 0.3 Amount ($B) Year >$1½B >$2½B 2019 - 2023 Average 2024 - 2028 Plan Average ~$13.2B in aggregate ~$8.6B in aggregate
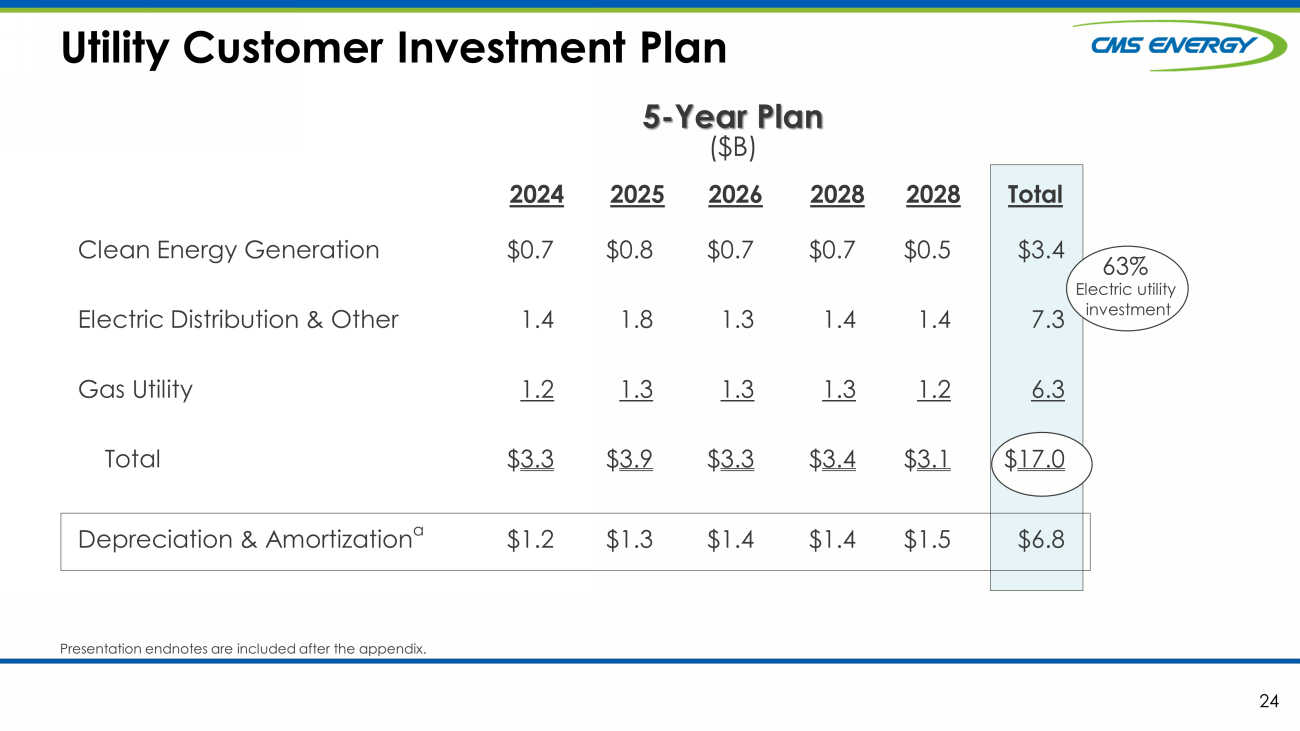
24 Utility Customer Investment Plan Enter “so what” if necessary – Century Gothic, Bold, Size 18 or smaller 24 Clean Energy Generation Electric Distribution & Other Gas Utility Total Depreciation & Amortization a $0.7 1.4 1.2 $ 3.3 $ 1.2 2028 $0.7 1.4 1.3 $ 3.4 $ 1.4 2025 2026 2028 Total 2024 $ 0.5 1.4 1.2 $ 3.1 $ 1.5 $0.7 1.3 1.3 $ 3.3 $ 1.4 $0.8 1.8 1.3 $ 3 .9 $ 1.3 5 - Year Plan ($B) 63 % Electric utility investment $3.4 7 .3 6.3 $ 17.0 $ 6.8 Presentation endnotes are included after the appendix.
25 25 Endnotes
26 Presentation Endnotes 26 Slide 3: a RRA state regulatory energy rankings, May 2023. Regulatory Research Associates, a group within S&P Global Commodity Insights. Slide 5: a New energy law effective June 1, 2024 Slide 7: a Assumes $24.6B rate base in 2023, $35.2B in 2028, CAGR b Over plan period years 2024 - 2028 Slide 8: a $17B utility capital investment plan (2024 - 2028), up $1.5B from prior plan (2023 - 2027) Slide 9: a See GAAP reconciliation on slide 30 Slide 10: a Mid - teens, as calculated by rating agencies b Settled equity of $178 million in November 2023 and $266 million in January 2024 Slide 12: a Adjusted EPS Slide 13: a Mid - teens, as calculated by rating agencies Slide 14: a Excludes tax - exempt remarketing in October 2024 b $ 1,708 M in unreserved revolvers + $ 191M of unrestricted cash; e xcludes cash unavailable for debt retirement such as held at NorthStar subs Slide 15: a Reflects 2024 sales forecast; weather - normalized Slide 16: a Excludes discontinued operations Slide 20: a Adjusted EPS Slide 22: a 2023 year over year change in GWh, excludes ROA and other b Excludes one large, low - margin industrial customer Slide 23: a After - tax Slide 24: a I ncludes securitization amortization of ~$100M/yr and regulatory asset amortization of ~$100M/yr
27 27 GAAP Reconciliation CMS Energy provides historical financial results on both a reported (GAAP) and adjusted (non - GAAP) basis and provides forward - lo oking guidance on an adjusted basis. During an oral presentation, references to “earnings” are on an adjusted basis. All references to net income ref er to net income available to common stockholders and references to earnings per share are on a diluted basis. Adjustments could include items such as disc ont inued operations, asset sales, impairments, restructuring costs, business optimization initiative, changes in accounting principles, voluntary separation pr ogr am, changes in federal tax policy, regulatory items from prior years, unrealized gains or losses from mark - to - market adjustments, recognized in net income related to NorthStar Clean Energy’s interest expense, or other items. Management views adjusted earnings as a key measure of the company’s present operating fina nci al performance and uses adjusted earnings for external communications with analysts and investors. Internally, the company uses adjusted earnings to mea sure and assess performance. Because the company is not able to estimate the impact of specific line items, which have the potential to significantly impa ct, favorably or unfavorably, the company's reported earnings in future periods, the company is not providing reported earnings guidance nor is it providing a rec onciliation for the comparable future period earnings. The adjusted earnings should be considered supplemental information to assist in understanding our bu sin ess results, rather than as a substitute for the reported earnings.
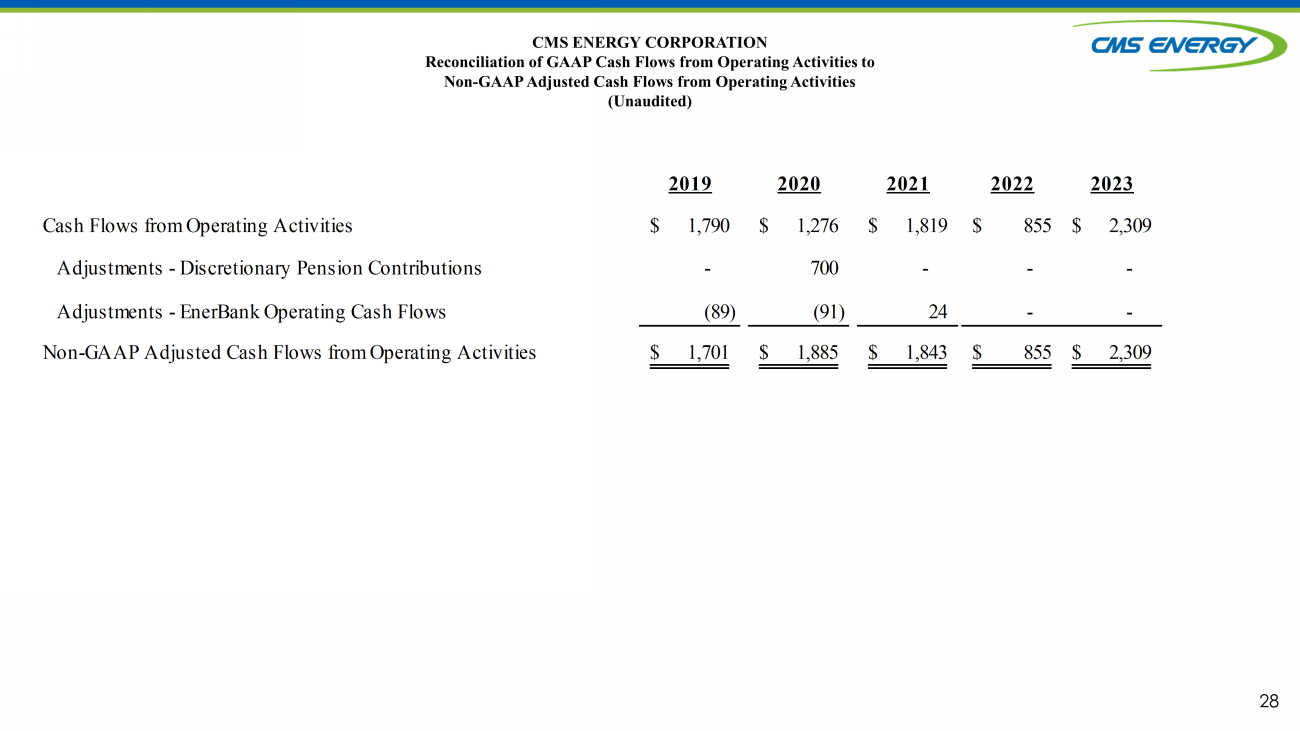
28 CMS ENERGY CORPORATION Reconciliation of GAAP Cash Flows from Operating Activities to Non - GAAP Adjusted Cash Flows from Operating Activities (Unaudited) 2019 2020 2021 2022 2023 Cash Flows from Operating Activities 1,790$ 1,276$ 1,819$ 855$ 2,309$ Adjustments - Discretionary Pension Contributions - 700 - - - Adjustments - EnerBank Operating Cash Flows (89) (91) 24 - - Non-GAAP Adjusted Cash Flows from Operating Activities 1,701$ 1,885$ 1,843$ 855$ 2,309$
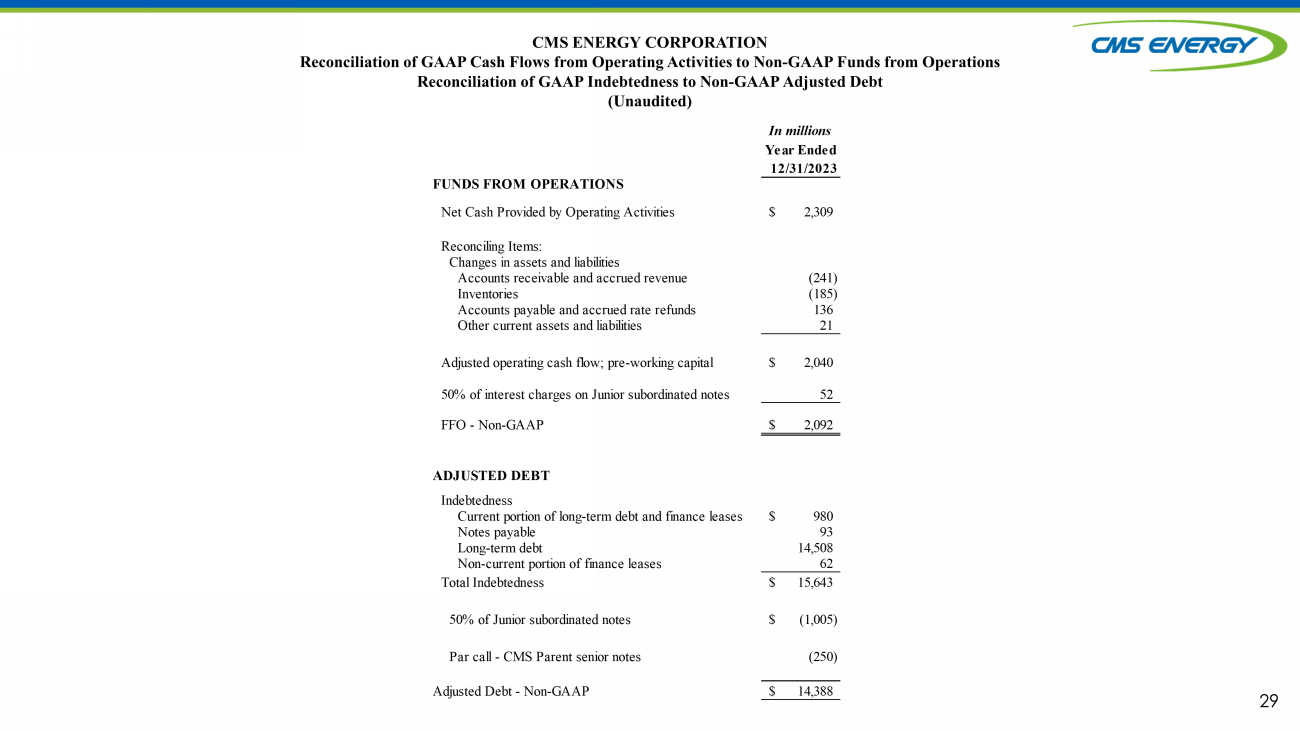
29 CMS ENERGY CORPORATION Reconciliation of GAAP Cash Flows from Operating Activities to Non - GAAP Funds from Operations Reconciliation of GAAP Indebtedness to Non - GAAP Adjusted Debt (Unaudited) In millions Year Ended 12/31/2023 FUNDS FROM OPERATIONS Net Cash Provided by Operating Activities 2,309$ Reconciling Items: Changes in assets and liabilities Accounts receivable and accrued revenue (241) Inventories (185) Accounts payable and accrued rate refunds 136 Other current assets and liabilities 21 Adjusted operating cash flow; pre-working capital 2,040$ 50% of interest charges on Junior subordinated notes 52 FFO - Non-GAAP 2,092$ ADJUSTED DEBT Indebtedness Current portion of long-term debt and finance leases 980$ Notes payable 93 Long-term debt 14,508 Non-current portion of finance leases 62 Total Indebtedness 15,643$ 50% of Junior subordinated notes (1,005)$ Par call - CMS Parent senior notes (250) Adjusted Debt - Non-GAAP 14,388$
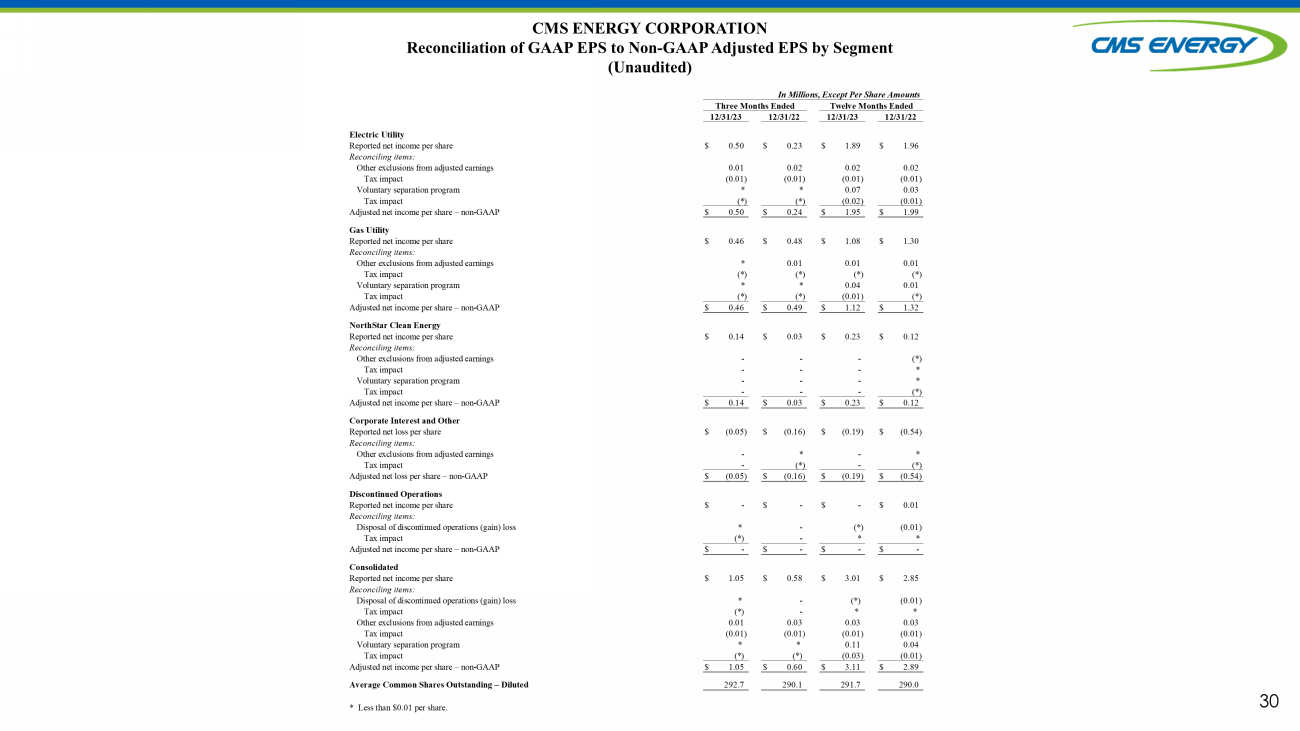
30 CMS ENERGY CORPORATION Reconciliation of GAAP EPS to Non - GAAP Adjusted EPS by Segment (Unaudited) Electric Utility Reported net income per share $ 0.50 $ 0.23 $ 1.89 $ 1.96 Reconciling items: Other exclusions from adjusted earnings 0.01 0.02 0.02 0.02 Tax impact (0.01) (0.01) (0.01) (0.01) Voluntary separation program * * 0.07 0.03 Tax impact (*) (*) (0.02) (0.01) Adjusted net income per share – non-GAAP $ 0.50 $ 0.24 $ 1.95 $ 1.99 Gas Utility Reported net income per share $ 0.46 $ 0.48 $ 1.08 $ 1.30 Reconciling items: Other exclusions from adjusted earnings * 0.01 0.01 0.01 Tax impact (*) (*) (*) (*) Voluntary separation program * * 0.04 0.01 Tax impact (*) (*) (0.01) (*) Adjusted net income per share – non-GAAP $ 0.46 $ 0.49 $ 1.12 $ 1.32 NorthStar Clean Energy Reported net income per share $ 0.14 $ 0.03 $ 0.23 $ 0.12 Reconciling items: Other exclusions from adjusted earnings - - - (*) Tax impact - - - * Voluntary separation program - - - * Tax impact - - - (*) Adjusted net income per share – non-GAAP $ 0.14 $ 0.03 $ 0.23 $ 0.12 Corporate Interest and Other Reported net loss per share $ (0.05) $ (0.16) $ (0.19) $ (0.54) Reconciling items: Other exclusions from adjusted earnings - * - * Tax impact - (*) - (*) Adjusted net loss per share – non-GAAP $ (0.05) $ (0.16) $ (0.19) $ (0.54) Discontinued Operations Reported net income per share $ - $ - $ - $ 0.01 Reconciling items: Disposal of discontinued operations (gain) loss * - (*) (0.01) Tax impact (*) - * * Adjusted net income per share – non-GAAP $ - $ - $ - $ - Consolidated Reported net income per share $ 1.05 $ 0.58 $ 3.01 $ 2.85 Reconciling items: Disposal of discontinued operations (gain) loss * - (*) (0.01) Tax impact (*) - * * Other exclusions from adjusted earnings 0.01 0.03 0.03 0.03 Tax impact (0.01) (0.01) (0.01) (0.01) Voluntary separation program * * 0.11 0.04 Tax impact (*) (*) (0.03) (0.01) Adjusted net income per share – non-GAAP $ 1.05 $ 0.60 $ 3.11 $ 2.89 Average Common Shares Outstanding – Diluted 292.7 290.1 291.7 290.0 * Less than $0.01 per share. In Millions, Except Per Share Amounts Three Months Ended Twelve Months Ended 12/31/23 12/31/22 12/31/23 12/31/22
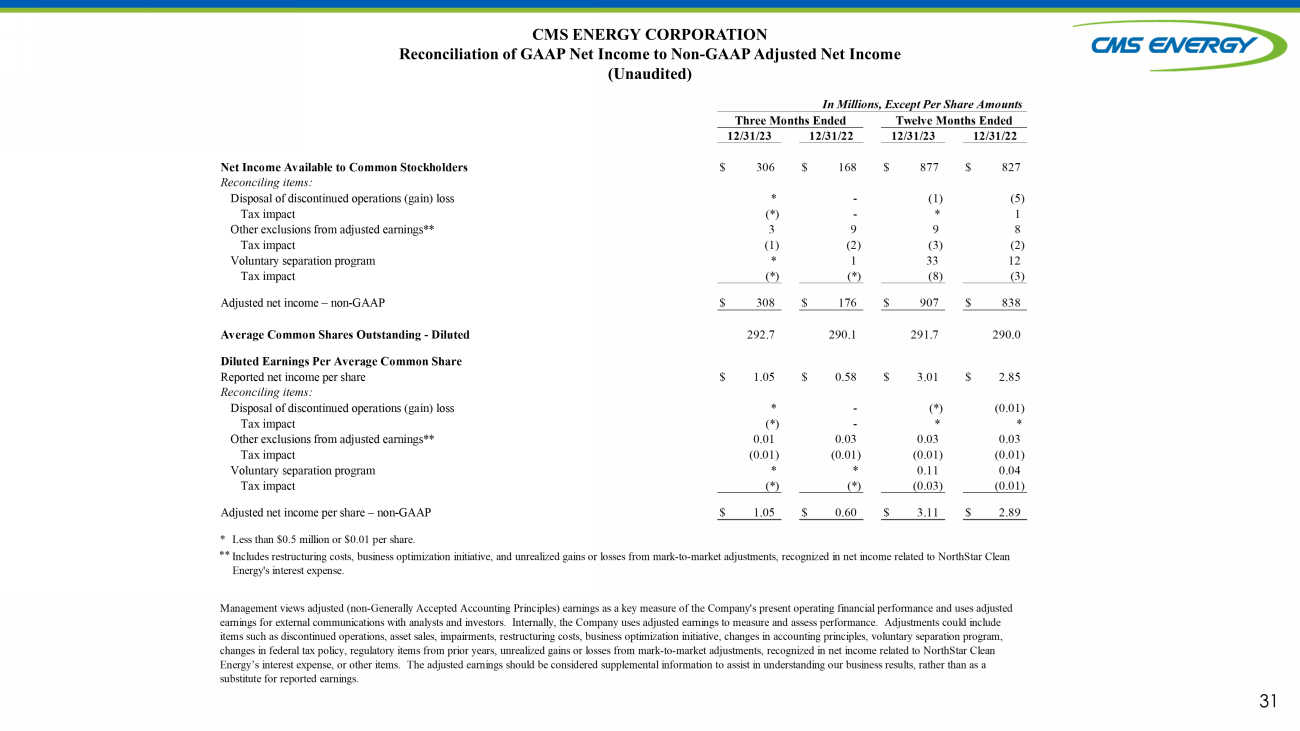
31 CMS ENERGY CORPORATION Reconciliation of GAAP Net Income to Non - GAAP Adjusted Net Income (Unaudited) Net Income Available to Common Stockholders $ 306 $ 168 $ 877 $ 827 Reconciling items: Disposal of discontinued operations (gain) loss * - (1) (5) Tax impact (*) - * 1 Other exclusions from adjusted earnings** 3 9 9 8 Tax impact (1) (2) (3) (2) Voluntary separation program * 1 33 12 Tax impact (*) (*) (8) (3) Adjusted net income – non-GAAP $ 308 $ 176 $ 907 $ 838 Average Common Shares Outstanding - Diluted 292.7 290.1 291.7 290.0 Diluted Earnings Per Average Common Share Reported net income per share $ 1.05 $ 0.58 $ 3.01 $ 2.85 Reconciling items: Disposal of discontinued operations (gain) loss * - (*) (0.01) Tax impact (*) - * * Other exclusions from adjusted earnings** 0.01 0.03 0.03 0.03 Tax impact (0.01) (0.01) (0.01) (0.01) Voluntary separation program * * 0.11 0.04 Tax impact (*) (*) (0.03) (0.01) Adjusted net income per share – non-GAAP $ 1.05 $ 0.60 $ 3.11 $ 2.89 * Less than $0.5 million or $0.01 per share. ** In Millions, Except Per Share Amounts Management views adjusted (non-Generally Accepted Accounting Principles) earnings as a key measure of the Company's present operating financial performance and uses adjusted earnings for external communications with analysts and investors. Internally, the Company uses adjusted earnings to measure and assess performance. Adjustments could include items such as discontinued operations, asset sales, impairments, restructuring costs, business optimization initiative, changes in accounting principles, voluntary separation program, changes in federal tax policy, regulatory items from prior years, unrealized gains or losses from mark-to-market adjustments, recognized in net income related to NorthStar Clean Energy’s interest expense, or other items. The adjusted earnings should be considered supplemental information to assist in understanding our business results, rather than as a substitute for reported earnings. Three Months Ended Twelve Months Ended 12/31/23 12/31/22 12/31/23 12/31/22 Includes restructuring costs, business optimization initiative, and unrealized gains or losses from mark-to-market adjustments, recognized in net income related to NorthStar Clean Energy's interest expense.

32 CMS ENERGY CORPORATION Reconciliation of GAAP Net Income to Non - GAAP Adjusted Net Income by Quarter (Unaudited) * Less than $0.5 million or $0.01 per share. Net Income Available to Common Stockholders $ 202 $ 195 $ 174 $ 306 Reconciling items: Electric utility and gas utility 3 30 6 3 Tax impact (1) (7) (2) (1) NorthStar Clean Energy - - - - Tax impact - - - - Corporate interest and other - - - - Tax impact - - - - Disposal of discontinued operations (gain) loss - (1) - * Tax impact - * - (*) Adjusted Net Income – Non-GAAP $ 204 $ 217 $ 178 $ 308 Average Common Shares Outstanding – Diluted 291.2 291.3 291.4 292.7 Diluted Earnings Per Average Common Share $ 0.69 $ 0.67 $ 0.60 $ 1.05 Reconciling items: Electric utility and gas utility 0.01 0.10 0.01 0.01 Tax impact (*) (0.02) (*) (0.01) NorthStar Clean Energy - - - - Tax impact - - - - Corporate interest and other - - - - Tax impact - - - - Disposal of discontinued operations (gain) loss - (*) - * Tax impact - * - (*) Adjusted Diluted Earnings Per Average Common Share – Non-GAAP $ 0.70 $ 0.75 $ 0.61 $ 1.05 In Millions, Except Per Share Amounts 2023 1Q 2Q 3Q 4Q
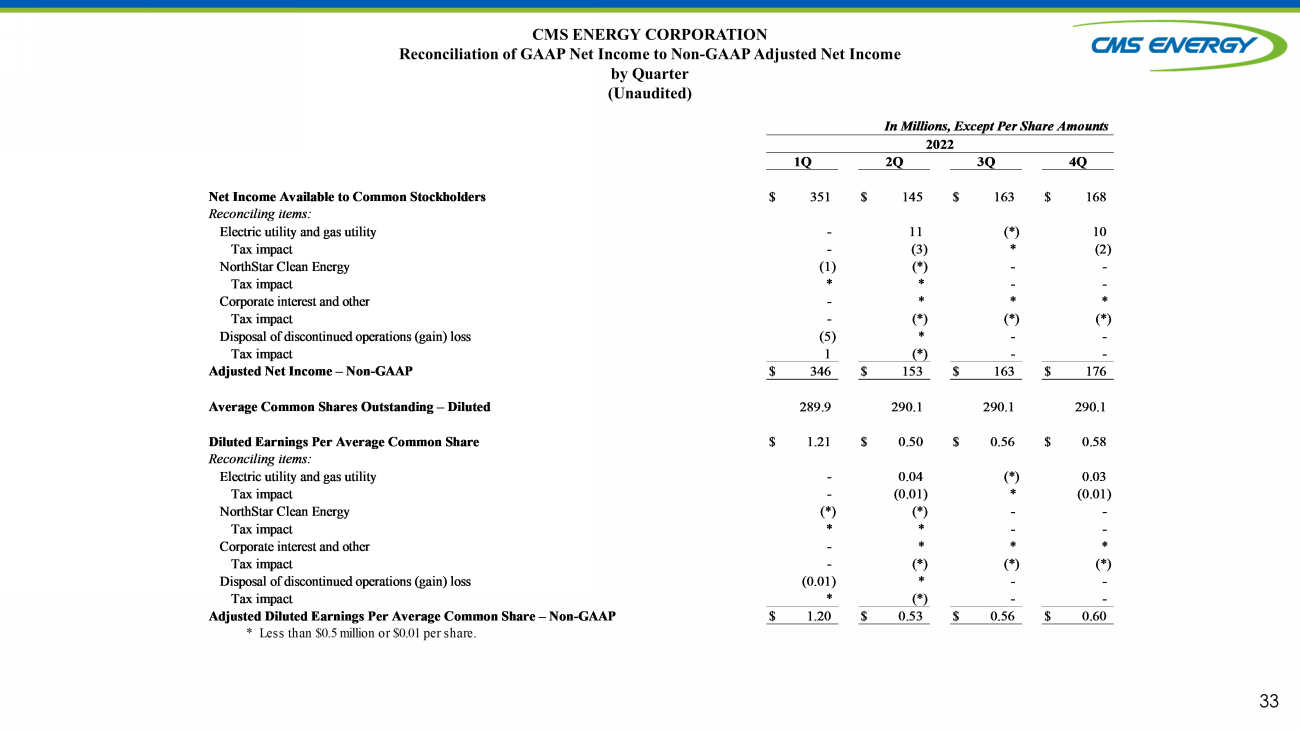
33 CMS ENERGY CORPORATION Reconciliation of GAAP Net Income to Non - GAAP Adjusted Net Income by Quarter (Unaudited) * Less than $0.5 million or $0.01 per share. Net Income Available to Common Stockholders $ 351 $ 145 $ 163 $ 168 Reconciling items: Electric utility and gas utility - 11 (*) 10 Tax impact - (3) * (2) NorthStar Clean Energy (1) (*) - - Tax impact * * - - Corporate interest and other - * * * Tax impact - (*) (*) (*) Disposal of discontinued operations (gain) loss (5) * - - Tax impact 1 (*) - - Adjusted Net Income – Non-GAAP $ 346 $ 153 $ 163 $ 176 Average Common Shares Outstanding – Diluted 289.9 290.1 290.1 290.1 Diluted Earnings Per Average Common Share $ 1.21 $ 0.50 $ 0.56 $ 0.58 Reconciling items: Electric utility and gas utility - 0.04 (*) 0.03 Tax impact - (0.01) * (0.01) NorthStar Clean Energy (*) (*) - - Tax impact * * - - Corporate interest and other - * * * Tax impact - (*) (*) (*) Disposal of discontinued operations (gain) loss (0.01) * - - Tax impact * (*) - - Adjusted Diluted Earnings Per Average Common Share – Non-GAAP $ 1.20 $ 0.53 $ 0.56 $ 0.60 2022 1Q 2Q 3Q 4Q In Millions, Except Per Share Amounts
v3.24.0.1
Cover
|
Feb. 01, 2024 |
| Document Information [Line Items] |
|
| Document Type |
8-K
|
| Amendment Flag |
false
|
| Document Period End Date |
Feb. 01, 2024
|
| Entity File Number |
1-9513
|
| Entity Registrant Name |
CMS ENERGY CORPORATION
|
| Entity Central Index Key |
0000811156
|
| Entity Tax Identification Number |
38-2726431
|
| Entity Incorporation, State or Country Code |
MI
|
| Entity Address, Address Line One |
One Energy Plaza
|
| Entity Address, City or Town |
Jackson
|
| Entity Address, State or Province |
MI
|
| Entity Address, Postal Zip Code |
49201
|
| City Area Code |
517
|
| Local Phone Number |
788-0550
|
| Written Communications |
false
|
| Soliciting Material |
false
|
| Pre-commencement Tender Offer |
false
|
| Pre-commencement Issuer Tender Offer |
false
|
| Entity Emerging Growth Company |
false
|
| Common Stock [Member] |
|
| Document Information [Line Items] |
|
| Title of 12(b) Security |
CMS Energy Corporation Common Stock, $0.01 par value
|
| Trading Symbol |
CMS
|
| Security Exchange Name |
NYSE
|
| A 5.625 Junior Subordinated Notes Due 2078 Member |
|
| Document Information [Line Items] |
|
| Title of 12(b) Security |
CMS Energy Corporation 5.625% Junior Subordinated Notes due 2078
|
| Trading Symbol |
CMSA
|
| Security Exchange Name |
NYSE
|
| A 5.875 Junior Subordinated Notes Due 2078 Member |
|
| Document Information [Line Items] |
|
| Title of 12(b) Security |
CMS Energy Corporation 5.875% Junior Subordinated Notes due 2078
|
| Trading Symbol |
CMSC
|
| Security Exchange Name |
NYSE
|
| A 5.875 Junior Subordinated Notes Due 2079 Member |
|
| Document Information [Line Items] |
|
| Title of 12(b) Security |
CMS Energy Corporation 5.875% Junior Subordinated Notes due 2079
|
| Trading Symbol |
CMSD
|
| Security Exchange Name |
NYSE
|
| CMS Energy Corporation, Depositary Shares, each representing a 1/1,000th interest in a share of 4.200% Cumulative Redeemable Perpetual Preferred Stock, Series C [Member] |
|
| Document Information [Line Items] |
|
| Title of 12(b) Security |
CMS Energy Corporation, Depositary Shares
|
| Trading Symbol |
CMS PRC
|
| Security Exchange Name |
NYSE
|
| Consumers Energy Company Member |
|
| Document Information [Line Items] |
|
| Document Type |
8-K
|
| Amendment Flag |
false
|
| Document Period End Date |
Feb. 01, 2024
|
| Entity File Number |
1-5611
|
| Entity Registrant Name |
CONSUMERS ENERGY COMPANY
|
| Entity Central Index Key |
0000201533
|
| Entity Tax Identification Number |
38-0442310
|
| Entity Incorporation, State or Country Code |
MI
|
| Entity Address, Address Line One |
One Energy Plaza
|
| Entity Address, City or Town |
Jackson
|
| Entity Address, State or Province |
MI
|
| Entity Address, Postal Zip Code |
49201
|
| City Area Code |
517
|
| Local Phone Number |
788-0550
|
| Written Communications |
false
|
| Soliciting Material |
false
|
| Pre-commencement Tender Offer |
false
|
| Pre-commencement Issuer Tender Offer |
false
|
| Title of 12(b) Security |
Consumers
Energy Company Cumulative Preferred Stock, $1.00 par value: $4.50 Series
|
| Trading Symbol |
CMS-PB
|
| Security Exchange Name |
NYSE
|
| Entity Emerging Growth Company |
false
|
| X |
- DefinitionBoolean flag that is true when the XBRL content amends previously-filed or accepted submission.
| Name: |
dei_AmendmentFlag |
| Namespace Prefix: |
dei_ |
| Data Type: |
xbrli:booleanItemType |
| Balance Type: |
na |
| Period Type: |
duration |
|
| X |
- DefinitionFor the EDGAR submission types of Form 8-K: the date of the report, the date of the earliest event reported; for the EDGAR submission types of Form N-1A: the filing date; for all other submission types: the end of the reporting or transition period. The format of the date is YYYY-MM-DD.
| Name: |
dei_DocumentPeriodEndDate |
| Namespace Prefix: |
dei_ |
| Data Type: |
xbrli:dateItemType |
| Balance Type: |
na |
| Period Type: |
duration |
|
| X |
- DefinitionThe type of document being provided (such as 10-K, 10-Q, 485BPOS, etc). The document type is limited to the same value as the supporting SEC submission type, or the word 'Other'.
| Name: |
dei_DocumentType |
| Namespace Prefix: |
dei_ |
| Data Type: |
dei:submissionTypeItemType |
| Balance Type: |
na |
| Period Type: |
duration |
|
| X |
- DefinitionAddress Line 1 such as Attn, Building Name, Street Name
| Name: |
dei_EntityAddressAddressLine1 |
| Namespace Prefix: |
dei_ |
| Data Type: |
xbrli:normalizedStringItemType |
| Balance Type: |
na |
| Period Type: |
duration |
|
| X |
- Definition
+ References
+ Details
| Name: |
dei_EntityAddressCityOrTown |
| Namespace Prefix: |
dei_ |
| Data Type: |
xbrli:normalizedStringItemType |
| Balance Type: |
na |
| Period Type: |
duration |
|
| X |
- DefinitionCode for the postal or zip code
| Name: |
dei_EntityAddressPostalZipCode |
| Namespace Prefix: |
dei_ |
| Data Type: |
xbrli:normalizedStringItemType |
| Balance Type: |
na |
| Period Type: |
duration |
|
| X |
- DefinitionName of the state or province.
| Name: |
dei_EntityAddressStateOrProvince |
| Namespace Prefix: |
dei_ |
| Data Type: |
dei:stateOrProvinceItemType |
| Balance Type: |
na |
| Period Type: |
duration |
|
| X |
- DefinitionA unique 10-digit SEC-issued value to identify entities that have filed disclosures with the SEC. It is commonly abbreviated as CIK. Reference 1: http://www.xbrl.org/2003/role/presentationRef
-Publisher SEC
-Name Exchange Act
-Number 240
-Section 12
-Subsection b-2
| Name: |
dei_EntityCentralIndexKey |
| Namespace Prefix: |
dei_ |
| Data Type: |
dei:centralIndexKeyItemType |
| Balance Type: |
na |
| Period Type: |
duration |
|
| X |
- DefinitionIndicate if registrant meets the emerging growth company criteria. Reference 1: http://www.xbrl.org/2003/role/presentationRef
-Publisher SEC
-Name Exchange Act
-Number 240
-Section 12
-Subsection b-2
| Name: |
dei_EntityEmergingGrowthCompany |
| Namespace Prefix: |
dei_ |
| Data Type: |
xbrli:booleanItemType |
| Balance Type: |
na |
| Period Type: |
duration |
|
| X |
- DefinitionCommission file number. The field allows up to 17 characters. The prefix may contain 1-3 digits, the sequence number may contain 1-8 digits, the optional suffix may contain 1-4 characters, and the fields are separated with a hyphen.
| Name: |
dei_EntityFileNumber |
| Namespace Prefix: |
dei_ |
| Data Type: |
dei:fileNumberItemType |
| Balance Type: |
na |
| Period Type: |
duration |
|
| X |
- DefinitionTwo-character EDGAR code representing the state or country of incorporation.
| Name: |
dei_EntityIncorporationStateCountryCode |
| Namespace Prefix: |
dei_ |
| Data Type: |
dei:edgarStateCountryItemType |
| Balance Type: |
na |
| Period Type: |
duration |
|
| X |
- DefinitionThe exact name of the entity filing the report as specified in its charter, which is required by forms filed with the SEC. Reference 1: http://www.xbrl.org/2003/role/presentationRef
-Publisher SEC
-Name Exchange Act
-Number 240
-Section 12
-Subsection b-2
| Name: |
dei_EntityRegistrantName |
| Namespace Prefix: |
dei_ |
| Data Type: |
xbrli:normalizedStringItemType |
| Balance Type: |
na |
| Period Type: |
duration |
|
| X |
- DefinitionThe Tax Identification Number (TIN), also known as an Employer Identification Number (EIN), is a unique 9-digit value assigned by the IRS. Reference 1: http://www.xbrl.org/2003/role/presentationRef
-Publisher SEC
-Name Exchange Act
-Number 240
-Section 12
-Subsection b-2
| Name: |
dei_EntityTaxIdentificationNumber |
| Namespace Prefix: |
dei_ |
| Data Type: |
dei:employerIdItemType |
| Balance Type: |
na |
| Period Type: |
duration |
|
| X |
- DefinitionLocal phone number for entity.
| Name: |
dei_LocalPhoneNumber |
| Namespace Prefix: |
dei_ |
| Data Type: |
xbrli:normalizedStringItemType |
| Balance Type: |
na |
| Period Type: |
duration |
|
| X |
- DefinitionBoolean flag that is true when the Form 8-K filing is intended to satisfy the filing obligation of the registrant as pre-commencement communications pursuant to Rule 13e-4(c) under the Exchange Act. Reference 1: http://www.xbrl.org/2003/role/presentationRef
-Publisher SEC
-Name Exchange Act
-Number 240
-Section 13e
-Subsection 4c
| Name: |
dei_PreCommencementIssuerTenderOffer |
| Namespace Prefix: |
dei_ |
| Data Type: |
xbrli:booleanItemType |
| Balance Type: |
na |
| Period Type: |
duration |
|
| X |
- DefinitionBoolean flag that is true when the Form 8-K filing is intended to satisfy the filing obligation of the registrant as pre-commencement communications pursuant to Rule 14d-2(b) under the Exchange Act. Reference 1: http://www.xbrl.org/2003/role/presentationRef
-Publisher SEC
-Name Exchange Act
-Number 240
-Section 14d
-Subsection 2b
| Name: |
dei_PreCommencementTenderOffer |
| Namespace Prefix: |
dei_ |
| Data Type: |
xbrli:booleanItemType |
| Balance Type: |
na |
| Period Type: |
duration |
|
| X |
- DefinitionTitle of a 12(b) registered security. Reference 1: http://www.xbrl.org/2003/role/presentationRef
-Publisher SEC
-Name Exchange Act
-Number 240
-Section 12
-Subsection b
| Name: |
dei_Security12bTitle |
| Namespace Prefix: |
dei_ |
| Data Type: |
dei:securityTitleItemType |
| Balance Type: |
na |
| Period Type: |
duration |
|
| X |
- DefinitionName of the Exchange on which a security is registered. Reference 1: http://www.xbrl.org/2003/role/presentationRef
-Publisher SEC
-Name Exchange Act
-Number 240
-Section 12
-Subsection d1-1
| Name: |
dei_SecurityExchangeName |
| Namespace Prefix: |
dei_ |
| Data Type: |
dei:edgarExchangeCodeItemType |
| Balance Type: |
na |
| Period Type: |
duration |
|
| X |
- DefinitionBoolean flag that is true when the Form 8-K filing is intended to satisfy the filing obligation of the registrant as soliciting material pursuant to Rule 14a-12 under the Exchange Act. Reference 1: http://www.xbrl.org/2003/role/presentationRef
-Publisher SEC
-Name Exchange Act
-Section 14a
-Number 240
-Subsection 12
| Name: |
dei_SolicitingMaterial |
| Namespace Prefix: |
dei_ |
| Data Type: |
xbrli:booleanItemType |
| Balance Type: |
na |
| Period Type: |
duration |
|
| X |
- DefinitionTrading symbol of an instrument as listed on an exchange.
| Name: |
dei_TradingSymbol |
| Namespace Prefix: |
dei_ |
| Data Type: |
dei:tradingSymbolItemType |
| Balance Type: |
na |
| Period Type: |
duration |
|
| X |
- DefinitionBoolean flag that is true when the Form 8-K filing is intended to satisfy the filing obligation of the registrant as written communications pursuant to Rule 425 under the Securities Act. Reference 1: http://www.xbrl.org/2003/role/presentationRef
-Publisher SEC
-Name Securities Act
-Number 230
-Section 425
| Name: |
dei_WrittenCommunications |
| Namespace Prefix: |
dei_ |
| Data Type: |
xbrli:booleanItemType |
| Balance Type: |
na |
| Period Type: |
duration |
|
| X |
- Details
| Name: |
us-gaap_StatementClassOfStockAxis=us-gaap_CommonStockMember |
| Namespace Prefix: |
|
| Data Type: |
na |
| Balance Type: |
|
| Period Type: |
|
|
| X |
- Details
| Name: |
us-gaap_StatementClassOfStockAxis=cms_A5.625JuniorSubordinatedNotesDue2078Member |
| Namespace Prefix: |
|
| Data Type: |
na |
| Balance Type: |
|
| Period Type: |
|
|
| X |
- Details
| Name: |
us-gaap_StatementClassOfStockAxis=cms_A5.875JuniorSubordinatedNotesDue2078Member |
| Namespace Prefix: |
|
| Data Type: |
na |
| Balance Type: |
|
| Period Type: |
|
|
| X |
- Details
| Name: |
us-gaap_StatementClassOfStockAxis=cms_A5.875JuniorSubordinatedNotesDue2079Member |
| Namespace Prefix: |
|
| Data Type: |
na |
| Balance Type: |
|
| Period Type: |
|
|
| X |
- Details
| Name: |
us-gaap_StatementClassOfStockAxis=cms_CMSEnergyCorporationDepositaryShareseachrepresentinga11000thinterestinashareof4200percentCumulativeRedeemablePerpetualPreferredStockSeriesCMember |
| Namespace Prefix: |
|
| Data Type: |
na |
| Balance Type: |
|
| Period Type: |
|
|
| X |
- Details
| Name: |
dei_LegalEntityAxis=cms_ConsumersEnergyCompanyMember |
| Namespace Prefix: |
|
| Data Type: |
na |
| Balance Type: |
|
| Period Type: |
|
|
CMS Energy (NYSE:CMS-B)
Historical Stock Chart
From Apr 2024 to May 2024

CMS Energy (NYSE:CMS-B)
Historical Stock Chart
From May 2023 to May 2024
