UNITED STATES
SECURITIES AND EXCHANGE COMMISSION
Washington, D.C. 20549
FORM 10-Q
☒ QUARTERLY REPORT PURSUANT TO SECTION
13 OR 15(d) OF THE SECURITIES EXCHANGE ACT OF 1934
For the quarterly period ended March 31, 2024
001-12934
(Commission file number)
ImmuCell Corporation
(Exact name of registrant as specified in its
charter)
| Delaware | | 01-0382980 |
| (State of Incorporation) | | (I.R.S. Employer Identification No.) |
| 56 Evergreen Drive, Portland, ME | | 04103 |
| (Address of principal executive office) | | (Zip Code) |
(207) 878-2770
(Registrant’s telephone number)
Securities registered pursuant to Section 12(b) of the Exchange Act:
| Title of each
class | | Trading symbol(s) | | Name of each exchange on which registered |
| Common Stock, $0.10 par value per share | | ICCC | | The Nasdaq Capital Market |
Indicate by check mark whether the registrant (1) has filed all reports
required to be filed by Section 13 or 15(d) of the Securities Exchange Act of 1934 during the preceding 12 months (or for such shorter
period that the registrant was required to file such reports), and (2) has been subject to such filing requirements for the past 90 days.
Yes ☒ No ☐
Indicate by check mark whether the registrant has submitted electronically
every Interactive Data File required to be submitted and posted pursuant to Rule 405 of Regulation S-T during the preceding 12 months
(or for such shorter period that the registrant was required to submit such files). Yes ☒ No ☐
Indicate by check mark whether the registrant
is a large accelerated filer, an accelerated filer, a non-accelerated filer, smaller reporting company, or an emerging growth company.
See the definitions of “large accelerated filer,” “accelerated filer,” “smaller reporting company,”
and “emerging growth company” in Rule 12b-2 of the Exchange Act.
| Large accelerated filer | ☐ | Accelerated filer | ☐ |
| Non-accelerated filer | ☒ | Smaller reporting company | ☒ |
| | | Emerging growth company | ☐ |
If an emerging growth company, indicate by check mark if the registrant
has elected not to use the extended transition period for complying with any new or revised financial accounting standards provided pursuant
to Section 13(a) of the Exchange Act. ☐
Indicate by check mark whether the registrant is a shell company (as
defined in Rule 12b-2 of the Exchange Act). Yes ☐ No ☒
The number of shares of the registrant’s common stock outstanding
as of May 3, 2024 was 7,811,874.
ImmuCell Corporation
TABLE OF CONTENTS
March 31, 2024
ImmuCell Corporation
Part 1. FINANCIAL INFORMATION
ITEM 1. UNAUDITED FINANCIAL STATEMENTS
BALANCE SHEETS
(Unaudited)
| | |
As of
March 31,
2024 | | |
As of
December 31,
2023 | |
| | |
| | |
| |
| ASSETS | |
| | |
| |
| CURRENT ASSETS: | |
| | |
| |
| Cash and cash equivalents | |
$ | 960,347 | | |
$ | 978,741 | |
| Trade accounts receivable | |
| 2,622,532 | | |
| 2,185,383 | |
| Inventory | |
| 7,149,563 | | |
| 7,811,841 | |
| Prepaid expenses and other current assets | |
| 615,203 | | |
| 493,885 | |
| Total current assets | |
| 11,347,645 | | |
| 11,469,850 | |
| | |
| | | |
| | |
| Property, plant and equipment, net | |
| 26,982,105 | | |
| 27,575,683 | |
| Operating lease right-of-use asset | |
| 4,546,061 | | |
| 4,571,149 | |
| Goodwill | |
| 95,557 | | |
| 95,557 | |
| Intangible assets, net | |
| 33,432 | | |
| 38,208 | |
| Other assets | |
| 46,248 | | |
| 57,655 | |
| TOTAL ASSETS | |
$ | 43,051,048 | | |
$ | 43,808,102 | |
| | |
| | | |
| | |
| LIABILITIES AND STOCKHOLDERS’ EQUITY | |
| | | |
| | |
| CURRENT LIABILITIES: | |
| | | |
| | |
| Current portion of debt obligations | |
$ | 1,443,791 | | |
$ | 1,428,807 | |
| Current portion of operating lease liability | |
| 597,289 | | |
| 644,276 | |
| Accounts payable and accrued expenses | |
| 2,142,859 | | |
| 2,124,337 | |
| Total current liabilities | |
| 4,183,939 | | |
| 4,197,420 | |
| | |
| | | |
| | |
| LONG-TERM LIABILITIES: | |
| | | |
| | |
| Debt obligations, net of current portion | |
| 10,169,217 | | |
| 10,540,496 | |
| Operating lease liability, net of current portion | |
| 4,061,573 | | |
| 4,077,109 | |
| Total long-term liabilities | |
| 14,230,790 | | |
| 14,617,605 | |
| | |
| | | |
| | |
| TOTAL LIABILITIES | |
| 18,414,729 | | |
| 18,815,025 | |
| | |
| | | |
| | |
| CONTINGENT LIABILITIES AND COMMITMENTS (See Note 11) | |
| | | |
| | |
| | |
| | | |
| | |
| STOCKHOLDER’ EQUITY: | |
| | | |
| | |
| Common stock, $0.10 par value per share, 15,000,000 shares authorized, 7,814,165 shares issued and 7,750,864 shares outstanding as of both March 31, 2024 and December 31, 2023 | |
| 781,417 | | |
| 781,417 | |
| Additional paid-in capital | |
| 36,438,349 | | |
| 36,357,239 | |
| Accumulated deficit | |
| (12,444,965 | ) | |
| (12,007,097 | ) |
| Treasury stock, at cost, 63,301 shares as of both March 31, 2024 and December 31, 2023 | |
| (138,482 | ) | |
| (138,482 | ) |
| TOTAL STOCKHOLDERS’ EQUITY | |
| 24,636,319 | | |
| 24,993,077 | |
| | |
| | | |
| | |
| TOTAL LIABILITIES AND STOCKHOLDERS’ EQUITY | |
$ | 43,051,048 | | |
$ | 43,808,102 | |
The accompanying notes are an integral part of these
unaudited financial statements.
ImmuCell Corporation
STATEMENTS OF OPERATIONS
(Unaudited)
| | |
During
the Three-Month Periods Ended March 31, | |
| | |
2024 | | |
2023 | |
| | |
| | |
| |
| Product sales | |
$ | 7,257,577 | | |
$ | 3,446,527 | |
| Costs of goods sold | |
| 4,962,218 | | |
| 3,145,752 | |
| Gross margin | |
| 2,295,359 | | |
| 300,775 | |
| | |
| | | |
| | |
| Product development expenses | |
| 1,262,550 | | |
| 1,110,368 | |
| Sales and marketing expenses | |
| 800,923 | | |
| 879,427 | |
| Administrative expenses | |
| 531,938 | | |
| 567,019 | |
| Operating expenses | |
| 2,595,411 | | |
| 2,556,814 | |
| | |
| | | |
| | |
| NET OPERATING LOSS | |
| (300,052 | ) | |
| (2,256,039 | ) |
| | |
| | | |
| | |
| Other expenses, net | |
| 136,476 | | |
| 57,489 | |
| | |
| | | |
| | |
| LOSS BEFORE INCOME TAXES | |
| (436,528 | ) | |
| (2,313,528 | ) |
| | |
| | | |
| | |
| Income tax expense | |
| 1,340 | | |
| 1,525 | |
| | |
| | | |
| | |
| NET LOSS | |
$ | (437,868 | ) | |
$ | (2,315,053 | ) |
| | |
| | | |
| | |
| Basic weighted average common shares outstanding | |
| 7,750,864 | | |
| 7,746,864 | |
| Basic net loss per share | |
$ | (0.06 | ) | |
$ | (0.30 | ) |
| Diluted weighted average common shares outstanding | |
| 7,750,864 | | |
| 7,746,864 | |
| Diluted net loss per share | |
$ | (0.06 | ) | |
$ | (0.30 | ) |
The
accompanying notes are an integral part of these unaudited financial statements.
ImmuCell Corporation
STATEMENTS
OF STOCKHOLDERS’ EQUITY
(Unaudited)
| | |
Common Stock | | |
| | |
Treasury Stock | | |
| |
| | |
Shares | | |
Amount | | |
Additional
paid-in
capital | | |
Accumulated
Deficit | | |
Shares | | |
Amount | | |
Total
Stockholders’
Equity | |
| During the Three-Month Period Ended March 31, 2024: | |
| |
| BALANCE, | |
| | |
| | |
| | |
| | |
| | |
| | |
| |
| December 31, 2023 | |
| 7,814,165 | | |
$ | 781,417 | | |
$ | 36,357,239 | | |
$ | (12,007,097 | ) | |
| 63,301 | | |
$ | (138,482 | ) | |
$ | 24,993,077 | |
| Net loss | |
| — | | |
| — | | |
| — | | |
| (437,868 | ) | |
| — | | |
| — | | |
| (437,868 | ) |
| Stock-based compensation | |
| — | | |
| — | | |
| 81,110 | | |
| — | | |
| — | | |
| — | | |
| 81,110 | |
| BALANCE, | |
| | | |
| | | |
| | | |
| | | |
| | | |
| | | |
| | |
| March 31, 2024 | |
| 7,814,165 | | |
$ | 781,417 | | |
$ | 36,438,349 | | |
$ | (12,444,965 | ) | |
| 63,301 | | |
$ | (138,482 | ) | |
$ | 24,636,319 | |
| | |
| | |
| During the Three-Month Period Ended March 31, 2023: | |
| BALANCE, | |
| | | |
| | | |
| | | |
| | | |
| | | |
| | | |
| | |
| December 31, 2022 | |
| 7,814,165 | | |
$ | 781,417 | | |
$ | 35,978,364 | | |
$ | (6,232,499 | ) | |
| 67,301 | | |
$ | (147,233 | ) | |
$ | 30,380,049 | |
| Net loss | |
| — | | |
| — | | |
| — | | |
| (2,315,053 | ) | |
| — | | |
| — | | |
| (2,315,053 | ) |
| Stock-based compensation | |
| — | | |
| — | | |
| 96,116 | | |
| — | | |
| — | | |
| — | | |
| 96,116 | |
| BALANCE, | |
| | | |
| | | |
| | | |
| | | |
| | | |
| | | |
| | |
| March 31, 2023 | |
| 7,814,165 | | |
$ | 781,417 | | |
$ | 36,074,480 | | |
$ | (8,547,552 | ) | |
| 67,301 | | |
$ | (147,233 | ) | |
$ | 28,161,112 | |
The
accompanying notes are an integral part of these unaudited financial statements.
ImmuCell Corporation
STATEMENTS OF CASH FLOWS
(Unaudited)
| | |
During the Three-Month Periods Ended March 31, | |
| | |
2024 | | |
2023 | |
| CASH FLOWS FROM OPERATING ACTIVITIES: | |
| | |
| |
| Net loss | |
$ | (437,868 | ) | |
$ | (2,315,053 | ) |
| Adjustments to reconcile net loss to net cash provided by (used for) operating activities: | |
| | | |
| | |
| Depreciation | |
| 662,477 | | |
| 652,134 | |
| Amortization of intangible assets | |
| 4,776 | | |
| 4,776 | |
| Amortization of debt issuance costs | |
| 5,024 | | |
| 1,919 | |
| Amortization of debt discounts | |
| 5,223 | | |
| — | |
| Stock-based compensation | |
| 81,110 | | |
| 96,116 | |
| Loss on disposal of property, plant and equipment | |
| — | | |
| 8,243 | |
| Non-cash rent (benefit) expense | |
| (37,435 | ) | |
| 8,595 | |
| Changes in: | |
| | | |
| | |
| Trade accounts receivable | |
| (437,149 | ) | |
| (331,699 | ) |
| Inventory | |
| 662,278 | | |
| (289,788 | ) |
| Prepaid expenses and other current assets | |
| (121,318 | ) | |
| (327,569 | ) |
| Other assets | |
| 11,407 | | |
| (11,153 | ) |
| Accounts payable and accrued expenses | |
| 19,980 | | |
| (258,506 | ) |
| Net cash provided by (used for) operating activities | |
| 418,505 | | |
| (2,761,985 | ) |
| | |
| | | |
| | |
| CASH FLOWS FROM INVESTING ACTIVITIES: | |
| | | |
| | |
| Purchase of property, plant and equipment | |
| (70,356 | ) | |
| (682,166 | ) |
| Proceeds from sale of property, plant and equipment | |
| — | | |
| 15 | |
| Net cash used for investing activities | |
| (70,356 | ) | |
| (682,151 | ) |
| | |
| | | |
| | |
| CASH FLOWS FROM FINANCING ACTIVITIES: | |
| | | |
| | |
| Proceeds from line of credit | |
| — | | |
| 1,000,000 | |
| Debt principal repayments | |
| (361,506 | ) | |
| (251,376 | ) |
| Payments of debt issuance costs | |
| (5,037 | ) | |
| — | |
| Net cash (used for) provided by financing activities | |
| (366,543 | ) | |
| 748,624 | |
| | |
| | | |
| | |
| NET DECREASE IN CASH AND CASH EQUIVALENTS | |
| (18,394 | ) | |
| (2,695,512 | ) |
| | |
| | | |
| | |
| BEGINNING CASH AND CASH EQUIVALENTS | |
| 978,741 | | |
| 5,791,562 | |
| | |
| | | |
| | |
| ENDING CASH AND CASH EQUIVALENTS | |
$ | 960,347 | | |
$ | 3,096,050 | |
The accompanying notes
are an integral part of these unaudited financial statements.
ImmuCell Corporation
STATEMENTS OF CASH FLOWS
SUPPLEMENTAL DISCLOSURES
OF CASH FLOW INFORMATION
(Unaudited)
| | |
During the Three-Month Periods Ended March 31, | |
| | |
2024 | | |
2023 | |
| CASH PAID FOR: | |
| | |
| |
| Income taxes | |
$ | — | | |
$ | 7,205 | |
| Interest expense | |
$ | 136,457 | | |
$ | 88,043 | |
| | |
| | | |
| | |
| NON-CASH ACTIVITIES: | |
| | | |
| | |
| Decrease in capital expenditures included in accounts payable and accrued expenses | |
$ | 1,458 | | |
$ | 2,621 | |
The accompanying notes
are an integral part of these unaudited financial statements.
ImmuCell Corporation
Notes to Unaudited Financial Statements
1. BUSINESS OPERATIONS
ImmuCell Corporation (the “Company”,
“we”, “us”, “our”) was originally incorporated in Maine in 1982 and reincorporated in Delaware in
1987, in conjunction with an initial public offering of common stock. We are an animal health company whose purpose is to create scientifically
proven and practical products that improve the health and productivity of dairy and beef cattle. As disclosed in Note 17, “Segment
Information”, one of our business segments is dedicated to Scours and the other is focused on Mastitis. We manufacture and market
the First Defense® product line, providing Immediate Immunity™ to prevent scours in newborn dairy and
beef calves. We have expanded this line into four different products with formulations targeting E. coli, coronavirus and rotavirus
pathogens. We are also in the late stages of developing Re-Tain®, a treatment for lactating dairy cows with subclinical
mastitis. Mastitis is the most significant cause of economic loss to the dairy industry. These products help reduce the need to use traditional
antibiotics in food producing animals. We are subject to certain risks including dependence on key individuals and third-party providers
of critical goods and services, competition from other larger companies, the successful sale of existing products and the development
of new viable products with appropriate regulatory approvals, where applicable. A combination of the conditions, trends and concerns related
to or arising from inflation, rising interest rates and potential recessionary conditions in the United States and/or internationally,
could have a corresponding negative effect on our business and operations. We are experiencing price increases in key components, supportive
services, transportation and other supplies that are causing our costs of goods sold to increase. We have historically experienced some
contamination events in our production process, as disclosed previously. We implemented a production slowdown to remediate this problem,
which led to the recognition of lower sales and gross margin during the first ten months of 2023.
2. SUMMARY OF SIGNIFICANT ACCOUNTING POLICIES
(a) Basis of Presentation
We have prepared the accompanying unaudited financial
statements reflecting all adjustments (which are of a normal recurring nature) that are, in our opinion, necessary in order to ensure
that the financial statements are not misleading. We follow accounting standards set by the Financial Accounting Standards Board (FASB).
The FASB sets Generally Accepted Accounting Principles (GAAP) that we follow to ensure we accurately report our financial condition, results
of operations, earnings per share and cash flows. References to GAAP in these footnotes are to the FASB Accounting Standards Codification™
(Codification). We believe that the disclosures are adequate to ensure that the information presented is not misleading.
(b) Cash and Cash Equivalents
We consider all highly liquid investment instruments
that mature within three months of their purchase dates to be cash equivalents. Cash equivalents are principally invested in securities
backed by the U.S. government. We hold no cash or cash equivalents in excess of Federal Deposit Insurance Corporation (FDIC) limits of
$250,000 per financial institution per depositor. See Note 3.
(c) Trade Accounts Receivable
Accounts receivable are carried at the original
invoice amount less an estimate made for doubtful collection when applicable. Management determines the allowance for doubtful accounts
on a monthly basis by identifying troubled accounts and by using historical experience applied to an aging of accounts and other relevant
factors. Accounts receivable are considered to be past due if a portion of the receivable balance is outstanding for more than 30 days.
Past due accounts receivable are subject to an interest charge. It was not necessary to charge interest on past due accounts during the
three-month periods ended March 31, 2024 or 2023 because the time past due was not significant, and there was no accrual for such interest
charges as of March 31, 2024 or December 31, 2023. Accounts receivable are written off when deemed uncollectible. No accounts receivable
were written off during the three-month periods ended March 31, 2024 or 2023. Recoveries of accounts receivable previously written off
are recorded as income when received. No such recoveries were recorded during the three-month periods ended March 31, 2024 or 2023. As
of March 31, 2024 and December 31, 2023, we determined that no allowance for doubtful accounts was necessary. See Note 4.
(d) Inventory
Inventory includes raw materials, work-in-process
and finished goods and is recorded at the lower of cost, on the first-in, first-out method, or net realizable value (determined as the
estimated selling price in the normal course of business, less reasonably predictable costs of completion, disposal and transportation).
Work-in-process and finished goods inventories include materials, labor and manufacturing overhead. At each balance sheet date, we evaluate
our ending inventories for excess quantities and obsolescence. Inventories that we consider excess or obsolete are written down to estimated
net realizable value. Once inventory is written down and a new cost basis is established, it is not written back up. We believe that supplies
and raw materials for the production of our products are available from more than one vendor or farm. Our policy is to maintain more than
one source of supply for the components used in our products when feasible. See Note 5.
ImmuCell Corporation
Notes to Unaudited Financial
Statements (continued)
(e) Property, Plant and Equipment, net
We depreciate property, plant and equipment on the
straight-line method by charges to operations and costs of goods sold in amounts estimated to expense the cost of the assets from the
date they are first put into service to the end of the estimated useful lives of the assets. The facility we have constructed at 33 Caddie
Lane to produce the Nisin Drug Substance (DS) for Re-Tain® (Building 33) is being depreciated over 39 years
from when a Certificate of Occupancy was issued during the fourth quarter of 2017. We began depreciating the equipment for our Nisin DS
facility when it was placed in service during the third quarter of 2018. Approximately 87% of these assets are being depreciated over
10 years. We began depreciating the leasehold improvements to our new First Defense® production facility at 175
Industrial Way (Building 175A) over the remainder of the 10-year lease term beginning when a Certificate of Occupancy was issued
during the second quarter of 2020. During August of 2022, this lease term was extended to January of 2043 in connection with a new lease
covering additional space at 175 Industrial Way (Building 175B). As a result, the net book value of these leasehold improvements
as of August 31, 2022 is now being depreciated over the remainder of the extended lease term. Significant repairs to property, plant and
equipment that benefit more than a current period are capitalized and depreciated over their useful lives. Insignificant repairs are expensed
when incurred. See Notes 2(h) and 7 for additional information.
(f) Operating Leases
We account for our real estate leases using a right-of-use
model, which recognizes that at the date of commencement, a lessee has a financial obligation to make lease payments to the lessor for
the right to use the underlying asset during the lease term and recognizes a corresponding right-of-use (ROU) asset related to this right.
ROU assets and lease liabilities are recognized at the lease commencement date based on the present value of the future lease payments
over the expected lease term. The ROU asset is also adjusted for any lease prepayments made, lease incentives received and initial direct
costs incurred. For operating leases with lease payments that fluctuate over the lease term, the total lease costs are recognized on a
straight-line basis over the lease term. Our leases, at times, may include options to extend the term of the lease. When it is reasonably
certain that we will exercise the option, we include the impact of the option in the lease term for purposes of determining future lease
payments. For all underlying classes of assets, we made an accounting policy election to not recognize assets or liabilities for leases
with a term of twelve months or less and to account for all components in a lease arrangement as a single combined lease component. Short-term
lease payments are recognized on a straight-line basis. Certain of our lease agreements include variable rent payments, consisting primarily
of amounts paid to the lessor based on cost or consumption, such as maintenance and real estate taxes. These costs are recognized in the
period in which the obligation is incurred. Because our leases do not specify an implicit rate, we use an incremental borrowing rate based
on information available at the lease commencement date to determine the present value of the lease payments. We evaluate our ROU asset
for impairment when events or changes in circumstances indicate that the carrying value of the asset may not be recoverable. See Notes
2(h) and 12 for additional information.
(g) Intangible Assets and Goodwill
We amortize intangible assets on the straight-line
method by charges to costs of goods sold in amounts estimated to expense the cost of the assets from the date they are first put into
service to the end of the estimated useful lives of the assets. We have recorded intangible assets related to customer relationships,
non-compete agreements and developed technology, each with defined useful lives. Amounts paid in excess of the fair value of the net assets
(including tax attributes) are recorded as goodwill under the acquisition method of accounting. We assess the impairment of intangible
assets that have indefinite lives (when applicable) and goodwill (at the reporting unit level) on an annual basis (as of December 31st)
and whenever events or changes in circumstances indicate that the carrying value of the asset may not be recoverable. We would record
an impairment charge if such an assessment were to indicate that the fair value of such assets was less than the carrying value. Judgment
is required in determining whether an event has occurred that may impair the value of goodwill or identifiable intangible assets. Factors
that could indicate that an impairment may exist include significant under-performance relative to plan or long-term projections, significant
changes in business strategy and significant negative industry or economic trends. Although we believe intangible assets and goodwill
are properly stated in the accompanying financial statements, changes in strategy or market conditions could significantly impact these
judgments and require an adjustment to the recorded balance in the future. No goodwill impairments were recorded during the three-month
periods ended March 31, 2024 or 2023. See Notes 2(h) and 8 for additional information.
(h) Valuation of Long-Lived Assets
We periodically evaluate our long-lived assets,
consisting principally of property, plant and equipment, operating lease right-of-use asset and amortizable intangible assets, for potential
impairment. In accordance with the applicable accounting guidance for the treatment of long-lived assets, we review the carrying value
of our long-lived assets or asset group that is held and used, including intangible assets subject to amortization, for impairment whenever
events and circumstances indicate that the carrying value of the assets may not be recoverable. Under the held for use approach, the asset
or asset group to be tested for impairment should represent the lowest level for which identifiable cash flows are largely independent
of the cash flows of other groups of assets and liabilities. No impairment was recognized during the three-month periods ended March 31,
2024 or 2023.
ImmuCell Corporation
Notes to Unaudited Financial
Statements (continued)
(i) Fair Value Measurements
In determining fair value measurements,
we follow the provisions of Codification Topic 820, Fair Value Measurements and Disclosures. Codification Topic 820 defines fair
value, establishes a framework for measuring fair value under GAAP and enhances disclosures about fair value measurements. The topic provides
a consistent definition of fair value which focuses on an exit price, which is the price that would be received to sell an asset or paid
to transfer a liability in an orderly transaction between market participants at the measurement date. The topic also prioritizes, within
the measurement of fair value, the use of market-based information over entity-specific information and establishes a three-level hierarchy
for fair value measurements based on the nature of inputs used in the valuation of an asset or liability as of the measurement date. As
of March 31, 2024 and December 31, 2023, the carrying amounts of cash and cash equivalents, accounts receivable, inventory, prepaid expenses
and other current assets, other assets, accounts payable and accrued expenses approximate fair value because of their short-term nature.
The amount outstanding under our bank debt facilities is measured at carrying value in our accompanying balance sheets. Our bank debt
facilities are valued using Level 2 inputs. The three-level hierarchy is as follows:
| Level 1 — | Pricing inputs are quoted prices available in active
markets for identical assets or liabilities as of the measurement date. |
| Level 2 — | Pricing inputs are quoted prices for similar assets
or liabilities, or inputs that are observable, either directly or indirectly, for substantially the full term through corroboration with
observable market data. |
| Level 3 — | Pricing inputs are unobservable for the assets
or liabilities, that is, inputs that reflect the reporting entity’s own assumptions about the assumptions market participants would
use in pricing the asset or liability. |
In certain cases, the inputs used to measure fair
value may fall into different levels of the fair value hierarchy. In such cases, the level of an asset or liability within the fair value
hierarchy is based on the lowest level of input that is significant to the fair value measurement. Our assessment of the significance
of a particular input to the fair value measurement in its entirety requires judgment and considers factors specific to the investment.
We also hold money market accounts in our bank account, which are classified as cash equivalents and measured at fair value. The fair
value of these investments is based on their closing published net asset value.
We assess the levels of the investments at each
measurement date, and transfers between levels are recognized on the actual date of the event or change in circumstances that caused the
transfer in accordance with our accounting policy regarding the recognition of transfers between levels of the fair value hierarchy. During
the three-month periods ended March 31, 2024 and 2023, there were no transfers between levels. As of March 31, 2024 and December 31, 2023,
our Level 1 assets measured at fair value by quoted prices in active markets consisted of cash and money market accounts. There were no
assets or liabilities measured at fair value on a nonrecurring basis as of March 31, 2024 or December 31, 2023. The carrying values of
our cash and money market accounts as of March 31, 2024 or December 31, 2023 approximated their fair market values. Due to inflation and
the changing interest rate environment, the carrying values of our fixed rate bank debt as of March 31, 2024 and December 31, 2023 differed
from their fair market values. These values are reflected in the following tables:
| | |
As of March 31, 2024 | |
| | |
Level 1 | | |
Level 2 | | |
Level 3 | | |
Total | |
| Assets: | |
| | |
| | |
| | |
| |
| Cash and money market accounts | |
$ | 960,347 | | |
$ | — | | |
$ | — | | |
$ | 960,347 | |
| | |
| | | |
| | | |
| | | |
| | |
| Liabilities: | |
| | | |
| | | |
| | | |
| | |
| Bank debt | |
$ | — | | |
$ | 10,103,718 | | |
$ | — | | |
$ | 10,103,718 | |
ImmuCell Corporation
Notes to Unaudited Financial
Statements (continued)
| | |
As of December 31, 2023 | |
| | |
Level 1 | | |
Level 2 | | |
Level 3 | | |
Total | |
| Assets: | |
| | |
| | |
| | |
| |
| Cash and money market accounts | |
$ | 978,741 | | |
$ | — | | |
$ | — | | |
$ | 978,741 | |
| | |
| | | |
| | | |
| | | |
| | |
| Liabilities: | |
| | | |
| | | |
| | | |
| | |
| Bank debt | |
$ | — | | |
$ | 10,431,817 | | |
$ | — | | |
$ | 10,431,817 | |
(j) Concentration of Risk
Concentration of credit risk with respect to
accounts receivable is principally limited to certain customers to whom we make substantial sales. To reduce risk, we routinely assess
the financial strength of our customers and, as a consequence, believe that our accounts receivable credit risk exposure is limited. We
maintain an allowance for potential credit losses when deemed necessary, but historically we have not experienced significant credit losses
related to an individual customer or groups of customers in any particular industry or geographic area. Sales to significant customers
that amounted to 10% or more of total product sales are detailed in the following table:
| | |
During the Three-Month Periods Ended March 31, | |
| | |
2024 | | |
2023 | |
| Company A | |
| 46 | % | |
| 46 | % |
| Company B | |
| 34 | % | |
| 31 | % |
Trade accounts receivable due from significant
customers that amounted to 10% or more of our total trade accounts receivable are detailed in the following table:
| | |
As of
March 31,
2024 | | |
As of
December 31,
2023 | |
| Company A | |
| 43 | % | |
| 43 | % |
| Company B | |
| 33 | % | |
| 36 | % |
(k) Revenue Recognition
We recognize revenue in accordance with Codification
Topic 606, Revenue from Contracts with Customers (ASC 606). ASC 606 is a single comprehensive model for companies to use in accounting
for revenue arising from contracts with customers. The core principle is that we recognize the amount of revenue to which we expect to
be entitled for the transfer of promised goods or services to customers when a customer obtains control of promised goods or services
in an amount that reflects the consideration we expect to receive in exchange for those goods or services. In addition, the standard requires
disclosure of the nature, amount, timing and uncertainty of revenue and cash flows arising from contracts with customers. We conduct our
business with customers through valid purchase orders or sales orders which are considered contracts and are not interdependent on one
another. A performance obligation is a promise in a contract to transfer a distinct product to the customer. The transaction price is
the amount of consideration we expect to receive under the arrangement. Revenue is measured based on consideration specified in a contract
with a customer. The transaction price of a contract is allocated to each distinct performance obligation and recognized when or as the
customer receives the benefit of the performance obligation. Product transaction prices on a purchase or sales order are discrete and
stand-alone. We recognize revenue when we satisfy a performance obligation in a contract by transferring control over a product to a customer
when product ships to a customer. Amounts due are typically paid approximately 30 days from the time control is transferred. Shipping
and handling costs associated with outbound freight are accounted for as a fulfillment cost in costs of goods sold. We do not bill for
or collect sales tax because our sales are generally made to distributors and thus our sales to them are not subject to sales tax. We
generally have experienced an immaterial amount of product returns. See Note 14 for additional information.
(l) Expense Recognition
We do not incur costs in connection with product
sales to customers that are eligible for capitalization. Advertising costs are expensed when incurred, which is generally during the month
in which the advertisement is published. All product development expenses are expensed as incurred, as are all related patent costs. We
capitalize costs to produce inventory during the production cycle, and these costs are charged to costs of goods sold when the inventory
is sold to a customer or is deemed to be in excess or obsolete.
ImmuCell Corporation
Notes to Unaudited Financial
Statements (continued)
(m) Income Taxes
We account for income taxes in accordance with
Codification Topic 740, Income Taxes, which requires that we recognize a current tax liability or asset for current taxes payable
or refundable and a deferred tax liability or asset for the estimated future tax effects of temporary differences and carryforwards to
the extent they are realizable. We consider future taxable income and feasible tax planning strategies in assessing the need for a valuation
allowance against our deferred tax assets at the end of each quarter. If we determine that it is more likely than not that we will realize
our deferred tax assets in the future in excess of the net recorded amount over a reasonably short period of time, a reduction of the
valuation allowance would increase income in the period such determination was made. Likewise, if we determine that it is more likely
than not that we will not realize all or part of our net deferred tax asset in the future, an increase to the valuation allowance would
be charged to income in the period such determination was made.
Codification Topic 740-10 clarifies the accounting
for income taxes by prescribing a minimum recognition threshold that a tax position must meet before being recognized in the financial
statements. In the ordinary course of business, there are transactions and calculations where the ultimate tax outcome is uncertain. In
addition, we are subject to periodic audits and examinations by the Internal Revenue Service and other taxing authorities. With few exceptions,
we are no longer subject to income tax examinations by tax authorities for years before 2021. We have evaluated the positions taken on
our filed tax returns and have concluded that no uncertain tax positions existed as of March 31, 2024 or December 31, 2023. Although we
believe that our estimates are reasonable, actual results could differ from these estimates. See Note 16.
(n) Stock-Based Compensation
We account for stock-based compensation in accordance
with Codification Topic 718, Compensation-Stock Compensation, which generally requires us to recognize non-cash compensation expense
for stock-based payments using the fair-value-based method. The fair value of each stock option grant has been estimated on the date of
grant using the Black-Scholes option pricing model. Accordingly, we recorded compensation expense pertaining to stock-based compensation
of $81,110 and $96,116 during the three-month periods ended March 31, 2024 and 2023, respectively. See Note 13.
(o) Net Loss Per Common Share
Net loss per common share has been computed in
accordance with Codification Topic 260-10, Earnings Per Share. The net loss per share has been computed by dividing the net loss
by the weighted average number of common shares outstanding during the period. All stock options have been excluded from the denominator
in the calculation of dilutive earnings per share when we are in a loss position because their inclusion would be anti-dilutive. Outstanding
stock options that were not included in this calculation because the effect would be anti-dilutive amounted to 599,500 and 626,000 during
the three-month periods ended March 31, 2024 and 2023, respectively.
| |
|
During the Three-Month Periods Ended March 31, |
|
| |
|
2024 |
|
|
2023 |
|
| Net loss attributable to stockholders |
|
$ |
(437,868 |
) |
|
$ |
(2,315,053 |
) |
| |
|
|
|
|
|
|
|
|
| Weighted average common shares outstanding - Basic |
|
|
7,750,864 |
|
|
|
7,746,864 |
|
| Dilutive impact of share-based compensation awards |
|
|
— |
|
|
|
— |
|
| Weighted average common shares outstanding - Diluted |
|
|
7,750,864 |
|
|
|
7,746,864 |
|
| |
|
|
|
|
|
|
|
|
| Net loss per share: |
|
|
|
|
|
|
|
|
| Basic |
|
$ |
(0.06 |
) |
|
$ |
(0.30 |
) |
| Diluted |
|
$ |
(0.06 |
) |
|
$ |
(0.30 |
) |
(p) Use of Estimates
The preparation of financial statements in conformity
with GAAP requires management to make estimates and assumptions that affect the reported amounts of assets and liabilities and disclosure
of contingent assets and liabilities at the date of the financial statements and the reported amounts of revenues and expenses during
the period. Although we regularly assess these estimates, actual amounts could differ from those estimates and are subject to change in
the near term. Changes in estimates are recorded during the period in which they become known. Significant estimates include our valuation
of inventory, deferred tax assets and costs of goods sold.
ImmuCell Corporation
Notes to Unaudited Financial
Statements (continued)
(q) New Accounting Pronouncements Not Yet Adopted
In November 2023, the FASB issued ASU 2023-07,
Segment Reporting (Topic 280): Improvements to Reportable Segment Disclosures, which is intended to improve reportable segment
disclosure requirements, primarily through enhanced disclosures about significant expenses. The amendments will require disclosure of
significant segment expenses that are regularly provided to our chief operating decision-maker and included within segment profit and
loss. The amendments are effective for annual periods beginning after December 15, 2023, and interim periods beginning after December
15, 2024, with early adoption permitted, and will be applied retrospectively to all prior periods presented in the financial statements.
We are currently evaluating ASU 2023-07 to determine its impact on our financial statements.
In December 2023, the FASB issued ASU 2023-09,
Income Taxes (Topic 740): Improvements to Income Tax Disclosures, which includes amendments that further enhance income tax disclosures,
primarily through standardization and disaggregation of income tax rate reconciliation categories and income taxes paid by jurisdiction.
The amendments are effective for annual periods beginning after December 15, 2024, with early adoption permitted, and may be applied either
prospectively or retrospectively. We are currently evaluating ASU 2023-09 to determine its impact on our financial statements.
3. CASH AND CASH EQUIVALENTS
Cash and cash equivalents amounted to $960,347
and $978,741 as of March 31, 2024 and December 31, 2023, respectively.
4. TRADE ACCOUNTS RECEIVABLE
Trade accounts receivable amounted to $2,622,532
and $2,185,383 as of March 31, 2024 and December 31, 2023, respectively. No allowance for bad debt or product returns was recorded as
of March 31, 2024 or December 31, 2023. We anticipate no future events or conditions that would impact our ability to collect our accounts
receivable. Because of the generally short duration from the balance sheet date to the date of collection, our collection rate is not
expected to be significantly impacted by events occurring after the balance sheet date. The trade accounts receivable balances included
$25,646 and $42,507 due from a related party as of March 31, 2024 and December 31, 2023, respectively. See Note 18.
5. INVENTORY
Inventory consisted of the following:
| | |
As of
March 31,
2024 | | |
As of
December 31,
2023 | |
| Raw materials | |
$ | 1,274,263 | | |
$ | 1,594,028 | |
| Work-in-process | |
| 5,506,297 | | |
| 5,815,194 | |
| Finished goods | |
| 369,003 | | |
| 402,619 | |
| Total | |
$ | 7,149,563 | | |
$ | 7,811,841 | |
These inventory
figures are net of write-offs of scrapped inventory in the amounts of $116,778 and $236,456 during the three-month periods ended March
31, 2024 and 2023, respectively, that resulted principally from contamination events and other production process losses.
6. PREPAID EXPENSES AND OTHER CURRENT ASSETS
Prepaid expenses and other current assets consisted
of the following:
| | |
As of
March 31,
2024 | | |
As of
December 31,
2023 | |
| Prepaid expenses | |
$ | 426,096 | | |
$ | 454,152 | |
| Deferred equity financing fees | |
| 136,477 | | |
| — | |
| Other receivables | |
| 52,630 | | |
| 39,733 | |
| Total | |
$ | 615,203 | | |
$ | 493,885 | |
ImmuCell Corporation
Notes to Unaudited Financial
Statements (continued)
7. PROPERTY, PLANT AND EQUIPMENT, net
Property, plant and equipment consisted of the
following:
| | |
Estimated
Useful Lives
(in years) | |
As of
March 31,
2024 | | |
As of
December 31,
2023 | |
| Laboratory and manufacturing equipment | |
3-10 | |
$ | 21,140,410 | | |
$ | 20,953,601 | |
| Buildings and improvements | |
10-39 | |
| 20,784,565 | | |
| 20,784,565 | |
| Office furniture and equipment | |
3-10 | |
| 1,036,374 | | |
| 1,036,374 | |
| Construction in progress | |
n/a | |
| 2,650,313 | | |
| 2,768,224 | |
| Land | |
n/a | |
| 516,867 | | |
| 516,867 | |
| Property, plant and equipment, gross | |
| |
| 46,128,529 | | |
| 46,059,631 | |
| Accumulated depreciation | |
| |
| (19,146,424 | ) | |
| (18,483,948 | ) |
| Property, plant and equipment, net | |
| |
$ | 26,982,105 | | |
$ | 27,575,683 | |
As of March 31, 2024 and December 31, 2023, construction
in progress consisted principally of payments toward the First Defense® production capacity expansion project and
equipment needed to bring the formulation and aseptic filling for Re-Tain® in-house. Property, plant and equipment
disposals were $0 and $42,259 during the three-month periods ended March 31, 2024 and 2023, respectively. Depreciation expense was $662,477
and $652,134 during the three-month periods ended March 31, 2024 and 2023, respectively.
8. INTANGIBLE ASSETS
Intangible assets of $191,040 were valued using
the relief from royalty method and are being amortized to costs of goods sold over their useful lives, which are estimated to be 10 years.
Intangible amortization expense was $4,776 during both of the three-month periods ended March 31, 2024 and 2023. The net value of these
intangibles was $33,432 and $38,208 as of March 31, 2024 and December 31, 2023, respectively. Intangible asset amortization expense is
estimated to be $19,104 per year through December 31, 2025.
Intangible assets as of March 31, 2024 consisted
of the following:
| | |
Gross
Carrying Value | | |
Accumulated
Amortization | | |
Net Book
Value | |
| Developed technology | |
$ | 184,100 | | |
$ | (151,883 | ) | |
$ | 32,217 | |
| Customer relationships | |
| 1,300 | | |
| (1,072 | ) | |
| 228 | |
| Non-compete agreements | |
| 5,640 | | |
| (4,653 | ) | |
| 987 | |
| Total | |
$ | 191,040 | | |
$ | (157,608 | ) | |
$ | 33,432 | |
Intangible assets as of December 31, 2023 consisted
of the following:
| | |
Gross
Carrying Value | | |
Accumulated
Amortization | | |
Net Book
Value | |
| Developed technology | |
$ | 184,100 | | |
$ | (147,280 | ) | |
$ | 36,820 | |
| Customer relationships | |
| 1,300 | | |
| (1,040 | ) | |
| 260 | |
| Non-compete agreements | |
| 5,640 | | |
| (4,512 | ) | |
| 1,128 | |
| Total | |
$ | 191,040 | | |
$ | (152,832 | ) | |
$ | 38,208 | |
9. ACCOUNTS PAYABLE AND ACCRUED EXPENSES
Accounts payable and accrued expenses consisted
of the following:
| | |
As of
March 31,
2024 | | |
As of
December 31,
2023 | |
| Accounts payable – trade | |
$ | 725,616 | | |
$ | 874,558 | |
| Accounts payable – capital | |
| 11,717 | | |
| 13,175 | |
| Accrued payroll | |
| 879,073 | | |
| 942,999 | |
| Accrued professional fees | |
| 193,714 | | |
| 97,800 | |
| Accrued other | |
| 328,348 | | |
| 192,754 | |
| Income tax payable | |
| 4,391 | | |
| 3,051 | |
| Total | |
$ | 2,142,859 | | |
$ | 2,124,337 | |
ImmuCell Corporation
Notes to Unaudited Financial
Statements (continued)
10. BANK DEBT
Loans #1 and #2: During the first quarter
of 2020, we closed on a debt financing with Gorham Savings Bank (GSB) aggregating $8,600,000, which was comprised of a $5,100,000 mortgage
note (Loan #1) that bears interest at a fixed rate of 3.50% per annum (with a 10-year term and 25-year amortization schedule and a balloon
principal payment of $3,145,888 due during the first quarter of 2030) and a $3,500,000 note (Loan #2) that bears interest at a fixed rate
of 3.50% per annum (with a 7-year term and amortization schedule). The proceeds from the 2020 debt refinancing were used to repay all
bank debt outstanding at the time of closing and to provide some additional working capital. During the first quarter of 2022, we closed
on an additional $2,000,000 in mortgage debt, which bears interest at the fixed rate of 3.58% per annum. This was accomplished through
an amendment of the original mortgage note (Loan #1) that increased the then outstanding principal balance from $4,233,957 to $6,233,957
bearing interest at the blended fixed rate of 3.53% per annum. This increased the balloon payment from $3,145,888 to $3,687,511 and extended
the due date of the balloon payment from the first quarter of 2030 to the first quarter of 2032.
Line of Credit (LOC): Also during the first
quarter of 2020, GSB extended a $1,000,000 LOC to us that is available, as needed, through September 11, 2025. Interest on borrowings
against the LOC is variable at the National Prime Rate per annum. There was no outstanding balance under this LOC as of March 31, 2024
or December 31, 2023.
Loan #3: During the second quarter of 2020,
we received a loan from the Maine Technology Institute (MTI) in the aggregate principal amount of $500,000. The first 2.25 years of this
loan were interest-free with no interest accrual or required principal payments. Beginning during the fourth quarter of 2022, Loan #3
became subject to quarterly principal and interest payments at a fixed rate of 5% per annum over the final five years of the loan, through
the third quarter of 2027 if not repaid before then.
Loan #4: During the fourth quarter of 2020,
we closed on a $1,500,000 note with GSB that bears interest at a fixed rate of 3.50% per annum (with a 7-year term and amortization schedule).
Proceeds of $624,167 were used to prepay a portion of the outstanding principal on our mortgage note (Loan #1), which reduced the outstanding
balance to 80% of the most recent appraised value of the property securing the debt, which allowed GSB to release the $1,400,000 that
had been held in escrow. The remaining proceeds were available for general working capital purposes.
Loan #5: On June 30, 2021, we executed definitive
agreements covering a second loan from the MTI in the aggregate principal amount of $400,000, proceeds from which were received in July
of 2021. The first two years of this loan were interest-free with no interest accrual or required principal payments. Principal and interest
payments at a fixed rate of 5% per annum are due quarterly over the final 5.5 years of the loan, beginning during the third quarter of
2023 and continuing through the fourth quarter of 2028 if not repaid before then.
Loan #6: During the third quarter of 2023,
we closed on a $2,000,000 term loan bearing interest at a fixed rate of 7% per annum from GSB. The Finance Authority of Maine (FAME) provided
$1,000,000 of loan insurance to GSB. This loan is repayable under a 7-year amortization schedule with a balloon payment of $1,285,060
due during the third quarter of 2026.
Loan #7: Also during the third quarter of
2023, we closed on a $1,000,000 term loan bearing interest at a fixed rate of 8% per annum from FAME. The loan is repayable under a 7-year
amortization schedule with a balloon payment of $649,238 due during the third quarter of 2026.
Loans #1, #2, #4, #6 and #7 are secured by liens
on substantially all of our assets and are subject to certain restrictions and financial covenants. Loan #7 is subordinated to Loans #1,
#2, #4 and #6. Reflecting our poor financial performance during 2023, the debt covenant requirements for the twelve-month periods ended
December 31, 2023 and June 30, 2024 were waived pre-emptively by our lenders. We are required to meet a minimum debt service coverage
(DSC) ratio of 1.35 for the twelve-month period ending September 30, 2024 and then annually after that beginning with the year ending
December 31, 2024. In connection with these credit facilities, we incurred aggregate debt issuance and debt discount costs of $173,305
($5,037 and $0 of which was incurred during the three-month periods ended March 31, 2024 and 2023, respectively). The amortization of
these debt issuance and debt discount costs is being recorded as a component of interest expense, included in other expenses, net, and
is being amortized on a straight-line basis over the underlying terms of the notes. Loans #3 and #5 are unsecured and subordinated to
our indebtedness to GSB and FAME. Failure to make timely payments of principal and interest, or otherwise to comply with the terms of
the agreements of Loans #3 and #5, would entitle the MTI to accelerate the maturity of such debt and demand repayment in full. These loans
may be prepaid without penalty at any time.
ImmuCell Corporation
Notes to Unaudited Financial
Statements (continued)
Debt proceeds received and principal repayments
made (excluding our $1,000,000 line of credit) during the three-month periods ended March 31, 2024 and 2023 are reflected in the following
table by period and by loan:
| | |
During the Three-Month Period Ended March 31, 2024 | | |
During the Three-Month Period Ended March 31 2023 | |
| | |
Proceeds from Debt Issuance | | |
Debt Principal Repayments | | |
Proceeds from Debt Issuance | | |
Debt Principal Repayments | |
| Loan #1 | |
$ | — | | |
$ | 57,198 | | |
$ | — | | |
$ | 55,793 | |
| Loan #2 | |
| — | | |
| 126,408 | | |
| — | | |
| 122,229 | |
| Loan #3 | |
| — | | |
| 23,580 | | |
| — | | |
| 22,437 | |
| Loan #4 | |
| — | | |
| 52,641 | | |
| — | | |
| 50,917 | |
| Loan #5 | |
| — | | |
| 16,309 | | |
| — | | |
| — | |
| Loan #6 | |
| — | | |
| 57,470 | | |
| — | | |
| — | |
| Loan #7 | |
| — | | |
| 27,900 | | |
| — | | |
| — | |
| Total | |
$ | — | | |
$ | 361,506 | | |
$ | — | | |
$ | 251,376 | |
Debt proceeds received and principal repayments
made (excluding our $1,000,000 line of credit) during the years ended December 31, 2023 and 2022 are reflected in the following table
by period and by loan:
| | |
During the Year Ended December 31, 2023 | | |
During the Year Ended December 31 2022 | |
| | |
Proceeds from Debt Issuance | | |
Debt Principal Repayments | | |
Proceeds from Debt Issuance | | |
Debt Principal Repayments | |
| Loan #1 | |
$ | — | | |
$ | 223,222 | | |
$ | 2,000,000 | | |
$ | 199,013 | |
| Loan #2 | |
| — | | |
| 494,455 | | |
| — | | |
| 477,237 | |
| Loan #3 | |
| — | | |
| 91,446 | | |
| — | | |
| 22,160 | |
| Loan #4 | |
| — | | |
| 205,884 | | |
| — | | |
| 198,715 | |
| Loan #5 | |
| — | | |
| 32,017 | | |
| — | | |
| — | |
| Loan #6 | |
| 2,000,000 | | |
| 93,054 | | |
| — | | |
| — | |
| Loan #7 | |
| 1,000,000 | | |
| 45,696 | | |
| — | | |
| — | |
| Total | |
$ | 3,000,000 | | |
$ | 1,185,774 | | |
$ | 2,000,000 | | |
$ | 897,125 | |
Principal payments (net of debt issuance and
debt discount costs) due under bank loans outstanding as of March 31, 2024 (excluding our $1,000,000 line of credit) are reflected in
the following table by the year that payments are due:
| | |
During the
Nine-Month
Period Ending
December 31, | | |
During the Years Ending December 31, | | |
| | |
| |
| | |
2024 | | |
2025 | | |
2026 | | |
2027 | | |
2028 | | |
Thereafter | | |
Total | |
| Loan #1 | |
$ | 173,650 | | |
$ | 239,876 | | |
$ | 248,604 | | |
$ | 257,649 | | |
$ | 266,537 | | |
$ | 4,598,391 | | |
$ | 5,784,707 | |
| Loan #2 | |
| 385,703 | | |
| 530,738 | | |
| 549,881 | | |
| 140,450 | | |
| — | | |
| — | | |
| 1,606,772 | |
| Loan #3 | |
| 72,524 | | |
| 101,001 | | |
| 106,146 | | |
| 83,143 | | |
| — | | |
| — | | |
| 362,814 | |
| Loan #4 | |
| 160,581 | | |
| 220,994 | | |
| 228,965 | | |
| 240,447 | | |
| — | | |
| — | | |
| 850,987 | |
| Loan #5 | |
| 50,161 | | |
| 69,856 | | |
| 73,415 | | |
| 77,156 | | |
| 81,086 | | |
| — | | |
| 351,674 | |
| Loan #6 | |
| 177,910 | | |
| 253,003 | | |
| 1,418,563 | | |
| — | | |
| — | | |
| — | | |
| 1,849,476 | |
| Loan #7 | |
| 86,729 | | |
| 124,364 | | |
| 715,312 | | |
| — | | |
| — | | |
| — | | |
| 926,405 | |
| Subtotal | |
| 1,107,258 | | |
| 1,539,832 | | |
| 3,340,886 | | |
| 798,845 | | |
| 347,623 | | |
| 4,598,391 | | |
| 11,732,835 | |
| Debt issuance cost | |
| (16,750 | ) | |
| (21,314 | ) | |
| (13,580 | ) | |
| (5,420 | ) | |
| (3,513 | ) | |
| (11,347 | ) | |
| (71,924 | ) |
| Debt discount cost | |
| (15,668 | ) | |
| (20,891 | ) | |
| (11,344 | ) | |
| — | | |
| — | | |
| — | | |
| (47,903 | ) |
| Total | |
$ | 1,074,840 | | |
$ | 1,497,627 | | |
$ | 3,315,962 | | |
$ | 793,425 | | |
$ | 344,110 | | |
$ | 4,587,044 | | |
$ | 11,613,008 | |
ImmuCell Corporation
Notes to Unaudited Financial
Statements (continued)
11. CONTINGENT LIABILITIES AND COMMITMENTS
Our bylaws, as amended, in effect provide that the
Company will indemnify its officers and directors against any liability arising from their responsibilities as officers and directors
to the maximum extent permitted by Delaware law. In addition, we make similar indemnity undertakings with each director through a separate
indemnification agreement with that director. The maximum payment that we may be required to make under such provisions is theoretically
unlimited and is impossible to determine. We maintain directors’ and officers’ liability insurance, which may provide reimbursement
to the Company for payments made to, or on behalf of, officers and directors pursuant to the indemnification provisions. Our indemnification
obligations were grandfathered under the provisions of Codification Topic 460, Guarantees. Accordingly, we have recorded no liability
for such obligations as of March 31, 2024 or December 31, 2023. Since our incorporation, we have had no occasion to make any indemnification
payment to any of our officers or directors for any reason.
The development, manufacturing and marketing of
animal health care products entails an inherent risk that liability claims will be asserted against us during the normal course of business.
We are aware of no such claims against us as of the date of this filing. We believe that we have reasonable levels of liability insurance
to support our operations.
We enter into agreements with third parties in the
ordinary course of business under which we are obligated to indemnify such third parties from and against various risks and losses. The
precise terms of such indemnities vary with the nature of the agreement. In many cases, we limit the maximum amount of our indemnification
obligations, but in some cases those obligations may be theoretically unlimited. We have not incurred material expenses in discharging
any of these indemnification obligations and based on our analysis of the nature of the risks involved, we believe that the fair value
of the liabilities potentially arising under these agreements is minimal. Accordingly, we recorded no liabilities for such obligations
as of March 31, 2024 or December 31, 2023.
We plan to purchase certain key parts (syringes)
and services (formulation, aseptic filling and final packaging) pertaining to Re-Tain® Drug Product (DP), our Nisin-based
intramammary treatment of subclinical mastitis in lactating dairy cows, exclusively from contractors. The contract for formulation, aseptic
filling and final packaging of DP is scheduled to terminate after the supply of product for our initial controlled market launch. We initiated
an investment in the necessary equipment to perform the DP formulation and aseptic filling services in-house, but this investment has
been paused at the present time.
Effective March 28, 2022, we entered into an Amended
and Restated Separation and Deferred Compensation Agreement (the “Deferred Compensation Agreement”) with Mr. Brigham (our
President and CEO) that superseded and replaced in its entirety a March 2020 severance agreement between the Company and Mr. Brigham.
Upon separation from the Company for any reason, Mr. Brigham’s Deferred Compensation Agreement allows Mr. Brigham to be paid, among
other amounts, all earned and unused paid time off (which expense totaling $222,379 was accrued during the first quarter of 2022 and $230,162
was included in accounts payable and accrued expenses on the accompanying balance sheets as of both March 31, 2024 and December 31, 2023)
and to receive up to an additional $300,000 in deferred compensation (which amount is being accrued over the three-year period ending
in January 2025). This deferred compensation payment vested as to $100,000 on January 1, 2023 and an additional $100,000 on January 1,
2024. An additional $100,000 will vest on January 1, 2025, provided that Mr. Brigham is employed by the Company as of such date. The vested
amounts would be paid upon the earlier of January 31, 2025 or within thirty (30) days following his separation from the Company. As of
March 31, 2024 and December 31, 2023, $225,000 and $200,000, respectively, was included in accounts payable and accrued expenses on the
accompanying balance sheets. In addition, upon termination of Mr. Brigham’s employment (a) by the Company other than for cause,
(b) due to death or disability or (c) by Mr. Brigham for good reason, in each case as described and defined in the Deferred Compensation
Agreement, the Company agrees to pay Mr. Brigham 100% of his then current annual base salary and a lump sum payment equal to the employer
portion of the costs of continued health benefits for Mr. Brigham and his covered dependents for a twelve-month period following termination,
and certain equity incentive awards granted to Mr. Brigham would continue to vest following such termination in accordance with the terms
of the Deferred Compensation Agreement.
Incentive compensation agreements may be entered
into with Mr. Brigham, Ms. Brockmann (our Vice President of Sales and Marketing) and Ms. Williams (our Vice President of Manufacturing
Operations) which, at times, allow these executives to earn incentive compensation if certain regulatory and financial objectives are
met during the year to which the agreement relates, as specified in their agreements. Amounts related to these incentive compensation
agreements are accrued over the period they are earned (when it is probable that the amounts will be earned) based on our best estimate
of the amounts expected to be earned.
In addition to the
commitments discussed above, we had committed $5,000 to increase our production capacity for the First Defense®
product line, $2,052,000 to the purchase of inventory and $378,000 to other obligations as of March 31, 2024.
ImmuCell Corporation
Notes to Unaudited Financial
Statements (continued)
12. OPERATING LEASE
On September 12, 2019, we entered into a lease
covering approximately 14,300 square feet of office and warehouse space with a possession date of November 15, 2019 and a commencement
date of February 13, 2020. The property is located at 175 Industrial Way in Portland (Building 175A), which is a short distance
from our headquarters and manufacturing facility at 56 Evergreen Drive. We renovated this space to meet our needs in expanding our production
capacity for the First Defense® product line. The original lease term was ten years with a right to renew for a
second 10-year term and a right of first offer to purchase. At the time we entered into this lease, we were not reasonably assured that
we would exercise this renewal option in place of other real estate options. For that reason, a 10-year period was reflected in the right-of-use
(ROU) asset and lease liability on our balance sheet. During the third quarter of 2022, we committed to lease an additional 15,400 square
feet of space at 175 Industrial Way (Building 175B), which is connected to the original space, over a 20-year term. The ROU asset
and lease liability for the committed space at Building 175B was recorded as of April 1, 2023 after construction of the building
shell was completed in accordance with the lease agreement. Monthly lease payments commenced as of August 1, 2023. In connection with
the lease commitment for space at Building 175B, the term of the original lease for Building 175A was extended by approximately
13 years. On November 14, 2023, we amended this lease further to provide for certain tenant improvements on the leased premises to be
paid for by our landlord. These improvements will provide heat to an unfinished space, provide additional warehouse space, and create
a new primary shipping and receiving facility. In consideration for the landlord agreeing to pay for the cost of those certain tenant
improvements, we are obligated to make additional rent payments of $20,000 per month from November 2023 through June 2024 and a one-time
additional rent payment of $488,743 in July 2024. The total lease liability for both leases over the amended terms (including inflationary
adjustments) aggregated $4,739,077 as of November 14, 2023. Because of this modification to the lease payments, the ROU asset and lease
liability associated with the space at Building 175B were remeasured as of the modification date. Our leases include variable non-lease
components. Such payments primarily include common area maintenance charges. As of March 31, 2024, the balance of the operating lease
ROU asset was $4,546,061 and the operating lease liability was $4,658,862. As of December 31, 2023, the balance of the operating lease
ROU asset was $4,571,149 and the operating lease liability was $4,721,385. The calculated amount of the ROU asset and lease liability
is impacted by the length of the lease term and the discount rate used for the present value of the minimum lease payments. We elected
not to separate lease and non-lease components for all classes of underlying assets, and instead to account for them as a single lease
component. Variable lease cost primarily represents variable payments such as real estate taxes and common area maintenance. The following
tables describe our lease costs and other lease information:
| | |
During the Three-Month
Periods Ended March 31, | |
| | |
2024 | | |
2023 | |
| Lease Cost | |
| | |
| |
| Operating lease cost | |
$ | 106,880 | | |
$ | 47,526 | |
| Variable lease cost | |
| 9,720 | | |
| 7,614 | |
| Total lease cost | |
$ | 116,600 | | |
$ | 55,140 | |
| | |
| | | |
| | |
| Operating Lease | |
| | | |
| | |
| Cash paid for operating lease liabilities | |
$ | 144,315 | | |
$ | 30,741 | |
| Weighted average remaining lease term (in years) | |
| 18.8 | | |
| 19.9 | |
| Weighted average discount rate | |
| 7.11 | % | |
| 5.54 | % |
Future
lease payments required under non-cancelable operating leases in effect as of March 31, 2024 were as follows:
| | |
Amount | |
| During the nine-month period ending December 31, 2024 | |
$ | 801,688 | |
| During the years ending December 31, | |
| | |
| 2025 | |
| 342,880 | |
| 2026 | |
| 349,744 | |
| 2027 | |
| 356,732 | |
| 2028 | |
| 363,870 | |
| Thereafter | |
| 5,949,488 | |
| Total lease payments (undiscounted cash flows) | |
| 8,164,402 | |
| Less: imputed interest (discount effect of cash flows) | |
| (3,505,540 | ) |
| Total operating liabilities | |
$ | 4,658,862 | |
ImmuCell Corporation
Notes to Unaudited Financial
Statements (continued)
13.
STOCKHOLDERS’ EQUITY
Common
Stock Issuances
From
February 2016 to April 2021, we sold the aggregate of 4,553,017 shares of common stock in six different transactions raising gross proceeds
of $26,714,403 at the weighted average price of $5.87 per share. These funds have been essential to funding our business growth plans.
The details of each transaction are discussed below:
1)
During February of 2016, we sold 1,123,810 shares of common stock at a price to the public of $5.25 per share in an underwritten public
offering pursuant to our effective shelf registration statement on Form S-3, raising gross proceeds of $5,900,003 and resulting in net
proceeds to the Company of $5,313,224 (after deducting underwriting discounts and offering expenses incurred in connection with the equity
financing).
2)
During October of 2016, we sold, in a private placement, 659,880 shares of common stock to nineteen institutional and accredited investors
at $5.25 per share, raising gross proceeds of $3,464,370 and resulting in net proceeds to the Company of $3,160,923 (after deducting
placement agent fees and other expenses incurred in connection with the equity financing).
3)
During July of 2017, we sold 200,000 shares of our common stock at a price of $5.25 per share in a public, registered sale to two related
investors pursuant to our effective shelf registration statement on Form S-3, raising gross proceeds of $1,050,000 and resulting in net
proceeds of $1,034,164 (after deducting expenses incurred in connection with the equity financing).
4)
During December of 2017, we sold 417,807 shares of common stock at a price to the public of $7.30 per share in an underwritten public
offering pursuant to our effective shelf registration statement on Form S-3, raising gross proceeds of $3,049,991 and resulting in net
proceeds to the Company of $2,734,173 (after deducting underwriting discounts and offering expenses incurred in connection with the equity
financing).
5)
During March of 2019, we sold 1,636,364 shares of common stock at a price to the public of $5.50 per share in an underwritten public
offering pursuant to our effective shelf registration statement on Form S-3, raising gross proceeds of $9,000,002 and resulting in net
proceeds to the Company of $8,303,436 (after deducting underwriting discounts and offering expenses incurred in connection with the equity
financing).
6)
During April of 2021, we sold 515,156 shares of our common stock at a price of $8.25 per share in a public, registered sale to seven
investors pursuant to our effective shelf registration statement on Form S-3, raising gross proceeds of $4,250,038 and resulting in net
proceeds of $4,233,026 (after deducting expenses incurred in connection with the equity financing).
7)
On April 9, 2024, our shelf registration on Form S-3 (File No. 333-278438) relating to the offer, issuance and sale by the Company of
up to $20,000,000 of securities was declared effective by the SEC. Also on April 9, 2024, we entered into an At-The-Market Offering Agreement
(ATM Agreement) with Craig-Hallum Capital Group LLC, pursuant to which we may offer and sell up to $11,000,000 of shares of our common
stock. As of May 3, 2024, we had sold 61,010 shares pursuant to the ATM Agreement. Legal, accounting and other fees of approximately
$136,477 associated with the completion of the shelf registration and the ATM Agreement were capitalized as of March 31, 2024 and were
offset against the initial proceeds received during the second quarter of 2024. Gross proceeds from the at the market offering conducted
pursuant to the ATM Agreement (excluding the upfront legal, accounting and other fees), less sales commissions of approximately $9,000,
were approximately $300,000 through May 3, 2024.
Stock
Option Plans
In
June 2010, our stockholders approved the 2010 Stock Option and Incentive Plan (the “2010 Plan”) pursuant to the provisions
of the Internal Revenue Code of 1986, under which employees and certain service providers may be granted options to purchase shares of
the Company’s common stock at no less than fair market value on the date of grant. At that time, 300,000 shares of common stock
were reserved for issuance under the 2010 Plan and subsequently no additional shares have been reserved for the 2010 Plan. Vesting requirements
are determined by the Compensation and Stock Option Committee of the Board of Directors on a case-by-case basis. All options granted
under the 2010 Plan expire no later than 10 years from the date of grant. The 2010 Plan expired in June 2020, after which date no further
options can be granted under the 2010 Plan. However, options outstanding under the 2010 Plan at that time can be exercised in accordance
with their terms. There were 186,500 and 188,500 options outstanding under the 2010 Plan as of March 31, 2024 and December 31, 2023,
respectively.
ImmuCell Corporation
Notes to Unaudited Financial
Statements (continued)
In
June 2017, our stockholders approved the 2017 Stock Option and Incentive Plan (the “2017 Plan”) pursuant to the provisions
of the Internal Revenue Code of 1986, under which employees and certain service providers may be granted options to purchase shares of
the Company’s common stock at no less than fair market value on the date of grant. At that time, 300,000 shares of common stock
were reserved for issuance under the 2017 Plan. An amendment to the 2017 Plan increasing the number of shares reserved for issuance under
the 2017 Plan from 300,000 shares to 650,000 shares was approved by a vote of stockholders at the Annual Meeting of Stockholders in June
2022. Vesting requirements are determined by the Compensation and Stock Option Committee of the Board of Directors on a case-by-case
basis. All options granted under the 2017 Plan expire no later than 10 years from the date of grant. The 2017 Plan expires in March 2027,
after which date no further options can be granted under the 2017 Plan. However, options outstanding under the 2017 Plan at that time
can be exercised in accordance with their terms. As of March 31, 2024 and December 31, 2023, there were 413,000 and 430,000 options outstanding
under the 2017 Plan, respectively.
Activity
under the stock option plans described above was as follows:
| | |
2010 Plan | | |
2017 Plan | | |
Weighted
Average
Exercise
Price | | |
Aggregate
Intrinsic
Value(1) | |
| Outstanding as of December 31, 2022 | |
| 202,500 | | |
| 402,500 | | |
$ | 7.19 | | |
$ | (661,310 | ) |
| Grants | |
| — | | |
| 122,000 | | |
$ | 5.16 | | |
| | |
| Terminations/forfeitures(2) | |
| (10,000 | ) | |
| (94,500 | ) | |
$ | 7.12 | | |
| | |
| Exercises | |
| (4,000 | ) | |
| — | | |
$ | 4.69 | | |
| | |
| Outstanding as of December 31, 2023 | |
| 188,500 | | |
| 430,000 | | |
$ | 6.82 | | |
$ | (1,071,121 | ) |
| Grants | |
| — | | |
| 2,000 | | |
$ | 5.15 | | |
| | |
| Terminations/forfeitures(2) | |
| (2,000 | ) | |
| (19,000 | ) | |
$ | 7.27 | | |
| | |
| Exercises | |
| — | | |
| — | | |
$ | — | | |
| | |
| Outstanding as of March 31, 2024 | |
| 186,500 | | |
| 413,000 | | |
$ | 6.80 | | |
$ | (899,486 | ) |
| Vested as of March 31, 2024 | |
| 186,500 | | |
| 86,500 | | |
$ | 6.39 | | |
$ | (297,520 | ) |
| Vested and expected to vest as of March 31, 2024 | |
| 186,500 | | |
| 413,000 | | |
$ | 6.80 | | |
$ | (899,486 | ) |
| Reserved for future grants | |
| — | | |
| 219,000 | | |
| | | |
| | |
ImmuCell Corporation
Notes to Unaudited Financial
Statements (continued)
The
following table displays additional information about the stock option plans described above:
| | |
Number of
Shares | | |
Weighted
Average
Fair Value at
Grant Date | | |
Weighted
Average
Exercise
Price | |
| Non-vested stock options as of January 1, 2024 | |
| 337,500 | | |
$ | 3.66 | | |
$ | 7.14 | |
| Non-vested stock options as of March 31, 2024 | |
| 326,500 | | |
$ | 3.65 | | |
$ | 7.14 | |
| Stock options granted during the three-month period ended March 31, 2024 | |
| 2,000 | | |
$ | 2.89 | | |
$ | 5.15 | |
| Stock options that vested during the three-month period ended March 31, 2024 | |
| 4,000 | | |
$ | 3.09 | | |
$ | 6.10 | |
| Stock options that were terminated or forfeited during the three-month period ended March 31, 2024 | |
| 21,000 | | |
$ | 3.51 | | |
$ | 7.27 | |
No
stock options were exercised during the three-month periods ended March 31, 2024 and 2023. The weighted average remaining life of the
options outstanding under the 2010 Plan and the 2017 Plan as of March 31, 2024 was approximately 5 years and 5 months. The weighted average
remaining life of the options exercisable under these plans as of March 31, 2024 was approximately 3 years and 5 months. The exercise
price of the options outstanding as of March 31, 2024, ranged from $4.00 to $10.04 per share. The 2,000 stock options granted during
the three-month period ended March 31, 2024 had an exercise price of $5.15 per share. The weighted-average grant date fair values of
options granted during the three-month periods ended March 31, 2024 and 2023 were $2.89 and $2.88 per share, respectively. As of March
31, 2024, total unrecognized stock-based compensation related to non-vested stock options aggregated $510,125 which will be recognized
over a weighted average remaining period of approximately 1 year and 5 months. The fair value of each stock option grant has been estimated
on the date of grant using the Black-Scholes option pricing model, for the purpose discussed in Note 2(n), with the following weighted-average
assumptions:
| | |
During the Three-Month Periods Ended March 31, | |
| | |
2024 | | |
2023 | |
| Risk-free interest rate(1) | |
| 4.29 | % | |
| 3.54 | % |
| Dividend yield(2) | |
| 0 | % | |
| 0 | % |
| Expected volatility(2) | |
| 52 | % | |
| 55 | % |
| Expected life(3) | |
| 6.5 years | | |
| 6.5 years | |
ImmuCell Corporation
Notes to Unaudited Financial
Statements (continued)
Common
Stock Rights Plan
In
September 1995, our Board of Directors adopted a Common Stock Rights Plan (the “Rights Plan”) and declared a dividend of
one common share purchase right (a “Right”) for each of the then outstanding shares of the common stock of the Company. Each
Right entitles the registered holder to purchase from the Company one share of common stock at an initial purchase price of $70.00 per
share, subject to adjustment. The description and terms of the Rights are set forth in a Rights Agreement between the Company and Equiniti
Trust Company, LLC, as Rights Agent.
The
Rights (as amended) become exercisable and transferable apart from the common stock upon the earlier of i) 10 days following a public
announcement that a person or group (Acquiring Person) has, without the prior consent of the Continuing Directors (as such term is defined
in the Rights Agreement), acquired beneficial ownership of 20% or more of the outstanding common stock or ii) 10 days following commencement
of a tender offer or exchange offer the consummation of which would result in ownership by a person or group of 20% or more of the outstanding
common stock (the earlier of such dates being called the Distribution Date).
Upon
the Distribution Date, the holder of each Right not owned by the Acquiring Person would be entitled to purchase common stock at a discount
to the initial purchase price of $70.00 per share, effectively equal to one half of the market price of a share of common stock on the
date the Acquiring Person becomes an Acquiring Person. If, after the Distribution Date, the Company should consolidate or merge with
any other entity and the Company were not the surviving company, or, if the Company were the surviving company, all or part of the Company’s
common stock were changed or exchanged into the securities of any other entity, or if more than 50% of the Company’s assets or
earning power were sold, each Right would entitle its holder to purchase, at the Rights’ then-current purchase price, a number
of shares of the acquiring company’s common stock having a market value at that time equal to twice the Right’s exercise
price.
At
any time after a person or group becomes an Acquiring Person and prior to the acquisition by such person or group of 50% or more of the
outstanding common stock, the Board of Directors of the Company may exchange the Rights (other than Rights owned by such person or group
which have become void), in whole or in part, at an exchange ratio of one share of common stock per Right (subject to adjustment). At
any time prior to 14 days following the date that any person or group becomes an Acquiring Person (subject to extension by the Board
of Directors), the Board of Directors of the Company may redeem the then outstanding Rights in whole, but not in part, at a price of
$0.005 per Right, subject to adjustment.
During
the third quarter of 2011, our Board of Directors voted to authorize an amendment to the Rights Plan to increase the ownership threshold
for determining “Acquiring Person” status to 20%. During the second quarter of 2015, our Board of Directors also voted to
authorize an amendment to remove a provision that prevented a new group of directors elected following the emergence of an Acquiring
Person (an owner of more than 20% of our stock) from controlling the Rights Plan by maintaining exclusive authority over the Rights Plan
with pre-existing directors. We did this because such provisions have come to be viewed with disfavor by Delaware courts. Each time that
we made such amendments we entered into amendments to the Rights Agreement with the Rights Agent reflecting such extensions, threshold
increases or provision changes. No other changes have been made to the terms of the Rights or the Rights Plan.
At
various times over the years, our Board of Directors, which has the authority to amend the Rights Plan, has voted to authorize amendments
to the Rights Plan to extend the expiration date of the Rights Plan. Our Board of Directors decided to seek an advisory vote by stockholders
at the Annual Meeting of Stockholders held in June 2022, as to whether to extend the Rights Plan by one year to September 19, 2023. Of
the votes actually cast on this proposal, 65% voted in favor, 32% voted against and 3% abstained. On the basis of this vote, our Board
of Directors voted to extend the Rights Plan by one year to September 19, 2023. Our Board of Directors decided to seek another advisory
vote by stockholders at the Annual Meeting of Stockholders held in June 2023, as to whether to extend the Rights Plan by another year
to September 19, 2024. Of the votes actually cast on this proposal, 65.10% voted in favor, 34.60% voted against and 0.30% abstained.
On the basis of this vote, our Board of Directors voted to extend the Rights Plan by one year to September 19, 2024. Recognizing that
there might be a substantial number of broker non-votes, our Board of Directors disclosed that it would be guided by the votes actually
cast on these proposals in deciding whether to extend the expiration date of such plan by one year.
Authorized
Common Stock
At
the June 14, 2018 Annual Meeting of Stockholders, our stockholders voted to approve an amendment to our Certificate of Incorporation
to increase the number of shares of common stock authorized for issuance from 8,000,000 to 11,000,000. At the June 10, 2020 Annual Meeting
of Stockholders, our stockholders voted to approve an amendment to our Certificate of Incorporation to increase the number of shares
of common stock authorized for issuance from 11,000,000 to 15,000,000.
ImmuCell Corporation
Notes to Unaudited Financial
Statements (continued)
14.
REVENUE
We
primarily offer the First Defense® product line to dairy and beef producers to prevent scours in newborn calves.
Generally, our products are promoted to veterinarians as well as dairy and beef producers by our sales team and then sold through distributors.
Our primary market is North America. We do sell into select international regions and may expand this international reach in the future.
There were no material changes between the allocation and timing of revenue recognition during the three-month periods ended March 31,
2024 or 2023. We do not have any contract assets for which we have satisfied the performance obligations, but do not yet have the right
to bill for, or contract liabilities such as customer advances. All trade receivables on our balance sheet are from contracts with customers.
We incur no material costs to obtain contracts.
The
following table presents our product sales disaggregated by geographic area:
| | |
During
the Three-Month Periods Ended March 31, | |
| | |
2024 | | |
% | | |
2023 | | |
% | |
| United States | |
$ | 6,340,641 | | |
| 87 | % | |
$ | 2,996,154 | | |
| 87 | % |
| Other | |
| 916,936 | | |
| 13 | % | |
| 450,373 | | |
| 13 | % |
| Total Product Sales | |
$ | 7,257,577 | | |
| 100 | % | |
$ | 3,446,527 | | |
| 100 | % |
The
following table presents our product sales disaggregated by major product category:
| | |
During the Three-Month Periods Ended March 31, | |
| | |
2024 | | |
% | | |
2023 | | |
% | |
| First Defense® product line | |
$ | 7,220,641 | | |
| 99 | % | |
$ | 3,411,232 | | |
| 99 | % |
| Other animal health | |
| 36,936 | | |
| 1 | % | |
| 35,295 | | |
| 1 | % |
| Total Product Sales | |
$ | 7,257,577 | | |
| 100 | % | |
$ | 3,446,527 | | |
| 100 | % |
15.
OTHER EXPENSES, NET
Other
expenses net, consisted of the following:
| | |
During the Three-Month Periods Ended March 31, | |
| | |
2024 | | |
2023 | |
| Interest expense(1) | |
$ | 146,003 | | |
$ | 89,984 | |
| Loss on disposal of property, plant and equipment | |
| — | | |
| 8,243 | |
| Interest income | |
| (9,527 | ) | |
| (40,631 | ) |
| Income-other | |
| — | | |
| (107 | ) |
| Other expenses, net | |
$ | 136,476 | | |
$ | 57,489 | |
16.
INCOME TAXES
Our
income tax expense aggregated $1,340 and $1,525 (amounting to less than 1% of our loss before income taxes) during the three-month periods
ended March 31, 2024 and 2023, respectively. As of December 31, 2023, we had federal net operating loss carryforwards of $17,759,519
of which $16,047,612 do not expire and of which $1,711,907 expire in 2034 through 2037 (if not utilized before then) and state net operating
loss carryforwards of $4,681,644 that expire in 2037 through 2038 (if not utilized before then). Additionally, we had federal general
business tax credit carryforwards of $726,474 that expire in 2027 through 2042 (if not utilized before then) and state tax credit carryforwards
of $775,473 that expire in 2024 through 2042 (if not utilized before then).
ImmuCell Corporation
Notes to Unaudited Financial
Statements (continued)
The
provision for income taxes is determined using the asset and liability approach of accounting for income taxes. Under this approach,
deferred taxes represent the estimated future tax effects of temporary differences between book and tax treatment of assets and liabilities
and carryforwards to the extent they are realizable. During the second quarter of 2018, we assessed our historical and near-term future
profitability and recorded $563,252 in non-cash income tax expense to create a full valuation allowance against our net deferred tax
assets (which consist largely of net operating loss carryforwards and federal and state credits) based on applicable accounting standards
and practices. At that time, we had incurred a net loss for six consecutive quarters, had not been profitable on a year-to-date basis
since the nine-month period ended September 30, 2017 and projected additional net losses for some period going forward before returning
to profitability. Should future profitability be realized at an adequate level, we would be able to release this valuation allowance
(resulting in a non-cash income tax benefit) and realize these deferred tax assets before they expire. We will continue to assess the
need for the valuation allowance at each quarter and, in the event that actual results differ from these estimates, or we adjust these
estimates in future periods, we may need to adjust our valuation allowance. Currently, we adjust the valuation allowance at the end of
each quarter to reduce the value of our deferred tax assets to zero.
Net
operating loss carryforwards, credits, and other tax attributes are subject to review and possible adjustment by the Internal Revenue
Service. Section 382 of the Internal Revenue Code contains provisions that could place annual limitations on the future utilization of
net operating loss carryforwards and credits in the event of a change in ownership of the Company, as defined.
We
file income tax returns in the U.S. federal jurisdiction and several state jurisdictions. We currently have no tax examinations in progress.
We also have not paid additional taxes, interest or penalties as a result of tax examinations nor do we have any unrecognized tax benefits
for any of the periods in the accompanying unaudited financial statements.
17.
SEGMENT INFORMATION
Our
business operations (being the development, acquisition, manufacture and sale of products that improve the health and productivity of
dairy and beef cattle) are described in Note 1. Pursuant to Codification Topic 280, Segment Reporting, we operate in the following
two reportable business segments: i) Scours and ii) Mastitis. The Scours segment consists of the First Defense®
product line. The core technology underlying the Scours segment is derived around polyclonal antibodies. The Mastitis segment includes
our products, CMT and Re-Tain®. Re-Tain® is projected to be the driver of this segment
when approved for sale. The core technology underlying the Mastitis segment is derived around a bacteriocin called Nisin. The category
we define as “Other” includes unallocated administrative and overhead expenses and other products. The significant accounting
policies of these segments are described in Note 2. Product sales are the primary factor we use in determining our reportable segments.
The governing regulatory authority (USDA for First Defense® or FDA for Re-Tain®) is also
a factor in determining our reportable segments. Management monitors and evaluates segment performance from sales to net operating income
(loss) closely. We are not organized by geographic region. No segments have been aggregated. The revenues and expenses allocated to each
segment are in some cases direct and in other cases involve reasonable and consistent estimations by management. Each operating segment
is defined as the component of our business for which financial information is available and evaluated regularly by our chief operating
decision-maker in deciding how to allocate resources and in assessing performance. Our chief operating decision-maker is our President
and CEO.
| | |
During the Three-Month Period Ended March 31, 2024 | |
| | |
Scours | | |
Mastitis | | |
Other | | |
Total | |
| Product sales | |
$ | 7,220,641 | | |
$ | 36,936 | | |
$ | — | | |
$ | 7,257,577 | |
| Costs of goods sold | |
| 4,923,548 | | |
| 38,670 | | |
| — | | |
| 4,962,218 | |
| Gross margin | |
| 2,297,093 | | |
| (1,734 | ) | |
| — | | |
| 2,295,359 | |
| | |
| | | |
| | | |
| | | |
| | |
| Product development expense | |
| 29,495 | | |
| 1,202,941 | | |
| 30,114 | | |
| 1,262,550 | |
| Sales and marketing expenses | |
| 669,739 | | |
| 131,184 | | |
| — | | |
| 800,923 | |
| Administrative expenses | |
| — | | |
| — | | |
| 531,938 | | |
| 531,938 | |
| Operating expenses | |
| 699,234 | | |
| 1,334,125 | | |
| 562,052 | | |
| 2,595,411 | |
| | |
| | | |
| | | |
| | | |
| | |
| NET OPERATING INCOME (LOSS) | |
$ | 1,597,859 | | |
$ | (1,335,859 | ) | |
$ | (562,052 | ) | |
$ | (300,052 | ) |
| | |
During the Three-Month Period Ended March 31, 2023 | |
| | |
Scours | | |
Mastitis | | |
Other | | |
Total | |
| Product sales | |
$ | 3,411,232 | | |
$ | 35,295 | | |
$ | — | | |
$ | 3,446,527 | |
| Costs of goods sold | |
| 3,103,958 | | |
| 41,794 | | |
| — | | |
| 3,145,752 | |
| Gross margin | |
| 307,274 | | |
| (6,499 | ) | |
| — | | |
| 300,775 | |
| | |
| | | |
| | | |
| | | |
| | |
| Product development expenses | |
| 291 | | |
| 1,076,344 | | |
| 33,733 | | |
| 1,110,368 | |
| Sales and marketing expenses | |
| 690,544 | | |
| 188,883 | | |
| — | | |
| 879,427 | |
| Administrative expenses | |
| — | | |
| — | | |
| 567,019 | | |
| 567,019 | |
| Operating expenses | |
| 690,835 | | |
| 1,265,227 | | |
| 600,752 | | |
| 2,556,814 | |
| | |
| | | |
| | | |
| | | |
| | |
| NET OPERATING (LOSS) | |
$ | (383,561 | ) | |
$ | (1,271,726 | ) | |
$ | (600,752 | ) | |
$ | (2,256,039 | ) |
ImmuCell Corporation
Notes to Unaudited Financial
Statements (continued)
| | |
Scours | | |
Mastitis | | |
Other | | |
Total | |
| Total Assets as of March 31, 2024 | |
$ | 24,160,698 | | |
$ | 17,550,907 | | |
$ | 1,339,443 | | |
$ | 43,051,048 | |
| Total Assets as of March 31, 2023 | |
$ | 21,519,208 | | |
$ | 18,253,991 | | |
$ | 3,349,988 | | |
$ | 43,123,187 | |
| Depreciation and amortization expense during the three-month period ended March 31, 2024 | |
$ | 338,919 | | |
$ | 318,718 | | |
$ | 19,863 | | |
$ | 677,500 | |
| Depreciation and amortization expense during the three-month period ended March 31, 2023 | |
$ | 323,257 | | |
$ | 317,624 | | |
$ | 17,948 | | |
$ | 658,829 | |
| Capital Expenditures during the three-month period ended March 31, 2024 | |
$ | 39,474 | | |
$ | 30,882 | | |
$ | — | | |
$ | 70,356 | |
| Capital Expenditures during the three-month period ended March 31, 2023 | |
$ | 571,736 | | |
$ | 110,430 | | |
$ | — | | |
$ | 682,166 | |
| | |
During the Year Ended December 31, 2023 | |
| | |
Scours | | |
Mastitis | | |
Other | | |
Total | |
| Product sales | |
$ | 17,293,933 | | |
$ | 177,736 | | |
$ | — | | |
$ | 17,471,669 | |
| Costs of goods sold | |
| 13,453,514 | | |
| 148,871 | | |
| — | | |
| 13,602,385 | |
| Gross margin | |
| 3,840,419 | | |
| 28,865 | | |
| — | | |
| 3,869,284 | |
| | |
| | | |
| | | |
| | | |
| | |
| Product development expense | |
| 11,103 | | |
| 4,242,329 | | |
| 141,420 | | |
| 4,394,852 | |
| Sales and marketing expenses | |
| 2,447,137 | | |
| 641,078 | | |
| — | | |
| 3,088,215 | |
| Administrative expenses | |
| — | | |
| — | | |
| 2,134,295 | | |
| 2,134,295 | |
| Operating expenses | |
| 2,458,240 | | |
| 4,883,407 | | |
| 2,275,715 | | |
| 9,617,362 | |
| | |
| | | |
| | | |
| | | |
| | |
| NET OPERATING INCOME (LOSS) | |
$ | 1,382,179 | | |
$ | (4,854,542 | ) | |
$ | (2,275,715 | ) | |
$ | (5,748,078 | ) |
| | |
During the Year Ended December 31, 2022 | |
| | |
Scours | | |
Mastitis | | |
Other | | |
Total | |
| Product sales | |
$ | 18,411,949 | | |
$ | 154,558 | | |
$ | 1,455 | | |
$ | 18,567,962 | |
| Costs of goods sold | |
| 10,754,189 | | |
| 136,347 | | |
| 28,647 | | |
| 10,919,183 | |
| Gross margin | |
| 7,657,760 | | |
| 18,211 | | |
| (27,192 | ) | |
| 7,648,779 | |
| | |
| | | |
| | | |
| | | |
| | |
| Product development expenses | |
| 66,346 | | |
| 4,317,921 | | |
| 109,605 | | |
| 4,493,872 | |
| Sales and marketing expenses | |
| 1,871,926 | | |
| 1,318,107 | | |
| — | | |
| 3,190,033 | |
| Administrative expenses | |
| — | | |
| — | | |
| 2,263,817 | | |
| 2,263,817 | |
| Operating expenses | |
| 1,938,272 | | |
| 5,636,028 | | |
| 2,373,422 | | |
| 9,947,722 | |
| | |
| | | |
| | | |
| | | |
| | |
| NET OPERATING INCOME (LOSS) | |
$ | 5,719,488 | | |
$ | (5,617,817 | ) | |
$ | (2,400,614 | ) | |
$ | (2,298,943 | ) |
| | |
Scours | | |
Mastitis | | |
Other | | |
Total | |
| Total Assets as of December 31, 2023 | |
$ | 24,735,413 | | |
$ | 17,827,839 | | |
$ | 1,244,850 | | |
$ | 43,808,102 | |
| Total Assets as of December 31, 2022 | |
$ | 20,539,523 | | |
$ | 18,315,492 | | |
$ | 6,005,634 | | |
$ | 44,860,649 | |
| Depreciation and amortization expense during the year ended December 31, 2023 | |
$ | 1,365,988 | | |
$ | 1,287,600 | | |
$ | 86,032 | | |
$ | 2,739,620 | |
| Depreciation and amortization expense during the year ended December 31, 2022 | |
$ | 1,169,011 | | |
$ | 1,263,318 | | |
$ | 62,912 | | |
$ | 2,495,241 | |
| Capital Expenditures during the year ended December 31, 2023 | |
$ | 1,096,819 | | |
$ | 795,694 | | |
$ | — | | |
$ | 1,892,513 | |
| Capital Expenditures during the year ended December 31, 2022 | |
$ | 3,513,336 | | |
$ | 414,486 | | |
$ | 47,452 | | |
$ | 3,975,274 | |
ImmuCell Corporation
Notes to Unaudited Financial
Statements (continued)
18.
RELATED PARTY TRANSACTIONS
David
S. Tomsche (Chair of our Board of Directors) is a controlling owner of Leedstone Inc., a domestic distributor of our products (the First
Defense® product line and CMT). His affiliated company purchased $133,911 and $27,290 of products from us during
the three-month periods ended March 31, 2024 and 2023, respectively, all on terms consistent with those offered to other distributors
of similar status. Our accounts receivable (subject to standard and customary payment terms) due from this affiliated company aggregated
$25,646 and $42,507 as of March 31, 2024 and December 31, 2023, respectively.
19.
EMPLOYEE BENEFITS
We
have a 401(k) savings plan (the Plan) in which all employees completing one month of service with the Company are eligible to participate.
Participants may contribute up to the maximum amount allowed by the Internal Revenue Service. We currently match 100% of the first 3%
of each employee’s salary that is contributed to the Plan and 50% of the next 2% of each employee’s salary that is contributed
to the Plan. Under this matching plan, we paid $54,935 and $44,942 into the Plan for the three-month periods ended March 31, 2024 and
2023, respectively.
20.
SUBSEQUENT EVENTS
We
have evaluated subsequent events through the time of filing on the date we have issued this Quarterly Report on Form 10-Q. On April 9,
2024, we entered into an At-The-Market Offering Agreement (ATM Agreement) with Craig-Hallum Capital Group LLC, pursuant to which we may
offer and sell up to $11,000,000 of shares of our common stock. As of May 3, 2024, we had sold 61,010 shares pursuant to the ATM Agreement.
Gross proceeds from the at the market offering conducted pursuant to the ATM Agreement (excluding approximately $136,477 in upfront legal,
accounting and other fees), less sales commissions of approximately $9,000, were approximately $300,000. As of the time of filing, there
were no additional material, reportable subsequent events.
ImmuCell Corporation
ITEM
2 - MANAGEMENT'S DISCUSSION AND ANALYSIS OF FINANCIAL CONDITION AND RESULTS OF OPERATIONS
The
following discussion and analysis of our financial condition and results of operations should be read together with our unaudited financial
statements and the related notes and other financial information included in this Quarterly Report on Form 10-Q (Quarterly Report). Some
of the information contained in this discussion and analysis or set forth elsewhere in this Quarterly Report, including information with
respect to our plans and strategy for our business, includes forward-looking statements that involve risks and uncertainties. One should
review the Cautionary Note below for a discussion of some of the important factors that could cause actual results to differ materially
from the results, objectives or expectations described in or implied by the forward-looking statements contained in the following discussion
and analysis.
OUTLINE
TO ITEM 2 – MANAGEMENT’S DISCUSSION AND ANALYSIS OF FINANCIAL CONDITION AND RESULTS OF OPERATIONS
| - | Cautionary
Note Regarding Forward-Looking Statements |
| - | Liquidity
and Capital Resources |
| - | Critical
Accounting Policies and Estimates |
Cautionary
Note Regarding Forward-Looking Statements (Safe Harbor Statement):
This
Quarterly Report contains “forward-looking statements” within the meaning of the Private Securities Litigation Reform Act
of 1995, as amended. Forward-looking statements can be identified by the fact that they do not relate strictly to historical or current
facts, and will often include words such as “expects”, “may”, “anticipates”, “aims”,
“intends”, “would”, “could”, “should”, “will”, “plans”, “believes”,
“estimates”, “targets”, “projects”, “forecasts”, “seeks” and similar words
and expressions. Such statements include, but are not limited to, any forward-looking statements relating to: our plans and strategies
for our business; projections of future financial or operational performance; the timing and outcome of pending or anticipated applications
for regulatory approvals; future demand for our products; the consequences of the COVID-19 pandemic, and their direct and indirect impacts
on our production activities, operating results and financial condition and on the customers and markets that we serve; the impact of
Russia’s unprovoked military invasion of Ukraine (and attack on its people) and the war in the Middle East on the world economy
including inflation and the price and availability of grain and oil; the impact of the global supply-chain disruptions on our ability
to obtain, in a timely and cost-effective fashion, all the supplies and components we need to produce our products; the impact of inflation
and rising interest rates on our operating expenses and financial results; the scope and timing of ongoing and future product development
work and commercialization of our products; future costs of product development efforts; the estimated prevalence rate of subclinical
mastitis and producers’ level of interest in treating subclinical mastitis given the current economic and market conditions; the
expected efficacy of new products; estimates about the market size for our products; future market share of and revenue generated by
current products and products still in development; our ability to increase production output and reduce costs of goods sold per unit;
the adequacy of our own manufacturing facilities or those of third parties with which we have contractual relationships to meet demand
for our products on a timely basis; the impacts of backlogs on customer relationships; the efficacy, success and timeline to complete
our contamination remediation efforts; the likelihood, severity or impact of future contamination events; the anticipated costs of (or
time to complete) planned expansions of our manufacturing facilities and the adequacy of our funds available for these projects; the
robustness of our manufacturing processes and related technical issues; estimates about our production capacity, efficiency and yield;
future regulatory requirements relating to our products; future expense ratios and margins; the efficacy of our investments in our business;
future compliance with bank debt covenants; anticipated changes in our manufacturing capabilities and efficiencies; our effectiveness
in competing against competitors within both our existing and our anticipated product markets; projections about depreciation expense
and its impact on income for book and tax return purposes; and any other statements that are not historical facts. These statements are
intended to provide management's current expectation of future events as of the date of this earnings release, are based on management's
estimates, projections, beliefs and assumptions as of the date hereof; and are not guarantees of future performance. Such statements
involve known and unknown risks and uncertainties that may cause the Company's actual results, financial or operational performance or
achievements to be materially different from those expressed or implied by these forward-looking statements, including, but not limited
to, those risks and uncertainties relating to: difficulties or delays in development, testing, regulatory approval, production and marketing
of our products (including the First Defense® product line and Re-Tain®), competition within
our anticipated product markets, customer acceptance of our new and existing products, product performance, alignment between our manufacturing
resources and product demand (including the consequences of backlogs), uncertainty associated with the timing and volume of customer
orders as we come out of a prolonged backlog, adverse impacts of supply chain disruptions on our operations and customer and supplier
relationships, commercial and operational risks relating to our current and planned expansion of production capacity, and other risks
and uncertainties detailed from time to time in filings we make with the Securities and Exchange Commission (SEC), including our Quarterly
Reports on Form 10-Q, our Annual Reports on Form 10-K and our Current Reports on Form 8-K. Such statements involve risks and uncertainties
and are based on our current expectations, but actual results may differ materially due to various factors, including the risk factors
summarized under PART II: OTHER INFORMATION, ITEM 1A-RISK FACTORS and uncertainties otherwise referred to in this Quarterly Report.
In addition, there can be no assurance that future risks, uncertainties or developments affecting us will be those that we anticipate.
We undertake no obligation to update any forward-looking statement, whether written or oral, that may be made from time to time, whether
as a result of new information, future developments or otherwise.
ImmuCell Corporation
Liquidity
and Capital Resources
Net
cash provided by operating activities was $419,000 during the three-month period ended March 31, 2024 in contrast to net cash (used for)
operating activities of $(2.8) million during the three-month period ended March 31, 2023. The $3.2 million improvement in cash provided
by operating activities during the three-month period ended March 31, 2024 compared to the three-month period ended March 31, 2023 was
largely caused by the $1.9 million decrease in the net loss and a $952,000 swing from cash used for inventory build to an inventory reduction.
Our inventory balance decreased by $662,000 from $7.8 million as of December 31, 2023 to $7.1 million as of March 31, 2024. Our total
depreciation and amortization expense was approximately $678,000 and $659,000 during the three-month periods ended March 31, 2024 and
2023, respectively. We anticipate that depreciation expense, while not affecting our cash flows from operations, will be a significant
factor in creating annual net operating losses until and unless product sales increase sufficiently to offset these non-cash expenses.
Net
cash used for investing activities was $70,000 during the three-month period ended March 31, 2024 in comparison to net cash used for
investing activities of $682,000 during the three-month period ended March 31, 2023 consisting primarily of cash spent to fund the purchase
of property, plant and equipment. To conserve cash at this time, we have reduced and deferred most non-essential capital expenditures.
Net
cash (used for) financing activities was $(367,000) during the three-month period ended March 31, 2024 in contrast to net cash provided
by financing activities of $749,000 during the three-month period ended March 31, 2023. No draw on our line of credit was incurred during
the three-month period ended March 31, 2024. Financing activities included a $1 million draw on our line of credit during the three-month
period ended March 31, 2023. We had aggregate debt outstanding (net of debt issuance and debt discount costs) of approximately $11.6
million and $12 million as of March 31, 2024 and December 31, 2023, respectively. This debt bears interest at fixed rates. The blended
interest rate on the debt outstanding as of March 31, 2024 and December 31, 2023 was 4.51% per annum. Debt principal repayments aggregated
$362,000 and $251,000 during the three-month periods ended March 31, 2024 and 2023, respectively. We anticipate that debt principal repayments
will aggregate approximately $1.5 million during both of the years ending December 31, 2024 and 2025. Interest expense (including amortization
of debt issuance and debt discount costs) was $146,000 and $90,000 during the three-month periods ended March 31, 2024 and 2023, respectively.
We anticipate that interest expense (including amortization of debt issuance and debt discount costs) will be $566,000 and $494,000 during
the years ending December 31, 2024 and 2025, respectively. During the first quarter of 2024, the availability of our $1 million line
of credit, which bears interest at the National Prime Rate per annum, was extended until September 11, 2025. There was no outstanding
balance under this line of credit as of March 31, 2024 or December 31, 2023. See Note 10 to the accompanying unaudited financial statements
for more information about our bank debt.
During
the second quarter of 2024, we entered into an At-The-Market Offering Agreement (ATM Agreement) with Craig-Hallum Capital Group LLC,
pursuant to which we may offer and sell up to $11 million of shares of our common stock. As of May 3, 2024, we had sold 61,010 shares
pursuant to the ATM Agreement. Gross proceeds from the at the market offering conducted pursuant to the ATM Agreement (excluding approximately
$136,000 in upfront legal, accounting and other fees), less sales commissions of approximately $9,000, were approximately $300,000. The
at the market offering gives our board the flexibility to evaluate the potential uses of proceeds while considering the cost of dilution
in real time going forward.
Based
on our best estimates and projections, we believe that our cash and cash equivalents, together with gross margin anticipated to be earned
from ongoing product sales will be sufficient to meet our currently planned working capital and capital expenditure requirements and
to finance our ongoing business operations for at least 12 months (which is the period of time required to be addressed for such purposes
by accounting disclosure standards) from the date of this filing. The table below summarizes the changes in selected, key accounts (in
thousands, except for percentages):
| | |
As of
March 31, | | |
As of
December 31, | | |
(Decrease) | |
| | |
2024 | | |
2023 | | |
Amount | | |
% | |
| Cash and cash equivalents | |
$ | 960 | | |
$ | 979 | | |
$ | (18 | ) | |
| (2) | % |
| Net working capital | |
$ | 7,164 | | |
$ | 7,272 | | |
$ | (109 | ) | |
| (1) | % |
| Total assets | |
$ | 43,051 | | |
$ | 43,808 | | |
$ | (757 | ) | |
| (2) | % |
| Stockholders’ equity | |
$ | 24,636 | | |
$ | 24,993 | | |
$ | (357 | ) | |
| (1) | % |
| Common shares outstanding(1) | |
| 7,751 | | |
| 7,751 | | |
| — | | |
| — | % |
| (1) | There
were 599,500 and 618,500 shares of common stock reserved for issuance for stock options that were outstanding as of March 31, 2024 and
December 31, 2023, respectively. |
ImmuCell Corporation
We
have invested and continue to invest in several different capital expenditure projects to increase our estimated annual full production
capacity for the First Defense® product line from approximately $16.5 million to approximately $40 million and
to complete the development of Re-Tain®. When we describe the production capacity for the First Defense®
product line in this Quarterly Report, it should be noted that the actual value of this capacity varies based on biological
and process yields, product format mix, selling price and other factors.
During
the three-year period ended December 31, 2016, we invested the aggregate of $4.2 million to construct a 7,100 square foot facility addition
at 56 Evergreen Drive (Building 56) and related equipment (primarily Freeze-Dryer #2) and cold storage capacity increasing our
freeze-drying capacity by 100% and making other improvements to our liquid processing capacity, which increased our annual production
capacity (in terms of annual sales dollars) to approximately $16.5 million. During the first quarter of 2016, we completed this investment,
which also included the construction and equipping of a pilot plant for small-scale Drug Substance (DS) production for Re-Tain®
within Building 56. After construction of the DS production facility for Re-Tain® at 33 Caddie
Lane (Building 33) was completed, this space was converted for use in the production of the gel tube formats of the First Defense®
product line. After renovations of our leased facility at 175 Industrial Way (Building 175A) were completed, this space
was converted to double our liquid processing capacity.
During
the four-year period ended December 31, 2018, we invested the aggregate of $21.6 million to construct a DS production facility for Re-Tain®
at Building 33. During the fourth quarter of 2017, we completed construction of the DS production facility. We began
equipment installation during the third quarter of 2017, and we completed this installation during the third quarter of 2018. The total
cost of this investment for the DS production facility and related processing equipment was $20.8 million plus $331,000 for the land
and $472,000 for the acquisition of an adjacent 4,080 square foot warehouse facility at 14 Wedge Way (Building 14), which will
be used for packing, shipping and cold storage of Re-Tain® and other warehousing needs.
During
2019, we initiated several additional capital expenditure investments in First Defense® and Re-Tain®.
The primary purpose of the additional investment in First Defense® is to fulfill the current backlog and materially
reduce the risk of another order backlog. Operating at very close to 100% of available capacity is not efficient or sustainable. Our
objective is to be in position to operate without significant contaminations at the capacity level we choose to cover sales with adequate
buffer stock, which would allow more time for necessary preventative maintenance, and to have redundancy in place for when equipment
failures occur. In addition to running without significant product contaminations or equipment failures, we need to meet or exceed our
production yield assumptions to succeed.
The
purpose of the additional investments in Re-Tain® is to bring the formulation and aseptic filling capabilities
for Re-Tain® Drug Product (DP) into available space in our DS facility in order to lessen or eliminate our reliance
on third-party DP manufacturing services as well as to build out warehouse space at Building 14 for packing and shipping facilities
for Re-Tain®. We began initial installation of the filling equipment during the first quarter of 2022 and then
paused this installation work pending concurrence with the FDA pertaining to our third submission of the Chemistry, Manufacturing and
Controls (CMC) Technical Section, which is discussed in greater detail below. Due to the loss in gross margin during 2023 caused by the
slowdown in production output necessary to remediate the product contamination events discussed below, we have decided to defer the spending
of approximately $2 million of these funds, for the time being. If we decide to resume the in-house strategy, we would anticipate FDA
approval of this facility (which is a requirement for commercial manufacturing) at least two years after we resume spending on this project.
At the same time, we are investigating other potential relationships with contract manufacturers that might do this work for us. The
amount and timing of these investments are detailed in the following table (in thousands):
| Paid During | |
First Defense® | | |
Re-Tain® | | |
Other | | |
Total | |
| Year Ended December 31, 2019 | |
$ | 279 | | |
$ | 538 | | |
$ | 574 | | |
$ | 1,391 | |
| Year Ended December 31, 2020 | |
| 2,938 | | |
| 581 | | |
| 554 | | |
| 4,073 | |
| Year Ended December 31, 2021 | |
| 1,633 | | |
| 976 | | |
| - | | |
| 2,609 | |
| Year Ended December 31, 2022 | |
| 3,513 | | |
| 415 | | |
| 47 | | |
| 3,975 | |
| Year Ended December 31, 2023 | |
| 1,097 | | |
| 796 | | |
| - | | |
| 1,893 | |
| Three-Month Period Ended March 31, 2024 | |
| 39 | | |
| 31 | | |
| - | | |
| 70 | |
| Total Paid through March 31, 2024 | |
| 9,499 | | |
| 3,337 | | |
| 1,175 | | |
| 14,011 | |
| Estimate to Complete(1) | |
| 3,500 | | |
| 2,000 | | |
| 900 | | |
| 6,400 | |
| Total Project Cost | |
$ | 12,999 | | |
$ | 5,337 | | |
$ | 2,075 | | |
$ | 20,411 | |
| (1) | The
investment of approximately $5.5 million of these funds for First Defense® and Re-Tain® projects
has been deferred for the time being. These figures are estimates for the work to be completed based on current information and knowledge
and are not based on firm cost quotations or contracts at this time. |
ImmuCell Corporation
The
first phase of the additional investments in First Defense® included significant renovations to a 14,300 square
foot leased facility at Building 175A, some facility modifications at Building 56 and the necessary production equipment
(including Freeze-Dryer #3) to increase our freeze-drying capacity by 50% and our liquid processing capacity by 100%. This resulted in
increasing the annual production capacity of the First Defense® product line (in terms of annual sales dollars)
from approximately $16.5 million to approximately $23 million. Renovations of Building 175A to enable this expansion were completed
during the second quarter of 2020. By moving our powder and gel filling and assembly services from Building 56 into this new space,
we created space at Building 56 for the installation of the expanded freeze-drying capacity. The new facilities are built to contemporary
current Good Manufacturing Practices (cGMP) standards with efficient material and people flows. A site license approval for this new
facility was issued by the USDA during the third quarter of 2020. During the second quarter of 2021, we completed the relocation of our
gel formulation equipment from Building 56 to Building 175A, which created the space necessary to double our liquid processing
capacity at Building 56. We obtained site license approval of the expanded freeze-drying capacity (Freeze-Dryer #3) at Building
56 from the USDA during the third quarter of 2021, and we obtained site license approval of the expanded liquid processing capacity
at Building 56 from the USDA during the third quarter of 2022. This investment also included equipment and vehicle investments
necessary to expand and improve our colostrum collection capabilities and logistics.
The
second phase of the additional investments in First Defense® included the installation of Freeze-Dryer #4 to further
increase the estimated annual production capacity of the First Defense® product line (in terms of annual sales
dollars) by an additional 33% from approximately $23 million to approximately $30 million. Due to supply disruptions affecting key components
and equipment, this investment was not completed until the end of 2022. This investment also includes equipment and facility modifications
to scale-up and upgrade our vaccine manufacturing capacity, improve our quality laboratories and install new equipment for our gel filling
operations for First Defense® at Building 56 and Building 175A. This phase included the automation
of our gel filling operations.
The
third phase of the additional investments in First Defense® involves the construction of an additional 15,400 square
feet of space adjacent to and connected to Building 175A at 175 Industrial Way (Building 175B) and new equipment to further
increase our estimated annual First Defense® production capacity from approximately $30 million to approximately
$40 million with options for further expansion. Given the long lead time required for investments like this, we initiated this project
by entering into a lease amendment during the third quarter of 2022 covering a to-be-constructed building shell for approximately $250,000
per year. Construction of the building shell by our landlord was substantially complete as of April 1, 2023, and rent payments commenced
as of August 1, 2023. We made this lease commitment because of the unique proximity of the land adjacent to our currently leased space
and the high level of demand for properties of this type in the Portland market. We did not want to risk losing this opportunity to others.
The anticipated benefits to us from this new lease include: i) space for the potential to install Freeze-Dryers #5, #6, #7 and #8 if
justified by market demand in the future, ii) improved space and quality for our powder milling operations by separating our upstream
processes (liquid processing) at Building 56 from our clean downstream processes (milling, formulation, filling and packaging)
at Building 175A and iii) much needed additional warehouse space. Freeze-Dryer #5 is the key piece of equipment required to allow
us to increase our estimated annual production capacity to above $30 million. Based on past experience, we are planning for approximately
18 to 24 months of lead time for fabrication, installation, qualification and implementation of Freeze-Dryer #5. We have been running
our equipment and staff close to 100% of capacity in order to fill the backlog of orders. One of our objectives is to create a more sustainable
production schedule. However, due to the loss in gross margin during 2023 caused by the slowdown in production output necessary to remediate
the product contamination events discussed below, we have decided to defer most of this investment, for the time being. Instead, we initiated
the initial steps of this project with a reduced budget of approximately $700,000 in what we call Building 175B during the third
quarter of 2023. This work was completed during the first quarter of 2024, which will provide additional warehousing space and allow
us to move all shipping and receiving functions out of Building 56 and into Building 175B to create more space for liquid
processing at Building 56. In consideration for our landlord agreeing to pay for the cost of those certain tenant improvements,
we are obligated to make additional rent payments of $20,000 per month from November 2023 through June 2024 and a one-time additional
rent payment of $488,743 in July 2024.
ImmuCell Corporation
During
the third quarter of 2016, the City of Portland approved a Tax Increment Financing (TIF) credit enhancement package that reduces the
real estate taxes on our DS production facility for Re-Tain® by 65% over the eleven-year period beginning on July
1, 2017 and ending June 30, 2028 and by 30% during the year ending June 30, 2029, at which time the rebate expires. During the second
quarter of 2017, the TIF was approved by the Maine Department of Economic and Community Development. The value of the tax savings will
increase (decrease) in proportion to any increases (decreases) in the assessment of the building for city real estate tax purposes or
the City’s tax rate. The following table discloses how much of the new taxes we have generated is being relieved by the TIF and
how much we are paying:
| Assessed Value | |
Twelve-Month
Period Ended | |
Total
New Taxes
Generated
by the Project | | |
Less:
TIF Credit | | |
Net Amount
Paid by
ImmuCell | |
| $1.7 million @ April 1, 2017 | |
June 30, 2018 | |
$ | 36,000 | | |
$ | 22,000 | | |
$ | 13,000 | |
| $4.0 million @ April 1, 2018 | |
June 30, 2019 | |
$ | 90,000 | | |
$ | 58,000 | | |
$ | 32,000 | |
| $4.0 million @ April 1, 2019 | |
June 30, 2020 | |
$ | 94,000 | | |
$ | 60,000 | | |
$ | 34,000 | |
| $4.0 million @ April 1, 2020 | |
June 30, 2021 | |
$ | 94,000 | | |
$ | 60,000 | | |
$ | 34,000 | |
| $4.3 million @ April 1, 2021 | |
June 30, 2022 | |
$ | 55,000 | | |
$ | 36,000 | | |
$ | 20,000 | |
| $4.3 million @ April 1, 2022 | |
June 30, 2023 | |
$ | 58,000 | | |
$ | 37,000 | | |
$ | 21,000 | |
| $4.3 million @ April 1, 2023 | |
June 30, 2024 | |
$ | 61,000 | | |
$ | 39,000 | | |
$ | 22,000 | |
| Total | |
| |
$ | 488,000 | | |
$ | 312,000 | | |
$ | 176,000 | |
Results
of Operations
Business
Segments
As
detailed in Note 17, “Segment Information”, to the accompanying unaudited financial statements, we operate in two business
segments. The Scours segment is dedicated to manufacturing and selling First
Defense®, a product used to prevent scours in newborn calves, which is regulated by
the United States Department of Agriculture (USDA). The Mastitis segment is focused on developing and commercializing Re-Tain®,
a product to treat subclinical mastitis in lactating dairy cows, which is regulated by the United States Food and Drug Administration
(FDA), and CMT.
Production
Capacity Increase, Product Contamination and Related Events
Over
the past 10 years or so, we have invested approximately $13.7 million to increase our production capacity for the First Defense®
product line to meet the still-growing demand. This investment in equipment and facilities represents approximately 56% of
our stockholders’ equity as of March 31, 2024. During 2018, it became clear that demand for Tri-Shield First Defense®
was outpacing production. In response to this increasing demand, we began a series of investments during 2019 (as detailed
above) to increase our production capacity for the First Defense® product line to an estimate of approximately
$30 million per year. Our production process is a very complicated one, which makes it difficult to scale-up quickly. We can’t
just flip a switch and pump out more widgets. We remain deeply committed to continuing to supply First Defense® to
the market over the long term, despite the current short supply. We were able to achieve our production goals during the first quarter
of 2024.
The
past year or so has been considerably challenging for us. As of July 2022, we had completed almost all of the facility expansion work
and new equipment installations needed to increase our production capacity to almost $30 million per year. However, the most critical
piece of new equipment (being Freeze-Dryer #4) was delivered six months late by the fabricator. As this increased production capacity
was coming online, a product contamination event related to our incoming raw material was detected by standard in-process quality control
testing around the end of the third quarter of 2022. Scrapped product from contamination events and other production process losses (largely
due to the contamination event around the end of the third quarter) resulted in a total charge to costs of goods sold of $589,000 during
2022. We took immediate steps to address the contamination, and production ran without issue during the balance of the fourth quarter
of 2022. By the end of 2022, we had Freeze-Dryer #4 approved for use by the USDA. Just as we began to operate at this higher level of
capacity at the beginning of 2023, we were forced to slow down production to remediate a second contamination event related to our incoming
raw material. In response to this contamination event, we slowed down our production output as we took the necessary steps to assess
and remediate the issues to ensure that any product that is released to market continues to meet all quality standards. At the same time,
Freeze-Dryer #2 stopped operating requiring a six-month repair and netting us back to three operating freeze dryers during that period.
As of early July 2023, we were back to four operating freeze dryers, and we believed that the contamination events were largely behind
us. We subsequently experienced a smaller third contamination event in September 2023 impacting two lots of work-in-progress inventory
likely related to our increased level of liquid processing. Although all of the incoming material utilized in this production phase had
passed quality control testing, the product failed the quality control tests later in the production process. The production pause necessary
to remediate the problem reduced our production output during September and October of 2023. Scrapped product from contamination events
and other production process losses resulted in a total charge to costs of goods sold of $527,000 during 2023.
ImmuCell Corporation
We
believe that we are on the right track to move past the contamination events that have materially affected our output since late 2022,
but we still have more work to do to catch up to product demand. As we continue to optimize our investments to increase production capacity
and to implement the corrective actions being taken in response to these contamination events, we aspire to reach stable production of
approximately $30 million per year going forward. While we produced far less than we needed during 2023, we believe that our remediation
efforts are allowing us to steadily ramp back up to full production capacity. With a positive trend in our quality control test results,
we are building back production. As we resume full production, our goal is to be able to produce at least $6 million or more worth of
product per quarter, which would annualize to about 80% or more of our estimated $30 million annual production capacity. Finished goods
produced increased steadily from approximately $3.3 million to $4 million and further to $5.3 million during the first, second and third
quarters of 2023, respectively, before dropping modestly to $5.1 million during the fourth quarter of 2023. The output levels achieved
during the months of November and December of 2023 annualize to approximately $26.8 million (or approximately 89% of $30 million), which
equates to an average quarterly production of approximately $6.7 million. We were able to increase finished goods production to $7.2
million during the first quarter of 2024, which annualizes to approximately $28.7 million (or approximately 96% of $30 million). This
level of production will remain our aspirational goal, but we do not expect that it can be repeated or exceeded on a regular basis.
Since
February of 2023, we have been pursuing an insurance claim under our business interruption policy to offset a small portion of the losses
that we have incurred related to at least three different product contamination events that took place during 2022 and 2023. While our
financial losses are far larger, we are seeking an insurance benefit of approximately $700,000. To date, we have received $250,000. The
balance of this claim remains under review by our underwriter. We cannot estimate the likelihood of our success with this claim.
The
increase in sales demand for First Defense® is both exciting and challenging for us. The learnings from the remediation
of the contamination events have improved our production processes going forward. We have implemented several important improvements
at the source farm level including more product and environmental testing, more training of farm staff and better enforcement of our
protocols. While we never release product to the market that does not pass our final quality control release tests, we had allowed product
to advance in the production process at risk, while the in-process quality control tests were being performed. We no longer advance product
to the next stage before the complete quality control test results are known. While this does add time to the production cycle, we believe
that it has helped us reduce the cost of further contaminations. Notwithstanding the challenges that contamination events have posed
for us, we are excited to be approaching both our estimated full capacity of approximately $30 million per year for First Defense®
(with an option to increase our estimated full capacity to approximately $40 million per year in the future with the additional
capital investments discussed above) while, at the same time, advancing to the final stages of a very significant FDA product development
initiative with Re-Tain®.
Product
Sales
Our
near-term goal is to increase and stabilize supply, regain lost business and re-establish our growth curve. Through continued growth
in sales of the First Defense® product line and the dedication of additional resources to production, it is our
objective to exceed our total product sales of approximately $17.5 million and $18.6 million achieved during the years ended December
31, 2023 and 2022, respectively, as soon as possible. Our longer-term goal is to exceed $35 million of annual total product sales as
soon as possible during the four-year period after the market launch of Re-Tain®. We do not solely benchmark our
sales expectations off trailing twelve-month sales results. Instead, we look at the sales of competitive products to assess the size
of the addressable market and plan for growth when projecting our future production capacity needs.
ImmuCell Corporation
Sales
during the three-month period ended March 31, 2023 were $3.45 million, representing a 12%, or $464,000, decrease from sales of $3.9 million
during the fourth quarter of 2022. Sales during the three-month period ended June 30, 2023 were $3.53 million, representing a 2%, or
$86,000, increase over sales during the first quarter of 2023. Sales during the three-month period ended September 30, 2023 were $5.4
million, representing a 53%, or $1.9 million, increase over sales during the second quarter of 2023. Sales during the three-month period
ended December 31, 2023 were $5.1 million, representing a 6%, or $301,000, decrease from sales during the third quarter of 2023. Sales
during the second half of 2023 were stronger as we were able to increase production. Sales during the six-month period ended December
31, 2023 were $10.5 million, representing a 50%, or $3.5 million, increase over sales of $7 million during the six-month period ended
June 30, 2023. Sales during the three-month period ended March 31, 2024 were $7.3 million, representing a 42%, or $2.2 million, increase
over sales during the fourth quarter of 2023. Quarter to quarter sales over the past two years are displayed in the following table:
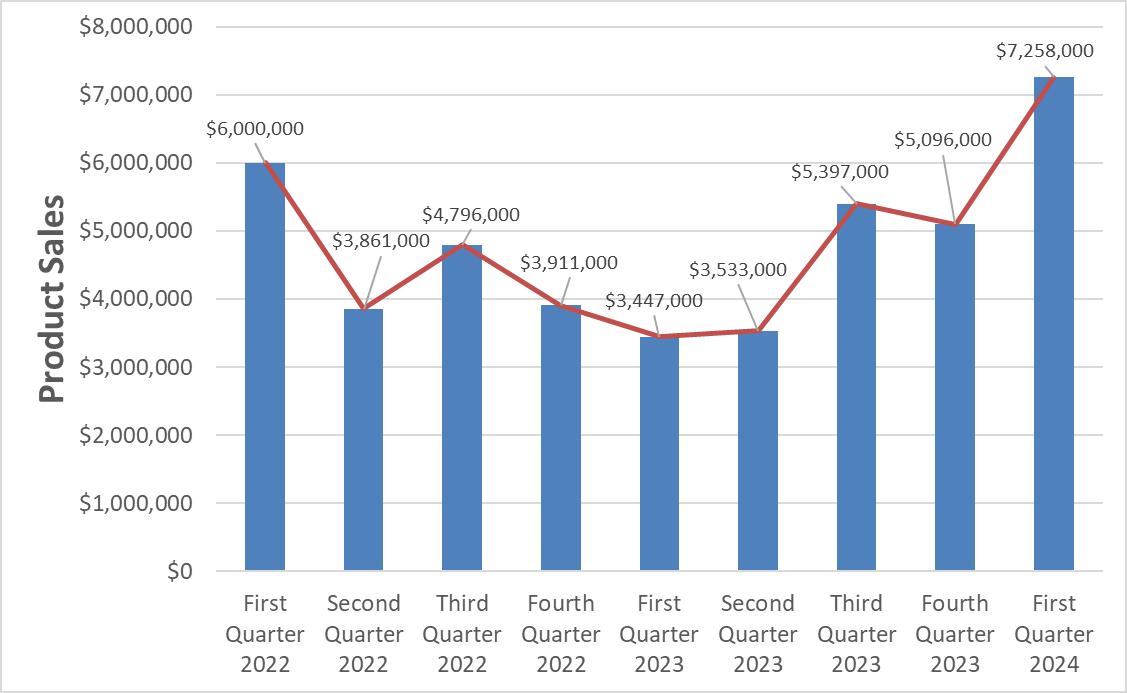
An
increase in selling price and product supply allowed us to capture an 111% increase in sales during the first quarter of 2024 compared
to the first quarter of 2023. Domestic sales during the three-month period ended March 31, 2024 increased by 112%, and international
sales increased by 104%, in comparison to the three-month period ended March 31, 2023. International sales aggregated 13% of total sales
during both of the three-month periods ended March 31, 2024 and 2023. The quarterly sales results are summarized in the following table
(in thousands, except for percentages):
| | |
During the Three-Month
Periods Ended March 31, | | |
Increase | |
| | |
2024 | | |
2023 | | |
Amount | | |
% | |
| Total product sales | |
$ | 7,258 | | |
$ | 3,447 | | |
$ | 3,811 | | |
| 111 | % |
An
increase in selling price and product supply allowed us to capture a 33% increase in sales during the trailing twelve-month period ended
March 31, 2024 compared to the trailing twelve-month period ended March 31, 2023. Domestic sales during the trailing twelve-month period
ended March 31, 2024 increased by 33%, and international sales increased by 31%, in comparison to the trailing twelve-month period ended
March 31, 2023. International sales aggregated 9% of total sales during both of the trailing twelve-month periods ended March 31, 2024
and 2023. The sales results for the trailing twelve-month periods are summarized in the following table (in thousands, except for percentages):
| | |
During the Trailing Twelve-Month
Periods Ended March 31, | | |
Increase | |
| | |
2024 | | |
2023 | | |
Amount | | |
% | |
| Total product sales | |
$ | 21,283 | | |
$ | 16,015 | | |
$ | 5,268 | | |
| 33 | % |
ImmuCell Corporation
Sales
of the First Defense® product line aggregated 99% of our total sales during both of the three-month periods ended
March 31, 2024 and 2023. Our sales are generally seasonal with highest demand expected during the first quarter of each year. Most of
our growth (when not limited by backlog) is being realized through increased demand and a deliberate strategy to prioritize production
capacity towards Tri-Shield First Defense® (the trivalent format of our product delivered via a gel tube), which
provides broader protection to calves. The compound annual growth rate (CAGR) of our total product sales was 10.8%, 9.7% and 6.2% during
the twelve-year, five-year, and four-year periods ended December 31, 2023, respectively.
We
likely lost some business beginning during 2022 and through the first quarter of 2024 as a result of the backlog. During the first half
of 2023, the impact of tight supplies hit even harder leaving our customers without product during their busiest calving season. The
2023 production shortage caused largely by certain contamination events may prove to be more detrimental to our growth curve than any
prior production shortage (or customer demand excess) because it impacted more customers for a longer period of time. Our inability to
timely meet the needs of our customers could result in the loss of some customers who seek alternative scours management products during
this period of short supply and some of these customers may not resume purchasing our product when we have eliminated the backlog. While
we worked to allocate product directly to certain large customers during this period of short supply, we likely lost some customers that
could not access product. While backlog is a better problem to have than seeing product expiring on our shelves, it is nonetheless a
significant challenge when we do not get our customers everything that they want. Our sales team is preparing to resume more normal sales
growth initiatives as we expect inventory to become available. We will work to regain end-user customers that we may have lost while
we were short on product and will aggressively compete for new business. As we emerge from an extended period of time on backlog, we
anticipate higher than normal sales fluctuations quarter to quarter. What is most important to us at this time is that we achieve sales
growth over the longer periods of time, even if we experience some quarter-to-quarter fluctuations.
The
production slowdown during the first ten months of 2023, in part, caused an increase in the amount of our order backlog. We cannot be
certain that this backlog will be converted to sales. Valuation of the backlog is a non-GAAP estimate that is based on purchase orders
on hand at the time that could not be met because of a lack of available inventory. We are reporting this figure because it reflects
the orders on our books presently that we cannot ship. Quantification of the backlog during the current periods has become far less comparable
to prior periods. At times, customers have placed orders for more than a month’s worth of their demand, perhaps in reaction to
our ongoing backlog situation, whereas in the past they ordered more closely in line with their current demand. We are concerned that
this backlog amount may not be highly relevant at this time as it includes very old orders, redundancy in demand and orders that may
be cancelled given the time that has passed since they were originally placed.
The
backlog was reduced from approximately $2.4 million as of December 31, 2021 to approximately $205,000 as of September 30, 2022. In part
because of a first contamination event experienced around the end of the third quarter of 2022, our backlog increased to approximately
$2.5 million as of December 31, 2022. In part because of a second contamination event experienced during the first quarter of 2023, the
backlog continued to increase to approximately $7.5 million as of March 31, 2023, to approximately $8 million as of June 30, 2023, to
approximately $8.9 million as of September 30, 2023 and to approximately $9.4 million as of December 31, 2023. We were able to reduce
this backlog modestly to approximately $9.1 million as of March 31, 2024 and May 3, 2024. As sales demand increased while our production
output was reduced, the value of our order backlog has fluctuated as demonstrated in the following table:
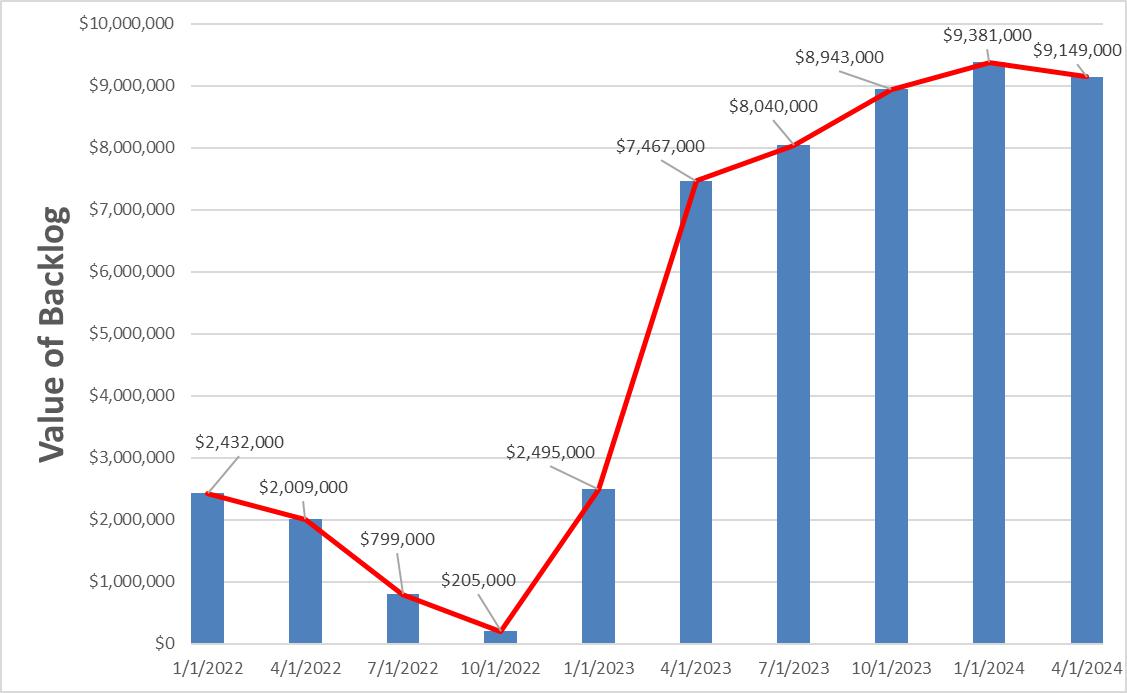
ImmuCell Corporation
We
sell our own CMT, which is used to detect somatic cell counts in milk. Sales of CMT increased by 5%, or $2,000, to $37,000
during the three-month period ended March 31, 2024, in comparison to the three-month period ended March 31, 2023. Sales of CMT
increased by 16%, or $25,000, to $179,000 during the trailing twelve-month period ended March 31, 2024, in comparison to the trailing
twelve-month period ended March 31, 2023. Sales of CMT aggregated approximately 1% of our total product sales during the periods
reported.
Effective
January 1, 2022, we increased our selling price of the First Defense® product line by approximately 5% and CMT
by approximately 7%. Effective January 1, 2023, we increased our selling price of the First Defense® product
line by approximately 4% (range of 2% to 8%) and CMT by approximately 5%. Effective November 15, 2023, we adjusted the pricing
of backlogged orders to accommodate our rising costs of goods and eliminate any irrelevant purchase orders. We notified distributors
that all pending orders would either be removed from our system or modified (with their authorization) to reflect the new pricing structure
representing an increase of approximately 8%. Subsequently, most distributors opted to increase the prices on these older purchase orders
to retain them on the list for fulfillment. The backlog of orders was worth approximately $9 million just before this most recent price
change. Also effective November 15, 2023, we increase our selling price for CMT by approximately 12%.
Gross
Margin
The
change in our gross margin (product sales less costs of goods sold) and our gross margin as a percentage of product sales during the
three-month periods and the trailing twelve-month periods ended March 31, 2024 and 2023 are summarized in the following tables (in thousands,
except for percentages):
| | |
During the Three-Month
Periods Ended March 31, | | |
Increase | |
| | |
2024 | | |
2023 | | |
Amount | | |
% | |
| Gross margin | |
$ | 2,295 | | |
$ | 301 | | |
$ | 1,995 | | |
| 663 | % |
| Percent of product sales | |
| 32 | % | |
| 9 | % | |
| 23 | % | |
| 262 | % |
| | |
During the Trailing Twelve-Month
Periods Ended March 31, | | |
Increase
(Decrease) | |
| | |
2024 | | |
2023 | | |
Amount | | |
% | |
| Gross margin | |
$ | 5,864 | | |
$ | 4,846 | | |
$ | 1,018 | | |
| 21 | % |
| Percent of product sales | |
| 28 | % | |
| 30 | % | |
| (3) | % | |
| (9) | % |
The
gross margin during recent periods was significantly less than what we have experienced historically and significantly less than what
we anticipate going forward. Directionally, we are pleased to see the shorter, more recent period higher (at 32%) than the trailing twelve-month
period ended March 31, 2024. Gross margin has been running at less than our 45% target largely because of the significant decrease in
sales during 2023, which was caused by a reduction in production output, not by a reduction in demand. The reduction in production output
was, in turn, largely the result of our decision to slow down our production rate while remediating the production contamination events.
During 2023, we did not benefit from spreading our fixed costs over higher volumes as we normally do. Further, we did not furlough any
labor during this production slowdown. The gross margin as a percentage of product sales was 22%, 41%, 45%, 45%, 49%, 47% and 50% during
the years ended December 31, 2023, 2022, 2021, 2020, 2019, 2018 and 2017, respectively. The production contamination events and other
production process losses experienced during the three-month periods ended March 31, 2024 and 2023 resulted in scrapped inventory valued
at approximately $117,000 and $236,000, respectively. Absent these write-offs, our gross margin as a percentage of product sales would
have been approximately 33% and 16% during the three-month periods ended March 31, 2024 and 2023, respectively. The product contamination
events and other production process losses experienced during the years ended December 31, 2023 and 2022 resulted in scrapped inventory
valued at approximately $527,000 and $589,000, respectively. Absent these write-offs, our gross margin as a percentage of product sales
would have been approximately 25% and 44% during the years ended December 31, 2023 and 2022, respectively. Although these types of losses
are expected to happen from time to time in the production of a biological product such as ours, we believe we have mitigated the risk
of reoccurrence of such losses through the implementation of certain new quality control steps and manufacturing processes and facility
improvements.
Additionally,
the significant global supply-chain disruptions that almost all industries are experiencing presently are a challenge to us. The costs
of our supplies, components, raw materials, and services increased significantly during 2021 and that trend continued during 2022, 2023
and into 2024. Prices for raw materials and critical supplies are increasing significantly, and it is becoming increasingly more difficult
to obtain timely delivery of the orders that we place. Therefore, we have little choice but to pay the higher prices and try to take
on more months of supply than we would have held previously if we could get our orders fulfilled timely.
ImmuCell Corporation
While
our biological and process yields can be variable, we have seen a favorable improvement to our finished goods yield recently, but these
yields continue to be variable. The Tri-Shield® product format is more complex (i.e., three antibodies versus two
antibodies for Dual-Force®) making it more costly to produce, and both the bivalent and trivalent gel product formats
are more expensive to produce than the bolus format. These new formats are creating sales growth for us, and we are focused on increasing
total gross margin dollars, even if that is accomplished with a lower gross margin as a percentage of sales. A number of other factors
contribute to the variability in our costs, resulting in some fluctuations in gross margin percentages from quarter to quarter and from
year to year. We also invest to sustain compliance with current Good Manufacturing Practices (cGMP) in our production processes. Increasing
production can be more expensive in the initial stages. To achieve our inventory production growth objectives, we continue to acquire
more raw material (colostrum) from many more cows at several new farms. During this expansion phase, colostrum quality can be more variable.
Additionally, the biological yields from our raw material are always variable, which impacts our costs of goods sold in a similar way.
Just as our customers’ cows respond differently to commercial dam-level vaccines, depending on the time of year and immune competency,
our source cows have similar biological variances in response to our proprietary vaccines. As is the case with any vaccine program, animals
respond less effectively to their first exposure to a new vaccine, and thereafter the effectiveness of their immune response improves
in response to subsequent immunizations. While this variability impacts our costs of producing inventory, the commercial value of our
First Defense® product line is that we compensate for the variability in a cow’s immune response by standardizing
each dose of finished product. This ensures that every calf is equally protected, which is something that dam-level commercial scours
vaccines cannot offer. We continue to work on processing and yield improvements and other opportunities to reduce costs, while enhancing
process knowledge and robustness. In the past, we have been able to reduce the impact of cost increases by implementing yield improvements.
We believe that gross margin results going forward should be viewed over longer periods of time than just one quarter. As we fully integrate
and utilize our increased capacity and evaluate our product costs and selling price, one of our goals is to achieve a gross margin (before
related depreciation and amortization expenses) as a percentage of total sales of approximately 45%.
Product
Development Expenses and Strategy
Overview:
The majority of our product development expenses pertain to the development of Re-Tain®.
During the three-month period ended March 31, 2024, product development expenses increased by 14%, or $152,000, to $1.3 million in comparison
to $1.1 million during the three-month period ended March 31, 2023. Product development expenses aggregated 17% and 32% of product sales
during the three-month periods ended March 31, 2024 and 2023, respectively. Product development expenses included non-cash depreciation
and stock-based compensation expenses of $367,000 and $374,000 during the three-month periods ended March 31, 2024 and 2023, respectively.
Approximately $298,000 and $314,000 of these non-cash expenses were comprised of depreciation expenses pertaining to our DS facility
and equipment for Re-Tain® during the three-month periods ended March 31, 2024 and 2023, respectively. We began
depreciating this asset when the Certificate of Occupancy for the new construction was issued during the fourth quarter of 2017, but
sales of our new product cannot be realized until we achieve FDA approval. We expect product development expenses to decrease during
2024 as inventory production of Re-Tain® for implementation of our controlled launch strategy described below (pending
FDA approval) is completed.
Development
objective: As we work to change the way that mastitis is managed in the dairy industry, we aim to demonstrate
that our bacteriocin, Nisin A, which is designed specifically for subclinical mastitis, can provide producers the freedom to change when
and how mastitis is treated. Re-Tain® is not a broad-spectrum antibiotic used in human health. Rather, it consists
of a highly targeted active ingredient without an FDA-required milk discard or meat withhold. While milk prices vary, the cost of the
milk discard associated with traditional antibiotics ranges from approximately $36.00 (for 3.5 days of milk at 60 pounds per day at the
Class III milk price average of $17.02 per hundredweight during 2023) to approximately $150.00 (for 11 days of milk at 80 pounds per
day at the Class III milk price average of $17.02 per hundredweight during 2023) per treated animal. These high milk discard costs associated
with traditional antibiotic treatments lead producers to only treat mastitis after clinical signs develop. We expect that Re-Tain®
will be a first-of-its-kind product that can be used to economically treat at the earliest stage of infection, giving producers
the ability to get ahead of mastitis before clinical signs develop so the best cows stay at their best performance level and in the herd
longer. The final and most critical development objective for Re-Tain® is to achieve regulatory approval of our
manufacturing operations.
ImmuCell Corporation
Development
status: Approval by the Center for Veterinary Medicine, U.S. Food and Drug Administration (FDA) of the
New Animal Drug Application (NADA) for Re-Tain® is required before any sales of the product can be initiated. The
NADA is comprised of five principal Technical Sections plus a sixty-day administrative review at the end. Each Technical Section can
be reviewed and approved separately. By statute, each Technical Section submission is generally subject to one or more six-month review
cycles by the FDA. Upon review and assessment by the FDA that all requirements for a Technical Section have been met, the FDA may issue
a Technical Section Complete Letter. The current status of our work on these submissions to the FDA is as follows:
1)
Environmental Impact: During the third quarter of 2008, we received the Environmental Impact Technical Section Complete Letter from the
FDA. During the second quarter of 2021, we received further clarification through a new Environmental Impact Technical Section Complete
Letter covering the current dosage regimen and labeling.
2)
Target Animal Safety: During the second quarter of 2012, we received the Target Animal Safety Technical Section Complete Letter from
the FDA.
3)
Effectiveness: During the third quarter of 2012, we received the Effectiveness Technical Section Complete Letter from the FDA. The anticipated
product label (which remains subject to FDA approval) carries claims for the treatment of subclinical mastitis associated with Streptococcus
agalactiae, Streptococcus dysgalactiae, Streptococcus
uberis, and coagulase-negative staphylococci in lactating dairy cattle.
Subclinical
mastitis, and the study required to achieve an effectiveness claim for it, is defined under the FDA/Center for Veterinary Medicine Guidance
#49: Target Animal Safety and Drug Effectiveness Studies for Anti-Microbial Bovine Mastitis Products (Lactating and Non-Lactating Cow
Products). Trial eligibility requires both pretreatment samples to be positive for the mastitis pathogen (except for Staphylococcus
aureus and Streptococcus agalactiae, where a single pretreatment
sample qualifies a cow for enrollment). For all pathogens, both samples taken between 14 and 28 days post treatment (and at least
5 days apart) must be negative to be judged a cure. These conservative criteria generally result in enrolling cows with chronic
subclinical disease, which rarely self-resolves.
4)
Human Food Safety: During the third quarter of 2018, we received the Human Food Safety Technical Section Complete Letter from the FDA
confirming, among other things, a zero milk discard period and a zero meat withhold period during and after treatment with our product.
Achieving this critical differentiating feature for our product encouraged us to continue the significant product development investment
necessary to bring Re-Tain®
to market. It would have been hard to justify an ongoing investment of this nature in a product without
this significant competitive advantage. During the second quarter of 2021, we updated this Technical Section Complete Letter with FDA
approval of the official analytical method to measure Nisin in milk.
5)
Chemistry, Manufacturing and Controls (CMC): The CMC Technical Section is very complex and comprehensive. Having previously achieved
the four different Technical Section Complete Letters from the FDA discussed above, approval of the CMC Technical Section is the fifth
and final significant step required before Re-Tain®
product sales
can be initiated in the United States. Implementing Nisin DS (the active pharmaceutical ingredient) production, which is a required component
of the CMC Technical Section, has been the most lengthy part of this project. We previously entered into an agreement with a multi-national
pharmaceutical ingredient manufacturer for our commercial-scale supplies of DS. However, we determined during 2014 that the agreement
did not offer us the most advantageous supply arrangement in terms of either cost or long-term dependability. As a result, we presented
this product development opportunity to a variety of large and small animal health companies. While such a corporate partnership could
have provided access to a much larger sales and marketing team and allowed us to avoid the large investment in a commercial-scale production
facility, we concluded that a partner would have taken an unduly large share of the gross margin from all future product sales of Re-Tain®.
However, the regulatory and marketing feedback that we received from prospective partners, following their due diligence, was positive.
During the third quarter of 2014, we completed an investment in facility modifications and processing equipment necessary to produce
our DS at small-scale at our 56 Evergreen Drive facility. This small-scale facility was used to: i) expand our process knowledge and
controls, ii) establish operating ranges for critical process parameters, iii) conduct product stability studies, iv) optimize process
yields and v) determine the cost of production. We believe these efforts have reduced the risks associated with our investment in the
commercial-scale DS production facility. Having raised equity during 2016 and 2017, we were able to move away from these earlier partnering
strategies and assume control over the commercial-scale manufacturing process in our own facility. During the fourth quarter of 2015,
we acquired land near our existing Portland facility for the construction of a new commercial-scale DS production facility. We commenced
construction of this facility during the third quarter of 2016 and completed construction during the fourth quarter of 2017. Equipment
installation and qualification was initiated during the third quarter of 2017 and completed during the third quarter of 2018. Total construction
and equipment costs aggregated approximately $20.8 million. With construction of the facility complete, we continue to work with outside
parties to investigate improvements to our DS production yields as well as potential efficacy enhancements.
ImmuCell Corporation
Under
the FDA’s phased submission process, we made a first-phased submission covering just the DS during the first quarter of 2019. The
first-phased DS submission included data from the DS Registration Batches produced at commercial scale in our new DS manufacturing facility.
This first-phased submission was followed by a second-phased submission covering both DS and DP, during the first quarter of 2021. The
second-phased DS and DP submission responded to comments raised by the FDA regarding the first-phased DS submission and included detailed
information about the manufacturing process and controls for DP. One of the key components of the second-phased DS and DP submission
was also demonstrating stability of the product through expiry. During the third quarter of 2021, the FDA issued a Technical Section
Incomplete Letter with regard to this second-phased DS and DP submission. This response was not unexpected as it is common for the FDA
to issue queries and comments, especially related to an aseptic DP submission. We made a second submission of the DS and DP Technical
Section during the first quarter of 2022. During the third quarter of 2022, we received a Technical Section Incomplete Letter from the
FDA with regards to this second DS and DP submission of the CMC Technical Section. The submission required that internal and external
laboratories re-develop and qualify several analytical tests and associated controls. We made this third DS and DP submission of the
CMC Technical Section during the third quarter of 2023.
In
late October of 2023, the FDA notified us that it was refusing to review our submission because Norbrook was identified as the DP manufacturer
in our submission, but the FDA was expecting that we would identify our own in-house services as the DP manufacturer (instead of Norbrook).
This miscommunication was due to a statement in our April of 2022 response to an FDA 483 inspectional observation in which we noted that
Norbrook was expected to exit the DP manufacturing agreement with us at the end of 2022, which would have required us to procure and
install some long lead time equipment (filler and labeler) in our DS suite in late 2022. Instead, we were able to extend the agreement
with Norbrook to complete the manufacture of DP inventory for the initial commercial sales under our controlled launch strategy. As a
result, we continued to identify Norbrook as our DP manufacturer. In fact, Norbrook has recently substantially completed the production
of the launch goods, and this work has been extended into 2024 with final product packaging occurring post-approval. As a result of this
miscommunication, we were required to re-submit the CMC Technical Section in November of 2023. On May 10, 2024, the FDA issued a CMC
Technical Section Incomplete Letter (Incomplete Letter) to us. Pursuant to the Incomplete Letter, the FDA has provided some minor questions
about our submission requiring a re-submission of the CMC Technical Section, which is typically subject to a six-month review. However,
the FDA has indicated that this re-submission potentially could be handled through a shortened review period because the open items are
not complex. Having reviewed the Incomplete Letter, we agree with this assessment. Most critical to the timeline, however, is that the
FDA has also required that we not re-submit the CMC Technical Section until inspectional observations at the facilities of our DP contract
manufacturer are resolved. Given the unique facts and circumstances, we are working with the FDA and our DP contract manufacturer to
obtain an expedited review. If the FDA issues a Technical Section Complete Letter in response to this fourth submission, we believe that
we could commence commercial sales approximately three to four months later, allowing time for a two-month Administrative New Animal
Drug Application review period and product packaging and shipping.
While
being prudent with how much cash we invest into inventory that would have short expiry dating if market launch is delayed, we built more
DS inventory during 2022 and 2023 to support the initial commercial sales of Re-Tain®.
As discussed above, our contract manufacturer has agreed to convert this DS to DP into 2024. We anticipate a pause in the supply of product
to market after the initial launch goods are sold and before the product is re-launched with DP produced by our in-house aseptic filling
operations (if that investment is re-funded) or by an alternative contractor that we have not identified to date. We have produced adequate
inventory to implement our limited distribution, controlled launch strategy with expiration dating estimated at between the second quarter
of 2025 and the first quarter of 2026, subject to the final product shelf-life disposition by the FDA. We presently have no arrangement
in place to aseptically fill new DP inventory and are planning to reduce operating costs at our DS production facility until initial
market acceptance (and perhaps the interest of a marketing partner) justifies a new arrangement for aseptic filling and the production
of additional inventory.
Our
DS manufacturing facility and that of our DP contract manufacturer (and our potential future DP manufacturing facility) are subject to
ongoing FDA inspections. During the third quarter of 2019, the FDA conducted a pre-approval inspection of our DS facility. This resulted
in the issuance of certain deficiencies as identified on the FDA’s Form 483. We submitted responses and data summaries in a phased
manner over the fourth quarter of 2019 and first quarter of 2020. During the first quarter of 2022, the FDA conducted another pre-approval
inspection of our DS facility. This also resulted in the issuance of certain deficiencies as identified on the FDA’s Form 483.
We have responded to all of the queries. Early during the first quarter of 2024, the FDA conducted another pre-approval inspection of
our DS facility. This resulted in the issuance of one deficiency as identified on the FDA’s Form 483. Since then, we have fully
responded to this inspectional observation. The facility of our DP contract manufacturer is subject to similar inspectional compliance
obligations. As discussed above, a pre-approval inspection of that facility was conducted around the end of the first quarter of 2024.
We
have always believed that the fastest route to FDA approval and market launch is with the services of Norbrook (an FDA-approved DP manufacturer),
reducing our risk by benefiting from their demonstrated expertise in aseptic filling. From 2010 to the present, we have worked with Norbrook
under several amended contract manufacturing agreements covering the DP formulation, aseptic filling and final packaging services. Under
our current agreement, Norbrook is providing DP for our controlled launch with production into 2024. We believe this will enable us to
commence sales of Re-Tain®
without delay upon receipt of the anticipated FDA approval.
ImmuCell Corporation
Our
potential alternative third-party options for the formulation and aseptic filling services that are presently being performed by Norbrook
are narrowed considerably because our product cannot be formulated or filled in a facility that also processes traditional antibiotics
(i.e., beta lactams). During the first quarter of 2022, we initiated an investment in the installation of equipment to produce DP at
our own facility at 33 Caddie Lane. Given the loss in gross margin during the first ten months of 2023 caused by the slowdown in production
output that was necessary to remediate the production contamination events, we decided to defer the completion of this investment for
the time being. Subject to the timing of our installation and validation work, we anticipate FDA approval of this facility (which is
a requirement for commercial manufacturing) at least two years from when this project is restarted allowing for two six-month review
cycles. This will be a post-approval submission. If we decide to complete our potential future DP manufacturing facility, such facility
will, upon completion, be subject to FDA inspection and approval. We anticipate it would have enough formulation and aseptic filling
capacity to exceed the expected production capacity of our DS facility, which is approximately $7 million to $10 million in annual sales.
This production capacity estimate is based on our assumptions as to product pricing and does not yet reflect inventory build strategies
in advance of product approval or ongoing yield improvement initiatives. Establishing our own DP formulation and aseptic filling capability
would provide us with the longer-term advantage of controlling the manufacturing process for Re-Tain®
in one facility,
thereby potentially reducing our manufacturing costs and eliminating international cold chain shipping logistics and costs. The DP formulation
and aseptic filling operation, if completed, will be located in existing facility space that we had intended to utilize to double our
DS production capacity if warranted by sales volumes following market launch. As a result, if we decide to complete this DP facility
(rather than utilizing a third party for these services), we would need to explore alternative strategies (in parallel with ongoing DS
yield improvement initiatives) to expand our DS production capacity. This integrated manufacturing capability for Re-Tain®
would substantially reduce our dependence on third parties. Upon completion of our formulation
and aseptic filling facility, the only significant third-party input for Re-Tain® would
be the DP syringes. It is anticipated that Hubert De Backer of Belgium (HDB) will supply these syringes in accordance with purchase orders
that we submit. HDB is a syringe supplier for many of the largest participants in the human and veterinary medical industries, and with
whom Norbrook presently works. Based on HDB’s performance history and reputation in the industry, we are confident that HDB will
be a dependable supplier of syringes in the quantity and of the quality needed for Re-Tain®.
Other
product development initiatives: Our second most important product development initiative has been focused on other improvements, line
extensions or additions to our First Defense® product line. We are currently working to establish USDA claims for
our bivalent bulk powder formulation of First Defense Technology®. Subject to the availability of resources, we
intend to begin new development projects that are aligned with our core competencies and market focus. We also remain interested in acquiring,
on suitable terms, other new products and technologies that fit with our sales focus on the dairy and beef industries, subject to the
availability of the needed funding.
Sales
and Marketing Expenses and Selling Strategy
We
see ourselves as the “non-pharma” pharma company. Rather than offering variations of “copy-cat” technology like
vaccines and antibiotics, we have taken the path less traveled by developing first-of-their kind products fueled by novel active ingredients
such as polyclonal antibodies (for First Defense®) and bacteriocins (for Re-Tain®). While
we expect that Re-Tain® could be a significant market disrupter, we project the First Defense®
market could be larger, especially during the first years of the commercial launch of Re-Tain®. We anticipate
that these category developing innovations will drive greater value for the livestock industry and, in turn, for our stockholders.
During
the three-month period ended March 31, 2024, sales and marketing expenses decreased by 9%, or $79,000, to $801,000 in comparison to $879,000
during the three-month period ended March 31, 2023, amounting to 11% and 26% of product sales during the three-month periods ended March
31, 2024 and 2023, respectively. Sales and marketing expenses included non-cash depreciation and stock-based compensation expenses of
$44,000 and $48,000 during the three-month period ended March 31, 2024 and 2023, respectively. Our current budgetary guideline is to
keep these expenses under 20% of total sales. We continue to leverage the efforts of our small sales force by using animal health distributors.
ImmuCell Corporation
The
First Defense® product line serves dairy and beef producers by protecting their calf crop from scours, the leading
cause of pre-weaning mortality and morbidity. When calves are healthy during this crucial development period, they mature into more productive
milking cows and more efficient beef generators. Our primary competition in this category is vaccines that are also regulated for effectiveness
and safety by the USDA. However, vaccine results are inherently variable. COVID breakthrough infections in humans have reminded us that
a vaccine does not guarantee immunity. That is true for our competitors as well. In the most controlled research settings, only 80% of
animals respond to a vaccine. This leaves 20% of the calf crop unprotected when the scour prevention program relies on scour vaccines.
Those unprotected calves can be disease carriers. Not only are they more susceptible to death or likely to require life-saving treatment
(sometimes with antibiotics), but they also shed pathogens into the environment creating a greater disease pressure for their herd mates.
The First Defense® product line removes the inconsistency inherent with vaccine protection. We sell the only USDA-licensed
products in the scour prevention category that are therapeutic multi-valent polyclonal antibodies. This technology eliminates a producer’s
reliance on a variable vaccine response to generate antibodies and, instead, can protect every calf equally with a measured dose of antibody-driven
immunity against both bacterial and viral scour pathogens.
During
the twelve-month period ended December 31, 2023, we treated more calves than our next largest calf-level competitive product, which is
a vaccine administered to the newborn at birth. Compared to the dam-level competitive products (which are vaccines given to the cow pre-calving),
we are second in sales dollars to the market leader. Despite these successes, there remains significant opportunity to displace more
competition within North America. There is also opportunity to grow our sales by expanding into international markets. We are being strategic
in how we invest in international market development in order not to divert our limited resources away from achieving domestic growth,
which is often more efficient to obtain.
We
believe that Re-Tain® could revolutionize the way that mastitis is managed by making earlier treatment of subclinical
infections (while these cows are still producing saleable milk) economically feasible without an FDA-required milk discard or a meat
withhold during, or for a period of time after, treatment. No other FDA-approved mastitis treatment product on the market can offer this
value proposition. We believe we can demonstrate a return on investment to the dairy producer and the milk processor that will justify
a premium over other mastitis treatments on the market today, which are all sold subject to milk discard and meat withhold requirements.
By creating this value for our customers, we believe we can, in turn, create value for our stockholders.
Re-Tain®
could increase the lifetime profitability of a cow and reduce disease transfer to herd mates. It is common practice to move
sick cows from their regular herd group to a sick cow group for treatment and the related milk discard. This movement causes stress on
the cow and a reduction in milk production. While practices may vary farm-to-farm, there would be no requirement to move cows treated
with our product, allowing this costly drop in production to be avoided. It is generally current practice to treat mastitis only when
the disease has progressed to the clinical stage where the milk from an infected cow cannot be sold, leaving most subclinically infected
cows untreated. Without a milk discard cost, we expect producers to be more motivated to identify and treat cows at the subclinical stage.
This creates a substantial animal welfare benefit. By treating mastitis early at the subclinical level, producers could preserve optimal
milk yields. We also know that animals infected with subclinical mastitis have higher abortion rates and often progress to the clinical
disease state requiring antibiotic treatment and milk discard. We believe that societal animal welfare objectives will put more and more
pressure on the industry to treat cows with subclinical infections.
The
over-use of antibiotics that are medically important to human healthcare is a growing public health concern of our society and an active
issue with the FDA, largely because of the growing evidence that this over-use contributes to antibiotic resistance and the rise of “super-bugs”.
Sustainability objectives require that less antibiotics be used in food producing animals, yet a new FDA-approved drug to treat mastitis
has not been developed in years. Our product improves sustainability by utilizing a bacteriocin as an alternative to traditional antibiotics
that are used in human medicine. In the big picture, we are introducing an entirely new class of antimicrobial as an animal drug, a bacteriocin,
that does not promote resistance against antibiotics used in human medicine making it more socially responsible. The industry could keep
treating this very significant disease with traditional antibiotics, but it takes innovation to bring a bacteriocin like Nisin to market.
Re-Tain® would, when introduced, offer a needed alternative to these traditional antibiotics, while at the same
time improving milk quality and the quantity of milk produced by treated cows. We believe our product fits very well with where the industry
is going to be in the coming years.
ImmuCell Corporation
As
with all new products, the market determines the value. Our objective is to gain market acceptance of this new product concept as we
develop a new product category. Despite our product’s exciting benefits, it will take time to change this longstanding treatment
paradigm and develop this new market. It will take time for the market to understand, evaluate, implement and adapt to the use and benefits
of Re-Tain®. Based on consultations with industry experts and key opinion leaders, we have opted to carefully control
the launch of this novel product over the first 18 to 24 months or so after FDA approval, as we seek to transform the way that mastitis
is treated in the dairy industry over the long term. Our goal is to help early adopters select treatment candidates, develop easy to
use protocols, optimize treatment results and realize a positive return on their investment. We intend to limit initial distribution
of Re-Tain® to a level that enables our sales team to select the optimal dairy farms at which to introduce Re-Tain®
and to limit the initial number of participating farms so that the desired levels of support and guidance relating to effective
usage of Re-Tain® can be provided with our available resources. We recognize that it will be important to
manage expectations from the producer to the milk processor because it is possible that processors may express reservations with regards
to the zero milk discard claim. Our controlled launch strategy reduces the amount of inventory that we would need to build at risk before
regulatory approval is achieved. This strategic choice means that we have elected not to pursue an alternative strategy that might have
maximized short-term, initial sales quickly through a mass market approach where we provide product to distribution and let them sell
it to as many farms as possible. While we are dedicated to increasing our sales revenue, we must consider the damage a mass market strategy
could cause to the long-term value of the product. We have seen products sold by much larger companies that were substantially damaged
by such failed market launch strategies. We continue to develop detailed launch plans, focusing on the readiness of dairy operators to
successfully introduce Re-Tain® to their herds. We believe that these prudent steps, while potentially leading
to lower initial Re-Tain® revenues, may create a smooth and successful launch and could safeguard the longer term
performance of our investment in Re-Tain®. We also believe that the operational adjustments and accommodations
that dairy farmers will need to make to effectively use Re-Tain® and avoid the potential problems described under
PART II: OTHER INFORMATION, ITEM 1A – RISK FACTORS, to this Quarterly Report will not be so burdensome as to deter its adoption
and usage. Our overarching objective is to minimize the risk of early-stage unsatisfactory outcomes that could harm the longer-term prospects
and market acceptance of Re-Tain®.
Administrative
Expenses
During
the three-month period ended March 31, 2024, administrative expenses decreased by 6%, or $35,000, to $532,000 in comparison to $567,000
during the thee-month period ended March 31, 2023. Administrative expenses amounted to 7% and 16% of product sales during the three-month
periods ended March 31, 2024 and 2023, respectively. Administrative expenses included non-cash depreciation and stock-based compensation
expenses of $46,000 and $50,000 during the three-month periods ended March 31, 2024 and 2023, respectively. We strive to be efficient
with these expenses while funding all the legal, audit and other costs associated with being a publicly-held company. Given the growth
in our business, our administrative staff has increased to four employees reporting to our CEO. Prior to 2014, we had limited our investment
in investor relations spending. Beginning in the second quarter of 2014, we initiated an investment in a more active investor relations
program. Given travel restrictions related to the COVID-19 pandemic, this initiative has pivoted to a virtual meeting format, which is
less expensive. Having experienced this efficiency, it is our intent to continue with the same strategy, for the most part, even as travel
restrictions have been eliminated. At the same time, we continue to provide full disclosure of the status of our business and financial
condition in three quarterly reports and one annual report each year, as well as in Current Reports on Form 8-K when legally required
or deemed appropriate by management. We believe these efforts have helped us access the capital markets to fund our growth objectives.
Considering inflation and all the necessary support services that fit into this category, we believe that approximately $2 million to
$2.5 million per year is an efficient budget goal to fund the administrative expenses of a publicly-held company.
Net
Operating Loss
During
the three-month period ended March 31, 2024, our net operating loss of $300,000 was significantly less than our net operating loss of
$2.3 million during the three-month period ended March 31, 2023. The $2 million decrease in our net operating loss during the three-month
period ended March 31, 2024 compared to the three-month period ended March 31, 2023 was largely caused by the $2 million increase in
gross margin.
ImmuCell Corporation
Other
Expenses, net
During
the three-month period ended March 31, 2024, other expenses, net, aggregated $136,000 in comparison to other expenses, net, of $57,000
during the three-month period ended March 31, 2023. Interest expense increased to $146,000 during the three-month period ended March
31, 2024 from $90,000 during the three-month period ended March 31, 2023. Non-cash amortization of debt issuance and debt discount costs
(which is included as a component of interest expense) was $10,000 and $2,000 during the three-month periods ended March 31, 2024 and
2023, respectively. We anticipate that our interest expense will be approximately $566,000 and $494,000 during the years ending December
31, 2024 and 2025, respectively. Interest income was $10,000 and $41,000 during the three-month periods ended March 31, 2024 and 2023,
respectively. We incurred no loss on disposal of property, plant and equipment during the three-month period ended March 31, 2024 compared
to an $8,000 loss during the three-month period ended March 31, 2023.
Loss
Before Income Taxes
During
the three-month period ended March 31, 2024, our loss before income taxes was $437,000 in comparison to our loss before income taxes
of $2.3 million during the three-month period ended March 31, 2023.
Income
Taxes and Net Loss
During
the three-month periods ended March 31, 2024 and 2023, we recorded income tax expense of $1,000 and $2,000, respectively, which is comprised
of minimum state tax liabilities. Our net loss of $438,000, or $0.06 per basic share, during the three-month period ended March 31, 2024
was in comparison to net loss of $2.3 million, or $0.30 per basic share, during the three-month period ended March 31, 2023.
We
have substantial net operating loss carryforwards that largely offset future income tax expense. As of December 31, 2023, our federal
net operating loss carryforward was $17.8 million. As of December 31, 2023, our state net operating loss carryforward was $4.7 million.
On December 22, 2017, the Tax Cuts and Jobs Act was signed into law. This legislation made significant changes in the U.S. tax laws,
including a reduction in the corporate tax rates, changes to net operating loss carryforwards and carrybacks, and a repeal of the corporate
alternative minimum tax. The legislation reduced the U.S. corporate tax rate from 34% to 21%. Our income tax rate differs from this statutory
tax rate primarily because we are currently providing for a full valuation allowance against our deferred tax assets. While we are recording
this full valuation allowance, we are not recognizing the benefit of our tax losses.
In
addition to the results discussed above from our Statements of Operations, we believe it is important to consider our Statements of Cash
Flows in the accompanying unaudited financial statements to assess the cash generating ability of our operations.
Critical
Accounting Policies and Estimates
The
unaudited financial statements are presented on the basis of accounting principles that are generally accepted in the United States.
All professional accounting standards that were effective and applicable to us as of March 31, 2024 have been taken into consideration
in preparing the financial statements. The preparation of financial statements requires that we make estimates and judgments that affect
the reported amounts of assets, liabilities, revenues and expenses, and related disclosure of contingent assets and liabilities. On an
on-going basis, we evaluate our estimates. Significant estimates include our valuation of inventory, deferred tax assets and costs of
goods sold. We base our estimates on historical experience and on various other assumptions that we believe are reasonable under the
circumstances, the results of which form the basis for making judgments about the carrying values of assets and liabilities that are
not readily apparent from other sources. Actual results may differ from these estimates under different assumptions or conditions. We
have chosen to highlight certain policies that we consider critical to the operations of our business and understanding of our financial
statements. These critical accounting estimates have been consistently applied.
ImmuCell Corporation
We
sell products that provide Immediate Immunity™ to newborn dairy and beef cattle. We recognize revenue in accordance with
the five step model in ASC 606. These include the following: i) identification of the contract with the customer, ii) identification
of the performance obligations in the contract, iii) determination of the transaction price, iv) allocation of the transaction price
to the separate performance obligations in the contract and v) recognition of revenue associated with performance obligations as they
are satisfied. We recognize revenue at the time of shipment (including to distributors) for substantially all products, as title and
risk of loss pass to the customer on delivery to the common carrier after concluding that collectability is reasonably assured. We do
not bill for or collect sales tax because our sales are generally made to distributors and thus our sales to them are not subject to
sales tax. We generally have experienced an immaterial amount of product returns.
Inventory
includes raw materials, work-in-process and finished goods and is recorded at the lower of cost, on the first-in, first-out method, or
net realizable value (determined as the estimated selling price in the normal course of business, less reasonably predictable costs of
completion, disposal and transportation). Work-in-process and finished goods inventories include materials, labor and manufacturing overhead.
Inventory is a critical accounting policy because of the estimates and assumptions used by management to determine its cost accounting
and because of the variability of the cost per dose due to fluctuations in the biological yield.
ITEM
3 — QUANTITATIVE AND QUALITATIVE DISCLOSURES ABOUT MARKET RISK
Not
applicable
ITEM
4 — CONTROLS AND PROCEDURES
Disclosure
Controls and Procedures: Disclosure controls and procedures are designed to ensure that information required to be disclosed by us
in the reports that we file or submit under the Exchange Act is (i) recorded, processed, summarized and reported, within the time periods
specified in the SEC’s rules and forms and (ii) accumulated and communicated to our management, including our principal executive
and principal financial officer, as appropriate to allow timely decisions regarding required disclosures. Because of its inherent limitations,
internal control over financial reporting may not prevent or detect misstatements. Therefore, even those systems determined to be effective
can provide only reasonable assurance with respect to financial statement preparation and presentation. Also, projections of any evaluation
of effectiveness to future periods are subject to the risk that controls may become inadequate because of changes in conditions, or that
the degree of compliance with the policies or procedures may deteriorate. Our management, with the participation of the individual who
serves as our principal executive and principal financial officer, evaluated the effectiveness of our disclosure controls and procedures
(as defined in Exchange Act Rules 13a-15(e) and 15d-15(e) of the Securities Exchange Act of 1934, as amended (the Exchange Act)) as of
March 31, 2024. Based on this evaluation, that officer concluded that our disclosure controls and procedures were effective as of that
date.
Changes
in Internal Controls over Financial Reporting: Our principal executive and principal financial officer and our Director of Finance
and Administration periodically evaluate any change in internal control over financial reporting which has occurred during the prior
fiscal quarter. We have concluded that there was no change in our internal control over financial reporting that occurred during the
quarter ended March 31, 2024 that has materially affected, or is reasonably likely to materially affect, our internal control over financial
reporting.
ImmuCell Corporation
PART
II: OTHER INFORMATION
ITEM
1 - LEGAL PROCEEDINGS
In
the ordinary course of business, we may become subject to lawsuits, investigations and claims. Although we cannot predict with certainty
the ultimate resolution of any such lawsuits, investigations and claims against us, we do not believe that any pending or threatened
legal proceedings to which we are or could become a party will have a material adverse effect on our business, results of operations,
or financial condition.
ITEM
1A— RISK FACTORS
OUTLINE
TO ITEM 1A – RISK FACTORS
| - | Economic
Risks Pertaining to the Dairy and Beef Industries |
| - | Small
Size of the Company |
| - | Risk
Pertaining to Common Stock |
Financial
Risks
Gross
margin on product sales: One of our goals is to achieve a gross margin (before related depreciation expenses) as a percentage of
total sales of 45% or more after the initial launch of new products. Depreciation expense will be a larger component of costs of goods
sold for Re-Tain® than it is for the First Defense® product line. Gross margins generally
improve over time, but this anticipated improvement may not be realized for Re-Tain®. Many factors discussed in
this Quarterly Report (including inflation, cost increases, supply-chain disruptions and the rising price of oil and other commodities
and supplies) impact our costs of goods sold. There is a risk that we are not able to achieve our gross margin goals, which would adversely
affect our operating results and could impact our future operating plans. We missed our gross margin goals in 2023 and 2022 with realized
gross margins of 22% and 41%, respectively, and during the first quarter of 2024 with a realized gross margin of 32%. There is also a
risk that our plans to maintain or improve our gross margin may not be realized due to cost increases, production yield losses, additional
manufacturing contamination events, production equipment failures, the inability to raise our selling prices, or any combination of these
factors. In addition, such negative events, depending on their severity, could deplete our cash resulting in an inability to fund our
business.
Exposure
to interest rates and debt service obligations: Rising interest rates could negatively affect the operating costs of dairy and beef
producers and thus put further financial pressure on an already stressed business sector, which could indirectly, but materially and
adversely, affect our business. During the first quarter of 2020, we removed the direct aspect of this particular exposure to our business
by refinancing our bank debt (with the exception of our line of credit) with fixed rate notes. Our mortgage debt outstanding as of March
31, 2024 was $5.8 million bearing interest at the fixed rate of 3.53% per annum. Our equipment loans outstanding as of March 31, 2024
were $2.5 million bearing interest at the fixed rate of 3.5% per annum. The outstanding balance on the two State of Maine loans as of
March 31, 2024 was approximately $700,000 bearing interest at the fixed rate of 5% per annum. The $3 million in debt that we secured
during the third quarter of 2023 bears interest at the blended fixed rate of 7.33% per annum and had an outstanding balance of $2.8 million
as of March 31, 2024. Our outstanding debt as of March 31, 2024 aggregating $11.7 million bears interest at the blended fixed rate of
4.51% per annum. Increasing interest rates would negatively impact the cost of any future borrowings. This was experienced on the new
debt facilities aggregating $3 million that we closed during the third quarter of 2023. A decline in sales or gross margin, coupled with
this debt service burden, could impair our ability to fund our capital and operating needs and objectives. The additional debt we incurred
to fund our growth objectives has significantly increased our total debt service costs. We are obligated to make principal and interest
payments aggregating approximately $2.0 million during both of the years ending December 31, 2024 and 2025. See Note 10 to the accompanying
unaudited financial statements for more details about our debt.
ImmuCell Corporation
Debt
covenants: Our bank debt is subject to certain financial covenants. We are required to meet a minimum debt service coverage (DSC)
ratio of 1.35. Our actual DSC ratios were (1.10), 0.44, 2.68 and 2.03 for the years ended December 31, 2023, 2022, 2021 and 2020, respectively.
Our actual DSC ratio was (0.14) for the trailing twelve-month period ended March 31, 2024. There can be no assurance that we can exceed
the required level in subsequent years. During the first quarter of 2023, the DSC ratio covenant for the year ending December 31, 2023
was waived by our lender. Instead, we were required to meet a minimum DSC ratio requirement of 1.35 for the twelve-month periods ending
June 30, 2024, September 30, 2024 and December 31, 2024, and then again annually after that. During the first quarter of 2024, the DSC
ratio covenant for the twelve-month period ending June 30, 2024 was preemptively waived by our lenders. If we are unable to achieve the
required DSC ratio going forward or reach a favorable agreement with our lenders regarding that requirement (including an amendment to
or waiver of such requirement), we would be in violation of that covenant, which could result in unfavorable amendments to the terms
of our bank debt or have other adverse impacts on our business and results of operations.
Currency
exchange fluctuation: We do not believe that currency exchange rates have had a significant effect on our revenues and expenses.
However, future increases in the value of the U.S. dollar could affect our customers and the demand for our products. We hope to increase
the level of our future sales of products outside the United States. The cost of our products to international customers could be affected
by currency fluctuations. The decline of the U.S. dollar against other currencies could make our products less expensive to international
customers. Conversely, a stronger U.S. dollar could make our products more costly for international customers. A weaker U.S. dollar makes
international purchases more expensive for us.
Inflation,
supply disruptions, tax rates and economic downturns: Inflation is having a material and adverse impact on almost all supplies we
purchase and labor we hire and retain. Continuing or increasing inflationary trends could materially reduce our gross margin on product
sales if we are unable or unwilling to impose offsetting price increases on our customers. The Consumer Price Index for All Urban Consumers
(CPI-U) during the year ended December 31, 2023, improved to 3.4% for all items before seasonal adjustment. This is down from 6.5% and
7.0% during the years ended December 31, 2022 and 2021, respectively. We are facing significant production constraints, supply disruptions
and inflationary increases which were initially triggered, in large part directly or indirectly, by the COVID-19 pandemic. The extent
and duration of the negative impact on the economics of our customers and on the demand for our products going forward are very difficult
to assess. The dairy market, similar to many others, has been unstable as a result of the pandemic. The price paid to producers for milk
has been very volatile. The Class III milk price has been extremely volatile since the onset of the pandemic. Market conditions have
improved somewhat, but this volatility remains a concern. Additionally, like most input costs, the cost of grain and other feed is rising,
which puts a strain on the profitability of our customers. There is also economic uncertainty for beef producers, as the supply chain
is interrupted or otherwise adversely affected due to closures of processing plants and reduced throughput. This is a very unusual situation
for farmers who work so hard to improve production quality and efficiency in order to help feed a growing population with high-quality
and cost-effective proteins. The pandemic created risk and continues to create uncertainty and challenges for us and has created or contributed
to global supply-chain disruptions and has affected international trade, while creating a worldwide health and economic crisis. Stock
market valuations have declined and recovered somewhat but remain very volatile. Inflation has increased significantly, and tax rates
may increase. There is a risk of a period of economic downturn, the severity and duration of which are difficult to know. Prior to the
pandemic and the responsive federal economic stimulus programs, many feared the United States had taken on too much national debt. Now
the debt load is significantly higher. A combination of the conditions, trends and concerns summarized above could have a corresponding
negative effect on our business and operations, including the supply of the colostrum we purchase to produce our First Defense®
product line, the demand for our products in the U.S. market and our ability to penetrate or maintain a profitable presence
in international markets. We are experiencing shortages in key components and needed products, backlogs and production slowdowns due
to difficulties accessing needed supplies and labor and other restrictions which increase our costs and affect our ability to consistently
deliver our products to market in a timely manner. Our exposure to this risk is mitigated to some extent by the fact that our supply
chain is not heavily dependent on foreign manufacturers, by our on-going cross-training of our employees, by qualifying alternate suppliers
and components and by our early and continued compliance with recommended hygiene.
Projection
of net (loss) income: Generally speaking, our financial performance can differ significantly from management projections, due to
numerous factors that are difficult to predict or that are beyond our control. Weaker than expected sales of the First Defense®
product line could lead to deeper operating losses or less profits. The timing of FDA approval of Re-Tain®
will have a material impact on our net (loss) income until sufficient commercial sales are generated and sustained.
ImmuCell Corporation
Risks
associated with our funding strategy for Re-Tain®: The inability to maintain adequate cash and
liquidity to support the commercialization of Re-Tain® is a risk to our business. Achieving FDA approval of our
pharmaceutical-grade Nisin produced at commercial-scale is the most critical action remaining in front of us on our path to U.S. regulatory
approval of Re-Tain®. Having completed the construction and equipping of the DS production facility (as described
in more detail in PART I: ITEM 2 of this Quarterly Report) at a cost of approximately $20.8 million, we will continue to incur
product development expenses to operate and maintain this facility until commercialization. Absent sufficient sales of Re-Tain®
at a profitable gross margin, we would be required to fund all debt service costs from available cash and sales of the First
Defense® product line, which would reduce, and could eliminate, our expected profitability going forward and significantly
reduce our cash flows.
Uncertainty
of market size and product sales estimates: Estimating the size of the total addressable market and future sales growth potential
for our First Defense® product line is based on our experience and understanding of market dynamics but is inherently
subjective. Estimating the size of the market for any new product, such as Re-Tain®, involves more uncertainties
than do projections for established products. We do not know whether, or to what extent, our products will achieve, maintain or increase
market acceptance and profitability. Some of the uncertainties surrounding Re-Tain® include the product’s
effectiveness against currently prevalent pathogens, market acceptance, the effect of a premium selling price on market penetration,
cost of manufacture, competition from new and existing products sold by substantially larger competitors with greater market reach and
promotional resources and other risks described under “Product Risks” – “Sales risks pertaining to Re-Tain®”
below. Since Re-Tain® is a novel approach to treating mastitis, there are many uncertainties with regards to how
quickly and to what extent we can develop the subclinical mastitis treatment market. We believe that polypeptide antimicrobial technology
may be viewed positively (relative to traditional antibiotics). If realized, this may offset some of these risks and result in better
overall market acceptance.
Net
deferred tax assets: The realizability of our net deferred tax assets is a subjective estimate that is contingent upon many variables.
During the second quarter of 2018, we recorded a full valuation allowance against our net deferred tax assets that significantly increased
our net loss in comparison to other periods. This non-cash expense could be reversed, and this valuation allowance could be reduced or
eliminated, if warranted by our actual and projected profitability in the future. We will continue to assess the need for the valuation
allowance each quarter.
Product
Risks
Product
risks generally: We set objectives for our products that we believe we can achieve, but the achievement of such goals is not a certainty.
The sale of our products is subject to production, financial, efficacy, regulatory, competitive and other market risks. Elevated standards
to achieve and maintain regulatory compliance required to sell our products continue to evolve. Failure to achieve acceptable biological
yields from our production processes can materially increase our costs of goods sold and reduce our production output, leading to lower
margins and/or an order backlog that could adversely affect our customer relationships and operating results. First Defense®
is sold, and we expect Re-Tain® to be sold, at significant price premiums relative to competitive products.
There is no assurance that we will continue to achieve market acceptance of the First Defense® product line, or
achieve and sustain market acceptance of Re-Tain®, at a profitable price level or that we can continue to manufacture
our products at a low enough cost to result in a sufficient gross margin to justify their continued manufacture and sale. As we bring
Re-Tain® to market, these risks could be heightened by the additional uncertainties associated with introducing
a new product requiring a shift in customer behavior.
Contamination
events and equipment failures in our production process: During 2023 and 2022, we experienced certain contamination events and equipment
failures in our production process that resulted in scrapped inventory and a slowdown of our production process and had a significant
impact on our operating results. We are at risk of further such production contaminations or equipment failures resulting in more scrapped
inventory if we do not continue to improve our farm operations and implement other necessary improvements from farms to finished goods.
The realization of this risk following the above-mentioned contamination events did result in a slowdown of our production output during
2023 to remediate this problem, which led to less sales and gross margin during the year. Additional contamination events or equipment
failures causing significantly less production output, depending on their severity, could deplete our cash resulting in an inability
to fund our business operations.
ImmuCell Corporation
Sales
risks pertaining to Re-Tain®: Actual or prospective Re-Tain® customers
may decide to discontinue, reduce or avoid usage of Re-Tain® due to the following risks:
1)
A rejection of a tank of milk by a positive milk inhibitor test because too much of the milk in a bulk tank is comprised of milk from
cows being treated with Re-Tain®, when tested randomly for inhibitors by a milk hauler, which could create legal
liability.
2)
A failed or stalled cheese tank occurs when a Nisin susceptible cheese starter culture is impacted by residues in milk that exceed our
on-farm treatment recommendations, which aims to limit concentrations of bulk tanks or tankers to 1% of milk from cows treated with Re-Tain®
or is not effectively diluted through the milk collection and transportation system. After we study this potential impact during
our controlled launch of Re-Tain®, we may decide to seek a post-approval label change requiring a short discard
of milk, which may be limited to just the treated quarter of the cow.
3)
Producers’ current practice generally is to treat only clinical mastitis, which has the visual indicator of abnormal milk. In order
to gain market penetration for Re-Tain®, we will need to change that practice and increase awareness of the importance
of treating subclinical disease. This will require the producers’ ability and willingness to diagnose without visual indicators.
Users of Re-Tain® could have unsatisfactory treatment outcomes if they lack the equipment needed to measure and
monitor somatic cell counts (SCC) of the herd or individual cows (for which data is needed). This risk limits our access to treatment
cows because about 40% of farms do not presently have access to this kind of testing at the cow level, and thus are not good candidates
for the use of Re-Tain®.
4)
Lower than anticipated treatment cure rates could be experienced because the product is administered to cows that we would not identify
as the best treatment candidates based on SCC data.
5)
Lower than anticipated treatment cure rates could be experienced because the product is administered to cows that are infected with pathogens
outside of our label claims.
6)
Off-label use of our product in cows infected with clinical mastitis before we have run the required studies and achieved a label claim
extension for this disease state, resulting in negative treatment outcomes and potential legal liability.
7)
Producers either do not choose to use it or might use it improperly, rather than follow our label instructions to administer one dose
after each of three consecutive milkings, or they may limit use within the herd in an abundance of caution to avoid the negative outcomes
described above.
Reliance
on sales of the First Defense® product line: We are reliant on the market acceptance of the First Defense®
product line to generate product sales and fund our operations. Our business would not have been profitable during the years
ended December 31, 2012, 2013, 2015 and 2016, during the nine-month periods ended September 30, 2017 or during the three-month periods
ended March 31, 2019, December 31, 2020, June 30, 2021, September 30, 2021, December 31, 2021 and March 31, 2022 without the gross margin
that we earned on sales of the First Defense® product line. Our anticipated return to more consistent profitability
is contingent upon the gross margin we earn from First Defense®.
Concentration
of sales: Sales of the First Defense® product line aggregated 99% of our total product sales during both of
the years ended December 31, 2023 and 2022 and during both of the three-month periods ended March 31, 2024 and 2023. Our primary customers
for the majority of our product sales (91% and 92% during the years ended December 31, 2023 and 2022, respectively, and 87% during both
of the three-month periods ended March 31, 2024 and 2023) are in the U.S. dairy and beef industries. Product sales to international customers,
who are also in the dairy and beef industries, aggregated 9% and 8% of our total product sales during the years ended December 31, 2023
and 2022, respectively, and 13% during both of the three-month periods ended March 31, 2024 and 2023. The concentration of our sales
from one product into just two markets (the dairy and beef markets) is a risk to our business. The animal health distribution segment
has been aggressively consolidating over the last few years, with larger distributors acquiring smaller distributors. A large portion
of our product sales (79% and 73% during the years ended December 31, 2023 and 2022, respectively, and 80% and 77% during the three-month
periods ended March 31, 2024 and 2023, respectively) was made to two large distributors. A large portion of our trade accounts receivable
(76% and 79% as of March 31, 2024 and December 31, 2023, respectively) was due from these two distributors. We have a good history with
these distributors, but the concentration of sales and accounts receivable with a small number of customers does present a risk to us,
including risks related to such customers experiencing financial difficulties or altering the basis on which they do business with us
in a manner unfavorable to us.
ImmuCell Corporation
Production
capacity constraints: We invested $3.7 million from 2019 to the first quarter of 2022 to increase our production capacity (in terms
of annual sales dollars) for the First Defense® product line from approximately $16.5 million to approximately
$23 million based on current selling prices and estimated production yields. During the fourth quarter of 2021, we reached this new,
higher level of production output on an annualized basis. During 2021, we initiated three additional investments aggregating $4.7 million
to increase our estimated annual production capacity for the First Defense® product line to approximately $30 million,
which we completed at the end of 2022. We are making initial plans and investments to further increase our production capacity in 2025
and after. While this capacity expansion investment has proceeded very close to budget, there is a risk of cost overruns in our ongoing
projects and any future production expansions that we may undertake, and a risk that we will not be able to achieve our production capacity
growth objectives on a timely basis, resulting in a continuing or increasing shortfall in supply to the market. The inability to meet
market demand for our products is a risk to our business. The historically large backlog of orders, as well as any ongoing order backlog,
presents a risk that we could lose customers during this period that are not easily regained thereafter, when our production capacity
is expected to meet or exceed sales demand. Our long-term capital plan to continue to expand the First Defense®
product line requires ongoing review of equipment capacity and utilization across the manufacturing value stream at the 56 Evergreen
Drive facility and our leased facilities at 175 Industrial Way, as well as assessment of costs, functional obsolescence and reliability
of equipment. This review and assessment could identify a need to fund unexpected equipment maintenance or replacement costs.
Product
liability: The manufacture and sale of our products entails a risk of product liability. Our exposure to product liability is mitigated
to some extent by the fact that our products are directed towards the animal health market. We have maintained product liability insurance
in an amount which we believe is reasonable in relation to our potential exposure in this area. We have no history of claims of this
nature being made.
Regulatory
Risks
Regulatory
requirements for the First Defense® product line: First Defense® is sold in the United
States subject to a product license from the Center for Veterinary Biologics, USDA, which was first obtained in 1991, with subsequent
approvals of line extensions in 2017 and 2018. As a result, our operations are subject to periodic inspection by the USDA, and we are
at risk of an unfavorable outcome from such inspections. The potency of serial lots is directly traceable to the original serial used
to obtain the product performance claims (the Reference Standard). Due to the unique nature of the label claims, host animal re-testing
is not required as long as periodic laboratory analyses continue to support the stability of stored Reference Standard. To date, these
analyses have demonstrated strong stability. However, if the USDA were not to approve requalification of the Reference Standard, additional
clinical studies could be required to meet regulatory requirements and allow for continued sales of the product, which could interrupt
sales and adversely affect our operating results. Territories outside of the United States may require additional regulatory oversight
that we may not be able to meet with our current facilities, processes and resources. During July 2023, the USDA issued a Voluntary Stop
Distribution and Sale (VSDS) and a Hold Release on First Defense® preventing us from shipping product (while not
restricting us from continuing to produce inventory) until two inspectional observations were resolved. We promptly responded to the
inspectional observations involved. On August 1, 2023, the USDA verbally rescinded the VSDS, and on August 4, 2023, the USDA verbally
rescinded the Hold Release, allowing us to resume normal shipping during the week of August 7, 2023. There is a risk that we will become
subject to similar or additional regulatory actions in the future. In these cases, the resulting interruption in sales could have a material
and adverse effect on our operating results.
Regulatory
requirements for Re-Tain®: The commercial introduction of this product in the United States requires
us to obtain FDA approval. Completing the development through to approval of the NADA by the FDA involves risk. While four of the five
required Technical Sections have been approved, the regulatory development process timeline has been extensive (approximately 16 years
from when the product rights were returned to us by a former partner in 2007) and has involved multiple commercial production strategies
and multiple submissions of the Chemistry, Manufacturing and Controls (CMC) Technical Section. We received an Incomplete Letter from
the FDA regarding this CMC Technical Section during the third quarter of 2022 that clarified the required path to product approval. During
May of 2024, we received an Incomplete Letter from the FDA in response to our November of 2023 re-submission. To reduce the risk associated
with this process, we are working with a qualified contract manufacturer (Norbrook) for alignment of the required validations and DP
manufacture and have met with the FDA to clarify filing strategy and requirements. Early during the first quarter of 2024, the FDA conducted
another pre-approval inspection of our DS facility. This resulted in the issuance of one deficiency as identified on the FDA’s
Form 483. Since then, we have fully responded with data addressing the inspectional observation. However, our efforts continue to be
subject to inspection and approval by the FDA and other factors outside of our control, and there remains a risk that the required FDA
approvals of our product and facilities could be delayed or not obtained. The facility of our contract manufacturer is subject to similar
inspectional obligations. International regulatory approvals would be required for sales of Re-Tain® outside of
the United States, and there is a risk that these approvals would be or become too costly to pursue or be delayed or not obtained.
ImmuCell Corporation
Regulatory
requirements limiting access to suppliers and customer base: Maine, where our principal executive office and manufacturing
facilities are located, has adopted product reporting and phase-out requirements for per- and polyfluoroalkyl substances
(“PFAS”). Maine’s statute establishes a phased ban for products that contain intentionally added PFAS, with all
products (subject to certain exceptions) other than cooling, heating, ventilation, air conditioning or refrigeration equipment being
banned by 2032 unless the Maine Department of Environmental Protection (“DEP”) has determined that the use of PFAS
within the product is a “currently unavoidable use.” Beginning January 1, 2032, the sale of products containing
intentionally added but “currently unavoidable” PFAS also is banned if the manufacturer of such products has failed to
report to the DEP information concerning the presence of PFAS in those products. The phased bans may limit our ability to access
supplies and may limit those customers to whom we may sell our products. The U.S. Environmental Protection Agency also has adopted a
PFAS reporting law, which requires that importers of articles that contain PFAS report the presence of such substances to the extent
such information is known or reasonably ascertainable. This reporting requirement may limit our ability to import
supplies.
Economic
Risks Pertaining to the Dairy and Beef Industries
The
industry data referred to below is compiled from USDA databases.
Cattle
count: The January count of all cattle and calves in the United States had steadily declined from 97,000,000 as of January 1, 2007
to 88,500,000 as of January 1, 2014. Then this figure increased each year, reaching 94,800,000 as of January 1, 2019 before declining
to 93,800,000 as of both January 1, 2020 and January 1, 2021. This count continued to decline to 92,100,000 as of January 1, 2022 and
to 88,800,000 as of January 1, 2023. This count dropped to 87,200,000 as of January 1, 2024. Reflecting seasonal trends, this figure
was equal to 102,000,000, 101,000,000, 98,600,000 and 95,900,000 as of July 1, 2020, 2021, 2022, and 2023, respectively. A significant
decline in the cattle count could negatively affect the size of our addressable market.
Herd
size: Prior to 1957, there were over 20,000,000 cows in the U.S. dairy herd. Prior to 1986, there were over 10,000,000 cows in the
U.S. dairy herd. From 1998 through 2021, the size (annual average) of the U.S. dairy herd ranged from the low of 9,011,000 in 2004 to
the high of 9,448,000 in 2021. This average declined to 9,402,000 during the year ended December 31, 2022 and then declined to 9,386,000
during the year ended December 31, 2023. This average declined slightly to 9,333,000 during the three-month period ended March 31, 2024.
A significant decline in the herd size could negatively affect the size of our addressable market.
Milk
cow price: The all-time high value (annual average) for a milk cow was $1,993 during 2015. Since then, this annual average value
steadily declined to $1,205 during 2019 before increasing to $1,300 during 2020 and to $1,363 during 2021. This price for 2022 increased
significantly to an average of $1,598, which is a 17% increase over 2021. The 2023 average price of $1,763 represents a 10% increase
over prior year. This average price increased to $2,005 during the four-month period ended April 30, 2024. A significant decline in the
milk cow price could negatively affect the size of our addressable market.
Milk
price: The dairy market, similar to many others, has been unstable for several reasons including as a result of the pandemic. The
price paid to producers for milk has been very volatile. This market volatility, and the resulting impact on our primary end users, could
negatively impact our ability to maintain and grow sales at a profitable level. The Class III milk price (an industry benchmark that
reflects the value of product used to make cheese) is an important indicator because it defines our customers’ revenue level. This
annual average milk price level (measured in dollars per hundred pounds of milk) reached its highest point (since these prices were first
reported in 1980) during 2014 at $22.34 (peaking at $24.60 in September 2014), which price level has never been repeated. During the
year ended December 31, 2020, this average milk price was equal to $18.16, but it was extremely volatile during the year due largely
to disruption in demand related to the COVID-19 pandemic. The one-month fluctuation of 73% from a low of $12.14 in May 2020 to $21.04
in June 2020 set an all-time record for variability. The average price for 2021 decreased by 6% to $17.08. This price average increased
by 29% to $21.96 during the year ended December 31, 2022. The average price decreased by 22% to $17.02 during the year ended December
31, 2023. The average price declined to $15.77 during the four-month period ended April 30, 2024. The annual fluctuations in this milk
price level are demonstrated in the following table:
Average
Class III Milk Price During the Years Ended December 31, | |
(Decrease)
Increase | |
| 2014 | |
$ | 22.34 | |
| | |
| 2015 | |
$ | 15.80 | |
| (29) | % |
| 2016 | |
$ | 14.87 | |
| (6) | % |
| 2017 | |
$ | 16.17 | |
| 9 | % |
| 2018 | |
$ | 14.61 | |
| (10) | % |
| 2019 | |
$ | 16.96 | |
| 16 | % |
| 2020 | |
$ | 18.16 | |
| 7 | % |
| 2021 | |
$ | 17.08 | |
| (6) | % |
| 2022 | |
$ | 21.96 | |
| 29 | % |
| 2023 | |
$ | 17.02 | |
| (22) | % |
ImmuCell Corporation
Feed
Costs: The actual level of milk prices may be less important than its level relative to feed costs. One measure of this relationship
is known as the milk-to-feed price ratio, which represents the amount of feed that one pound of milk can buy. An increase in feed costs
also has a negative impact on the beef industry and therefore could have a resulting negative impact on our business and results of operations.
This ratio varies farm-to-farm based on individual operating parameters. Since this ratio reached 3.24 in 2005, it has not exceeded 3.00.
This ratio averaged 1.74 for 2021, amounting to a significant decline of 25% from the 2020 average of 2.32. This average has not been
lower since 2012. During 2022, this ratio improved by 10% to 1.91. This ratio dropped to 1.69 during the year ended December 31, 2023.
This ratio increased to 2.09 during the three-month period ended March 31, 2024. The following table demonstrates the annual volatility
and the low values of this ratio recently:
Average
Milk-To-Feed Price Ratio During the Years Ended December 31, | |
(Decrease)
Increase | |
| 2014 | |
| 2.54 | |
| | |
| 2015 | |
| 2.14 | |
| (16) | % |
| 2016 | |
| 2.26 | |
| 6 | % |
| 2017 | |
| 2.42 | |
| 7 | % |
| 2018 | |
| 2.05 | |
| (15) | % |
| 2019 | |
| 2.25 | |
| 10 | % |
| 2020 | |
| 2.32 | |
| 3 | % |
| 2021 | |
| 1.74 | |
| (25) | % |
| 2022 | |
| 1.91 | |
| 10 | % |
| 2023 | |
| 1.69 | |
| (12) | % |
Market
volatility: While the number of cows in the U.S. herd and the production of milk per cow directly influence the supply of milk, the
price for milk is also influenced by very volatile international demand for milk products. Given our focus on the dairy and beef industries,
the volatile market conditions and the resulting financial insecurities of our primary end users are risks to our ability to maintain
and grow sales at a profitable level. These factors also heighten the challenge of selling premium-priced animal health products (such
as Tri-Shield® and Re-Tain®) into the dairy market.
Small
Size of the Company
Dependence
on key personnel: We are a small company with approximately 80 employees (including 6 part-time employees). As such, we rely on certain
key employees to support multiple operational functions, with limited redundancy in capacity. The loss of any of these key employees
could adversely affect our operations until a qualified replacement is hired and trained, which could be even more challenging in the
present difficult labor market. Our competitive position will be highly influenced by our ability to attract, retain and motivate key
scientific, manufacturing, managerial and sales and marketing personnel. We will require increased staffing levels to operate our expanded
First Defense® production capacity and to operate our Re-Tain® production facility. The cost
of attracting and retaining the needed additional personnel in this current job market and inflationary environment could adversely affect
our margins and profitability.
Reliance
on outside party to provide certain services under contract for us: We are exposed to additional regulatory compliance risks through
the subcontractors that we choose to work with to produce Re-Tain®, who also need to satisfy certain regulatory
requirements in order to provide us with the products and services we need. One example of this outside reliance is Norbrook, our DP
contract manufacturer. Because Norbrook notified us of its intent to terminate its supply agreement with us, we initiated an investment
of approximately $4 million during 2022 to construct and equip our own DP formulation and aseptic filling capability for Re-Tain®
in our existing DS facility. Due to the loss in gross margin during 2023 caused by the slowdown in production output necessary
to remediate product contamination events, we have decided to defer spending of approximately $2 million of these funds for the near
term. The objective of this investment is to end our reliance on an outside party to perform these services for us. Actual project costs
could exceed our current estimates. Completion of this project could be delayed due to a number of factors outside our control, including
delays in equipment fabrication, equipment delivery or facility construction. In addition, there is a risk that we fail to achieve regulatory
approval of the new facility or that such approval is delayed or requires significant additional expenditures to obtain. We are evaluating
alternatives for DP supply going forward, which include the resumption of the investment in our own in-house DP services (when prudent
based on our cash reserves) or another contract manufacturing agreement or a further extension with Norbrook. We anticipate a supply
interruption under our controlled launch of Re-Tain® after the DP supply provided from our contract manufacturer
is consumed and until new supply from a new contract manufacturing agreement or our own formulation and aseptic filling facility is implemented.
ImmuCell Corporation
Competition
from others: Many of our competitors are significantly larger and more diversified in the relevant markets than we are and have substantially
greater financial, marketing, manufacturing and human resources and more extensive product development and sales/distribution capabilities
than we do, including greater ability to withstand adverse economic or market conditions and declining revenues and/or profitability.
Merck and Zoetis, among other companies, sell products that compete directly with the First Defense® product line
in preventing scours in newborn calves. The scours product sold by Zoetis sells for approximately half the price of our product, although
it does not have an E. coli claim (which ours does). With Tri-Shield®, we can compete more effectively against
vaccines that are given to the mother cow (dam) to improve the quality of the colostrum that she produces for the newborn calf. Elanco,
Merck and Zoetis provide these dam vaccine products to the market. There are many companies competing in the mastitis treatment market,
most notably Boehringer Ingelheim, Merck and Zoetis. The subclinical mastitis products sold by these large companies are well established
in the market and are priced lower than what we expect for Re-Tain®, but all of them involve traditional antibiotics
and are sold subject to a requirement to discard milk during and for a period of time after treatment (unlike our product which does
not carry an FDA-required milk discard or meat withhold). There is no assurance that our products will compete successfully in these
markets. We may not be aware of other companies that compete with us or intend to compete with us in the future.
Global
Risks
Russia’s
unprovoked military invasion of Ukraine and the war in the Middle East: Russia’s unprovoked military invasion of Ukraine (and
attack on its people) and the war in the Middle East are having a significant negative impact on the world economy, worsening trends
that were already moving in an unfavorable direction. Among other exposures, the increasing price of oil is already impacting our transportation-related
expenses materially, and we expect this supply stress to increase the cost of petroleum-based products that we purchase (mostly plastics).
Both of these military actions could cause more stress on the global economy.
Climate
change: Our business, and our activities and the activities of our customers and suppliers, could be disrupted by climate change.
Potential physical risks from climate change may include altered distribution and intensity of rainfall, prolonged droughts or flooding,
increased frequency of wildfires and other natural disasters, rising sea levels, and a rising heat index, any of which could cause negative
impacts to our and our customers’ and suppliers’ businesses. Increased temperatures and rising water levels may negatively
impact our dairy and beef livestock customers by increasing the prevalence of parasites and diseases that affect food animals. The physical
changes caused by climate change may also prompt changes in regulations or consumer preferences which in turn could have negative consequences
for our and our customers’ businesses. Climate change may negatively impact our customers’ operations, through climate-related
impacts such as increased air and water temperatures, rising water levels and increased incidence of disease in livestock. In addition,
concerns regarding greenhouse gas emissions and other potential environmental impacts of livestock production have led to some consumers
opting to limit or avoid consuming animal products. If such events affect our customers’ businesses, they may purchase fewer of
our products, and our revenues may be negatively impacted. Climate driven changes could have a material adverse impact on the financial
performance of our business and on our customers. In addition, increased frequency of natural disasters and adverse weather conditions
may disrupt our manufacturing processes or our supply chain. These disruptions may have a material adverse effect on our business, financial
condition, results of operations and/or cash flows.
Bovine
diseases: The potential for epidemics of bovine diseases such as Highly Pathogenic Avian Influenza (HPAI), Foot and Mouth Disease,
Bovine Tuberculosis, Brucellosis and Bovine Spongiform Encephalopathy (BSE) presents a risk to us and our customers. Documented cases
of BSE in the United States have led to an overall tightening of regulations pertaining to ingredients of animal origin, especially bovine.
The First Defense® product line is manufactured from bovine milk (colostrum), which is not considered a BSE risk
material. Future regulatory action to increase protection of the human food supply could affect the First Defense®
product line, although presently we do not anticipate that this will be the case.
ImmuCell Corporation
Risks
Pertaining to Common Stock
Stock
market valuation and liquidity: Our common stock trades on The Nasdaq Capital Market (Nasdaq: ICCC). Our average daily trading volume
(which was 7,845 shares per day during the 20-day period ended May 3, 2024) is lower, our bid/ask stock price spread can be larger and
our share price can be more volatile than what other companies experience, which could result in investors facing difficulty selling
their stock for proceeds that they may expect or desire. Our share price as of May 3, 2024 was $5.03. Most companies in the animal health
sector have market capitalization values that greatly exceed our market capitalization of approximately $39 million as of May 3, 2024.
Our product sales during the trailing twelve-month period ended March 31, 2024 were $21.3 million. This means that our market capitalization
as of May 3, 2024 was equal to approximately 2 times our sales during the trailing twelve-month period ended March 31, 2024. Before gross
margin from the sale of new products is achieved, our market capitalization may be heavily dependent on the perceived potential for growth
from our product under development and may therefore be negatively affected by the related uncertainties and risks.
Certain
provisions might discourage, delay or prevent a change in control of our Company or changes in our management: Provisions of our
certificate of incorporation, our bylaws, our Common Stock Rights Plan or Delaware law may discourage, delay or prevent a merger, acquisition
or other change in control that stockholders may consider favorable, including transactions in which stockholders might otherwise receive
a premium for their shares of our common stock. These provisions may also prevent or frustrate attempts by our stockholders to replace
or remove our management. These provisions include:
| ● | limitations
on the removal of directors; |
| ● | advance
notice requirements for stockholder proposals and nominations; |
| ● | the
ability of our Board of Directors to alter or repeal our bylaws; |
| ● | the
ability of our Board of Directors to refuse to redeem rights issued under our Common Stock
Rights Plan or otherwise to limit or suspend its operation that would work to dilute the
stock ownership of a potential hostile acquirer, potentially preventing acquisitions that
have not been approved by our Board of Directors; and |
| ● | Section
203 of the Delaware General Corporation Law, which prohibits a publicly-held Delaware corporation
from engaging in a business combination with an interested stockholder (generally defined
as a person which together with its affiliates owns, or within the last three years has owned,
15% of our voting stock, for a period of three years after the date of the transaction in
which the person became an interested stockholder) unless the business combination is approved
in a prescribed manner. |
The
existence of the foregoing provisions and anti-takeover measures could depress the trading price of our common stock or limit the price
that investors might be willing to pay in the future for shares of our common stock. They could also deter potential acquirers of our
Company, thereby reducing the likelihood of obtaining a premium for our common stock in an acquisition.
No
expectation to pay any dividends or repurchase stock for the foreseeable future: We do not anticipate paying any dividends to, or
repurchasing stock from, our stockholders for the foreseeable future. Instead, we expect to use cash to fund product development costs
and investments in our facilities and production equipment, and to increase our working capital and to reduce debt. Stockholders must
be prepared to rely on market sales of their common stock after price appreciation to earn an investment return, which may never occur.
Any determination to pay dividends in the future will be made at the discretion of our Board of Directors and will depend on our financial
condition, results of operations, contractual restrictions, restrictions imposed by applicable laws, current and anticipated needs for
liquidity and other factors our Board of Directors deems relevant.
Possible
dilution: We are accessing the capital markets and issuing additional common stock under an At-The-Market Offering Agreement in order
to fund our growth objectives, as described elsewhere in this Quarterly Report. Such issuances have a dilutive effect on our existing
stockholders.
ImmuCell Corporation
Other
Risks
Access
to raw materials and contract manufacturing services: Our objective is to maintain more than one source of supply for the components
used to manufacture and test our products that we obtain from third parties. However, we are experiencing difficulty in efficiently acquiring
essential supplies. We have significantly increased the number of farms from which we purchase colostrum for the First Defense®
product line. A significant reduction in farm capacity could make it difficult for us to produce enough inventory to meet customer
demand. The specific antibodies that we purify from colostrum for the First Defense® product line are not readily
available from other sources. We are and will be dependent on our manufacturing facilities and operations in Portland for the production
of the First Defense® product line and Re-Tain®. We will be dependent on one manufacturer
for the supply of syringes for Re-Tain®. We are currently dependent on a contract with Norbrook for the DP formulation
and aseptic filling for supply of our Nisin DP through 2024. Any facility used to perform these services will be subject to FDA inspection
and approval, the outcome and timing of which are not within our control. We anticipate that this FDA approval process would take at
least two years. The potential alternative options for these services are narrowed considerably because our product cannot be formulated
or filled in a facility that also processes traditional antibiotics (i.e., beta lactams). Any significant damage to or other disruption
in the services at any of these third-party facilities or our own facilities (including due to lack of financing, regulatory issues or
non-compliance) would adversely affect the production of inventory and result in significant added expenses and potential loss of future
sales. We face the risk of potential supply interruption and adverse effects on the market launch of Re-Tain® if
we do not effectively manage the end of the DP supply provided from our contract manufacturer for orders scheduled for delivery through
the end of 2024 (with product expiries that could be approximately between September of 2025 and March of 2026) to align with the new
supply from a new contract manufacturing agreement or our own formulation and aseptic filling facility.
Failure
to protect intellectual property: The protection and enforcement of our intellectual property rights may require the expenditure
of significant financial, managerial and operational resources. We rely on trademark, copyright and patent law, trade secret protection,
agreements and other methods with our employees and others to protect our proprietary rights. However, we may be unable to adequately
protect our intellectual property rights or prevent third parties from infringing or misappropriating our intellectual property rights.
We may not be able to obtain registration for all intellectual property we seek to register, and effective intellectual property protection
may not be available in every country in which our products are sold. In some cases, we have chosen (and may choose in the future) not
to seek patent protection for certain products or processes. Instead, we have sought (and may seek in the future) to maintain the confidentiality
of any relevant proprietary technology through trade secrets, operational safeguards and contractual agreements. Reliance upon trade
secret, rather than patent protection may cause us to be vulnerable to competitors who successfully replicate (knock off) our manufacturing
techniques and processes. Further, our confidentiality agreements may not effectively prevent disclosure of our proprietary information,
technologies and processes and may not provide an adequate remedy in the event of unauthorized disclosure of such information. Others
may independently develop similar trade secrets or technology or obtain access to our unpatented trade secrets or proprietary technology.
Others may have filed patent applications and may have been issued patents involving products or technologies potentially useful to us
or necessary for us to commercialize our products or achieve our business goals. If that were to be the case, there can be no assurance
that we will be able to obtain licenses to such patents on terms that are acceptable to us. Any of our intellectual property rights may
be challenged by others or invalidated through administrative process or litigation. Third parties may claim in the future, that we have
infringed their intellectual property rights, which could result in significant costs and potential damages and license requirements.
We may initiate claims or litigation against others for infringement, misappropriation or violation of our intellectual property rights
or other proprietary rights or to establish the validity of such rights. However, we may be unable to discover or determine the extent
of any infringement, misappropriation or other violation of our intellectual property rights and other proprietary rights. In addition,
we may be unable to prevent third parties from infringing upon, misappropriating or otherwise violating our intellectual property rights
and other proprietary rights.
Increasing
dependence on the continuous and reliable operation of our information technology systems: We rely on information systems throughout
our company. Any disruption of these systems or significant security breaches could adversely affect our business. Although we maintain
information security policies and employ system backup measures and engage in information system redundancy planning and processes, such
policies, measures, planning and processes, as well as our current disaster recovery plan may be ineffective or inadequate to address
all eventualities. As information systems and the use of software and related applications by us, our business partners, suppliers, and
customers become more cloud-based, we become inherently more susceptible to cyberattacks. There has been an increase in global cybersecurity
vulnerabilities and threats, including more sophisticated and targeted cyber-related attacks that pose a risk to the security of our
information systems and networks and the confidentiality, availability and integrity of data and information. There are reports of increased
activity by hackers and scammers since the COVID-19 pandemic. Russia’s unprovoked military invasion of Ukraine may elevate the
risk of such cyberattacks. Any such attack or breach could compromise our networks and the information stored thereon could be accessed,
publicly disclosed, lost, or stolen. While we have invested in our data and information technology infrastructure (including working
with an information security technology consultant to assess and enhance our security systems and procedures, and periodically training
our employees in such systems and procedures), there can be no assurance that these efforts will prevent a system disruption, attack,
or security breach and, as such, the risk of system disruptions and security breaches from a cyberattack remains. We have not experienced
any material adverse effect on our business or operations as a consequence of any such attack or breach but may incur increasing costs
in performing the tasks described above. Given the unpredictability of the timing, nature and scope of such disruptions and the evolving
nature of cybersecurity threats, which vary in technique and sources, if we or our business partners or suppliers were to experience
a system disruption, attack or security breach that impacts any of our critical functions, or our customers were to experience a system
disruption, attack or security breach via any of our connected products and services, we could potentially be subject to production downtimes,
operational delays or other detrimental impacts on our operations. Furthermore, any access to, public disclosure of, or other loss of
data or information, including any of our (or our customers’ or suppliers’) confidential or proprietary information or personal
data or information, as a result of an attack or security breach could result in governmental actions or private claims or proceedings,
which could damage our reputation, cause a loss of confidence in our products and services, damage our ability to develop (and protect
our rights to) our proprietary technologies and have a material adverse effect on our business, financial condition, results of operations
or prospects. While this exposure is common to all companies, larger companies with greater resources may be better able to mitigate
this risk than we can.
ImmuCell Corporation
ITEM
2 - UNREGISTERED SALES OF EQUITY SECURITIES AND USE OF PROCEEDS
None
ITEM
3 - DEFAULTS UPON SENIOR SECURITIES
None
ITEM
4 - MINE SAFETY DISCLOSURES
None
ITEM
5 - OTHER INFORMATION
None
ITEM
6 – EXHIBITS
| Exhibit 10.1+ |
|
Fifth Amended and Restated Incentive Compensation Agreement between the Company and Elizabeth L. Williams dated as of March 27, 2024 (incorporated by reference to Exhibit 10.8 of the Company’s Annual Report on Form 10-K filed on April 1, 2024). |
| Exhibit 10.2+ |
|
Fourth Amended and Restated Incentive Compensation Agreement between the Company and Bobbi Jo Brockmann dated as of March 27, 2024 (incorporated by reference to Exhibit 10.11 of the Company’s Annual Report on Form 10-K filed on April 1, 2024). |
| Exhibit 10.3 |
|
Amending Agreement between the Company and Norbrook Laboratories dated as of March 4, 2024 (incorporated by reference to Exhibit 10.1 of the Company’s Current Report on Form 8-K filed March 6, 2024). |
| Exhibit 10.4 |
|
Allonge to and Amendment of Line of Credit between the Company and Gorham Savings Bank, dated February 22, 2024 (incorporated by reference to Exhibit 10.1 of the Company’s Current Report on Form 8-K filed on February 27, 2024). |
| Exhibit 31* |
|
Certifications required by Rule 13a-14(a). |
| Exhibit 32* |
|
Certification pursuant to Section 1350, as adopted pursuant to Section 906 of the Sarbanes-Oxley Act of 2002. |
| 101.INS |
|
XBRL Instance Document-the instance document does not appear in the Interactive Data File because its XBRL tags are embedded within the Inline XBRL document. |
| 101.SCH |
|
Inline XBRL Taxonomy Extension Schema Document. |
| 101.CAL |
|
Inline XBRL Taxonomy Extension Calculation Linkbase Document. |
| 101.DEF |
|
Inline XBRL Taxonomy Extension Definition Linkbase Document. |
| 101.LAB |
|
Inline XBRL Taxonomy Extension Label Linkbase Document. |
| 101.PRE |
|
Inline XBRL Taxonomy Extension Presentation Linkbase Document. |
| 104 |
|
Cover Page Interactive Data File-the cover page
interactive data file does not appear in the Interactive Data File because its XBRL tags are embedded within the Inline XBRL document. |
| + | Management
contract or compensatory plan or arrangement. |
ImmuCell Corporation
SIGNATURE
Pursuant
to the requirements of Section 13 or 15(d) of the Securities Exchange Act of 1934, the registrant has duly caused this report to be signed
on its behalf by the undersigned thereunto duly authorized.
| |
ImmuCell
Corporation
Registrant |
| |
|
| Date: |
May 14, 2024 |
By: |
/s/ Michael F. Brigham |
| |
|
|
Michael F. Brigham |
| |
|
|
President, Chief Executive Officer and
Principal Financial
Officer |
53
false
--12-31
Q1
false
0000811641
0000811641
2024-01-01
2024-03-31
0000811641
2024-05-03
0000811641
2024-03-31
0000811641
2023-12-31
0000811641
2023-01-01
2023-03-31
0000811641
us-gaap:CommonStockMember
2024-03-31
0000811641
us-gaap:CommonStockMember
2023-12-31
0000811641
us-gaap:AdditionalPaidInCapitalMember
2023-12-31
0000811641
us-gaap:RetainedEarningsMember
2023-12-31
0000811641
us-gaap:TreasuryStockCommonMember
2024-03-31
0000811641
us-gaap:TreasuryStockCommonMember
2023-12-31
0000811641
us-gaap:CommonStockMember
2024-01-01
2024-03-31
0000811641
us-gaap:AdditionalPaidInCapitalMember
2024-01-01
2024-03-31
0000811641
us-gaap:RetainedEarningsMember
2024-01-01
2024-03-31
0000811641
us-gaap:TreasuryStockCommonMember
2024-01-01
2024-03-31
0000811641
us-gaap:AdditionalPaidInCapitalMember
2024-03-31
0000811641
us-gaap:RetainedEarningsMember
2024-03-31
0000811641
us-gaap:CommonStockMember
2023-03-31
0000811641
us-gaap:CommonStockMember
2022-12-31
0000811641
us-gaap:AdditionalPaidInCapitalMember
2022-12-31
0000811641
us-gaap:RetainedEarningsMember
2022-12-31
0000811641
us-gaap:TreasuryStockCommonMember
2023-03-31
0000811641
us-gaap:TreasuryStockCommonMember
2022-12-31
0000811641
2022-12-31
0000811641
us-gaap:CommonStockMember
2023-01-01
2023-03-31
0000811641
us-gaap:AdditionalPaidInCapitalMember
2023-01-01
2023-03-31
0000811641
us-gaap:RetainedEarningsMember
2023-01-01
2023-03-31
0000811641
us-gaap:TreasuryStockCommonMember
2023-01-01
2023-03-31
0000811641
us-gaap:AdditionalPaidInCapitalMember
2023-03-31
0000811641
us-gaap:RetainedEarningsMember
2023-03-31
0000811641
2023-03-31
0000811641
iccc:NisinDrugSubstanceMember
2024-03-31
0000811641
us-gaap:LeaseholdImprovementsMember
2024-03-31
0000811641
us-gaap:FairValueInputsLevel1Member
2024-03-31
0000811641
us-gaap:FairValueInputsLevel2Member
2024-03-31
0000811641
us-gaap:FairValueInputsLevel3Member
2024-03-31
0000811641
us-gaap:FairValueInputsLevel1Member
2023-12-31
0000811641
us-gaap:FairValueInputsLevel2Member
2023-12-31
0000811641
us-gaap:FairValueInputsLevel3Member
2023-12-31
0000811641
us-gaap:SalesRevenueNetMember
2024-01-01
2024-03-31
0000811641
iccc:CompanyAMember
us-gaap:SalesRevenueNetMember
us-gaap:CustomerConcentrationRiskMember
2024-01-01
2024-03-31
0000811641
iccc:CompanyAMember
us-gaap:SalesRevenueNetMember
us-gaap:CustomerConcentrationRiskMember
2023-01-01
2023-03-31
0000811641
iccc:CompanyBMember
us-gaap:SalesRevenueNetMember
us-gaap:CustomerConcentrationRiskMember
2024-01-01
2024-03-31
0000811641
iccc:CompanyBMember
us-gaap:SalesRevenueNetMember
us-gaap:CustomerConcentrationRiskMember
2023-01-01
2023-03-31
0000811641
iccc:CompanyAMember
us-gaap:AccountsReceivableMember
us-gaap:CustomerConcentrationRiskMember
2024-01-01
2024-03-31
0000811641
iccc:CompanyAMember
us-gaap:AccountsReceivableMember
us-gaap:CustomerConcentrationRiskMember
2023-01-01
2023-12-31
0000811641
iccc:CompanyBMember
us-gaap:AccountsReceivableMember
us-gaap:CustomerConcentrationRiskMember
2024-01-01
2024-03-31
0000811641
iccc:CompanyBMember
us-gaap:AccountsReceivableMember
us-gaap:CustomerConcentrationRiskMember
2023-01-01
2023-12-31
0000811641
us-gaap:RelatedPartyMember
2024-03-31
0000811641
us-gaap:RelatedPartyMember
2023-12-31
0000811641
srt:MinimumMember
us-gaap:ManufacturingFacilityMember
2024-03-31
0000811641
srt:MaximumMember
us-gaap:ManufacturingFacilityMember
2024-03-31
0000811641
us-gaap:ManufacturingFacilityMember
2024-03-31
0000811641
us-gaap:ManufacturingFacilityMember
2023-12-31
0000811641
srt:MinimumMember
us-gaap:BuildingImprovementsMember
2024-03-31
0000811641
srt:MaximumMember
us-gaap:BuildingImprovementsMember
2024-03-31
0000811641
us-gaap:BuildingImprovementsMember
2024-03-31
0000811641
us-gaap:BuildingImprovementsMember
2023-12-31
0000811641
srt:MinimumMember
us-gaap:OfficeEquipmentMember
2024-03-31
0000811641
srt:MaximumMember
us-gaap:OfficeEquipmentMember
2024-03-31
0000811641
us-gaap:OfficeEquipmentMember
2024-03-31
0000811641
us-gaap:OfficeEquipmentMember
2023-12-31
0000811641
us-gaap:ConstructionInProgressMember
2024-03-31
0000811641
us-gaap:ConstructionInProgressMember
2023-12-31
0000811641
us-gaap:LandMember
2024-03-31
0000811641
us-gaap:LandMember
2023-12-31
0000811641
srt:ScenarioForecastMember
us-gaap:FiniteLivedIntangibleAssetsMember
2025-01-01
2025-12-31
0000811641
us-gaap:DevelopedTechnologyRightsMember
2024-03-31
0000811641
us-gaap:CustomerRelationshipsMember
2024-03-31
0000811641
us-gaap:NoncompeteAgreementsMember
2024-03-31
0000811641
us-gaap:DevelopedTechnologyRightsMember
2023-12-31
0000811641
us-gaap:CustomerRelationshipsMember
2023-12-31
0000811641
us-gaap:NoncompeteAgreementsMember
2023-12-31
0000811641
iccc:GorhamSavingsBankMember
2020-03-31
0000811641
iccc:GorhamSavingsBankMember
us-gaap:DebtInstrumentRedemptionPeriodOneMember
2020-03-31
0000811641
iccc:GorhamSavingsBankMember
us-gaap:DebtInstrumentRedemptionPeriodOneMember
2020-01-01
2020-03-31
0000811641
iccc:GorhamSavingsBankMember
2020-01-01
2020-03-31
0000811641
us-gaap:DebtInstrumentRedemptionPeriodOneMember
2020-03-31
0000811641
us-gaap:DebtInstrumentRedemptionPeriodTwoMember
2020-03-31
0000811641
iccc:GorhamSavingsBankMember
us-gaap:DebtInstrumentRedemptionPeriodTwoMember
2020-01-01
2020-03-31
0000811641
2022-03-31
0000811641
srt:MinimumMember
2024-03-31
0000811641
srt:MaximumMember
2024-03-31
0000811641
2020-03-31
0000811641
iccc:MaineTechnologyInstituteMember
iccc:DebtInstrumentRedemptionPeriodNineMember
2020-06-30
0000811641
iccc:MaineTechnologyInstituteMember
us-gaap:DebtInstrumentRedemptionPeriodThreeMember
2024-01-01
2024-03-31
0000811641
srt:ScenarioForecastMember
us-gaap:DebtInstrumentRedemptionPeriodThreeMember
2027-12-31
0000811641
srt:ScenarioForecastMember
iccc:MaineTechnologyInstituteMember
2027-01-01
2027-12-31
0000811641
iccc:GorhamSavingsBankMember
iccc:DebtInstrumentRedemptionPeriodTenMember
2020-12-31
0000811641
iccc:GorhamSavingsBankMember
iccc:DebtInstrumentRedemptionPeriodTenMember
2020-01-01
2020-12-31
0000811641
iccc:MaineTechnologyInstituteMember
iccc:DebtInstrumentRedemptionPeriodSixMember
2024-01-01
2024-03-31
0000811641
iccc:MaineTechnologyInstituteMember
iccc:DebtInstrumentRedemptionPeriodSixMember
2024-03-31
0000811641
us-gaap:DebtInstrumentRedemptionPeriodFiveMember
2021-06-30
0000811641
2023-09-30
0000811641
iccc:GorhamSavingsBankMember
2023-01-01
2023-09-30
0000811641
iccc:DebtInstrumentRedemptionPeriodSixMember
2023-09-30
0000811641
us-gaap:MortgageBankingMember
srt:ScenarioForecastMember
iccc:DebtInstrumentRedemptionPeriodSixMember
2026-01-01
2026-09-30
0000811641
srt:ScenarioForecastMember
iccc:DebtInstrumentRedemptionPeriodSixMember
2026-09-30
0000811641
iccc:DebtInstrumentRedemptionPeriodSevenMember
2023-09-30
0000811641
srt:ScenarioForecastMember
iccc:DebtInstrumentRedemptionPeriodSevenMember
2026-01-01
2026-09-30
0000811641
srt:ScenarioForecastMember
2026-09-30
0000811641
srt:ScenarioForecastMember
2024-09-30
0000811641
2023-01-01
2023-12-31
0000811641
2022-01-01
2022-12-31
0000811641
us-gaap:DebtInstrumentRedemptionPeriodOneMember
2024-01-01
2024-03-31
0000811641
us-gaap:DebtInstrumentRedemptionPeriodOneMember
2023-01-01
2023-03-31
0000811641
us-gaap:DebtInstrumentRedemptionPeriodTwoMember
2024-01-01
2024-03-31
0000811641
us-gaap:DebtInstrumentRedemptionPeriodTwoMember
2023-01-01
2023-03-31
0000811641
us-gaap:DebtInstrumentRedemptionPeriodThreeMember
2024-01-01
2024-03-31
0000811641
us-gaap:DebtInstrumentRedemptionPeriodThreeMember
2023-01-01
2023-03-31
0000811641
us-gaap:DebtInstrumentRedemptionPeriodFourMember
2024-01-01
2024-03-31
0000811641
us-gaap:DebtInstrumentRedemptionPeriodFourMember
2023-01-01
2023-03-31
0000811641
us-gaap:DebtInstrumentRedemptionPeriodFiveMember
2024-01-01
2024-03-31
0000811641
us-gaap:DebtInstrumentRedemptionPeriodFiveMember
2023-01-01
2023-03-31
0000811641
iccc:DebtInstrumentRedemptionPeriodSixMember
2024-01-01
2024-03-31
0000811641
iccc:DebtInstrumentRedemptionPeriodSixMember
2023-01-01
2023-03-31
0000811641
iccc:DebtInstrumentRedemptionPeriodSevenMember
2024-01-01
2024-03-31
0000811641
iccc:DebtInstrumentRedemptionPeriodSevenMember
2023-01-01
2023-03-31
0000811641
us-gaap:DebtInstrumentRedemptionPeriodOneMember
2023-01-01
2023-12-31
0000811641
us-gaap:DebtInstrumentRedemptionPeriodOneMember
2022-01-01
2022-12-31
0000811641
us-gaap:DebtInstrumentRedemptionPeriodTwoMember
2023-01-01
2023-12-31
0000811641
us-gaap:DebtInstrumentRedemptionPeriodTwoMember
2022-01-01
2022-12-31
0000811641
us-gaap:DebtInstrumentRedemptionPeriodThreeMember
2023-01-01
2023-12-31
0000811641
us-gaap:DebtInstrumentRedemptionPeriodThreeMember
2022-01-01
2022-12-31
0000811641
us-gaap:DebtInstrumentRedemptionPeriodFourMember
2023-01-01
2023-12-31
0000811641
us-gaap:DebtInstrumentRedemptionPeriodFourMember
2022-01-01
2022-12-31
0000811641
us-gaap:DebtInstrumentRedemptionPeriodFiveMember
2023-01-01
2023-12-31
0000811641
us-gaap:DebtInstrumentRedemptionPeriodFiveMember
2022-01-01
2022-12-31
0000811641
iccc:DebtInstrumentRedemptionPeriodSixMember
2023-01-01
2023-12-31
0000811641
iccc:DebtInstrumentRedemptionPeriodSixMember
2022-01-01
2022-12-31
0000811641
iccc:DebtInstrumentRedemptionPeriodSevenMember
2023-01-01
2023-12-31
0000811641
iccc:DebtInstrumentRedemptionPeriodSevenMember
2022-01-01
2022-12-31
0000811641
us-gaap:DebtInstrumentRedemptionPeriodOneMember
2024-03-31
0000811641
us-gaap:DebtInstrumentRedemptionPeriodTwoMember
2024-03-31
0000811641
us-gaap:DebtInstrumentRedemptionPeriodThreeMember
2024-03-31
0000811641
us-gaap:DebtInstrumentRedemptionPeriodFourMember
2024-03-31
0000811641
us-gaap:DebtInstrumentRedemptionPeriodFiveMember
2024-03-31
0000811641
iccc:DebtInstrumentRedemptionPeriodSixMember
2024-03-31
0000811641
iccc:DebtInstrumentRedemptionPeriodSevenMember
2024-03-31
0000811641
iccc:SubtotalMember
2024-03-31
0000811641
2022-01-01
2022-03-31
0000811641
iccc:MrBrighamMember
2024-03-31
0000811641
2023-01-01
0000811641
2024-01-01
0000811641
2019-09-12
0000811641
2022-09-30
0000811641
2023-11-14
2023-11-14
0000811641
2023-11-14
0000811641
us-gaap:CommonStockMember
2024-01-01
2024-03-31
0000811641
us-gaap:CommonStockMember
2024-03-31
0000811641
2016-02-01
2016-02-29
0000811641
2016-02-29
0000811641
us-gaap:PrivatePlacementMember
2016-10-01
2016-10-31
0000811641
us-gaap:PrivatePlacementMember
2016-10-31
0000811641
2017-07-01
2017-07-31
0000811641
2017-07-31
0000811641
2017-12-01
2017-12-31
0000811641
2017-12-31
0000811641
2019-03-01
2019-03-31
0000811641
2019-03-31
0000811641
2021-04-01
2021-04-30
0000811641
2021-04-30
0000811641
iccc:CommonStockIssuancesMember
us-gaap:SubsequentEventMember
2024-04-09
2024-04-09
0000811641
us-gaap:SubsequentEventMember
2024-04-09
0000811641
us-gaap:SubsequentEventMember
2024-05-03
2024-05-03
0000811641
iccc:ATMAgreementMember
us-gaap:SubsequentEventMember
2024-05-03
2024-05-03
0000811641
iccc:TwoThousandTenPlansMember
2024-03-31
0000811641
iccc:TwoThousandTenPlansMember
2024-01-01
2024-03-31
0000811641
iccc:TwoThousandTenPlansMember
2023-12-31
0000811641
iccc:TwoThousandSeventeenPlansMember
us-gaap:CommonStockMember
2024-03-31
0000811641
srt:MinimumMember
iccc:TwoThousandSeventeenPlansMember
2022-06-30
0000811641
srt:MaximumMember
iccc:TwoThousandSeventeenPlansMember
2022-06-30
0000811641
iccc:TwoThousandSeventeenPlansMember
2024-01-01
2024-03-31
0000811641
iccc:TwoThousandSeventeenPlansMember
2024-03-31
0000811641
iccc:TwoThousandSeventeenPlansMember
2023-12-31
0000811641
srt:MinimumMember
iccc:TwoThousandTenPlansMember
2024-03-31
0000811641
srt:MaximumMember
iccc:TwoThousandTenPlansMember
2024-03-31
0000811641
us-gaap:EmployeeStockOptionMember
2024-01-01
2024-03-31
0000811641
us-gaap:EmployeeStockOptionMember
2023-01-01
2023-12-31
0000811641
iccc:AcquiringPersonMember
2024-03-31
0000811641
srt:MinimumMember
2018-06-14
0000811641
srt:MaximumMember
2018-06-14
0000811641
srt:MinimumMember
2020-06-10
0000811641
srt:MaximumMember
2020-06-10
0000811641
iccc:TwoThousandTenPlanMember
2022-12-31
0000811641
iccc:TwoThousandSeventeenPlanMember
2022-12-31
0000811641
iccc:TwoThousandTenPlanMember
2023-01-01
2023-12-31
0000811641
iccc:TwoThousandSeventeenPlanMember
2023-01-01
2023-12-31
0000811641
iccc:TwoThousandTenPlanMember
2023-12-31
0000811641
iccc:TwoThousandSeventeenPlanMember
2023-12-31
0000811641
iccc:TwoThousandTenPlanMember
2024-01-01
2024-03-31
0000811641
iccc:TwoThousandSeventeenPlanMember
2024-01-01
2024-03-31
0000811641
iccc:TwoThousandTenPlanMember
2022-01-01
2022-12-31
0000811641
iccc:TwoThousandSeventeenPlanMember
2022-01-01
2022-12-31
0000811641
iccc:TwoThousandTenPlanMember
2024-03-31
0000811641
iccc:TwoThousandSeventeenPlanMember
2024-03-31
0000811641
iccc:StockOptionPlansMember
2023-12-31
0000811641
iccc:StockOptionPlansMember
2024-03-31
0000811641
iccc:StockOptionPlansMember
2024-01-01
2024-03-31
0000811641
country:US
2024-01-01
2024-03-31
0000811641
country:US
2023-01-01
2023-03-31
0000811641
iccc:OtherStatesMember
2024-01-01
2024-03-31
0000811641
iccc:OtherStatesMember
2023-01-01
2023-03-31
0000811641
iccc:FirstDefenseProductLineMember
2024-01-01
2024-03-31
0000811641
iccc:FirstDefenseProductLineMember
2024-03-31
0000811641
iccc:FirstDefenseProductLineMember
2023-01-01
2023-03-31
0000811641
iccc:FirstDefenseProductLineMember
2023-03-31
0000811641
iccc:OtherAnimalHealthMember
2024-01-01
2024-03-31
0000811641
iccc:OtherAnimalHealthMember
2024-03-31
0000811641
iccc:OtherAnimalHealthMember
2023-01-01
2023-03-31
0000811641
iccc:OtherAnimalHealthMember
2023-03-31
0000811641
us-gaap:DomesticCountryMember
2023-12-31
0000811641
us-gaap:DomesticCountryMember
2024-01-01
2024-03-31
0000811641
us-gaap:StateAndLocalJurisdictionMember
2023-12-31
0000811641
us-gaap:StateAndLocalJurisdictionMember
2024-01-01
2024-03-31
0000811641
iccc:FederalGeneralBusinessMember
2023-12-31
0000811641
iccc:FederalGeneralBusinessMember
2024-01-01
2024-03-31
0000811641
iccc:StateTaxCreditMember
2023-12-31
0000811641
iccc:StateTaxCreditMember
2024-01-01
2024-03-31
0000811641
2018-01-01
2018-12-31
0000811641
iccc:ScoursMember
2024-01-01
2024-03-31
0000811641
iccc:MastitisMember
2024-01-01
2024-03-31
0000811641
us-gaap:AllOtherSegmentsMember
2024-01-01
2024-03-31
0000811641
iccc:ScoursMember
2023-01-01
2023-03-31
0000811641
iccc:MastitisMember
2023-01-01
2023-03-31
0000811641
us-gaap:AllOtherSegmentsMember
2023-01-01
2023-03-31
0000811641
iccc:ScoursMember
2024-03-31
0000811641
iccc:MastitisMember
2024-03-31
0000811641
us-gaap:AllOtherSegmentsMember
2024-03-31
0000811641
iccc:ScoursMember
2023-03-31
0000811641
iccc:MastitisMember
2023-03-31
0000811641
us-gaap:AllOtherSegmentsMember
2023-03-31
0000811641
iccc:ScoursMember
2023-01-01
2023-12-31
0000811641
iccc:MastitisMember
2023-01-01
2023-12-31
0000811641
us-gaap:AllOtherSegmentsMember
2023-01-01
2023-12-31
0000811641
iccc:ScoursMember
2022-01-01
2022-12-31
0000811641
iccc:MastitisMember
2022-01-01
2022-12-31
0000811641
us-gaap:AllOtherSegmentsMember
2022-01-01
2022-12-31
0000811641
iccc:ScoursMember
2023-12-31
0000811641
iccc:MastitisMember
2023-12-31
0000811641
us-gaap:AllOtherSegmentsMember
2023-12-31
0000811641
iccc:ScoursMember
2022-12-31
0000811641
iccc:MastitisMember
2022-12-31
0000811641
us-gaap:AllOtherSegmentsMember
2022-12-31
0000811641
iccc:EmployeeMember
2024-01-01
2024-03-31
0000811641
iccc:EmployeeOneMember
2024-01-01
2024-03-31
xbrli:shares
iso4217:USD
iso4217:USD
xbrli:shares
xbrli:pure
utr:sqft
I, Michael F. Brigham, certify that:
In connection with the Quarterly Report on Form 10-Q of ImmuCell Corporation
(the “Company”) for the quarter ended March 31, 2024, as filed with the Securities and Exchange Commission on the date hereof
(the “Report”), I, Michael F. Brigham, President, Chief Executive Officer and Principal Financial Officer of the Company,
certify, pursuant to 18 U.S.C. § 1350, as adopted pursuant to § 906 of the Sarbanes-Oxley Act of 2002, that:
This certification is provided pursuant to 18 U.S.C. Section 1350 and
Item 601(b)(32) of Regulation S-K (“Item 601(b)(32)”) promulgated under the Securities Act of 1933, as amended (the “Securities
Act”), and the Exchange Act. In accordance with clause (ii) of Item 601(b)(32), this certification (A) shall not be deemed “filed”
for the purposes of Section 18 of the Exchange Act, or otherwise subject to the liability of that section, and (B) shall not be deemed
to be incorporated by reference into any filing under the Securities Act or the Exchange Act, except to the extent that the Company specifically
incorporates it by reference.
A signed original of this written statement required by Section 906
has been provided to ImmuCell Corporation and will be retained by ImmuCell Corporation and furnished to the Securities and Exchange Commission
or its staff upon request.