Artesian Resources Corporation Reports First Quarter 2020 Results
May 06 2020 - 5:19PM

Artesian Resources Corporation (Nasdaq: ARTNA), a leading provider
of water and wastewater services, and related services, on the
Delmarva Peninsula, today announced first quarter results for 2020.
Net income for the three months ended March 31, 2020 was $4.1
million, a $0.5 million, or 13.5%, increase compared to net income
recorded during the first quarter of 2019. Diluted net income per
share increased 12.8% to $0.44 compared to $0.39 for the first
quarter of 2019.
The Company continues to provide essential
utility services during the COVID-19 pandemic and is following
social distancing and remote work directives to protect the
well-being of its customers and employees. To support our customers
and communities, we have suspended service disconnections and late
fees. The full impact of the COVID-19 outbreak continues to evolve
and management is actively monitoring the situation and impacts on
its results of operations, customer billing and collections,
suppliers, industry, and workforce.
“During these challenging times we remain
committed to providing uninterrupted quality water service to our
customers and community. We have modified our work practices and
limited in-person customer interactions to safeguard the health and
well-being of our employees and customers,” said Dian C. Taylor,
Chair, President & CEO.
Water sales revenue increased 2.7% to $17.4
million for the three months ended March 31, 2020 from $17.0
million for the same period in 2019, primarily due to increases in
the number of customers served, overall water consumption and
distribution system improvement charge revenue.
Other utility operating revenue increased 11.9%
to $1.3 million for the three months ended March 31, 2020 from $1.1
million for the same period in 2019, primarily as a result of
increases in wastewater revenue from additional customers and in
inspection fee revenue related to new development.
Non-utility revenue decreased $0.1 million, or
5.7%, for the three months ended March 31, 2020 compared to the
same period in 2019, primarily due to a decrease in contract
service revenue.
Operating expenses, excluding depreciation and
income taxes, increased $0.1 million, or 1.1%, for the three months
ended March 31, 2020 compared to the same period in 2019. The
majority of the increase is related to increases in payroll and
employee benefit costs, partially offset by a decrease in repair
and maintenance costs related to the painting of elevated water
storage tanks under contract.
Federal and state income tax expense increased
$0.2 million, or 15.2%, for the three months ended March 31, 2020
compared to the same period in 2019, primarily due to increased
pre-tax income in 2020 compared to 2019.
Miscellaneous income increased $0.3 million, or
36.0%, for the three months ended March 31, 2020 compared to the
same period in 2019 due to the annual patronage distribution from
CoBank, ACB. An increased average loan volume with CoBank, ACB in
2020 compared to 2019 and its issuance in 2020 of a special
patronage distribution equivalent to 0.1% of the 2019 average loan
volume resulted in the increased patronage distribution.
Allowance for funds used during construction, or
AFUDC, increased $0.2 million, or 87.2%, as a result of higher
long-term construction activity subject to AFUDC for the three
months ended March 31, 2020 compared to the same period in 2019.
“We remain focused on our long term growth strategy, investing in
new sources of supply and new distribution mains to meet current
and projected demands. We also recently completed the acquisition
of the water assets of the town of Frankford, further expanding our
customer base in our Sussex County service area,” said
Taylor.
Interest expense increased $0.2 million during
the three months ended March 31, 2020 compared to the same period
in 2019, primarily due to an increase in long-term debt interest
related to the Series V First Mortgage Bond issued on December 17,
2019. This increase is partially offset by a decrease in short-term
debt interest, primarily related to lower short-term borrowing
levels in 2020.
About Artesian
ResourcesArtesian Resources Corporation operates as a
holding company of wholly-owned subsidiaries offering water and
wastewater services, and related services, on the Delmarva
Peninsula. Artesian Water Company, the principal subsidiary, is the
oldest and largest regulated water utility on the Delmarva
Peninsula and has been providing water service since 1905. Artesian
supplies 8.3 billion gallons of water per year through 1,331 miles
of main to over 300,000 people.
Forward Looking StatementsThis
release contains forward looking statements within the meaning of
the Private Securities Litigation Reform Act of 1995 regarding,
among other things, the impacts of the COVID-19 pandemic and the
continued growth in our business and the number of customers
served. These statements involve risks and uncertainties that could
cause actual results to differ materially from those expressed or
implied by such forward-looking statements including: changes in
weather, changes in our contractual obligations, changes in
government policies, the timing and results of our rate requests,
failure to receive regulatory approval, changes in economic and
market conditions generally and other matters discussed in our
filings with the Securities and Exchange Commission. While the
Company may elect to update forward-looking statements, we
specifically disclaim any obligation to do so and you should not
rely on any forward-looking statement as representation of the
Company’s views as of any date subsequent to the date of this
release.
Contact:Nicki TaylorInvestor
Relations(302) 453-6900ntaylor@artesianwater.com
| Artesian Resources
Corporation |
|
| Condensed
Consolidated Statement of Operations |
|
| (In thousands,
except per share amounts) |
|
| (Unaudited) |
|
|
|
|
|
|
|
|
|
|
| |
|
Three months
ended |
|
|
| |
|
March 31, |
|
|
| |
|
2020 |
|
|
2019 |
|
|
|
Operating Revenues |
|
|
|
|
|
|
|
|
Water sales |
$ |
17,392 |
|
$ |
16,934 |
|
|
|
Other utility operating revenue |
|
1,253 |
|
|
1,120 |
|
|
|
Non-utility revenue |
|
1,256 |
|
|
1,332 |
|
|
| |
|
19,901 |
|
|
19,386 |
|
|
| |
|
|
|
|
|
|
|
|
Operating Expenses |
|
|
|
|
|
|
|
|
Utility operating expenses |
|
9,235 |
|
|
9,121 |
|
|
|
Non-utility operating expenses |
|
728 |
|
|
767 |
|
|
|
Depreciation and amortization |
|
2,752 |
|
|
2,715 |
|
|
|
State and federal income taxes |
|
1,359 |
|
|
1,180 |
|
|
|
Property and other taxes |
|
1,365 |
|
|
1,319 |
|
|
| |
|
15,439 |
|
|
15,102 |
|
|
| |
|
|
|
|
|
|
|
|
Operating Income |
|
4,462 |
|
|
4,284 |
|
|
| |
|
|
|
|
|
|
|
|
Allowance for funds used during construction |
|
423 |
|
|
226 |
|
|
|
Miscellaneous |
|
1,088 |
|
|
800 |
|
|
| |
|
|
|
|
|
|
|
|
Income Before Interest Charges |
|
5,973 |
|
|
5,310 |
|
|
| |
|
|
|
|
|
|
|
|
Interest Charges |
|
1,899 |
|
|
1,720 |
|
|
| |
|
|
|
|
|
|
|
| Net
Income |
$ |
4,074 |
|
$ |
3,590 |
|
|
| |
|
|
|
|
|
|
|
|
Weighted Average Common Shares Outstanding - Basic |
|
9,297 |
|
|
9,258 |
|
|
|
Net Income per Common Share - Basic |
$ |
0.44 |
|
$ |
0.39 |
|
|
| |
|
|
|
|
|
|
|
|
Weighted Average Common Shares Outstanding - Diluted |
|
9,343 |
|
|
9,314 |
|
|
|
Net Income per Common Share - Diluted |
$ |
0.44 |
|
$ |
0.39 |
|
|
| |
|
|
|
|
|
|
|
| |
|
|
|
|
|
|
|
|
|
|
|
|
|
|
|
|
|
Artesian Resources Corporation |
|
| Condensed
Consolidated Balance Sheet |
|
| (In thousands) |
|
| (Unaudited) |
|
| |
|
|
|
|
|
|
|
| |
March 31, |
|
December 31, |
|
|
| |
2020 |
|
2019 |
|
. |
|
Assets |
|
|
|
|
|
|
|
|
Utility Plant, at original cost less |
|
|
|
|
|
|
|
|
accumulated depreciation |
$ |
537,190 |
|
$ |
530,721 |
|
|
|
Current Assets |
|
12,679 |
|
|
14,207 |
|
|
|
Regulatory and Other Assets |
|
15,718 |
|
|
15,440 |
|
|
| |
$ |
565,587 |
|
$ |
560,368 |
|
|
| |
|
|
|
|
|
|
|
|
Capitalization and Liabilities |
|
|
|
|
|
|
|
|
|
|
|
|
|
|
|
|
|
Stockholders' Equity |
$ |
162,354 |
|
$ |
160,268 |
|
|
|
Long Term Debt, Net of Current Portion |
|
143,563 |
|
|
144,156 |
|
|
|
Current Liabilities |
|
27,923 |
|
|
25,599 |
|
|
|
Advances for Construction |
|
5,302 |
|
|
5,421 |
|
|
|
Contributions in Aid of Construction |
|
152,457 |
|
|
149,479 |
|
|
|
Other Liabilities |
|
73,988 |
|
|
75,445 |
|
|
| |
$ |
565,587 |
|
$ |
560,368 |
|
|
| |
|
|
|
|
|
|
|
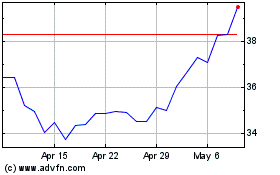
Artesian Resources (NASDAQ:ARTNA)
Historical Stock Chart
From Mar 2024 to Apr 2024

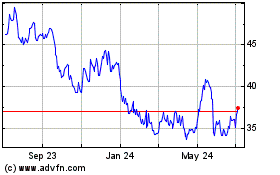
Artesian Resources (NASDAQ:ARTNA)
Historical Stock Chart
From Apr 2023 to Apr 2024
