P.A.M. Transportation Services, Inc. Announces Results for the Third Quarter Ended September 30, 2010
October 27 2010 - 10:02AM

P.A.M. Transportation Services, Inc. (Nasdaq:PTSI) today reported
net loss of $490,727 or diluted and basic loss per share of $0.05
for the quarter ended September 30, 2010, and net income of
$455,403 or diluted and basic earnings per share of $0.05 for the
nine month period then ended. These results compare to a net loss
of $1,229,753 or diluted and basic loss per share of $0.13, and net
loss of $6,931,995 or diluted and basic loss per share of $0.74,
respectively, for the three and nine months ended September 30,
2009.
Operating revenues, including revenue from fuel surcharges, were
$86,706,023 for the third quarter of 2010, a 13.0% increase
compared to $76,743,324 for the third quarter of 2009. Operating
revenues, including fuel surcharges, were $253,790,755 for the nine
months ended September 30, 2010, a 20.3% increase compared to
$211,037,835 for the nine months ended September 30, 2009.
Daniel H. Cushman, President of the Company, commented, "Third
quarter results did not meet our expectations. After making money
in the second quarter, following several quarters of losses, we had
hoped we had turned the corner to consistent profitability. A
softer freight market in the third quarter along with some
increased costs slowed our momentum. We were pleased by our
continued progress in several key areas. Our rate per total mile
improved by 4.2% from the second quarter 2010 to the third quarter
2010. For the third quarter 2010 compared to the third quarter
2009, we were able to increase our rate per total mile by 3.1%,
while reducing miles traveled hauling brokerage freight to 2.7%
from 7.2% of total miles, and reducing empty miles to 6.1% from
7.6%. Improvements in negotiated fuel surcharges for the quarter
ended September 30, 2010 allowed us to reduce our cost per gallon
of fuel, net of surcharge, despite a 13.2% increase in the gross
cost per gallon of our fuel compared to the same quarter in 2009.
We have also seen growth in our expedited, dedicated and Mexico
service offerings.
"During the third quarter 2010, we completed the final step to
consolidate our operations into one operating entity, PAM
Transport, Inc. On September 30, 2010 we sold the portion of our
brokerage operations doing business as East Coast Transport &
Logistics, LLC operating out of Paulsboro, NJ. While this sale will
decrease revenue, it will not have a material effect on our net
income. The sale of East Coast will allow us to better focus on our
Supply Chain Solution operation, which is a program that is truly
integrated with and complements our asset based operations and
which is directed and controlled at our headquarters in Tontitown,
Arkansas. This sale resulted in a pre-tax gain of approximately
$460,000 reported in the third quarter 2010.
"The third quarter 2010 also saw a sharp increase in demand for
qualified drivers. This shift necessitated the removal of the 5%
pay reduction in August 2010 that had been in effect since June
2009. This change added approximately $.7 million expense to the
third quarter of 2010 compared to the second quarter.
Increased competition for drivers resulted in elevated
turnover, and a 42 truck reduction in the number of revenue
producing units for the third quarter 2010 compared to the second
quarter, resulting in approximately $2.0 million in lost revenue.
We anticipate the shortage of qualified drivers to become more
severe as carriers react to better market conditions by increasing
fleet size, and due to the implementation of the Comprehensive
Safety Analysis 2010 (CSA2010) program, which imposes more
stringent safety requirements upon the company and our drivers than
current programs.
"Hurricane Alex hit northeastern Mexico on July 1, 2010 and
caused significant damage to highway and bridge infrastructure for
many of the primary travel corridors in the region. This damage
closed or diverted many of our freight lanes into and out of Mexico
for several weeks, and resulted in approximately $1.2 million in
lost revenue.
"While our results for the quarter did not meet our
expectations, we view our discipline in adherence to our model of
hauling the right freight, to the right place for the right rate as
the initial investment to provide the foundation for sustainable
future growth."
P.A.M. Transportation Services, Inc. is a leading truckload dry
van carrier transporting general commodities throughout the
continental United States, as well as in the Canadian provinces of
Ontario and Quebec. The Company also provides transportation
services in Mexico through its gateways in Laredo and El Paso,
Texas under agreements with Mexican carriers.
The PAM Transportation Services, Inc. logo is available at
http://www.globenewswire.com/newsroom/prs/?pkgid=5148
Certain information included in this document contains or may
contain "forward-looking statements" within the meaning of the
Private Securities Litigation Reform Act of 1995. Such
forward-looking statements may relate to expected future financial
and operating results or events, and are thus prospective. Such
forward-looking statements are subject to risks, uncertainties and
other factors which could cause actual results to differ materially
from future results expressed or implied by such forward-looking
statements. Potential risks and uncertainties include, but are not
limited to, excess capacity in the trucking industry; surplus
inventories; recessionary economic cycles and downturns in
customers' business cycles; increases or rapid fluctuations in fuel
prices, interest rates, fuel taxes, tolls, license and registration
fees; the resale value of the Company's used equipment and the
price of new equipment; increases in compensation for and
difficulty in attracting and retaining qualified drivers and
owner-operators; increases in insurance premiums and deductible
amounts relating to accident, cargo, workers' compensation, health,
and other claims; unanticipated increases in the number or amount
of claims for which the Company is self insured; inability of the
Company to continue to secure acceptable financing arrangements;
seasonal factors such as harsh weather conditions that increase
operating costs; competition from trucking, rail, and intermodal
competitors including reductions in rates resulting from
competitive bidding; the ability to identify acceptable acquisition
candidates, consummate acquisitions, and integrate acquired
operations; a significant reduction in or termination of the
Company's trucking service by a key customer; and other factors,
including risk factors, included from time to time in filings made
by the Company with the Securities and Exchange Commission. The
Company undertakes no obligation to update or clarify
forward-looking statements, whether as a result of new information,
future events or otherwise.
| P.A.M. Transportation Services, Inc. and
Subsidiaries |
|
|
|
|
| Key Financial and Operating Statistics |
|
|
|
|
| (unaudited) |
|
|
|
|
| |
Quarter ended September
30, |
Nine Months Ended September
30, |
| |
2010 |
2009 |
2010 |
2009 |
| |
|
|
|
|
| Revenue, before fuel surcharge |
$74,798,482 |
$67,668,041 |
$217,096,942 |
$190,304,673 |
| Fuel surcharge |
11,907,541 |
9,075,283 |
36,693,813 |
20,733,162 |
| |
86,706,023 |
76,743,324 |
253,790,755 |
211,037,835 |
| Operating expenses and costs: |
|
|
|
|
| Salaries, wages and benefits |
27,776,038 |
26,090,975 |
81,746,198 |
74,175,984 |
| Fuel expense |
23,311,750 |
20,394,592 |
72,303,472 |
51,877,778 |
| Operating supplies and expenses |
7,852,497 |
6,614,221 |
21,942,674 |
19,839,993 |
| Rent and purchased transportation |
15,241,114 |
10,170,931 |
37,563,501 |
28,791,337 |
| Depreciation |
6,957,323 |
8,336,276 |
19,998,790 |
25,716,333 |
| Operating taxes and licenses |
1,292,981 |
1,095,343 |
3,614,027 |
3,791,309 |
| Insurance and claims |
3,218,946 |
3,174,733 |
9,652,213 |
9,347,553 |
| Communications and utilities |
685,719 |
649,085 |
2,055,408 |
1,984,885 |
| Other |
1,321,048 |
1,295,659 |
3,604,899 |
3,745,197 |
| (Gain) loss on disposition of
equipment |
(471,872) |
270,565 |
(501,254) |
294,817 |
| Total operating expenses and costs |
87,185,544 |
78,092,380 |
251,979,928 |
219,565,186 |
| |
|
|
|
|
| Operating (loss) income |
(479,521) |
(1,349,056) |
1,810,827 |
(8,527,351) |
| |
|
|
|
|
| Interest expense |
(590,728) |
(562,755) |
(1,697,649) |
(1,855,677) |
| Non-operating income (expense) |
271,324 |
(159,546) |
659,283 |
(826,539) |
| |
|
|
|
|
| (Loss) income before income taxes |
(798,925) |
(2,071,357) |
772,461 |
(11,209,567) |
| Income tax (benefit) expense |
(308,198) |
(841,604) |
317,058 |
(4,277,572) |
| |
|
|
|
|
| Net (loss) income |
$(490,727) |
$(1,229,753) |
$455,403 |
$(6,931,995) |
| |
|
|
|
|
| Diluted (loss) earnings per share |
$(0.05) |
$(0.13) |
$0.05 |
$(0.74) |
| |
|
|
|
|
| Average shares outstanding – Diluted |
9,414,607 |
9,415,369 |
9,419,100 |
9,414,355 |
| |
|
|
|
|
| |
Quarter ended September
30, |
Nine Months Ended September
30, |
| Truckload Operations |
2010 |
2009 |
2010 |
2009 |
| |
|
|
|
|
| Total miles |
47,107,260 |
47,010,122 |
145,284,559 |
130,500,948 |
| Operating ratio* |
101.69% |
102.64% |
99.51% |
105.68% |
| Empty miles factor |
6.06% |
7.59% |
6.13% |
8.06% |
| Revenue per total mile, before fuel
surcharge |
$1.28 |
$1.24 |
$1.25 |
$1.25 |
| Total loads |
70,303 |
77,999 |
216,504 |
211,566 |
| Revenue per truck per work day |
$540 |
$532 |
$547 |
$493 |
| Revenue per truck per week |
$2,700 |
$2,660 |
$2,735 |
$2,465 |
| Average company trucks |
1,717 |
1,680 |
1,714 |
1,701 |
| Average owner operator trucks |
28 |
33 |
29 |
33 |
| |
|
|
|
|
| Logistics Operations |
|
|
|
|
| Total revenue |
$14,500,880 |
$9,283,231 |
$36,006,756 |
$27,015,765 |
| Operating ratio |
96.28% |
97.91% |
97.44% |
97.25% |
|
___________________________________________________________ |
|
|
|
|
| * Operating ratio has been
calculated based upon total operating expenses, net of fuel
surcharge, as a percentage of revenue, before fuel surcharge. We
used revenue, before fuel surcharge, and operating expenses, net of
fuel surcharge, because we believe that eliminating this sometimes
volatile source of revenue affords a more consistent basis for
comparing our results of operations from period to period. |
CONTACT:  P.A.M. Transportation Services, Inc.
          Larry J. Goddard
          (479) 361-9111
          P.O. BOX 188
          Tontitown, AR 72770
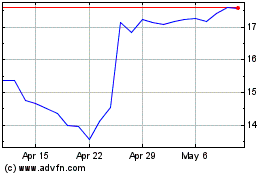
P A M Transport Services (NASDAQ:PTSI)
Historical Stock Chart
From Mar 2024 to Apr 2024

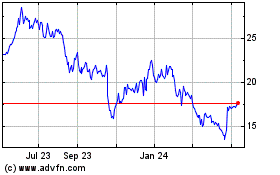
P A M Transport Services (NASDAQ:PTSI)
Historical Stock Chart
From Apr 2023 to Apr 2024
