EP GLOBAL OPPORTUNITIES TRUST PLC - Portfolio Holdings as at 31 March 2015
April 14 2015 - 11:20AM
PR Newswire (US)
EP GLOBAL OPPORTUNITIES TRUST PLC

PORTFOLIO HOLDINGS AS AT 31 MARCH 2015

                                                                     % of Net
Rank    Company                 Sector              Country            Assets

   1    Screen                  Technology          Japan                 3.5

   2    Swire Pacific           Industrials         Hong Kong             3.2

   3    Novartis                Health Care         Switzerland           3.2

   4    Panasonic               Consumer Goods      Japan                 3.0

   5    Sumitomo Mitsui Trust   Financials          Japan                 2.9

   6    Fresenius Medical Care  Health Care         Germany               2.9

   7    Toyota                  Consumer Goods      Japan                 2.9

   8    East Japan Railway      Consumer Services   Japan                 2.8

   9    PostNL                  Industrials         Netherlands           2.7

  10    Japan Tobacco           Consumer Goods      Japan                 2.7

  11    Toshiba                 Industrials         Japan                 2.7

  12    AstraZeneca             Health Care         United Kingdom        2.7

  13    Mitsubishi              Industrials         Japan                 2.7

  14    DBS                     Financials          Singapore             2.6

  15    KDDI                    Telecommunications  Japan                 2.6

  16    Hutchison Whampoa       Industrials         Hong Kong             2.6

  17    Microsoft               Technology          United States         2.5

  18    Nomura                  Financials          Japan                 2.5

  19    Sumitomo Mitsui         Financials          Japan                 2.5
        Financial

  20    BNP Paribas             Financials          France                2.4

  21    Roche *                 Health Care         Switzerland           2.4

  22    Google                  Technology          United States         2.4

  23    Vodafone                Telecommunications  United Kingdom        2.3

  24    Intesa Sanpaolo         Financials          Italy                 2.3

  25    Bangkok Bank **         Financials          Thailand              2.3

  26    Yamaha Motor            Consumer Goods      Japan                 2.2

  27    Qualcomm                Technology          United States         2.2

  28    Bank Mandiri            Financials          Indonesia             2.1

  29    Terex                   Industrials         United States         2.1

  30    HSBC                    Financials          United Kingdom        2.1

  31    Sanofi                  Health Care         France                2.0

  32    Royal Dutch Shell ***   Oil & Gas           Netherlands           1.9

  33    Whirlpool               Consumer Goods      United States         1.9

  34    BG                      Oil & Gas           United Kingdom        1.9

  35    ABB                     Industrials         Switzerland           1.9

  36    Galaxy Entertainment    Consumer Services   Hong Kong             1.8

  37    Bayer                   Basic Materials     Germany               1.7

  38    Misawa Homes            Consumer Goods      Japan                 1.6

  39    Edinburgh Partners      Financials          United Kingdom        1.2

        Total equity investments                                         93.9

        Cash and net assets                                               6.1

                                                                        100.0

* The investment is in non-voting shares
** The investment is in non-voting depositary receipts
*** The investment is in Class A ordinary shares


GEOGRAPHICAL DISTRIBUTION

31 March 2015                 % of Net Assets

Japan                                    34.6

Europe                                   23.4

Asia Pacific                             14.6

United States                            11.1

United Kingdom                           10.2

Cash and other net assets                 6.1

                                        100.0


SECTOR DISTRIBUTION

31 March 2015                 % of Net Assets

Financials                               22.9

Industrials                              17.9

Consumer Goods                           14.3

Health Care                              13.2

Technology                               10.6

Telecommunications                        4.9

Consumer Services                         4.6

Oil & Gas                                 3.8

Basic Materials                           1.7

Cash and other net assets                 6.1

                                        100.0

As at 31 March 2015, the net assets of the Company were £124,364,000.

14 April 2015


Enquiries:

Kenneth Greig
Edinburgh Partners AIFM Limited
Tel: 0131 270 3800

The Company's registered office address is:

27-31 Melville Street
Edinburgh
EH3 7JF

Copyright l 14 PR Newswire
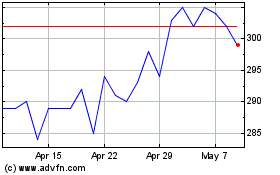
Global Opportunities (LSE:GOT)
Historical Stock Chart
From Aug 2024 to Sep 2024

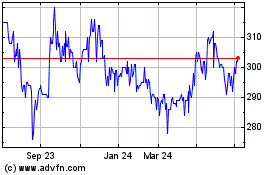
Global Opportunities (LSE:GOT)
Historical Stock Chart
From Sep 2023 to Sep 2024
