UNITED STATES
SECURITIES AND EXCHANGE COMMISSION
Washington, D.C. 20549
FORM N-CSR
CERTIFIED SHAREHOLDER REPORT OF REGISTERED
MANAGEMENT INVESTMENT COMPANIES
|
|
|
| Investment Company Act file number |
|
811-22253 |
Nuveen AMT-Free Municipal Value Fund
(Exact name of registrant as
specified in charter)
Nuveen Investments
333 West Wacker Drive
Chicago, IL
60606
(Address of principal
executive offices) (Zip code)
Mark L. Winget
Nuveen Investments
333 West Wacker
Drive
Chicago, IL 60606
(Name and address of agent for service)
|
|
|
| Registrant’s telephone number, including area code: |
|
(312) 917-7700 |
|
|
|
| Date of fiscal year end: |
|
October 31 |
|
|
|
| Date of reporting period: |
|
October 31, 2023 |
Form N-CSR is to be used by management investment companies to file reports with the
Commission not later than 10 days after the transmission to stockholders of any report that is required to be transmitted to stockholders under Rule 30e-1 under the Investment Company Act of 1940 (17 CFR 270.30e-1). The Commission may use the information provided on Form N-CSR in its regulatory, disclosure review, inspection, and policymaking roles.
A registrant is required to disclose the information specified by Form N-CSR, and the Commission will make this
information public. A registrant is not required to respond to the collection of information contained in Form N-CSR unless the Form displays a currently valid Office of Management and Budget (“OMB”)
control number. Please direct comments concerning the accuracy of the information collection burden estimate and any suggestions for reducing the burden to Secretary, Securities and Exchange Commission, 450 Fifth Street, NW, Washington, DC
20549-0609. The OMB has reviewed this collection of information under the clearance requirements of 44 U.S.C. ss. 3507.
| ITEM 1. |
REPORTS TO STOCKHOLDERS. |
|
|
|
|
|
|
|
|
|
|
|

|
|
Closed-End Funds |
|
|
|
October 31,
2023 |
Nuveen Municipal Closed-End Funds
|
|
|
| |
|
| Nuveen Municipal Value Fund, Inc. |
|
NUV |
| |
|
| Nuveen AMT-Free Municipal Value Fund |
|
NUW |
| |
|
| Nuveen Municipal Income Fund, Inc. |
|
NMI |
Annual
Report
Table
of Contents
2
Chair’s Letter
to Shareholders
|
|
|

|
|
Dear Shareholders,
Financial markets spent the past year focused on the direction of inflation and whether policy makers would be able to deliver a soft landing in their economies. After
more than a year and a half of interest rate increases by the U.S. Federal Reserve (Fed) and other central banks, financial conditions have tightened and inflation rates have cooled considerably. The Fed increased the target fed funds rate from near
zero in March 2022 to a range of 5.25% to 5.50% as of November 2023, with pauses in June 2023, September 2023 and November 2023. But current inflation rates remain above central banks’ targets, and the trajectory from here is difficult to
predict given that monetary policy acts on the economy with long and variable lags.
Surprisingly, economies were relatively resilient for much of 2023. By year-end, the “most predicted recession” had yet
to materialize in the U.S., while U.K. and European economic growth was just beginning to show signs of stagnation or decline. U.S. gross domestic product rose 5.2% in the third quarter of 2023, 2.1% in the second quarter of 2023 and 2.0% in the
first quarter of 2023, after growing 2.1% in 2022 overall compared to 2021. Much of the growth was driven by a relatively strong jobs market, which kept consumer sentiment and spending elevated despite long-term interest rates nearing multi-year
highs, a series of U.S. regional bank failures and shocks from flaring geopolitical tensions.
While central banks are likely nearing the end of this interest rate hiking cycle, there are still upside risks to inflation and downside risks to the economy. Some
labor market and consumer indicators are softening. Government funding and deficits remain a concern, especially as the U.S. election year gets underway. The markets will continue to try to anticipate monetary policy shifts as the Fed evaluates
incoming data and adjusts its rate setting activity on a meeting-by-meeting basis. Geopolitical risks – from relations with China, to wars in Europe and the Middle
East – also expand the range of outcomes from economies and markets around the world. All these uncertainties, and others, will remain sources of short-term market volatility. In this environment, Nuveen remains committed to filtering the
market noise for investable opportunities that ultimately serve long-term investment objectives. Maintaining a long-term perspective is also important for investors, and we encourage you to review your time horizon, risk tolerance and investment
goals with your financial professional. On behalf of the other members of the Nuveen Fund
Board, we look forward to continuing to earn your trust in the months and years ahead.

Terence J. Toth
Chair of the Board
December 22, 2023 |
3
Important Notices
Investment Policy Updates for NMI
Effective September 29, 2023, the
Fund’s Board of Directors approved certain investment policy changes for the Fund. The policy changes grant the Fund more flexibility to invest in lower rated municipal securities. For a description of the investment policy changes please see
the Shareholder Update section within this report. In addition, the Fund’s performance benchmark was changed from the S&P Municipal Bond Index to a linked benchmark comprised of the return streams from 100% of the S&P Municipal Bond
Index through September 29, 2023 and thereafter 100% of the S&P Municipal Yield Index. The Fund’s investment objective to provide a high level of current income exempt from federal income tax remains unchanged.
For more information regarding these changes, please visit Nuveen’s CEF homepage
www.nuveen.com/closed-end-funds.
Portfolio Manager Updates
Effective October 13, 2023, Kristen DeJong, CFA, and Scott Romans, Ph.D. were added as a portfolio manager of NMI. Effective October 13, 2023, Kristen DeJong,
CFA, was also added as a portfolio manager of NUV and NUW. Christopher Drahn will also continue to serve as a portfolio manager of NMI until his retirement on April 1, 2024. There were no other changes to the portfolio management of the Funds
during the reporting period.
4
Portfolio Managers’
Comments
Nuveen Municipal Value
Fund, Inc. (NUV)
Nuveen AMT-Free Municipal Value Fund (NUW)
Nuveen Municipal Income Fund, Inc. (NMI)
These Funds feature portfolio
management by Nuveen Asset Management, LLC (NAM), an affiliate of Nuveen Fund Advisors, LLC, the Funds’ investment adviser. Portfolio manager Daniel Close, CFA, and Kristen DeJong, CFA, manage the Nuveen Municipal Value Fund, Inc. (NUV) and
Nuveen AMT-Free Municipal Value Fund (NUW). Christopher Drahn, CFA, Kristen DeJong, CFA, and Scott Romans, PhD. serve as portfolio managers for the Nuveen Municipal Income Fund, Inc. (NMI).
Effective October 13, 2023, Kristen DeJong was added as portfolio manager of the Nuveen Municipal Value Fund, Inc. (NUV) and Nuveen AMT-Free Municipal Value Fund (NUW). Kristen DeJong and Scott Romans were added as portfolio managers of the Nuveen Municipal Income Fund, Inc. (NMI). Christopher Drahn will be retiring as a portfolio manager of NMI
on April 1, 2024.
Effective September 29, 2023, the benchmark for the Nuveen Municipal Income Fund, Inc. (NMI) changed to a linked benchmark
comprised of the return streams from 100% of the S&P Municipal Bond Index through September 29, 2023, and thereafter 100% of the S&P Municipal Yield Index.
Here the portfolio management teams discuss U.S. economic and municipal market conditions, key investment strategies and the Funds’ performance for the
twelve-month reporting period ended October 31, 2023. For more information on the Funds’ investment objectives and policies, please refer to the Shareholder Update section at the end of the report.
What factors affected the U.S. economy and market conditions during the twelve-month annual reporting period ended October 31, 2023?
The U.S. economy performed better than expected despite persistent inflationary pressure and rising interest rates during the twelve-month period ended October 31,
2023. Gross domestic product accelerated sharply in the third quarter of 2023 to an annualized rate of 5.2%, according to the U.S. Bureau of Economic Analysis second estimate, up from 2.1% in the second quarter of 2023. By comparison, GDP grew 2.1%
in 2022 overall. Early in the reporting period, inflation had risen sharply because of supply chain disruptions and high food and energy prices, the Russia-Ukraine war and China’s zero-COVID restrictions
(lifted in December 2022). Since then, price pressures have eased given normalization in supply chains, falling energy prices and aggressive measures by the U.S. Federal Reserve (Fed) and other global central banks to tighten financial conditions
and slow demand in their economies. Nevertheless, during the reporting period inflation levels remained much higher than central banks’ target levels.
The Fed
raised its target fed funds rate six times during the reporting period, bringing it to a range of 5.25% to 5.50% as of July 2023 and voting to hold it at that level at its next two meetings held near the end of the reporting period. For much of the
reporting period, the Fed’s activity led to significant volatility in bond and stock markets, given the uncertainty of how rising interest rates would affect the economy. One of the most highly visible impacts occurred in the U.S. regional
banking sector in March 2023, when Silicon Valley Bank, Signature Bank, First Republic Bank and Silvergate Bank failed. In the same month, Swiss bank UBS agreed to buy Credit Suisse, which was considered vulnerable in the current environment. The
Fed’s monetary tightening policy also contributed to an increase in the U.S. dollar’s value relative to major world currencies, which acts as a headwind to the profits of international companies and U.S. domestic companies with overseas
earnings.
During the reporting period, elevated inflation and higher borrowing costs weighed on some segments of the economy, including the real estate market.
Consumer spending, however, has remained more resilient than expected, in part because of a still-strong labor market, another key gauge of the economy’s health. As of October 2023, the unemployment rate was 3.9%, rising from its pre-pandemic low, with monthly job growth continuing to moderate. The strong labor market and wage gains helped the U.S. economy during the reporting period, even as the Fed sought to soften job growth to help curb
inflation pressures.
During the reporting period, investors also continued to monitor government funding and deficits. The U.S. government avoided a default
scenario after approving an increase to the debt ceiling limit in June 2023. At the same time, the potential for a government shutdown loomed but was ultimately avoided with funding resolutions passed in September 2023 and, subsequent to the close
of the reporting period, November 2023. Notably, in August 2023, ratings agency Fitch downgraded U.S. debt from AAA to AA+ based on concerns about the U.S.’s growing fiscal debt and reduced confidence in fiscal management.
The broad municipal bond market was impacted by interest rate volatility and economic uncertainty during the reporting period. Municipal yields rose across the maturity
spectrum, but the move was uneven. The greatest increase in yields was at the shorter end
5
Portfolio Managers’ Comments (continued)
of the curve as markets priced in a more aggressive pace of monetary tightening to combat
persistently high inflation. Although municipal bonds continued to exhibit relatively strong credit fundamentals, there were periods of spread widening during the reporting period as the market sell-off
continued.
Nuveen Municipal Value Fund, Inc. (NUV)
What key
strategies were used to manage the Fund during the twelve-month reporting period ended October 31, 2023?
NUV’s investment objective is to provide
current income exempt from regular federal income tax, investing primarily in a portfolio of municipal obligations issued by state and local government authorities or certain U.S. territories.
During the reporting period, the Fund’s trading activity remained focused on pursuing the Fund’s investment objective. The rising yield environment during this
reporting period was favorable for the Fund to reset embedded yields higher in its portfolio, primarily by executing on tax-loss swap opportunities. This strategy involves selling depreciated bonds with lower
embedded yields to reinvest in similarly structured, higher income-producing bonds to support the Fund’s income earnings and capture tax efficiencies.
During
the reporting period, buying was focused on longer dated, 4% and 5% coupon structures in the BBB to A rated credit quality range. Purchases were funded from the proceeds of called and maturing bonds, as well as from tax loss swapping.
As of October 31, 2023, NUV continued to use inverse floating rate securities. The Fund employs inverse floating rate securities, which are the residual interest in
a tender option bond (TOB) trust, and are sometimes referred to as “inverse floaters,” for a variety of reasons, including duration management, income enhancement and total return enhancement.
How did the Fund perform during the twelve-month reporting period ended October 31, 2023?
For the twelve-month reporting period ended October 31, 2023, NUV outperformed the S&P Municipal Bond Index. For the purposes of this Performance Commentary,
references to relative performance are in comparison to the S&P Municipal Bond Index.
The primary contributor to NUV’s relative performance was its
overweights to A and BBB rated credit quality bonds and corresponding underweights to AAA and AA rated bonds. Security selection also contributed to the Fund’s relative performance, particularly in zero coupon bonds held over the full reporting
period and a position in the Florida high speed rail, Brightline, which was still held at the end of the reporting period. Brightline’s Orlando station completed construction and opened to the public during the period while ridership growth has
continued to gain momentum. In addition, the Fund benefited from an overweight allocation to the outperforming dedicated tax sector and an underweight to the life care sector, which mitigated the fund’s exposure to the sector’s downturn.
Partially offsetting the Fund’s outperformance was an underweight to the industrial development revenue (IDR) sector, which outperformed during the reporting
period. Additionally, relative performance was negatively impacted by the Fund’s exposure to bonds purchased earlier in the reporting period when interest rates were lower. These bonds generally underperformed as rates rose over the remainder
of the reporting period.
Nuveen AMT-Free Municipal Value Fund (NUW)
What key strategies were used to manage the Fund during the twelve-month reporting period ended October 31, 2023?
NUW’s investment objective is to provide current income exempt from regular federal income tax, investing primarily in a portfolio of municipal obligations issued
by state and local government authorities or certain U.S. territories.
During the reporting period, the Fund’s trading activity remained focused on pursuing
the Fund’s investment objectives. The rising yield environment during this reporting period was favorable for the Fund to reset embedded yields higher in its portfolio, primarily by executing on tax-loss
swap opportunities. This strategy involves selling depreciated bonds with lower embedded yields to reinvest in similarly structured, higher income-producing bonds to support the Fund’s income earnings and capture tax efficiencies.
During the reporting period, buying was focused on longer dated, 4% and 5% coupon structures in the BBB to A rated credit quality range. Purchases were funded from the
proceeds of called and maturing bonds, as well as from tax loss swapping.
6
As of October 31, 2023, NUW continued to use inverse floating rate securities. The Fund
employs inverse floating rate securities, which are the residual interest in a tender option bond (TOB) trust, and are sometimes referred to as “inverse floaters,” for a variety of reasons, including duration management, income enhancement
and total return enhancement.
How did the Fund perform during the twelve-month reporting period ended October 31, 2023?
For the twelve-month reporting period ended October 31, 2023, NUW outperformed the S&P Municipal Bond Index. For the purposes of this Performance Commentary,
references to relative performance are in comparison to the S&P Municipal Bond Index.
The primary contributor to NUW’s relative performance was security
selection, particularly in zero coupon bonds, which recovered from lows during the period. NUW’s overall duration positioning was also favorable. The Fund’s underweight to the shortest (zero to four year) duration bonds contributed
positively to relative performance earlier in the reporting period while an overweight to the longest (10 years and longer) duration bonds added value later in the period. NUW’s duration shortening hedge through interest rate futures also
positively impacted relative performance over the reporting period. NUW’s credit quality positioning was advantageous, as credit spreads narrowed occasionally throughout the period. Overweight allocations to A and BBB rated bonds added to
relative performance as lower rated categories outperformed the highest grade (AAA and AA rated) categories.
NUW’s outperformance was partially offset by an
underweight to the “other transportation” sector, and especially New York MTA (Metropolitan Transportation Authority) bonds, both of which outperformed. Additionally, relative performance was negatively impacted by the Fund’s exposure
to bonds purchased earlier in the reporting period when interest rates were lower. These bonds generally underperformed as rates rose over the remainder of the reporting period.
Nuveen Municipal Income Fund, Inc. (NMI)
What key strategies were used to
manage the Fund during the twelve-month reporting period ended October 31, 2023?
NMI’s investment objective is to provide current income exempt from
regular federal income tax, investing primarily in a portfolio of municipal obligations issued by state and local government authorities or certain U.S. territories.
During the reporting period, the Fund’s trading activity remained focused on pursuing the Fund’s investment objective. The rising yield environment during this
reporting period was favorable for the Fund to reset embedded yields higher in its portfolio, primarily by executing on tax-loss swap opportunities. This strategy involves selling depreciated bonds with lower
embedded yields to reinvest in similarly structured, higher income-producing bonds to support the Fund’s income earnings and capture tax efficiencies.
The
Fund’s weighting in the pre-refunded sector declined over the reporting period, driven by bond calls and maturities. The portfolio management team reinvested the proceeds across a diverse group of
sectors. Notably, NMI increased its weighting in A rated bonds and the airport sector during the reporting period. In October 2023, as a result of investment policy and other related changes, the portfolio management team increased NMI’s
exposure to sub investment grade and non-rated bonds and lengthened the Fund’s duration to align it with the S&P Municipal Yield Index.
How did the Fund perform during the twelve-month reporting period ended October 31, 2023?
For the twelve-month reporting period ended October 31, 2023, NMI outperformed the NMI Linked Benchmark. For the purposes of this reporting period, references to
relative performance are in comparison to the NMI Linked Benchmark, which represents the linked returns between the S&P Municipal Bond Index (through September 29, 2023) and the S&P Municipal Yield Index (subsequent to
September 29, 2023).
During the first 11 months of the reporting period, the primary contributor to NMI’s relative performance versus the S&P
Municipal Bond Index was its overweight to longer-duration bonds. Additional contributors during the first 11 months of the reporting period included overweights to A, BBB and BB rated bonds. The Fund also benefited from overweights to airports and
toll roads, which saw traffic and travel volumes rebound to pre-pandemic levels, and underweights to state and local general obligation bonds, which helped offset the sector’s relative underperformance.
In the one-month period ended October 31, 2023, NMI’s outperformance relative to the S&P Municipal Yield Index was driven by its overweight to higher rated bonds.
7
Portfolio Managers’ Comments (continued)
During the reporting period, there were no material detractors from relative performance.
This material is not intended to be a recommendation or investment advice, does not constitute a solicitation to buy, sell or hold a security or an investment
strategy, and is not provided in a fiduciary capacity. The information provided does not take into account the specific objectives or circumstances of any particular investor, or suggest any specific course of action. Investment decisions should be
made based on an investor’s objectives and circumstances and in consultation with his or her advisors.
Certain statements in this report are
forward-looking statements. Discussions of specific investments are for illustration only and are not intended as recommendations of individual investments. The forward-looking statements and other views expressed herein are those of the portfolio
managers as of the date of this report. Actual future results or occurrences may differ significantly from those anticipated in any forward-looking statements, and the views expressed herein are subject to change at any time, due to numerous market
and other factors. The Funds disclaim any obligation to update publicly or revise any forward-looking statements or views expressed herein.
For financial
reporting purposes, the ratings disclosed are the highest rating given by one of the following national rating agencies: Standard & Poor’s Group (S&P), Moody’s Investors Service, Inc. (Moody’s) or Fitch, Inc. (Fitch).
This treatment of split-rated securities may differ from that used for other purposes, such as for Fund investment policies. Credit ratings are subject to change. AAA, AA, A and BBB are investment grade ratings, while BB, B, CCC, CC, C and D are
below investment grade ratings. Holdings designated N/R are not rated by these national rating agencies.
Bond insurance guarantees only the payment of
principal and interest on the bond when due, and not the value of the bonds themselves, which will fluctuate with the bond market and the financial success of the issuer and the insurer. Insurance relates specifically to the bonds in the portfolio
and not to the share prices of a Fund. No representation is made as to the insurers’ ability to meet their commitments.
Refer to the Glossary of Terms
Used in this Report for further definition of the terms used within this section.
8
Common Share Information
COMMON SHARE DISTRIBUTION INFORMATION
The following information
regarding the Funds’ distributions is current as of October 31, 2023. Each Fund’s distribution levels may vary over time based on each Fund’s investment activity and portfolio investment value changes.
During the current reporting period, each Fund’s distributions to common shareholders were as shown in the accompanying table.
|
|
|
|
|
|
|
| |
|
Per Common Share Amounts |
| Monthly Distributions (Ex-Dividend Date) |
|
NUV |
|
NUW |
|
NMI |
|
|
|
|
| November |
|
$0.0280 |
|
$0.0390 |
|
$0.0300 |
| December |
|
0.0280 |
|
0.0390 |
|
0.0300 |
| January |
|
0.0280 |
|
0.0390 |
|
0.0300 |
| February |
|
0.0280 |
|
0.0390 |
|
0.0300 |
| March |
|
0.0280 |
|
0.0390 |
|
0.0300 |
| April |
|
0.0280 |
|
0.0405 |
|
0.0300 |
| May |
|
0.0280 |
|
0.0405 |
|
0.0300 |
| June |
|
0.0280 |
|
0.0405 |
|
0.0300 |
| July |
|
0.0280 |
|
0.0405 |
|
0.0315 |
| August |
|
0.0280 |
|
0.0405 |
|
0.0315 |
| September |
|
0.0280 |
|
0.0405 |
|
0.0315 |
| October |
|
0.0290 |
|
0.0425 |
|
0.0315 |
| Total Distributions from Net
Investment Income |
|
$0.3370 |
|
$0.4805 |
|
$0.3660 |
|
|
|
|
| Yields |
|
NUV |
|
NUW |
|
NMI |
| Market Yield1 |
|
4.36% |
|
4.05% |
|
4.53% |
| Taxable-Equivalent
Yield1 |
|
7.34% |
|
6.84% |
|
7.65% |
| 1 |
Market Yield is based on the Fund’s current annualized monthly dividend divided by the Fund’s current market
price as of the end of the reporting period. Taxable-Equivalent Yield represents the yield that must be earned on a fully taxable investment in order to equal the yield of the Fund on an after-tax basis. It is
based on a federal income tax rate of 40.8%. Your actual federal income tax rate may differ from the assumed rate. The Taxable-Equivalent Yield also takes into account the percentage of the Fund’s income generated and paid by the Fund (based on
payments made during the previous calendar year) that was not exempt from federal income tax. Separately, if the comparison were instead to investments that generate qualified dividend income, which is taxable at a rate lower than an
individual’s ordinary graduated tax rate, the fund’s Taxable-Equivalent Yield would be lower. |
Each Fund seeks to pay regular monthly
dividends out of its net investment income at a rate that reflects its past and projected net income performance. To permit each Fund to maintain a more stable monthly dividend, the Fund may pay dividends at a rate that may be more or less than the
amount of net income actually earned by the Fund during the period. Distributions to common shareholders are determined on a tax basis, which may differ from amounts recorded in the accounting records. In instances where the monthly dividend exceeds
the earned net investment income, the Fund would report a negative undistributed net ordinary income. Refer to the Notes to Financial Statements for additional information regarding the amounts of undistributed net ordinary income and
undistributed net long-term capital gains and the character of the actual distributions paid by the Fund during the period.
All monthly dividends paid by each Fund
during the current reporting period were paid from net investment income. If a portion of the Fund’s monthly distributions is sourced or comprised of elements other than net investment income, including capital gains and/ or a return of
capital, shareholders will be notified of those sources. For financial reporting purposes, the per share amounts of each Fund’s distributions for the reporting period are presented in this report’s Financial Highlights. For income tax
purposes, distribution information for each Fund as of its most recent tax year end is presented in the Notes to Financial Statements of this report.
Updated Distribution Policy
On October 23, 2023, the Funds’ Board
of Trustees (the “Board”) updated each Fund’s distribution policy. Effective for distributions payable on December 1, 2023, each Fund’s distribution policy, which may be changed by the Board, is to make regular monthly cash
distributions to holders of its common shares (stated in terms of a fixed cents per common share dividend distribution rate which may be set from time to time). The Fund intends to distribute all or substantially all of its net investment income
through its regular monthly distribution and to distribute realized capital gains at least annually. In addition, in any monthly period, to maintain its declared per common share distribution amount, the Fund may distribute more or less than its net
investment income during the period. In the event the Fund distributes more than its net investment income during any yearly period, such distributions may also include realized gains and/or a return of capital. To the extent that a distribution
includes a return of capital the NAV per share may erode. If the Fund’s distribution includes anything other than net investment income, the Fund will provide a notice to shareholders
9
Common Share Information (continued)
of its best estimate of the distribution sources at that the time of the distribution. These
estimates may not match the final tax characterization (for the full year’s distributions) contained in shareholders’ 1099-DIV forms after the end of the year.
NUVEEN CLOSED-END FUND DISTRIBUTION AMOUNTS
The Nuveen Closed-End Funds’ monthly and quarterly periodic distributions to shareholders are posted on www.nuveen.com and
can be found on Nuveen’s enhanced closed-end fund resource page, which is at https://www.nuveen.com/resource-center-closedend funds, along with other Nuveen
closed-end fund product updates. To ensure timely access to the latest information, shareholders may use a subscribe function, which can be activated at this web page (https://www.nuveen.com/subscriptions).
COMMON SHARE EQUITY SHELF PROGRAM
During the current reporting
period, NMI was authorized by the Securities and Exchange Commission to issue additional common shares through an equity shelf program (Shelf Offering). Under these programs, NMI, subject to market conditions, may raise additional capital
from time to time in varying amounts and offering methods at a net price at or above the Fund’s NAV per common share. The maximum aggregate offering under these Shelf Offerings are as shown in the accompanying table.
|
|
|
| |
|
NMI |
| Additional authorized common shares |
|
2,000,000 |
During the current reporting period, the Fund sold common shares through their Shelf Offerings at a weighted average premium to their NAV
per common share as shown in the accompanying table.
|
|
|
| |
|
NMI |
| Common shares sold through shelf offering |
|
4,954 |
| Weighted average premium to NAV per common share sold |
|
1.11% |
Refer to the Notes to Financial Statements for further details on Shelf Offerings and the Fund’s transactions.
COMMON SHARE REPURCHASES
The Funds’ Board of Directors/Trustees
reauthorized an open-market share repurchase program, allowing each Fund to repurchase and retire an aggregate of up to approximately 10% of its outstanding common shares.
During the current reporting period, the Funds did not repurchase any of their outstanding common shares. As of October 31, 2023, (and since the inception of the
Funds’ repurchase programs), each Fund has cumulatively repurchased and retired its outstanding common shares as shown in the accompanying table.
|
|
|
|
|
|
|
| |
|
NUV |
|
NUW |
|
NMI |
| Common shares cumulatively repurchased and retired |
|
0 |
|
0 |
|
0 |
| Common shares authorized for repurchase |
|
20,750,000 |
|
1,795,000 |
|
1,005,000 |
OTHER COMMON SHARE INFORMATION
As of
October 31, 2023, the Funds’ common share prices were trading at a premium/(discount) to their common share NAVs and trading at an average premium/(discount) to NAV during the current reporting period, as follows:
|
|
|
|
|
|
|
| |
|
NUV |
|
NUW |
|
NMI |
| Common share NAV |
|
$ 8.69 |
|
$ 14.20 |
|
$ 9.16 |
| Common share price |
|
$ 7.99 |
|
$ 12.60 |
|
$ 8.35 |
| Premium/(Discount) to NAV |
|
(8.06)% |
|
(11.27)% |
|
(8.84)% |
| Average premium/(discount) to NAV |
|
(6.03)% |
|
(8.73)% |
|
(4.55)% |
10
About the Funds’ Benchmarks
S&P Municipal Bond Index: An index designed to measure the performance of the tax-exempt U.S. municipal bond market. Index returns assume reinvestment of distributions, but do not reflect any
applicable sales charges or management fees.
S&P Municipal Yield Index: An index that is structured so that 70% of the index consists of bonds that are either not rated or are rated below investment grade, 20% are rated BBB/Baa, and 10% are rated single A. Index returns assume
reinvestment of distributions, but do not reflect any applicable sales charges or management fees.
NMI
Linked Benchmark: Represents the linked returns between the S&P Municipal Bond Index (defined herein) through September 29, 2023 and the S&P Municipal Yield Index (defined
herein) subsequent to September 29, 2023.
11
|
|
|
| NUV |
|
Nuveen Municipal Value Fund,
Inc. Performance Overview and Holding Summaries as of
October 31, 2023 |
Refer to the Glossary of Terms Used in this Report for further definition of the terms used within this section.
Fund Performance*
|
|
|
|
|
|
|
|
|
|
|
|
|
|
|
|
|
| |
|
|
|
|
Total Returns as of
October 31, 2023
|
|
| |
|
|
|
|
Average Annual |
|
| |
|
Inception
Date |
|
|
1-Year |
|
|
5-Year |
|
|
10-Year |
|
| |
|
| NUV at Common Share NAV |
|
|
6/17/87 |
|
|
|
2.79% |
|
|
|
1.04% |
|
|
|
2.77% |
|
| |
|
| NUV at Common Share Price |
|
|
6/17/87 |
|
|
|
(0.52)% |
|
|
|
0.84% |
|
|
|
2.64% |
|
| |
|
| S&P Municipal Bond Index |
|
|
– |
|
|
|
2.36% |
|
|
|
1.04% |
|
|
|
2.18% |
|
| |
|
*For purposes of Fund performance, relative results are measured against the S&P Municipal Bond Index.
Performance data shown represents past performance and does not predict or guarantee future results. Current performance may be higher or lower than the data shown.
Returns do not reflect the deduction of taxes that shareholders may have to pay on Fund distributions or upon the sale of Fund shares. Returns at NAV are net of Fund expenses, and assume reinvestment of distributions. Comparative index return
information is provided for the Fund’s shares at NAV only. Indexes are not available for direct investment.
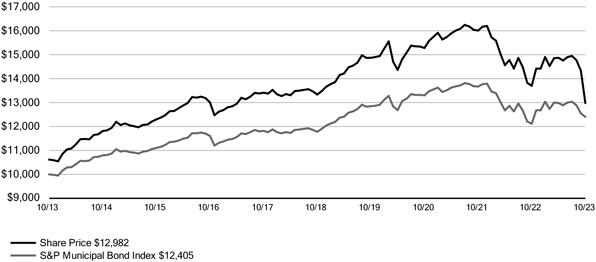
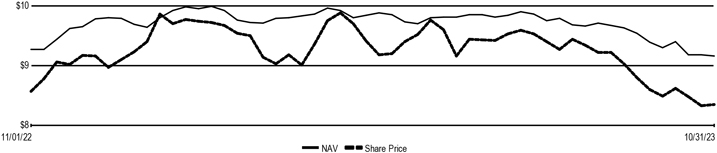
Daily Common Share NAV and Share Price
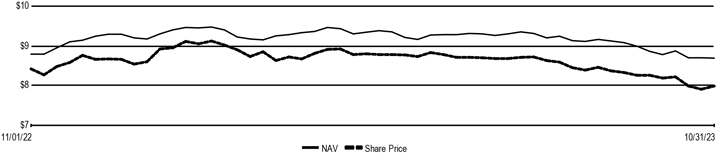
Growth of an Assumed $10,000 Investment as of October 31, 2023 - Common Share
Price
12
Holdings Summaries as of October 31, 2023
This data relates to the securities held in the Fund’s portfolio of investments as of the end of the reporting period. It should not be construed as a measure of
performance for the Fund itself. Holdings are subject to change.
For financial reporting purposes, the ratings disclosed are the highest rating given by one of
the following national rating agencies: Standard & Poor’s Group, Moody’s Investors Service, Inc. or Fitch, Inc. This treatment of split-rated securities may differ from that used for other purposes, such as for Fund investment
policies. Credit ratings are subject to change. AAA, AA, A and BBB are investment grade ratings; BB, B, CCC, CC, C and D are below-investment grade ratings. Holdings designated N/R are not rated by these national rating agencies.
|
|
|
|
|
| Fund Allocation |
|
|
|
| (% of net assets) |
|
|
|
| |
|
| Municipal Bonds |
|
|
99.5% |
|
| |
|
| Other Assets & Liabilities, Net |
|
|
1.7% |
|
| |
|
| Floating Rate Obligations |
|
|
(1.2)% |
|
| |
|
| Net Assets |
|
|
100% |
|
| |
|
|
|
| Bond Credit Quality |
|
|
|
| (% of total investment exposure) |
|
|
|
| |
|
| U.S. Guaranteed |
|
|
4.2% |
|
| |
|
| AAA |
|
|
7.6% |
|
| |
|
| AA |
|
|
40.4% |
|
| |
|
| A |
|
|
28.4% |
|
| |
|
| BBB |
|
|
11.2% |
|
| |
|
| BB or Lower |
|
|
2.3% |
|
| |
|
| N/R (not rated) |
|
|
5.9% |
|
| |
|
| Total |
|
|
100% |
|
| |
|
|
|
|
|
|
| Portfolio Composition |
|
|
|
| (% of total investments) |
|
|
|
| |
|
| Tax Obligation/Limited |
|
|
28.4% |
|
| |
|
| Transportation |
|
|
20.6% |
|
| |
|
| Tax Obligation/General |
|
|
14.4% |
|
| |
|
| Utilities |
|
|
14.2% |
|
| |
|
| Health Care |
|
|
7.6% |
|
| |
|
| Education and Civic Organizations |
|
|
4.8% |
|
| |
|
| U.S. Guaranteed |
|
|
4.7% |
|
| |
|
| Other |
|
|
5.3% |
|
| |
|
| Total |
|
|
100% |
|
| |
|
|
|
|
|
|
| States and Territories1 |
|
|
|
| (% of total municipal bonds) |
|
|
|
| |
|
| Texas |
|
|
13.1% |
|
| |
|
| Illinois |
|
|
11.0% |
|
| |
|
| New York |
|
|
7.6% |
|
| |
|
| California |
|
|
6.5% |
|
| |
|
| Colorado |
|
|
6.4% |
|
| |
|
| Florida |
|
|
5.7% |
|
| |
|
| New Jersey |
|
|
4.5% |
|
| |
|
| Ohio |
|
|
4.0% |
|
| |
|
| Washington |
|
|
4.0% |
|
| |
|
| Georgia |
|
|
4.0% |
|
| |
|
| Michigan |
|
|
3.0% |
|
| |
|
| Nevada |
|
|
2.7% |
|
| |
|
| South Carolina |
|
|
2.4% |
|
| |
|
| Pennsylvania |
|
|
2.1% |
|
| |
|
| Kentucky |
|
|
1.8% |
|
| |
|
| Puerto Rico |
|
|
1.8% |
|
| |
|
| District of Columbia |
|
|
1.7% |
|
| |
|
| Tennessee |
|
|
1.5% |
|
| |
|
| Oklahoma |
|
|
1.4% |
|
| |
|
| Utah |
|
|
1.4% |
|
| |
|
| Other |
|
|
13.4% |
|
| |
|
| Total |
|
|
100% |
|
| |
|
| 1 |
See the Portfolio of Investments for the remaining states comprising “Other” and not listed in the table above.
|
13
|
|
|
| NUW |
|
Nuveen AMT-Free Municipal
Value Fund Performance Overview and Holding Summaries as of
October 31, 2023 |
Refer to the Glossary of Terms Used in this Report for further definition of the terms used within this section.
Fund Performance*
|
|
|
|
|
|
|
|
|
|
|
|
|
|
|
|
|
| |
|
|
|
|
Total Returns as of
October 31, 2023 |
|
| |
|
|
|
|
Average Annual |
|
| |
|
Inception
Date |
|
|
1-Year |
|
|
5-Year |
|
|
10-Year |
|
| |
|
| NUW at Common Share NAV |
|
|
2/25/09 |
|
|
|
3.27% |
|
|
|
1.24% |
|
|
|
2.79% |
|
| |
|
| NUW at Common Share Price |
|
|
2/25/09 |
|
|
|
(1.08)% |
|
|
|
1.04% |
|
|
|
2.42% |
|
| |
|
| S&P Municipal Bond Index |
|
|
– |
|
|
|
2.36% |
|
|
|
1.04% |
|
|
|
2.18% |
|
| |
|
*For purposes of Fund performance, relative results are measured against the S&P Municipal Bond Index.
Performance data shown represents past performance and does not predict or guarantee future results. Current performance may be higher or lower than the data shown.
Returns do not reflect the deduction of taxes that shareholders may have to pay on Fund distributions or upon the sale of Fund shares. Returns at NAV are net of Fund expenses, and assume reinvestment of distributions. Comparative index return
information is provided for the Fund’s shares at NAV only. Indexes are not available for direct investment.
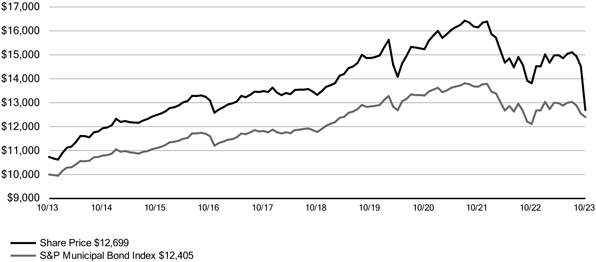
Daily Common Share NAV and Share Price
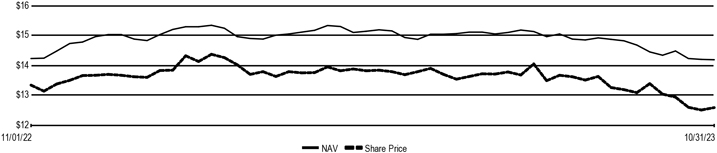
Growth of an Assumed $10,000 Investment as of October 31, 2023 - Common Share
Price
14
Holdings Summaries as of October 31, 2023
This data relates to the securities held in the Fund’s portfolio of investments as of the end of the reporting period. It should not be construed as a measure of
performance for the Fund itself. Holdings are subject to change.
For financial reporting purposes, the ratings disclosed are the highest rating given by one of
the following national rating agencies: Standard & Poor’s Group, Moody’s Investors Service, Inc. or Fitch, Inc. This treatment of split-rated securities may differ from that used for other purposes, such as for Fund investment
policies. Credit ratings are subject to change. AAA, AA, A and BBB are investment grade ratings; BB, B, CCC, CC, C and D are below-investment grade ratings. Holdings designated N/R are not rated by these national rating agencies.
|
|
|
|
|
| Fund Allocation |
|
|
|
| (% of net assets) |
|
|
|
| |
|
| Municipal Bonds |
|
|
98.5% |
|
| |
|
| Common Stocks |
|
|
0.5% |
|
| |
|
| Other Assets & Liabilities, Net |
|
|
1.8% |
|
| |
|
| Floating Rate Obligations |
|
|
(0.8)% |
|
| |
|
| Net Assets |
|
|
100% |
|
| |
|
|
|
| Bond Credit Quality |
|
|
|
| (% of total investment exposure) |
|
|
|
| |
|
| U.S. Guaranteed |
|
|
1.6% |
|
| |
|
| AAA |
|
|
7.7% |
|
| |
|
| AA |
|
|
40.8% |
|
| |
|
| A |
|
|
29.6% |
|
| |
|
| BBB |
|
|
11.7% |
|
| |
|
| BB or Lower |
|
|
2.0% |
|
| |
|
| N/R (not rated) |
|
|
6.1% |
|
| |
|
| N/A (not applicable) |
|
|
0.5% |
|
| |
|
| Total |
|
|
100% |
|
| |
|
|
|
|
|
|
| Portfolio Composition |
|
|
|
| (% of total investments) |
|
|
|
| |
|
| Tax Obligation/Limited |
|
|
24.2% |
|
| |
|
| Utilities |
|
|
20.2% |
|
| |
|
| Tax Obligation/General |
|
|
16.9% |
|
| |
|
| Transportation |
|
|
10.5% |
|
| |
|
| Health Care |
|
|
9.5% |
|
| |
|
| Education and Civic Organizations |
|
|
7.2% |
|
| |
|
| Consumer Staples |
|
|
4.4% |
|
| |
|
| Other |
|
|
6.6% |
|
| |
|
| Common Stocks |
|
|
0.5% |
|
| |
|
| Total |
|
|
100% |
|
| |
|
|
|
|
|
|
| States and Territories1 |
|
|
|
| (% of total municipal bonds) |
|
|
|
| |
|
| California |
|
|
11.5% |
|
| |
|
| Illinois |
|
|
10.4% |
|
| |
|
| Texas |
|
|
9.6% |
|
| |
|
| New York |
|
|
6.9% |
|
| |
|
| New Jersey |
|
|
6.9% |
|
| |
|
| Nevada |
|
|
5.6% |
|
| |
|
| Pennsylvania |
|
|
4.4% |
|
| |
|
| Ohio |
|
|
4.2% |
|
| |
|
| Colorado |
|
|
4.1% |
|
| |
|
| Florida |
|
|
3.8% |
|
| |
|
| Tennessee |
|
|
3.8% |
|
| |
|
| Washington |
|
|
3.5% |
|
| |
|
| Kentucky |
|
|
3.4% |
|
| |
|
| Maryland |
|
|
3.2% |
|
| |
|
| Puerto Rico |
|
|
3.0% |
|
| |
|
| Georgia |
|
|
2.6% |
|
| |
|
| South Carolina |
|
|
1.7% |
|
| |
|
| West Virginia |
|
|
1.5% |
|
| |
|
| Arizona |
|
|
1.3% |
|
| |
|
| Minnesota |
|
|
1.2% |
|
| |
|
| Other |
|
|
7.4% |
|
| |
|
| Total |
|
|
100% |
|
| |
|
| 1 |
See the Portfolio of Investments for the remaining states comprising “Other” and not listed in the table above.
|
15
|
|
|
| NMI |
|
Nuveen Municipal Income Fund, Inc. |
| |
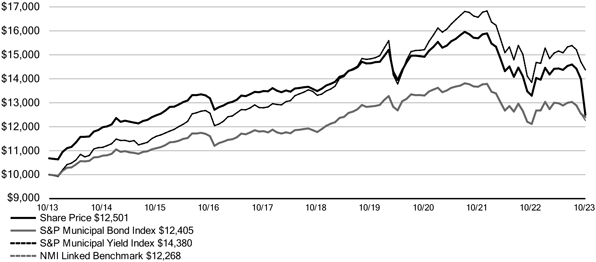
Performance Overview and Holding Summaries as of October 31, 2023 |
Refer to the Glossary of Terms Used in this Report for further definition of the terms used within this section.
Fund Performance*
|
|
|
|
|
|
|
|
|
|
|
|
|
|
|
|
|
| |
|
|
|
|
Total Returns as of
October 31, 2023 |
|
| |
|
|
|
|
Average Annual |
|
| |
|
Inception
Date |
|
|
1-Year |
|
|
5-Year |
|
|
10-Year |
|
| |
|
| NMI at Common Share NAV |
|
|
4/20/88 |
|
|
|
2.94% |
|
|
|
0.24% |
|
|
|
2.47% |
|
| |
|
| NMI at Common Share Price |
|
|
4/20/88 |
|
|
|
1.80% |
|
|
|
0.05% |
|
|
|
2.26% |
|
| |
|
| S&P Municipal Bond Index |
|
|
– |
|
|
|
2.36% |
|
|
|
1.04% |
|
|
|
2.18% |
|
| |
|
| S&P Municipal Yield Index |
|
|
– |
|
|
|
3.80% |
|
|
|
1.55% |
|
|
|
3.70% |
|
| |
|
| NMI Linked Benchmark |
|
|
– |
|
|
|
1.23% |
|
|
|
0.81% |
|
|
|
2.06% |
|
| |
|
*For purposes of Fund performance, relative results are measured against the linked returns between the S&P Municipal Bond Index
(through September 29, 2023) and the S&P Municipal Yield Index (subsequent to September 29, 2023).
Performance data shown represents past performance
and does not predict or guarantee future results. Current performance may be higher or lower than the data shown. Returns do not reflect the deduction of taxes that shareholders may have to pay on Fund distributions or upon the sale of Fund shares.
Returns at NAV are net of Fund expenses, and assume reinvestment of distributions. Comparative index return information is provided for the Fund’s shares at NAV only. Indexes are not available for direct investment.
Daily Common Share NAV and Share Price
Growth of an Assumed $10,000 Investment as of October 31, 2023 - Common Share
Price
16
Holdings Summaries as of October 31, 2023
This data relates to the securities held in the Fund’s portfolio of investments as of the end of the reporting period. It should not be construed as a measure of
performance for the Fund itself. Holdings are subject to change.
For financial reporting purposes, the ratings disclosed are the highest rating given by one of
the following national rating agencies: Standard & Poor’s Group, Moody’s Investors Service, Inc. or Fitch, Inc. This treatment of split-rated securities may differ from that used for other purposes, such as for Fund investment
policies. Credit ratings are subject to change. AAA, AA, A and BBB are investment grade ratings; BB, B, CCC, CC, C and D are below-investment grade ratings. Holdings designated N/R are not rated by these national rating agencies.
|
|
|
|
|
| Fund Allocation (% of net assets) |
|
|
|
| |
|
| Municipal Bonds |
|
|
96.6% |
|
| |
|
| Short-Term Municipal Bonds |
|
|
2.9% |
|
| |
|
| Other Assets & Liabilities, Net |
|
|
0.5% |
|
| |
|
| Net Assets |
|
|
100% |
|
| |
|
|
|
| Bond Credit Quality
(% of total investment exposure) |
|
|
|
|
| |
|
| U.S. Guaranteed |
|
|
3.7% |
|
| |
|
| AAA |
|
|
2.1% |
|
| |
|
| AA |
|
|
29.0 |
|
| |
|
| A |
|
|
30.3% |
|
| |
|
| BBB |
|
|
11.0% |
|
| |
|
| BB or Lower |
|
|
6.1% |
|
| |
|
| N/R (not rated) |
|
|
17.8% |
|
| |
|
| Total |
|
|
100% |
|
| |
|
|
|
|
|
|
| Portfolio Composition (% of total
investments) |
|
|
|
| |
|
| Transportation |
|
|
21.2% |
|
| |
|
| Health Care |
|
|
21.0% |
|
| |
|
| Tax Obligation/Limited |
|
|
18.0% |
|
| |
|
| Education and Civic Organizations |
|
|
10.5% |
|
| |
|
| Utilities |
|
|
8.7% |
|
| |
|
| Tax Obligation/General |
|
|
7.4% |
|
| |
|
| Long-Term Care |
|
|
3.8% |
|
| |
|
| Other |
|
|
9.4% |
|
| |
|
| Total |
|
|
100% |
|
| |
|
|
|
|
|
|
| States and Territories1
(% of total municipal bonds) |
|
|
|
| |
|
| Colorado |
|
|
15.0% |
|
| |
|
| Illinois |
|
|
12.6% |
|
| |
|
| Texas |
|
|
10.2% |
|
| |
|
| Florida |
|
|
5.6% |
|
| |
|
| Arizona |
|
|
4.9% |
|
| |
|
| Missouri |
|
|
4.2% |
|
| |
|
| New York |
|
|
3.8% |
|
| |
|
| Wisconsin |
|
|
3.8% |
|
| |
|
| Indiana |
|
|
2.8% |
|
| |
|
| North Carolina |
|
|
2.8% |
|
| |
|
| California |
|
|
2.7% |
|
| |
|
| New Jersey |
|
|
2.6% |
|
| |
|
| Louisiana |
|
|
2.3% |
|
| |
|
| Pennsylvania |
|
|
2.3% |
|
| |
|
| Alabama |
|
|
2.3% |
|
| |
|
| Georgia |
|
|
2.2% |
|
| |
|
| Virginia |
|
|
2.0% |
|
| |
|
| Hawaii |
|
|
1.8% |
|
| |
|
| Minnesota |
|
|
1.8% |
|
| |
|
| Ohio |
|
|
1.8% |
|
| |
|
| Other |
|
|
12.5% |
|
| |
|
| Total |
|
|
100% |
|
| |
|
| 1 |
See the Portfolio of Investments for the remaining states comprising “Other” and not listed in the table above.
|
17
Shareholder Meeting Report
The annual meeting of shareholders was held on August 9, 2023, for NUV, NUW, and NMI; at this meeting the shareholders were asked to elect Board members.
|
|
|
|
|
|
|
|
|
|
|
|
|
| |
|
NUV |
|
|
NUW |
|
|
NMI |
|
| |
|
| |
|
Common
Shares |
|
|
Common
Shares |
|
|
Common
Shares |
|
| |
|
| Approval of the Board Members was reached as follows: |
|
|
|
|
|
|
|
|
|
|
|
|
|
|
|
|
| Amy B.R. Lancellotta |
|
|
|
|
|
|
|
|
|
|
|
|
| For |
|
|
167,611,770 |
|
|
|
14,293,466 |
|
|
|
7,951,418 |
|
| Withhold |
|
|
4,342,613 |
|
|
|
1,752,981 |
|
|
|
364,554 |
|
| |
|
| Total |
|
|
171,954,383 |
|
|
|
16,046,447 |
|
|
|
8,315,972 |
|
| |
|
|
|
|
|
| John K. Nelson |
|
|
|
|
|
|
|
|
|
|
|
|
| For |
|
|
167,524,604 |
|
|
|
14,153,422 |
|
|
|
7,922,811 |
|
| Withhold |
|
|
4,429,779 |
|
|
|
1,893,025 |
|
|
|
393,161 |
|
| |
|
| Total |
|
|
171,954,383 |
|
|
|
16,046,447 |
|
|
|
8,315,972 |
|
| |
|
|
|
|
|
| Terence J. Toth |
|
|
|
|
|
|
|
|
|
|
|
|
| For |
|
|
167,333,902 |
|
|
|
14,162,033 |
|
|
|
7,896,658 |
|
| Withhold |
|
|
4,620,481 |
|
|
|
1,884,414 |
|
|
|
419,314 |
|
| |
|
| Total |
|
|
171,954,383 |
|
|
|
16,046,447 |
|
|
|
8,315,972 |
|
| |
|
|
|
|
|
| Robert L. Young |
|
|
|
|
|
|
|
|
|
|
|
|
| For |
|
|
167,700,960 |
|
|
|
14,153,629 |
|
|
|
7,966,792 |
|
| Withhold |
|
|
4,253,423 |
|
|
|
1,892,818 |
|
|
|
349,180 |
|
| |
|
| Total |
|
|
171,954,383 |
|
|
|
16,046,447 |
|
|
|
8,315,972 |
|
| |
|
18
Report of Independent Registered
Public Accounting Firm
To the
Shareholders and Board of Directors/Trustees
Nuveen Municipal Value Fund, Inc., Nuveen AMT-Free Municipal Value Fund,
and Nuveen Municipal Income Fund, Inc.:
Opinion on the Financial Statements
We have audited the accompanying statements of assets and liabilities of Nuveen Municipal Value Fund, Inc., Nuveen AMT-Free
Municipal Value Fund, and Nuveen Municipal Income Fund, Inc. (the Funds), including the portfolios of investments, as of October 31, 2023, the related statements of operations for the year then ended, the statements of changes in net assets for
each of the years in the two-year period then ended, and the related notes (collectively, the financial statements) and the financial highlights for each of the years in the
five-year period then ended. In our opinion, the financial statements and financial highlights present fairly, in all material respects, the financial position of the Funds as of October 31, 2023, the
results of their operations for the year then ended, the changes in their net assets for each of the years in the two-year period then ended, and the financial highlights for each of the years in the five-year period then ended, in conformity with U.S. generally accepted accounting principles.
Basis for Opinion
These financial statements and financial highlights are the responsibility of the Funds’ management. Our responsibility is to express an opinion on these financial
statements and financial highlights based on our audits. We are a public accounting firm registered with the Public Company Accounting Oversight Board (United States) (PCAOB) and are required to be independent with respect to the Funds in accordance
with the U.S. federal securities laws and the applicable rules and regulations of the Securities and Exchange Commission and the PCAOB.
We conducted our audits in
accordance with the standards of the PCAOB. Those standards require that we plan and perform the audit to obtain reasonable assurance about whether the financial statements and financial highlights are free of material misstatement, whether due to
error or fraud. Our audits included performing procedures to assess the risks of material misstatement of the financial statements and financial highlights, whether due to error or fraud, and performing procedures that respond to those risks. Such
procedures included examining, on a test basis, evidence regarding the amounts and disclosures in the financial statements and financial highlights. Such procedures also included confirmation of securities owned as of October 31, 2023, by
correspondence with custodians and brokers; when replies were not received from brokers, we performed other auditing procedures. Our audits also included evaluating the accounting principles used and significant estimates made by management, as well
as evaluating the overall presentation of the financial statements and financial highlights. We believe that our audits provide a reasonable basis for our opinion.
/s/ KPMG LLP
We have served as the auditor of one or more Nuveen
investment companies since 2014.
Chicago, Illinois
December 28, 2023
19
|
|
|
| NUV |
|
Nuveen Municipal Value Fund, Inc. |
| |
Portfolio of Investments October 31, 2023 |
|
|
|
|
|
|
|
|
|
|
|
|
|
|
|
|
Principal
Amount (000) |
|
|
|
|
Description (a) |
|
|
Optional Call
Provisions (b) |
|
|
|
Value |
|
|
|
|
|
|
|
LONG-TERM INVESTMENTS - 99.5% |
|
|
|
|
|
|
|
|
|
|
|
|
|
|
|
|
|
|
|
MUNICIPAL BONDS - 99.5% |
|
|
|
|
|
|
|
|
|
|
|
|
|
|
|
|
|
|
|
Alabama - 0.2% |
|
|
|
|
|
|
|
|
|
|
|
|
|
|
|
|
|
|
|
Birmingham Airport Authority, Alabama, Airport Revenue Bonds, Series 2020: |
|
|
|
|
|
|
|
|
| $ |
255 |
|
|
|
|
4.000%, 7/01/39 - BAM Insured |
|
|
7/30 at 100.00 |
|
|
$ |
232,507 |
|
| |
225 |
|
|
|
|
4.000%, 7/01/40 - BAM Insured |
|
|
7/30 at 100.00 |
|
|
|
203,945 |
|
|
|
|
|
|
| |
3,805 |
|
|
(c) |
|
Homewood, Alabama, General Obligation Warrants, Series 2016, 5.000%, 9/01/36, (Pre-refunded 9/01/26) |
|
|
9/26 at 100.00 |
|
|
|
3,938,059 |
|
|
|
|
|
|
|
Total Alabama |
|
|
|
|
|
|
4,374,511 |
|
|
|
|
|
|
|
|
|
|
|
|
Alaska - 0.4% |
|
|
|
|
|
|
|
|
|
|
|
|
|
| |
9,750 |
|
|
|
|
Anchorage, Alaska, Solid Waste Services Revenue Bonds, Refunding Series 2022A, 4.000%, 11/01/52 |
|
|
11/32 at 100.00 |
|
|
|
8,021,167 |
|
|
|
|
|
|
| |
110 |
|
|
|
|
Northern Tobacco Securitization Corporation, Alaska, Tobacco Settlement Asset-Backed
Bonds, Senior Series 2021A Class 1, 4.000%, 6/01/50 |
|
|
6/31 at 100.00 |
|
|
|
88,132 |
|
|
|
|
|
|
|
Total Alaska |
|
|
|
|
|
|
8,109,299 |
|
|
|
|
|
|
|
|
|
|
|
|
Arizona - 1.0% |
|
|
|
|
|
|
|
|
|
|
|
|
|
| |
1,915 |
|
|
|
|
Chandler Industrial Development Authority, Arizona, Industrial Development Revenue Bonds, Intel Corporation Project, Series 2019,
5.000%, 6/01/49, (AMT), (Mandatory Put 6/03/24) |
|
|
6/24 at 100.00 |
|
|
|
1,914,386 |
|
|
|
|
|
|
| |
2,935 |
|
|
|
|
Phoenix Civic Improvement Corporation, Arizona, Airport Revenue Bonds, Senior Lien Series 2017A, 5.000%, 7/01/35 |
|
|
7/27 at 100.00 |
|
|
|
3,010,385 |
|
|
|
|
|
|
| |
780 |
|
|
|
|
Phoenix Civic Improvement Corporation, Arizona, Excise Tax Revenue Bonds, Subordinate Lien Series 2020A, 4.000%, 7/01/45 |
|
|
7/30 at 100.00 |
|
|
|
669,283 |
|
|
|
|
|
|
| |
2,590 |
|
|
|
|
Phoenix Civic Improvement Corporation, Arizona, Water System Revenue Bonds, Junior Lien Series 2021A, 5.000%, 7/01/45 |
|
|
7/31 at 100.00 |
|
|
|
2,645,395 |
|
|
|
|
|
|
| |
2,175 |
|
|
|
|
Pima County Industrial Development Authority, Arizona, Revenue Bonds, Tucson Medical Center, Series 2021A, 4.000%,
4/01/46 |
|
|
4/31 at 100.00 |
|
|
|
1,728,821 |
|
|
|
|
|
|
| |
5,600 |
|
|
|
|
Salt Verde Financial Corporation, Arizona, Senior Gas Revenue Bonds, Citigroup Energy Inc Prepay Contract Obligations, Series
2007, 5.000%, 12/01/37 |
|
|
No Opt. Call |
|
|
|
5,436,116 |
|
|
|
|
|
|
|
|
|
|
|
|
Tucson, Arizona, Water System Revenue Bonds, Refunding Series 2017: |
|
|
|
|
|
|
|
|
| |
1,000 |
|
|
|
|
5.000%, 7/01/34 |
|
|
7/27 at 100.00 |
|
|
|
1,034,891 |
|
| |
750 |
|
|
|
|
5.000%, 7/01/35 |
|
|
7/27 at 100.00 |
|
|
|
774,102 |
|
|
|
|
|
|
|
Total Arizona |
|
|
|
|
|
|
17,213,379 |
|
|
|
|
|
|
|
|
|
|
|
|
California - 6.5% |
|
|
|
|
|
|
|
|
|
|
|
|
|
| |
405 |
|
|
|
|
California County Tobacco Securitization Agency, Tobacco Settlement Asset-Backed Bonds, Los Angeles County Securitization
Corporation, Series 2020A, 4.000%, 6/01/49 |
|
|
6/30 at 100.00 |
|
|
|
329,753 |
|
|
|
|
|
|
| |
1,250 |
|
|
|
|
California County Tobacco Securitization Agency, Tobacco Settlement Asset-Backed Bonds, Sonoma County Tobacco Securitization
Corporation, Series 2020A, 4.000%, 6/01/49 |
|
|
12/30 at 100.00 |
|
|
|
1,017,757 |
|
|
|
|
|
|
| |
4,080 |
|
|
(c) |
|
California Health Facilities Financing Authority, California, Revenue Bonds, Sutter Health, Refunding Series 2016B, 5.000%,
11/15/46, (Pre-refunded 11/15/26) |
|
|
11/26 at 100.00 |
|
|
|
4,250,951 |
|
|
|
|
|
|
| |
5,920 |
|
|
|
|
California Health Facilities Financing Authority, California, Revenue Bonds, Sutter Health, Series 2018A, 5.000%,
11/15/48 |
|
|
11/27 at 100.00 |
|
|
|
5,836,000 |
|
20
|
|
|
|
|
|
|
|
|
|
|
|
|
|
|
|
Principal
Amount (000) |
|
|
|
|
Description (a) |
|
|
Optional Call
Provisions (b) |
|
|
|
Value |
|
|
|
|
|
|
|
|
|
|
|
|
California (continued) |
|
|
|
|
|
|
|
|
|
|
|
|
|
| $ |
1,650 |
|
|
|
|
California Health Facilities Financing Authority, Revenue Bonds, Children’s Hospital Los Angeles, Series 2017A, 5.000%,
8/15/35 |
|
|
8/27 at 100.00 |
|
|
$ |
1,660,904 |
|
|
|
|
|
|
|
|
|
|
|
|
California Municipal Finance Authority, Revenue Bonds, Linxs APM Project, Senior Lien Series 2018A: |
|
|
|
|
|
|
|
|
| |
1,635 |
|
|
|
|
5.000%, 12/31/43, (AMT) |
|
|
6/28 at 100.00 |
|
|
|
1,547,046 |
|
| |
3,495 |
|
|
|
|
5.000%, 12/31/47, (AMT) |
|
|
6/28 at 100.00 |
|
|
|
3,273,156 |
|
|
|
|
|
|
| |
1,000 |
|
|
|
|
California Municipal Finance Authority, Revenue Bonds, Linxs APM Project, Senior Lien Series 2018B, 5.000%, 6/01/48,
(AMT) |
|
|
6/28 at 100.00 |
|
|
|
933,003 |
|
|
|
|
|
|
| |
2,290 |
|
|
|
|
California Pollution Control Financing Authority, Water Furnishing Revenue Bonds, San Diego County Water Authoriity Desalination
Project Pipeline, Refunding Series 2019, 5.000%, 7/01/39, 144A |
|
|
1/29 at 100.00 |
|
|
|
2,260,481 |
|
|
|
|
|
|
| |
1,625 |
|
|
(c) |
|
California State Public Works Board, Lease Revenue Bonds, Various Capital Projects, Series 2013I, 5.000%, 11/01/38, (Pre-refunded 1/02/24) |
|
|
1/24 at 100.00 |
|
|
|
1,628,422 |
|
|
|
|
|
|
| |
3,500 |
|
|
|
|
California Statewide Communities Development Authority, California, Revenue Bonds, Loma Linda University Medical Center, Series
2016A, 5.000%, 12/01/46, 144A |
|
|
6/26 at 100.00 |
|
|
|
3,092,843 |
|
|
|
|
|
|
| |
4,505 |
|
|
|
|
Covina-Valley Unified School District, Los Angeles County, California, General Obligation Bonds, Series 2003B, 0.000%, 6/01/28 -
FGIC Insured |
|
|
No Opt. Call |
|
|
|
3,683,488 |
|
|
|
|
|
|
| |
5,700 |
|
|
|
|
East Bay Municipal Utility District, Alameda and Contra Costa Counties, California, Water System Revenue Bonds, Green Series
2017A, 5.000%, 6/01/45 |
|
|
6/27 at 100.00 |
|
|
|
5,806,107 |
|
|
|
|
|
|
| |
2,180 |
|
|
(d) |
|
Foothill/Eastern Transportation Corridor Agency, California, Toll Road Revenue Bonds, Refunding Series 2013A, 0.000%,
1/15/42 |
|
|
1/31 at 100.00 |
|
|
|
2,456,142 |
|
|
|
|
|
|
|
|
|
|
|
|
Fresno, California, Airport Revenue Bonds, Series 2023A: |
|
|
|
|
|
|
|
|
| |
1,000 |
|
|
|
|
5.000%, 7/01/48 - BAM Insured, (AMT) |
|
|
7/33 at 100.00 |
|
|
|
960,234 |
|
| |
1,000 |
|
|
|
|
5.000%, 7/01/53 - BAM Insured, (AMT) |
|
|
7/33 at 100.00 |
|
|
|
947,968 |
|
|
|
|
|
|
| |
49,020 |
|
|
|
|
Golden State Tobacco Securitization Corporation, California, Tobacco Settlement Asset-Backed Bonds, Capital Appreciation Series 2021B-2, 0.000%, 6/01/66 |
|
|
12/31 at 27.75 |
|
|
|
4,020,733 |
|
|
|
|
|
|
| |
345 |
|
|
|
|
Golden State Tobacco Securitization Corporation, California, Tobacco Settlement Asset-Backed Revenue Bonds, Series 2022A-1, 5.000%, 6/01/51 |
|
|
12/31 at
100.00 |
|
|
|
344,986 |
|
|
|
|
|
|
| |
2,780 |
|
|
|
|
Los Angeles Department of Airports, California, Revenue Bonds, Los Angeles International Airport, Refunding Subordinate Series
2022I, 5.000%, 5/15/48 |
|
|
11/31 at
100.00 |
|
|
|
2,835,235 |
|
|
|
|
|
|
| |
2,725 |
|
|
|
|
Los Angeles Department of Water and Power, California, Water System Revenue Bonds, Series 2023A, 5.250%, 7/01/53 |
|
|
7/33 at 100.00 |
|
|
|
2,870,152 |
|
|
|
|
|
|
| |
2,555 |
|
|
|
|
Merced Union High School District, Merced County, California, General Obligation Bonds, Series 1999A, 0.000%, 8/01/24 - FGIC
Insured |
|
|
No Opt. Call |
|
|
|
2,475,750 |
|
|
|
|
|
|
| |
2,365 |
|
|
|
|
Montebello Unified School District, Los Angeles County, California, General Obligation Bonds, Election 1998 Series 2004, 0.000%,
8/01/27 - FGIC Insured |
|
|
No Opt. Call |
|
|
|
1,998,822 |
|
|
|
|
|
|
|
|
|
|
|
|
Mount San Antonio Community College District, Los Angeles County, California, General Obligation Bonds, Election of 2008, Series
2013A: |
|
|
|
|
|
|
|
|
| |
3,060 |
|
|
|
|
5.875%, 8/01/28 |
|
|
2/28 at 100.00 |
|
|
|
3,345,619 |
|
| |
2,315 |
|
|
(d) |
|
0.000%, 8/01/43 |
|
|
8/35 at 100.00 |
|
|
|
2,015,947 |
|
|
|
|
|
|
| |
3,550 |
|
|
|
|
M-S-R Energy Authority, California, Gas Revenue
Bonds, Citigroup Prepay Contracts, Series 2009C, 6.500%, 11/01/39 |
|
|
No Opt. Call |
|
|
|
3,998,479 |
|
|
|
|
|
|
| |
10,150 |
|
|
|
|
Placer Union High School District, Placer County, California, General Obligation Bonds, Series 2004C, 0.000%, 8/01/33 - AGM
Insured |
|
|
No Opt. Call |
|
|
|
6,651,087 |
|
21
|
|
|
| NUV |
|
Nuveen Municipal Value Fund, Inc. (continued) Portfolio of Investments October 31, 2023 |
|
|
|
|
|
|
|
|
|
|
|
|
|
|
|
|
Principal
Amount (000) |
|
|
|
|
Description (a) |
|
|
Optional Call
Provisions (b) |
|
|
|
Value |
|
|
|
|
|
|
|
|
|
|
|
|
California (continued) |
|
|
|
|
|
|
|
|
|
|
|
|
|
|
San Bruno Park School District, San Mateo County, California, General Obligation Bonds, Series 2000B: |
|
|
|
|
|
|
|
|
| $ |
2,575 |
|
|
|
|
0.000%, 8/01/24 - FGIC Insured |
|
|
No Opt. Call |
|
|
$ |
2,494,948 |
|
| |
2,660 |
|
|
|
|
0.000%, 8/01/25 - FGIC Insured |
|
|
No Opt. Call |
|
|
|
2,458,372 |
|
|
|
|
|
|
| |
230 |
|
|
|
|
San Diego Tobacco Settlement Revenue Funding Corporation, California, Tobacco Settlement Bonds, Subordinate Series 2018C, 4.000%,
6/01/32 |
|
|
6/28 at 100.00 |
|
|
|
218,107 |
|
|
|
|
|
|
|
|
|
|
|
|
San Francisco Airports Commission, California, Revenue Bonds, San Francisco International Airport, Refunding Second Series
2019D: |
|
|
|
|
|
|
|
|
| |
6,000 |
|
|
|
|
5.000%, 5/01/36 |
|
|
5/29 at 100.00 |
|
|
|
6,294,364 |
|
| |
4,000 |
|
|
|
|
5.000%, 5/01/39 |
|
|
5/29 at 100.00 |
|
|
|
4,128,381 |
|
|
|
|
|
|
|
|
|
|
|
|
San Joaquin Hills Transportation Corridor Agency, Orange County, California, Refunding Senior Lien Toll Road Revenue Bonds,
Series 2021A: |
|
|
|
|
|
|
|
|
| |
315 |
|
|
|
|
4.000%, 1/15/39 |
|
|
1/32 at 100.00 |
|
|
|
286,816 |
|
| |
525 |
|
|
|
|
4.000%, 1/15/41 |
|
|
1/32 at 100.00 |
|
|
|
468,947 |
|
| |
550 |
|
|
|
|
4.000%, 1/15/43 |
|
|
1/32 at 100.00 |
|
|
|
483,070 |
|
| |
200 |
|
|
|
|
4.000%, 1/15/44 |
|
|
1/32 at 100.00 |
|
|
|
174,275 |
|
|
|
|
|
|
| |
12,095 |
|
|
|
|
San Joaquin Hills Transportation Corridor Agency, Orange County, California, Toll Road Revenue Bonds, Refunding Series 1997A,
0.000%, 1/15/25 - NPFG Insured |
|
|
No Opt. Call |
|
|
|
11,478,042 |
|
|
|
|
|
|
| |
13,220 |
|
|
|
|
San Mateo County Community College District, California, General Obligation Bonds, Series 2006A, 0.000%, 9/01/28 - NPFG
Insured |
|
|
No Opt. Call |
|
|
|
10,897,830 |
|
|
|
|
|
|
| |
5,000 |
|
|
|
|
San Mateo Union High School District, San Mateo County, California, General Obligation Bonds, Election of 2000, Series 2002B,
0.000%, 9/01/24 - FGIC Insured |
|
|
No Opt. Call |
|
|
|
4,839,719 |
|
|
|
|
|
|
| |
5,815 |
|
|
|
|
San Ysidro School District, San Diego County, California, General Obligation Bonds, Refunding Series 2015, 0.000%,
8/01/48 |
|
|
8/25 at 29.16 |
|
|
|
1,511,170 |
|
|
|
|
|
|
| |
440 |
|
|
|
|
Tobacco Securitization Authority of Northern California, Tobacco Settlement Asset-Backed Bonds, Refunding Sacramento County
Tobacco Securitization Corporation Series 2021B Class 2, 4.000%, 6/01/49 |
|
|
12/30 at 100.00 |
|
|
|
411,201 |
|
|
|
|
|
|
| |
575 |
|
|
|
|
Vernon, California, Electric System Revenue Bonds, Series 2021A, 5.000%, 4/01/28 |
|
|
No Opt. Call |
|
|
|
576,362 |
|
|
|
|
|
|
|
Total California |
|
|
|
|
|
|
116,962,669 |
|
|
|
|
|
|
|
|
|
|
|
|
Colorado - 6.4% |
|
|
|
|
|
|
|
|
|
|
|
|
|
| |
7,500 |
|
|
|
|
Arapahoe County School District 6, Littleton, Colorado, General Obligation Bonds, Series 2019A, 5.500%, 12/01/43 |
|
|
12/28 at 100.00 |
|
|
|
7,814,660 |
|
|
|
|
|
|
| |
4,155 |
|
|
|
|
Colorado Health Facilities Authority, Colorado, Revenue Bonds, CommonSpirit Health, Series
2019A-2, 4.000%, 8/01/49 |
|
|
8/29 at 100.00 |
|
|
|
3,214,185 |
|
|
|
|
|
|
| |
1,255 |
|
|
|
|
Colorado High Performance Transportation Enterprise, C-470 Express Lanes Revenue Bonds,
Senior Lien Series 2017, 5.000%, 12/31/56 |
|
|
12/24 at 100.00 |
|
|
|
1,129,825 |
|
|
|
|
|
|
| |
7,070 |
|
|
|
|
Colorado Mountain College, Colorado, Certificates of Participation, Series 2021, 4.000%, 12/01/46 |
|
|
12/31 at 100.00 |
|
|
|
6,050,473 |
|
|
|
|
|
|
| |
4,500 |
|
|
|
|
Colorado State, Building Excellent Schools Today, Certificates of Participation, Series 2018N, 5.000%, 3/15/37 |
|
|
3/28 at 100.00 |
|
|
|
4,595,851 |
|
|
|
|
|
|
| |
1,000 |
|
|
|
|
Colorado State, Building Excellent Schools Today, Certificates of Participation, Series 2020R, 4.000%, 3/15/45 |
|
|
3/30 at 100.00 |
|
|
|
848,900 |
|
|
|
|
|
|
|
|
|
|
|
|
Colorado State, Certificates of Participation, Lease Purchase Financing Program, National Western Center, Series 2018A: |
|
|
|
|
|
|
|
|
| |
1,250 |
|
|
|
|
5.000%, 9/01/30 |
|
|
3/28 at 100.00 |
|
|
|
1,298,374 |
|
| |
2,000 |
|
|
|
|
5.000%, 9/01/31 |
|
|
3/28 at 100.00 |
|
|
|
2,078,299 |
|
| |
1,260 |
|
|
|
|
5.000%, 9/01/32 |
|
|
3/28 at 100.00 |
|
|
|
1,309,262 |
|
| |
620 |
|
|
|
|
5.000%, 9/01/33 |
|
|
3/28 at 100.00 |
|
|
|
643,548 |
|
22
|
|
|
|
|
|
|
|
|
|
|
|
|
|
|
|
Principal
Amount (000) |
|
|
|
|
Description (a) |
|
|
Optional Call
Provisions (b) |
|
|
|
Value |
|
|
|
|
|
|
|
|
|
|
|
|
Colorado (continued) |
|
|
|
|
|
|
|
|
| $ |
3,790 |
|
|
|
|
Colorado State, Certificates of Participation, Rural Series 2018A, 5.000%, 12/15/37 |
|
|
12/28 at 100.00 |
|
|
$ |
3,899,785 |
|
|
|
|
|
|
| |
3,400 |
|
|
|
|
Denver City and County, Colorado, Airport System Revenue Bonds, Series 2022B, 5.250%, 11/15/53 |
|
|
11/32 at 100.00 |
|
|
|
3,485,620 |
|
|
|
|
|
|
| |
5,160 |
|
|
|
|
Denver City and County, Colorado, Airport System Revenue Bonds, Subordinate Lien Series 2013B, 5.000%, 11/15/43 |
|
|
12/23 at 100.00 |
|
|
|
5,094,277 |
|
|
|
|
|
|
| |
2,000 |
|
|
|
|
Denver Convention Center Hotel Authority, Colorado, Revenue Bonds, Convention Center Hotel, Refunding Senior Lien Series 2016,
5.000%, 12/01/35 |
|
|
12/26 at 100.00 |
|
|
|
1,932,059 |
|
|
|
|
|
|
|
|
|
|
|
|
E-470 Public Highway Authority, Colorado, Senior Revenue Bonds, Series 2000B: |
|
|
|
|
|
|
|
|
| |
9,660 |
|
|
|
|
0.000%, 9/01/29 - NPFG Insured |
|
|
No Opt. Call |
|
|
|
7,533,150 |
|
| |
24,200 |
|
|
|
|
0.000%, 9/01/31 - NPFG Insured |
|
|
No Opt. Call |
|
|
|
17,175,948 |
|
| |
17,000 |
|
|
|
|
0.000%, 9/01/32 - NPFG Insured |
|
|
No Opt. Call |
|
|
|
11,496,168 |
|
|
|
|
|
|
| |
2,905 |
|
|
|
|
E-470 Public Highway Authority, Colorado, Senior Revenue Bonds, Series 2020A, 5.000%,
9/01/40 |
|
|
9/24 at 100.00 |
|
|
|
2,913,126 |
|
|
|
|
|
|
| |
7,600 |
|
|
|
|
E-470 Public Highway Authority, Colorado, Toll Revenue Bonds, Refunding Series 2006B,
0.000%, 9/01/39 - NPFG Insured |
|
|
9/26 at 52.09 |
|
|
|
3,347,302 |
|
|
|
|
|
|
| |
8,000 |
|
|
|
|
Public Authority for Colorado Energy, Natural Gas Purchase Revenue Bonds, Colorado Springs Utilities, Series 2008, 6.500%,
11/15/38 |
|
|
No Opt. Call |
|
|
|
8,847,450 |
|
|
|
|
|
|
| |
1,400 |
|
|
|
|
Regional Transportation District, Colorado, Private Activity Bonds, Denver Transit Partners Eagle P3 Project, Series 2020A,
4.000%, 7/15/34 |
|
|
1/31 at 100.00 |
|
|
|
1,315,697 |
|
|
|
|
|
|
| |
4,945 |
|
|
|
|
Regional Transportation District, Colorado, Sales Tax Revenue Bonds, Fastracks Project, Series 2017A, 5.000%, 11/01/40 |
|
|
11/26 at 100.00 |
|
|
|
5,010,552 |
|
|
|
|
|
|
|
|
|
|
|
|
State of Colorado, Rural Colorado, Certificates of Participation, Series 2022: |
|
|
|
|
|
|
|
|
| |
5,355 |
|
|
|
|
6.000%, 12/15/38 |
|
|
12/32 at 100.00 |
|
|
|
6,023,467 |
|
| |
3,000 |
|
|
|
|
6.000%, 12/15/41 |
|
|
12/32 at 100.00 |
|
|
|
3,336,461 |
|
|
|
|
|
|
| |
4,250 |
|
|
(c) |
|
University of Colorado, Enterprise System Revenue Bonds, Series 2018B, 5.000%, 6/01/43, (Pre-refunded 6/01/28) |
|
|
6/28 at 100.00 |
|
|
|
4,493,031 |
|
|
|
|
|
|
|
Total Colorado |
|
|
|
|
|
|
114,887,470 |
|
|
|
|
|
|
|
|
|
|
|
|
Connecticut - 0.9% |
|
|
|
|
|
|
|
|
|
|
|
|
|
| |
2,125 |
|
|
|
|
Connecticut Health and Educational Facilities Authority, Revenue Bonds, Connecticut Children’s Medical Center and
Subsidiaries, Series 2023E, 5.250%, 7/15/48 |
|
|
1/33 at 100.00 |
|
|
|
2,128,961 |
|
|
|
|
|
|
| |
8,440 |
|
|
|
|
Connecticut State, General Obligation Bonds, Series 2015E, 5.000%, 8/01/29 |
|
|
8/25 at 100.00 |
|
|
|
8,559,357 |
|
|
|
|
|
|
| |
5,000 |
|
|
|
|
Connecticut State, General Obligation Bonds, Series 2015F, 5.000%, 11/15/33 |
|
|
11/25 at 100.00 |
|
|
|
5,041,008 |
|
|
|
|
|
|
|
Total Connecticut |
|
|
|
|
|
|
15,729,326 |
|
|
|
|
|
|
|
|
|
|
|
|
Delaware - 0.1% |
|
|
|
|
|
|
|
|
|
|
|
|
|
| |
1,270 |
|
|
|
|
Delaware River and Bay Authority, Delaware and New Jersey, Revenue Bonds, Series 2021,
4.000%, 1/01/46 |
|
|
1/32 at 100.00 |
|
|
|
1,053,404 |
|
|
|
|
|
|
|
Total Delaware |
|
|
|
|
|
|
1,053,404 |
|
|
|
|
|
|
|
|
|
|
|
|
District of Columbia - 1.7% |
|
|
|
|
|
|
|
|
|
|
|
|
|
| |
15,000 |
|
|
|
|
District of Columbia Tobacco Settlement Corporation, Tobacco Settlement Asset-Backed Bonds, Series 2006A, 0.000%,
6/15/46 |
|
|
12/23 at 24.98 |
|
|
|
3,219,247 |
|
|
|
|
|
|
| |
5,390 |
|
|
|
|
District of Columbia Water and Sewer Authority, Public Utility Revenue Bonds, Senior Lien Series 2018B, 5.000%, 10/01/43 |
|
|
4/28 at 100.00 |
|
|
|
5,457,912 |
|
23
|
|
|
| NUV |
|
Nuveen Municipal Value Fund, Inc. (continued) Portfolio of Investments October 31, 2023 |
|
|
|
|
|
|
|
|
|
|
|
|
|
|
|
|
Principal
Amount (000) |
|
|
|
|
Description (a) |
|
|
Optional Call
Provisions (b) |
|
|
|
Value |
|
|
|
|
|
|
|
|
|
|
|
|
District of Columbia (continued) |
|
|
|
|
|
|
|
|
| $ |
3,865 |
|
|
|
|
Metropolitan Washington Airports Authority, District of Columbia, Dulles Toll Road Revenue Bonds, Dulles Metrorail &
Capital improvement Projects, Refunding & Subordinate Lien Series 2019B, 5.000%, 10/01/47 |
|
|
10/29 at 100.00 |
|
|
$ |
3,640,642 |
|
|
|
|
|
|
| |
10,000 |
|
|
|
|
Metropolitan Washington Airports Authority, District of Columbia, Dulles Toll Road Revenue Bonds, Dulles Metrorail Capital
Appreciation, Second Senior Lien Series 2010B, 6.500%, 10/01/44 |
|
|
10/28 at 100.00 |
|
|
|
10,552,364 |
|
|
|
|
|
|
|
|
|
|
|
|
Washington Convention and Sports Authority, Washington D.C., Dedicated Tax Revenue Bonds, Refunding Senior Lien Series
2021A: |
|
|
|
|
|
|
|
|
| |
670 |
|
|
|
|
4.000%, 10/01/36 |
|
|
10/30 at 100.00 |
|
|
|
618,304 |
|
| |
1,060 |
|
|
|
|
4.000%, 10/01/38 |
|
|
10/30 at 100.00 |
|
|
|
937,905 |
|
| |
1,265 |
|
|
|
|
4.000%, 10/01/39 |
|
|
10/30 at 100.00 |
|
|
|
1,099,361 |
|
|
|
|
|
|
| |
1,745 |
|
|
|
|
Washington Convention and Sports Authority, Washington D.C., Dedicated Tax Revenue Bonds, Refunding Senior Lien Series 2021B,
4.000%, 10/01/38 |
|
|
10/30 at 100.00 |
|
|
|
1,544,005 |
|
|
|
|
|
|
|
|
|
|
|
|
Washington Metropolitan Area Transit Authority, District of Columbia, Dedicated Revenue Bonds, Series 2020A: |
|
|
|
|
|
|
|
|
| |
2,390 |
|
|
|
|
4.000%, 7/15/45 |
|
|
7/30 at 100.00 |
|
|
|
2,071,607 |
|
| |
1,775 |
|
|
|
|
5.000%, 7/15/45 |
|
|
7/30 at 100.00 |
|
|
|
1,798,242 |
|
|
|
|
|
|
|
Total District of Columbia |
|
|
|
|
|
|
30,939,589 |
|
|
|
|
|
|
|
|
|
|
|
|
Florida - 5.7% |
|
|
|
|
|
|
|
|
|
|
|
|
|
| |
1,000 |
|
|
|
|
Babcock Ranch Community Independent Special District, Charlotte County, Florida, Special Assessment Bonds, 2022 Project Series
2022, 5.000%, 5/01/53 |
|
|
5/32 at 100.00 |
|
|
|
839,332 |
|
|
|
|
|
|
| |
1,240 |
|
|
|
|
Broward County, Florida, Half-Cent Sales Tax Revenue Bonds, Refunding Series 2020, 4.000%, 10/01/40 |
|
|
10/30 at 100.00 |
|
|
|
1,114,288 |
|
|
|
|
|
|
| |
23,000 |
|
|
|
|
Broward County, Florida, Tourist Development Tax Revenue Bonds, Convention Center Expansion Project, Series 2021, 4.000%,
9/01/51 |
|
|
9/31 at 100.00 |
|
|
|
18,513,854 |
|
|
|
|
|
|
| |
565 |
|
|
|
|
Florida Development Finance Corporation, Educational Facilities Revenue Bonds, Renaissance Charter School Income Projects, Series
2015A, 6.000%, 6/15/35, 144A |
|
|
6/25 at 100.00 |
|
|
|
553,863 |
|
|
|
|
|
|
|
|
|
|
|
|
Florida Development Finance Corporation, Healthcare Facilities Revenue Bonds, UF Health - Jacksonville Project, Series
2022A: |
|
|
|
|
|
|
|
|
| |
1,800 |
|
|
|
|
4.000%, 2/01/41 - AGM Insured |
|
|
2/32 at 100.00 |
|
|
|
1,547,243 |
|
| |
1,875 |
|
|
|
|
4.000%, 2/01/42 - AGM Insured |
|
|
2/32 at 100.00 |
|
|
|
1,590,838 |
|
|
|
|
|
|
| |
15,000 |
|
|
|
|
Florida Development Finance Corporation, Revenue Bonds, Brightline Passenger Rail Expansion Project, Series 2023C, 8.000%,
7/01/57, (AMT), (Mandatory Put 4/01/24), 144A |
|
|
11/23 at 100.00 |
|
|
|
15,106,023 |
|
|
|
|
|
|
| |
4,000 |
|
|
|
|
Gainesville, Florida, Utilities System Revenue Bonds, Series 2017A, 5.000%, 10/01/36 |
|
|
10/27 at 100.00 |
|
|
|
4,111,804 |
|
|
|
|
|
|
| |
3,500 |
|
|
|
|
Gainesville, Florida, Utilities System Revenue Bonds, Series 2019A, 5.000%, 10/01/47 |
|
|
10/29 at 100.00 |
|
|
|
3,504,410 |
|
|
|
|
|
|
| |
2,290 |
|
|
(c) |
|
Hillsborough County Aviation Authority, Florida, Revenue Bonds, Tampa International Airport, Subordinate Lien Series 2015B,
5.000%, 10/01/40, (Pre-refunded 10/01/24) |
|
|
10/24 at 100.00 |
|
|
|
2,312,736 |
|
|
|
|
|
|
| |
1,000 |
|
|
|
|
Lakeland, Florida, Energy System Revenue Bonds, Series 2021, 4.000%, 10/01/40 |
|
|
10/31 at 100.00 |
|
|
|
892,326 |
|
|
|
|
|
|
| |
2,735 |
|
|
|
|
Miami Beach Health Facilities Authority, Florida, Hospital Revenue Bonds, Mount Sinai Medical Center of Florida Project, Series
2021B, 4.000%, 11/15/46 |
|
|
11/31 at 100.00 |
|
|
|
2,193,202 |
|
|
|
|
|
|
| |
5,090 |
|
|
|
|
Miami-Dade County Expressway Authority, Florida, Toll System Revenue Bonds, Series 2010A, 5.000%, 7/01/40 |
|
|
12/23 at 100.00 |
|
|
|
4,925,809 |
|
24
|
|
|
|
|
|
|
|
|
|
|
|
|
|
|
|
Principal
Amount (000) |
|
|
|
|
Description (a) |
|
|
Optional Call
Provisions (b) |
|
|
|
Value |
|
|
|
|
|
|
|
|
|
|
|
|
Florida (continued) |
|
|
|
|
|
|
|
|
| $ |
2,000 |
|
|
|
|
Miami-Dade County, Florida, Aviation Revenue Bonds, Miami International Airport, Refunding Series 2014B, 5.000%,
10/01/37 |
|
|
10/24 at 100.00 |
|
|
$ |
1,978,370 |
|
|
|
|
|
|
| |
3,000 |
|
|
|
|
Miami-Dade County, Florida, Transit System Sales Surtax Revenue Bonds, Series 2022, 5.000%, 7/01/51 |
|
|
7/32 at 100.00 |
|
|
|
2,971,608 |
|
|
|
|
|
|
| |
5,330 |
|
|
|
|
Orange County Health Facilities Authority, Florida, Hospital Revenue Bonds, Orlando Health Obligated Group, Inc., Series 2022,
4.000%, 10/01/52 |
|
|
4/32 at 100.00 |
|
|
|
4,291,452 |
|
|
|
|
|
|
|
|
|
|
|
|
Orlando Utilities Commission, Florida, Utility System Revenue Bonds, Series 2018A: |
|
|
|
|
|
|
|
|
| |
3,500 |
|
|
|
|
5.000%, 10/01/36 |
|
|
10/27 at 100.00 |
|
|
|
3,595,286 |
|
| |
3,780 |
|
|
|
|
5.000%, 10/01/37 |
|
|
10/27 at 100.00 |
|
|
|
3,877,217 |
|
| |
1,120 |
|
|
|
|
5.000%, 10/01/38 |
|
|
10/27 at 100.00 |
|
|
|
1,147,482 |
|
|
|
|
|
|
| |
10,725 |
|
|
(c) |
|
Orlando, Florida, Contract Tourist Development Tax Payments Revenue Bonds, Series 2014A, 5.000%, 11/01/44, (Pre-refunded 5/01/24) |
|
|
5/24 at 100.00 |
|
|
|
10,782,252 |
|
|
|
|
|
|
|
|
|
|
|
|
Osceola County, Florida, Transportation Revenue Bonds, Osceola Parkway, Refunding & Improvement Capital Appreciation
Series 2019A-2: |
|
|
|
|
|
|
|
|
| |
3,500 |
|
|
|
|
0.000%, 10/01/43 |
|
|
10/29 at 61.27 |
|
|
|
1,054,195 |
|
| |
3,575 |
|
|
|
|
0.000%, 10/01/44 |
|
|
10/29 at 59.08 |
|
|
|
998,525 |
|
| |
4,000 |
|
|
|
|
0.000%, 10/01/45 |
|
|
10/29 at 56.95 |
|
|
|
1,043,743 |
|
| |
750 |
|
|
|
|
0.000%, 10/01/49 |
|
|
10/29 at 49.08 |
|
|
|
146,948 |
|
| |
5,000 |
|
|
|
|
0.000%, 10/01/50 |
|
|
10/29 at 47.17 |
|
|
|
917,534 |
|
| |
11,000 |
|
|
|
|
0.000%, 10/01/53 |
|
|
10/29 at 41.97 |
|
|
|
1,651,703 |
|
|
|
|
|
|
| |
4,000 |
|
|
|
|
Pembroke Pines, Florida, Capital Improvement Revenue Bonds, Series 2019A, 4.000%, 7/01/38 |
|
|
7/29 at 100.00 |
|
|
|
3,617,332 |
|
|
|
|
|
|
| |
1,020 |
|
|
|
|
Putnam County Development Authority, Florida, Pollution Control Revenue Bonds, Seminole Electric Cooperatice, Inc. Project,
Refunding Series 2018B, 5.000%, 3/15/42 |
|
|
5/28 at 100.00 |
|
|
|
981,774 |
|
|
|
|
|
|
| |
6,865 |
|
|
|
|
South Broward Hospital District, Florida, Hospital Revenue Bonds, Refunding Series 2015,
4.000%, 5/01/34 |
|
|
5/25 at 100.00 |
|
|
|
6,561,876 |
|
|
|
|
|
|
|
Total Florida |
|
|
|
|
|
|
102,823,025 |
|
|
|
|
|
|
|
|
|
|
|
|
Georgia - 4.0% |
|
|
|
|
|
|
|
|
|
|
|
|
|
| |
3,325 |
|
|
|
|
Atlanta, Georgia, Water and Wastewater Revenue Bonds, Refunding Series 2015, 5.000%, 11/01/40 |
|
|
5/25 at 100.00 |
|
|
|
3,308,774 |
|
|
|
|
|
|
| |
2,290 |
|
|
|
|
Fulton County Development Authority, Georgia, Hospital Revenue Bonds, Wellstar Health System, Inc Project, Series 2017A, 5.000%,
4/01/47 |
|
|
4/27 at 100.00 |
|
|
|
2,177,199 |
|
|
|
|
|
|
|
|
|
|
|
|
Gainesville and Hall County Hospital Authority, Georgia, Revenue Anticipation Certificates, Northeast Georgia Health Services
Inc., Series 2017B: |
|
|
|
|
|
|
|
|
| |
3,500 |
|
|
|
|
5.500%, 2/15/42 |
|
|
2/27 at 100.00 |
|
|
|
3,573,444 |
|
| |
2,500 |
|
|
|
|
5.250%, 2/15/45 |
|
|
2/27 at 100.00 |
|
|
|
2,524,736 |
|
|
|
|
|
|
| |
1,500 |
|
|
|
|
Geo. L. Smith II Georgia World Congress Center Authority, Georgia, Convention Center Hotel Revenue Bonds, First Tier Series
2021A, 4.000%, 1/01/54 |
|
|
1/31 at 100.00 |
|
|
|
1,123,986 |
|
|
|
|
|
|
| |
10,500 |
|
|
|
|
Georgia Ports Authority, Revenue Bonds, Series 2022, 5.250%, 7/01/52 |
|
|
7/32 at 100.00 |
|
|
|
10,786,511 |
|
|
|
|
|
|
| |
17,010 |
|
|
|
|
Municipal Electric Authority of Georgia, Plant Vogtle Units 3 & 4 Project J Bonds, Series 2019A, 5.000%, 1/01/49 - BAM
Insured |
|
|
7/28 at 100.00 |
|
|
|
16,558,946 |
|
|
|
|
|
|
| |
4,025 |
|
|
|
|
Municipal Electric Authority of Georgia, Plant Vogtle Units 3 & 4 Project M Bonds, Series 19A, 5.000%, 1/01/59 - AGM
Insured |
|
|
7/28 at 100.00 |
|
|
|
3,881,895 |
|
|
|
|
|
|
| |
17,350 |
|
|
|
|
Municipal Electric Authority of Georgia, Plant Vogtle Units 3 & 4 Project M Bonds, Series 2022A, 5.000%, 7/01/52 - AGM
Insured |
|
|
7/32 at 100.00 |
|
|
|
16,836,263 |
|
|
|
|
|
|
| |
2,415 |
|
|
|
|
Municipal Electric Authority of Georgia, Project One Revenue Bonds, Subordinate Lien Series 2015A, 5.000%, 1/01/35 |
|
|
1/25 at 100.00 |
|
|
|
2,402,505 |
|
25
|
|
|
| NUV |
|
Nuveen Municipal Value Fund, Inc. (continued) Portfolio of Investments October 31, 2023 |
|
|
|
|
|
|
|
|
|
|
|
|
|
|
|
|
Principal
Amount (000) |
|
|
|
|
Description (a) |
|
|
Optional Call
Provisions (b) |
|
|
|
Value |
|
|
|
|
|
|
|
|
|
|
|
|
Georgia (continued) |
|
|
|
|
|
|
|
|
|
|
|
|
|
|
|
|
|
|
|
Municipal Electric Authority of Georgia, Project One Revenue Bonds, Subordinate Lien Series 2020A: |
|
|
|
|
|
|
|
|
| $ |
1,000 |
|
|
|
|
5.000%, 1/01/45 |
|
|
1/31 at 100.00 |
|
|
$ |
974,987 |
|
| |
5,500 |
|
|
|
|
5.000%, 1/01/50 |
|
|
1/31 at 100.00 |
|
|
|
5,241,823 |
|
|
|
|
|
|
| |
2,000 |
|
|
|
|
Private Colleges and Universities Authority, Georgia, Revenue Bonds, Emory University,
Refunding Series 2016A, 5.000%, 10/01/46 |
|
|
10/26 at 100.00 |
|
|
|
1,997,392 |
|
|
|
|
|
|
|
Total Georgia |
|
|
|
|
|
|
71,388,461 |
|
|
|
|
|
|
|
|
|
|
|
|
Hawaii - 0.4% |
|
|
|
|
|
|
|
|
|
|
|
|
|
| |
4,830 |
|
|
|
|
Honolulu City and County, Hawaii, General Obligation Bonds, Series 2018A, 5.000%, 9/01/40 |
|
|
9/28 at 100.00 |
|
|
|
4,924,272 |
|
|
|
|
|
|
| |
3,000 |
|
|
|
|
Honolulu City and County, Hawaii, Wastewater System Revenue Bonds, First Bond Resolution,
Senior Series 2018A, 5.000%, 7/01/37 |
|
|
1/28 at 100.00 |
|
|
|
3,077,872 |
|
|
|
|
|
|
|
Total Hawaii |
|
|
|
|
|
|
8,002,144 |
|
|
|
|
|
|
|
|
|
|
|
|
Idaho - 0.1% |
|
|
|
|
|
|
|
|
|
|
|
|
|
| |
1,550 |
|
|
|
|
University of Idaho, General Revenue Bonds, Refunding Series 2022A, 4.000%, 4/01/45 - BAM
Insured |
|
|
4/32 at 100.00 |
|
|
|
1,325,564 |
|
|
|
|
|
|
|
Total Idaho |
|
|
|
|
|
|
1,325,564 |
|
|
|
|
|
|
|
|
|
|
|
|
Illinois - 10.9% |
|
|
|
|
|
|
|
|
|
|
|
|
|
| |
5,000 |
|
|
|
|
Chicago Board of Education, Illinois, Dedicated Capital Improvement Tax Revenue Bonds, Series 2016, 6.000%, 4/01/46 |
|
|
4/27 at 100.00 |
|
|
|
5,030,084 |
|
|
|
|
|
|
| |
5,000 |
|
|
|
|
Chicago Board of Education, Illinois, General Obligation Bonds, Dedicated Revenues, Series 2016A, 7.000%, 12/01/44 |
|
|
12/25 at 100.00 |
|
|
|
5,109,996 |
|
|
|
|
|
|
| |
2,945 |
|
|
|
|
Chicago Board of Education, Illinois, General Obligation Bonds, Dedicated Revenues, Series 2016B, 6.500%, 12/01/46 |
|
|
12/26 at 100.00 |
|
|
|
2,991,683 |
|
|
|
|
|
|
| |
4,710 |
|
|
|
|
Chicago Board of Education, Illinois, General Obligation Bonds, Dedicated Revenues, Series 2017A, 7.000%, 12/01/46, 144A |
|
|
12/27 at 100.00 |
|
|
|
4,890,423 |
|
|
|
|
|
|
| |
17,775 |
|
|
|
|
Chicago Board of Education, Illinois, Unlimited Tax General Obligation Bonds, Dedicated Tax Revenues, Series 1998B-1, 0.000%, 12/01/24 - FGIC Insured |
|
|
No Opt. Call |
|
|
|
16,850,776 |
|
|
|
|
|
|
| |
7,495 |
|
|
|
|
Chicago Board of Education, Illinois, Unlimited Tax General Obligation Bonds, Dedicated Tax Revenues, Series 1999A, 0.000%,
12/01/31 - NPFG Insured |
|
|
No Opt. Call |
|
|
|
4,962,649 |
|
|
|
|
|
|
|
|
|
|
|
|
Chicago Greater Metropolitan Water Reclamation District, Illinois, General Obligation Bonds, Limited Tax Capital Improvement
Green Series 2021A: |
|
|
|
|
|
|
|
|
| |
2,325 |
|
|
|
|
4.000%, 12/01/46 |
|
|
12/31 at 100.00 |
|
|
|
1,942,933 |
|
| |
4,000 |
|
|
|
|
4.000%, 12/01/51 |
|
|
12/31 at 100.00 |
|
|
|
3,248,303 |
|
|
|
|
|
|
| |
1,960 |
|
|
|
|
Chicago Transit Authority, Illinois, Capital Grant Receipts Revenue Bonds, Federal Transit Administration Section 5307
Urbanized Area Formula Funds, Refunding Series 2021, 5.000%, 6/01/27 |
|
|
No Opt. Call |
|
|
|
2,008,182 |
|
|
|
|
|
|
| |
5,000 |
|
|
|
|
Chicago Transit Authority, Illinois, Sales Tax Receipts Revenue Bonds, Second Lien Series 2022A, 5.000%, 12/01/46 - BAM
Insured |
|
|
12/31 at 100.00 |
|
|
|
5,108,621 |
|
|
|
|
|
|
| |
5,100 |
|
|
|
|
Chicago Transit Authority, Illinois, Sales Tax Receipts Revenue Bonds, Series 2014, 5.000%, 12/01/44 |
|
|
12/24 at 100.00 |
|
|
|
4,868,181 |
|
|
|
|
|
|
| |
1,000 |
|
|
|
|
Cook County, Illinois, General Obligation Bonds, Refunding Series 2018, 5.000%, 11/15/35 |
|
|
11/26 at 100.00 |
|
|
|
1,013,395 |
|
|
|
|
|
|
| |
1,500 |
|
|
|
|
Cook County, Illinois, General Obligation Bonds, Refunding Series 2021A, 5.000%, 11/15/32 |
|
|
11/30 at 100.00 |
|
|
|
1,562,992 |
|
|
|
|
|
|
| |
2,040 |
|
|
|
|
Cook County, Illinois, Sales Tax Revenue Bonds, Series 2021A: 4.000%, 11/15/40 |
|
|
11/30 at 100.00 |
|
|
|
1,780,056 |
|
26
|
|
|
|
|
|
|
|
|
|
|
|
|
|
|
|
Principal
Amount (000) |
|
|
|
|
Description (a) |
|
|
Optional Call
Provisions (b) |
|
|
|
Value |
|
|
|
|
|
|
|
|
|
|
|
|
Illinois (continued) |
|
|
|
|
|
|
|
|
| $ |
1,000 |
|
|
|
|
4.000%, 11/15/41 |
|
|
11/30 at 100.00 |
|
|
$ |
862,224 |
|
|
|
|
|
|
| |
1,300 |
|
|
|
|
Illinois Finance Authority, Revenue Bonds, Rush University Medical Center Obligated Group, Series 2015A, 5.000%,
11/15/38 |
|
|
5/25 at 100.00 |
|
|
|
1,268,968 |
|
|
|
|
|
|
| |
3,700 |
|
|
|
|
Illinois Finance Authority, Revenue Bonds, Rush University Medical Center Obligated Group, Series 2015B, 5.000%,
11/15/39 |
|
|
5/25 at 100.00 |
|
|
|
3,604,409 |
|
|
|
|
|
|
|
|
|
|
|
|
Illinois Finance Authority, Revenue Bonds, Silver Cross Hospital and Medical Centers, Refunding Series 2015C: |
|
|
|
|
|
|
|
|
| |
560 |
|
|
|
|
5.000%, 8/15/35 |
|
|
8/25 at 100.00 |
|
|
|
537,079 |
|
| |
825 |
|
|
|
|
5.000%, 8/15/44 |
|
|
8/25 at 100.00 |
|
|
|
775,949 |
|
|
|
|
|
|
| |
5,125 |
|
|
|
|
Illinois State, General Obligation Bonds, November Series 2017C, 5.000%, 11/01/29 |
|
|
11/27 at 100.00 |
|
|
|
5,230,657 |
|
|
|
|
|
|
| |
1,755 |
|
|
|
|
Illinois State, General Obligation Bonds, October Series 2016, 5.000%, 2/01/27 |
|
|
No Opt. Call |
|
|
|
1,791,320 |
|
|
|
|
|
|
| |
5,590 |
|
|
|
|
Illinois Toll Highway Authority, Toll Highway Revenue Bonds, Senior Lien Series 2013A, 5.000%, 1/01/38 |
|
|
12/23 at 100.00 |
|
|
|
5,589,539 |
|
|
|
|
|
|
| |
4,000 |
|
|
|
|
Illinois Toll Highway Authority, Toll Highway Revenue Bonds, Senior Lien Series 2016B, 5.000%, 1/01/41 |
|
|
7/26 at 100.00 |
|
|
|
4,013,350 |
|
|
|
|
|
|
| |
5,000 |
|
|
|
|
Illinois Toll Highway Authority, Toll Highway Revenue Bonds, Senior Lien Series 2020A, 5.000%, 1/01/45 |
|
|
1/31 at 100.00 |
|
|
|
4,996,838 |
|
|
|
|
|
|
| |
9,015 |
|
|
|
|
Metropolitan Pier and Exposition Authority, Illinois, McCormick Place Expansion Project Bonds, Refunding Series 2020A, 4.000%,
6/15/50 |
|
|
12/29 at 100.00 |
|
|
|
7,017,744 |
|
|
|
|
|
|
|
|
|
|
|
|
Metropolitan Pier and Exposition Authority, Illinois, Revenue Bonds, McCormick Place Expansion Project, Series 1994B: |
|
|
|
|
|
|
|
|
| |
5,245 |
|
|
|
|
0.000%, 6/15/28 - NPFG Insured |
|
|
No Opt. Call |
|
|
|
4,227,904 |
|
| |
11,675 |
|
|
|
|
0.000%, 6/15/29 - FGIC Insured |
|
|
No Opt. Call |
|
|
|
8,955,363 |
|
|
|
|
|
|
|
|
|
|
|
|
Metropolitan Pier and Exposition Authority, Illinois, Revenue Bonds, McCormick Place Expansion Project, Series 2002A: |
|
|
|
|
|
|
|
|
| |
4,950 |
|
|
|
|
0.000%, 12/15/32 - NPFG Insured |
|
|
No Opt. Call |
|
|
|
3,200,019 |
|
| |
21,375 |
|
|
|
|
0.000%, 6/15/34 - NPFG Insured |
|
|
No Opt. Call |
|
|
|
12,811,382 |
|
| |
21,000 |
|
|
|
|
0.000%, 12/15/35 - NPFG Insured |
|
|
No Opt. Call |
|
|
|
11,539,922 |
|
| |
21,970 |
|
|
|
|
0.000%, 6/15/36 - NPFG Insured |
|
|
No Opt. Call |
|
|
|
11,671,833 |
|
| |
10,375 |
|
|
|
|
0.000%, 12/15/36 - NPFG Insured |
|
|
No Opt. Call |
|
|
|
5,325,783 |
|
| |
10,000 |
|
|
|
|
0.000%, 12/15/37 - NPFG Insured |
|
|
No Opt. Call |
|
|
|
4,790,922 |
|
| |
25,825 |
|
|
|
|
0.000%, 6/15/39 - NPFG Insured |
|
|
No Opt. Call |
|
|
|
11,222,737 |
|
|
|
|
|
|
| |
6,095 |
|
|
|
|
Regional Transportation Authority, Cook, DuPage, Kane, Lake, McHenry and Will Counties, Illinois, General Obligation Bonds,
Series 2002A, 6.000%, 7/01/32 - NPFG Insured |
|
|
No Opt. Call |
|
|
|
6,970,578 |
|
|
|
|
|
|
| |
8,000 |
|
|
|
|
Regional Transportation Authority, Cook, DuPage, Kane, Lake, McHenry and Will Counties, Illinois, General Obligation Bonds,
Series 2003A, 6.000%, 7/01/33 - NPFG Insured |
|
|
No Opt. Call |
|
|
|
9,041,732 |
|
|
|
|
|
|
| |
5,000 |
|
|
(c) |
|
Regional Transportation Authority, Cook, DuPage, Kane, Lake, McHenry and Will Counties, Illinois, General Obligation Bonds,
Series 2014A, 5.000%, 6/01/44, (Pre-refunded 6/01/24) |
|
|
6/24 at 100.00 |
|
|
|
5,034,006 |
|
|
|
|
|
|
|
|
|
|
|
|
Southwestern Illinois Development Authority, Local Government Revenue Bonds, Edwardsville Community Unit School District 7
Project, Series 2007: |
|
|
|
|
|
|
|
|
| |
2,645 |
|
|
|
|
0.000%, 12/01/23 - AGM Insured |
|
|
No Opt. Call |
|
|
|
2,636,249 |
|
| |
2,375 |
|
|
|
|
0.000%, 12/01/23 - AGM Insured |
|
|
No Opt. Call |
|
|
|
2,366,230 |
|
|
|
|
|
|
|
Total Illinois |
|
|
|
|
|
|
196,851,011 |
|
27
|
|
|
| NUV |
|
Nuveen Municipal Value Fund, Inc. (continued) Portfolio of Investments October 31, 2023 |
|
|
|
|
|
|
|
|
|
|
|
|
|
|
|
|
Principal
Amount (000) |
|
|
|
|
Description (a) |
|
|
Optional Call
Provisions (b) |
|
|
|
Value |
|
|
|
|
|
|
|
|
|
|
|
|
Indiana - 1.3% |
|
|
|
|
|
|
|
|
|
|
|
|
|
| $ |
2,250 |
|
|
|
|
Indiana Finance Authority, Hospital Revenue Bonds, Indiana Unversity Health Obligation Group, Refunding 2015A, 4.000%,
12/01/40 |
|
|
6/25 at 100.00 |
|
|
$ |
1,994,051 |
|
|
|
|
|
|
| |
2,000 |
|
|
|
|
Indiana Municipal Power Agency Power Supply System Revenue Bonds, Refunding Series 2016A, 5.000%, 1/01/42 |
|
|
7/26 at 100.00 |
|
|
|
1,993,210 |
|
|
|
|
|
|
| |
4,250 |
|
|
|
|
Indianapolis Local Public Improvement Bond Bank, Indiana, Community Justice Campus Bonds, Courthouse & Jail Project,
Series 2019A, 5.000%, 2/01/54 |
|
|
2/29 at 100.00 |
|
|
|
4,183,586 |
|
|
|
|
|
|
|
|
|
|
|
|
Indianapolis Local Public Improvement Bond Bank, Indiana, Series 1999E: |
|
|
|
|
|
|
|
|
| |
2,400 |
|
|
|
|
0.000%, 2/01/25 - AMBAC Insured |
|
|
No Opt. Call |
|
|
|
2,273,477 |
|
| |
14,595 |
|
|
|
|
0.000%, 2/01/27 - AMBAC Insured |
|
|
No Opt. Call |
|
|
|
12,681,648 |
|
|
|
|
|
|
|
Total Indiana |
|
|
|
|
|
|
23,125,972 |
|
|
|
|
|
|
|
|
|
|
|
|
Kentucky - 1.8% |
|
|
|
|
|
|
|
|
|
|
|
|
|
|
|
|
|
|
|
Kenton County Airport Board, Kentucky, Airport Revenue Bonds, Cincinnati/Northern Kentucky International Airport, Refunding
Series 2016: |
|
|
|
|
|
|
|
|
| |
1,530 |
|
|
|
|
5.000%, 1/01/27 |
|
|
1/26 at 100.00 |
|
|
|
1,560,682 |
|
| |
1,600 |
|
|
|
|
5.000%, 1/01/28 |
|
|
1/26 at 100.00 |
|
|
|
1,627,546 |
|
|
|
|
|
|
|
|
|
|
|
|
Kentucky Bond Development Corporation, Transient Room Tax Revenue Bonds, Lexington Center Corporation Project, Series
2018A: |
|
|
|
|
|
|
|
|
| |
1,280 |
|
|
|
|
5.000%, 9/01/37 |
|
|
9/28 at 100.00 |
|
|
|
1,303,306 |
|
| |
1,435 |
|
|
|
|
5.000%, 9/01/38 |
|
|
9/28 at 100.00 |
|
|
|
1,445,183 |
|
| |
4,000 |
|
|
|
|
5.000%, 9/01/43 |
|
|
9/28 at 100.00 |
|
|
|
3,781,877 |
|
| |
2,000 |
|
|
|
|
5.000%, 9/01/48 |
|
|
9/28 at 100.00 |
|
|
|
1,887,386 |
|
|
|
|
|
|
| |
1,000 |
|
|
|
|
Kentucky Economic Development Finance Authority, Louisville Arena Project Revenue Bonds, Louisville Arena Authority, Inc., Series
2017A, 5.000%, 12/01/45 - AGM Insured |
|
|
12/27 at 100.00 |
|
|
|
998,797 |
|
|
|
|
|
|
| |
8,935 |
|
|
|
|
Kentucky Economic Development Finance Authority, Revenue Bonds, Next Generation Kentucky Information Highway Project, Senior
Series 2015A, 5.000%, 1/01/45 |
|
|
7/25 at 100.00 |
|
|
|
8,111,734 |
|
|
|
|
|
|
| |
6,000 |
|
|
|
|
Kentucky Public Transportation Infrastructure Authority, Toll Revenue Bonds, Downtown Crossing Project, Convertible Capital
Appreciation First Tier Series 2013C, 6.600%, 7/01/39 |
|
|
7/31 at 100.00 |
|
|
|
6,557,237 |
|
|
|
|
|
|
| |
5,000 |
|
|
|
|
Kentucky State Property and Buildings Commission, Revenue Bonds, Project 115, Series
2017, 5.000%, 4/01/30 |
|
|
4/27 at 100.00 |
|
|
|
5,105,084 |
|
|
|
|
|
|
|
Total Kentucky |
|
|
|
|
|
|
32,378,832 |
|
|
|
|
|
|
|
|
|
|
|
|
Louisiana - 0.6% |
|
|
|
|
|
|
|
|
|
|
|
|
|
| |
1,335 |
|
|
|
|
East Baton Rouge Sewerage Commission, Louisiana, Revenue Bonds, Refunding Series 2019A, 4.000%, 2/01/45 |
|
|
2/29 at 100.00 |
|
|
|
1,123,932 |
|
|
|
|
|
|
| |
9,040 |
|
|
|
|
New Orleans Aviation Board, Louisiana, General Airport Revenue Bonds, North Terminal Project, Series 2017A, 5.000%, 1/01/48 - AGM
Insured |
|
|
1/27 at 100.00 |
|
|
|
8,756,010 |
|
|
|
|
|
|
| |
1,470 |
|
|
|
|
New Orleans Aviation Board, Louisiana, Special Facility Revenue Bonds, Parking Facilities
Corporation Consolidated Garage System, Series 2018A, 5.000%, 10/01/43 - AGM Insured |
|
|
10/28 at 100.00 |
|
|
|
1,455,220 |
|
|
|
|
|
|
|
Total Louisiana |
|
|
|
|
|
|
11,335,162 |
|
|
|
|
|
|
|
|
|
|
|
|
Maine - 0.9% |
|
|
|
|
|
|
|
|
|
|
|
|
|
|
|
|
|
|
|
Maine Health and Higher Educational Facilities Authority Revenue Bonds, MaineHealth Issue, Series 2018A: |
|
|
|
|
|
|
|
|
| |
5,125 |
|
|
|
|
5.000%, 7/01/43 |
|
|
7/28 at 100.00 |
|
|
|
4,993,823 |
|
| |
2,005 |
|
|
|
|
5.000%, 7/01/48 |
|
|
7/28 at 100.00 |
|
|
|
1,925,573 |
|
28
|
|
|
|
|
|
|
|
|
|
|
|
|
|
|
|
Principal
Amount (000) |
|
|
|
|
Description (a) |
|
|
Optional Call
Provisions (b) |
|
|
|
Value |
|
|
|
|
|
|
|
|
|
|
|
|
Maine (continued) |
|
|
|
|
|
|
|
|
| $ |
1,805 |
|
|
|
|
Maine Turnpike Authority, Turnpike Revenue Bonds, Series 2020, 5.000%, 7/01/50 |
|
|
7/30 at 100.00 |
|
|
$ |
1,806,963 |
|
|
|
|
|
|
| |
7,990 |
|
|
|
|
University of Maine, System Revenue Bonds, Series 2022, 5.000%, 3/01/47 |
|
|
3/32 at 100.00 |
|
|
|
7,817,418 |
|
|
|
|
|
|
|
Total Maine |
|
|
|
|
|
|
16,543,777 |
|
|
|
|
|
|
|
|
|
|
|
|
Maryland - 1.2% |
|
|
|
|
|
|
|
|
|
|
|
|
|
|
|
|
|
|
|
Baltimore, Maryland, Convention Center Hotel Revenue Bonds, Refunding Series 2017: |
|
|
|
|
|
|
|
|
| |
1,140 |
|
|
|
|
5.000%, 9/01/29 |
|
|
9/27 at 100.00 |
|
|
|
1,092,022 |
|
| |
630 |
|
|
|
|
5.000%, 9/01/31 |
|
|
9/27 at 100.00 |
|
|
|
595,307 |
|
| |
1,945 |
|
|
|
|
5.000%, 9/01/32 |
|
|
9/27 at 100.00 |
|
|
|
1,825,759 |
|
| |
385 |
|
|
|
|
5.000%, 9/01/34 |
|
|
9/27 at 100.00 |
|
|
|
356,124 |
|
| |
2,750 |
|
|
|
|
5.000%, 9/01/35 |
|
|
9/27 at 100.00 |
|
|
|
2,512,932 |
|
| |
2,550 |
|
|
|
|
5.000%, 9/01/42 |
|
|
9/27 at 100.00 |
|
|
|
2,120,207 |
|
| |
6,665 |
|
|
|
|
5.000%, 9/01/46 |
|
|
9/27 at 100.00 |
|
|
|
5,374,480 |
|
|
|
|
|
|
| |
1,050 |
|
|
|
|
Maryland Health and Higher Educational Facilities Authority, Maryland, Revenue Bonds, Meritus Medical Center, Series 2015,
5.000%, 7/01/40 |
|
|
7/25 at 100.00 |
|
|
|
1,013,875 |
|
|
|
|
|
|
|
|
|
|
|
|
Maryland Stadium Authority, Revenue Bonds, Baltimore City Public Schools Construction & Revitalization Program, Series
2018A: |
|
|
|
|
|
|
|
|
| |
4,375 |
|
|
|
|
5.000%, 5/01/47 |
|
|
5/28 at 100.00 |
|
|
|
4,384,364 |
|
| |
2,260 |
|
|
(c) |
|
5.000%, 5/01/47, (Pre-refunded 5/01/28) |
|
|
5/28 at 100.00 |
|
|
|
2,377,281 |
|
|
|
|
|
|
|
Total Maryland |
|
|
|
|
|
|
21,652,351 |
|
|
|
|
|
|
|
|
|
|
|
|
Massachusetts - 0.5% |
|
|
|
|
|
|
|
|
|
|
|
|
|
| |
1,000 |
|
|
|
|
Massachusetts Department of Transportation, Metropolitan Highway System Revenue Bonds, Refunding Senior Lien Series 2019A,
5.000%, 1/01/37 |
|
|
1/29 at 100.00 |
|
|
|
1,030,928 |
|
|
|
|
|
|
| |
2,905 |
|
|
|
|
Massachusetts Development Finance Agency, Revenue Bonds, Boston Medical Center Issue, Green Bonds, Series 2015D, 5.000%,
7/01/44 |
|
|
7/25 at 100.00 |
|
|
|
2,703,809 |
|
|
|
|
|
|
| |
1,500 |
|
|
|
|
Massachusetts Development Finance Agency, Revenue Bonds, Boston Medical Center Issue, Series 2016E, 5.000%, 7/01/35 |
|
|
7/26 at 100.00 |
|
|
|
1,506,424 |
|
|
|
|
|
|
| |
2,765 |
|
|
|
|
Massachusetts Development Finance Agency, Revenue Bonds, Dana- Farber Cancer Institute Issue, Series 2016N, 5.000%,
12/01/46 |
|
|
12/26 at 100.00 |
|
|
|
2,657,467 |
|
|
|
|
|
|
| |
980 |
|
|
|
|
Massachusetts Turnpike Authority, Metropolitan Highway System Revenue Bonds, Senior
Series 1997A, 0.000%, 1/01/29 - NPFG Insured |
|
|
No Opt. Call |
|
|
|
780,247 |
|
|
|
|
|
|
|
Total Massachusetts |
|
|
|
|
|
|
8,678,875 |
|
|
|
|
|
|
|
|
|
|
|
|
Michigan - 2.9% |
|
|
|
|
|
|
|
|
|
|
|
|
|
|
|
|
|
|
|
Bloomfield Hills Schools, Oakland County, Michigan, General Obligation Bonds, School Building & Site Series
2023: |
|
|
|
|
|
|
|
|
| |
1,475 |
|
|
|
|
5.000%, 5/01/44 |
|
|
5/33 at 100.00 |
|
|
|
1,493,918 |
|
| |
625 |
|
|
|
|
5.000%, 5/01/48 |
|
|
5/33 at 100.00 |
|
|
|
628,757 |
|
| |
820 |
|
|
|
|
5.000%, 5/01/50 |
|
|
5/33 at 100.00 |
|
|
|
822,807 |
|
|
|
|
|
|
|
|
|
|
|
|
Detroit Academy of Arts and Sciences, Michigan, Public School Academy Revenue Bonds, Refunding Series 2013: |
|
|
|
|
|
|
|
|
| |
1,405 |
|
|
|
|
6.000%, 10/01/33 |
|
|
12/23 at 100.00 |
|
|
|
1,273,915 |
|
| |
2,520 |
|
|
|
|
6.000%, 10/01/43 |
|
|
12/23 at 100.00 |
|
|
|
2,120,713 |
|
|
|
|
|
|
| |
15 |
|
|
|
|
Detroit, Michigan, Second Lien Sewerage Disposal System Revenue Bonds, Series 2005A, 4.500%, 7/01/35 - NPFG Insured |
|
|
12/23 at 100.00 |
|
|
|
15,001 |
|
|
|
|
|
|
| |
2,925 |
|
|
|
|
Detroit, Michigan, Senior Lien Sewerage Disposal System Revenue Bonds, Series 2001B, 5.500%, 7/01/29 - NPFG Insured |
|
|
No Opt. Call |
|
|
|
2,982,513 |
|
|
|
|
|
|
| |
5 |
|
|
|
|
Detroit, Michigan, Water Supply System Revenue Bonds, Second Lien Series 2003B, 5.000%, 7/01/34 - NPFG Insured |
|
|
12/23 at 100.00 |
|
|
|
5,005 |
|
29
|
|
|
| NUV |
|
Nuveen Municipal Value Fund, Inc. (continued) Portfolio of Investments October 31, 2023 |
|
|
|
|
|
|
|
|
|
|
|
|
|
|
|
|
Principal
Amount (000) |
|
|
|
|
Description (a) |
|
|
Optional Call
Provisions (b) |
|
|
|
Value |
|
|
|
|
|
|
|
|
|
|
|
|
Michigan (continued) |
|
|
|
|
|
|
|
|
| $ |
5 |
|
|
|
|
Detroit, Michigan, Water Supply System Revenue Bonds, Senior Lien Series 2003A, 5.000%, 7/01/34 - NPFG Insured |
|
|
12/23 at 100.00 |
|
|
$ |
5,005 |
|
|
|
|
|
|
| |
4,000 |
|
|
|
|
Kalamazoo County, Michigan, General Obligation Bonds, Limitied Tax Series 2022, 4.000%, 5/01/45 |
|
|
5/31 at 100.00 |
|
|
|
3,382,301 |
|
|
|
|
|
|
| |
3,315 |
|
|
|
|
Michigan Finance Authority, Distributable State Aid Revenue Bonds, Charter County of Wayne Criminal Justice Center Project,
Senior Lien Series 2018, 5.000%, 11/01/43 |
|
|
11/28 at 100.00 |
|
|
|
3,340,900 |
|
|
|
|
|
|
| |
1,565 |
|
|
|
|
Michigan Finance Authority, Tobacco Settlement Asset- Backed Bonds, 2007 Sold Tobacco Receipts, Series 2020B-1-CL2, 5.000%, 6/01/49 |
|
|
12/30 at 100.00 |
|
|
|
1,533,944 |
|
|
|
|
|
|
| |
6,000 |
|
|
|
|
Michigan Hospital Finance Authority, Revenue Bonds, Ascension Health Senior Credit Group, Refunding & Project Series 2010F-6, 4.000%, 11/15/47 |
|
|
11/26 at 100.00 |
|
|
|
4,941,875 |
|
|
|
|
|
|
|
|
|
|
|
|
Michigan State Building Authority, Revenue Bonds, Facilities Program, Refunding Series
2015-I: |
|
|
|
|
|
|
|
|
| |
9,565 |
|
|
|
|
5.000%, 4/15/30 |
|
|
10/25 at 100.00 |
|
|
|
9,722,733 |
|
| |
435 |
|
|
(c) |
|
5.000%, 4/15/30, (Pre-refunded 10/15/25) |
|
|
10/25 at 100.00 |
|
|
|
443,850 |
|
|
|
|
|
|
| |
2,100 |
|
|
|
|
Michigan State Building Authority, Revenue Bonds, Facilities Program, Refunding Series 2023II, 4.000%, 10/15/43 |
|
|
10/33 at 100.00 |
|
|
|
1,832,016 |
|
|
|
|
|
|
|
|
|
|
|
|
Michigan State, Trunk Line Fund Bonds, Rebuilding Michigan Program, Series 2021A: |
|
|
|
|
|
|
|
|
| |
3,020 |
|
|
|
|
4.000%, 11/15/37 |
|
|
11/31 at 100.00 |
|
|
|
2,801,340 |
|
| |
6,510 |
|
|
|
|
4.000%, 11/15/38 |
|
|
11/31 at 100.00 |
|
|
|
6,006,252 |
|
|
|
|
|
|
|
|
|
|
|
|
Michigan Technological University, General Revenue Bonds, Series 2023A: |
|
|
|
|
|
|
|
|
| |
1,515 |
|
|
|
|
5.000%, 10/01/47 - AGM Insured |
|
|
10/31 at 100.00 |
|
|
|
1,476,914 |
|
| |
675 |
|
|
|
|
5.250%, 10/01/52 - AGM Insured |
|
|
10/31 at 100.00 |
|
|
|
673,129 |
|
|
|
|
|
|
| |
1,800 |
|
|
|
|
Northern Michigan University, General Revenue Bonds, Series 2021, 4.000%, 6/01/46 |
|
|
6/31 at 100.00 |
|
|
|
1,414,200 |
|
|
|
|
|
|
| |
1,100 |
|
|
|
|
Wayne County Airport Authority, Michigan, Revenue Bonds, Detroit Metropolitan Wayne County Airport, Series 2015D, 5.000%,
12/01/45 |
|
|
12/25 at 100.00 |
|
|
|
1,080,378 |
|
|
|
|
|
|
| |
5,000 |
|
|
|
|
Wayne County Airport Authority, Michigan, Revenue Bonds, Detroit Metropolitan Wayne
County Airport, Series 2023A, 5.250%, 12/01/48 - AGM Insured |
|
|
12/33 at 100.00 |
|
|
|
5,093,859 |
|
|
|
|
|
|
|
Total Michigan |
|
|
|
|
|
|
53,091,325 |
|
|
|
|
|
|
|
|
|
|
|
|
Minnesota - 0.3% |
|
|
|
|
|
|
|
|
|
|
|
|
|
| |
3,200 |
|
|
|
|
Rochester, Minnesota, Health Care Facilities Revenue Bonds, Mayo Clinic, Refunding Series 2016B, 5.000%, 11/15/34 |
|
|
No Opt. Call |
|
|
|
3,516,356 |
|
|
|
|
|
|
| |
1,480 |
|
|
|
|
University of Minnesota, General Obligation Bonds, Series 2016A, 5.000%, 4/01/41 |
|
|
4/26 at 100.00 |
|
|
|
1,489,724 |
|
|
|
|
|
|
|
Total Minnesota |
|
|
|
|
|
|
5,006,080 |
|
|
|
|
|
|
|
|
|
|
|
|
Missouri - 0.2% |
|
|
|
|
|
|
|
|
|
|
|
|
|
| |
3,465 |
|
|
|
|
Missouri Health and Educational Facilities Authority, Health Facilities Revenue Bonds,
CoxHealth, Series 2013A, 5.000%, 11/15/48 |
|
|
12/23 at 100.00 |
|
|
|
3,253,280 |
|
|
|
|
|
|
|
Total Missouri |
|
|
|
|
|
|
3,253,280 |
|
|
|
|
|
|
|
|
|
|
|
|
Montana - 0.6% |
|
|
|
|
|
|
|
|
|
|
|
|
|
| |
1,115 |
|
|
|
|
Billings, Montana, Sewer System Revenue Bonds, Series 2017, 5.000%, 7/01/33 |
|
|
7/27 at 100.00 |
|
|
|
1,149,299 |
|
|
|
|
|
|
|
|
|
|
|
|
Montana Facility Finance Authority, Healthcare Facility Revenue Bonds, Kalispell Regional Medical Center, Series 2018B: |
|
|
|
|
|
|
|
|
| |
1,340 |
|
|
|
|
5.000%, 7/01/30 |
|
|
7/28 at 100.00 |
|
|
|
1,340,540 |
|
30
|
|
|
|
|
|
|
|
|
|
|
|
|
|
|
|
Principal
Amount (000) |
|
|
|
|
Description (a) |
|
|
Optional Call
Provisions (b) |
|
|
|
Value |
|
|
|
|
|
|
|
|
|
|
|
|
Montana (continued) |
|
|
|
|
|
|
|
|
| $ |
1,415 |
|
|
|
|
5.000%, 7/01/31 |
|
|
7/28 at 100.00 |
|
|
$ |
1,412,652 |
|
| |
1,980 |
|
|
|
|
5.000%, 7/01/32 |
|
|
7/28 at 100.00 |
|
|
|
1,971,729 |
|
| |
2,135 |
|
|
|
|
5.000%, 7/01/33 |
|
|
7/28 at 100.00 |
|
|
|
2,119,199 |
|
|
|
|
|
|
| |
3,045 |
|
|
|
|
Montana Facility Finance Authority, Revenue Bonds, Billings Clinic Obligated Group,
Series 2018A, 5.000%, 8/15/48 |
|
|
8/28 at 100.00 |
|
|
|
2,921,528 |
|
|
|
|
|
|
|
Total Montana |
|
|
|
|
|
|
10,914,947 |
|
|
|
|
|
|
|
|
|
|
|
|
Nebraska - 0.2% |
|
|
|
|
|
|
|
|
|
|
|
|
|
|
|
|
|
|
|
Central Plains Energy Project, Nebraska, Gas Project 3 Revenue Bonds, Refunding Crossover Series 2017A: |
|
|
|
|
|
|
|
|
| |
1,710 |
|
|
|
|
5.000%, 9/01/35 |
|
|
No Opt. Call |
|
|
|
1,690,546 |
|
| |
1,500 |
|
|
|
|
5.000%, 9/01/42 |
|
|
No Opt. Call |
|
|
|
1,410,523 |
|
|
|
|
|
|
| |
1,400 |
|
|
|
|
Douglas County Hospital Authority 3, Nebraska, Health Facilities Revenue Bonds, Nebraska
Methodist Health System, Refunding Series 2015, 5.000%, 11/01/45 |
|
|
11/25 at 100.00 |
|
|
|
1,353,630 |
|
|
|
|
|
|
|
Total Nebraska |
|
|
|
|
|
|
4,454,699 |
|
|
|
|
|
|
|
|
|
|
|
|
Nevada - 2.7% |
|
|
|
|
|
|
|
|
|
|
|
|
|
| |
490 |
|
|
|
|
Clark County School District, Nevada, General Obligation Bonds, Limited Tax Building Series 2020A, 4.000%, 6/15/40 - AGM
Insured |
|
|
6/30 at 100.00 |
|
|
|
429,671 |
|
|
|
|
|
|
|
|
|
|
|
|
Clark County, Nevada, General Obligation Bonds, Transportation Improvement, Limited Tax, Additionally Secured by Pledged Revenue
Series 2018B: |
|
|
|
|
|
|
|
|
| |
2,000 |
|
|
|
|
5.000%, 12/01/33 |
|
|
12/28 at 100.00 |
|
|
|
2,092,440 |
|
| |
5,000 |
|
|
|
|
5.000%, 12/01/35 |
|
|
12/28 at 100.00 |
|
|
|
5,197,967 |
|
|
|
|
|
|
| |
5,000 |
|
|
|
|
Las Vegas Convention and Visitors Authority, Nevada, Convention Center Expansion Revenue Bonds, Series 2018B, 5.000%,
7/01/43 |
|
|
7/28 at 100.00 |
|
|
|
5,023,269 |
|
|
|
|
|
|
| |
8,500 |
|
|
|
|
Las Vegas Convention and Visitors Authority, Nevada, Revenue Bonds, Series 2018C, 5.250%, 7/01/43 |
|
|
7/28 at 100.00 |
|
|
|
8,627,207 |
|
|
|
|
|
|
|
|
|
|
|
|
Las Vegas Valley Water District, Nevada, General Obligation Bonds, Refunding Series 2015: |
|
|
|
|
|
|
|
|
| |
5,220 |
|
|
|
|
5.000%, 6/01/33 |
|
|
12/24 at 100.00 |
|
|
|
5,271,977 |
|
| |
10,000 |
|
|
|
|
5.000%, 6/01/34 |
|
|
12/24 at 100.00 |
|
|
|
10,097,462 |
|
| |
9,000 |
|
|
|
|
5.000%, 6/01/39 |
|
|
12/24 at 100.00 |
|
|
|
9,039,473 |
|
|
|
|
|
|
| |
1,205 |
|
|
|
|
Las Vegas Valley Water District, Nevada, General Obligation Bonds, Refunding Water Improvement Series 2016A, 5.000%,
6/01/41 |
|
|
6/26 at 100.00 |
|
|
|
1,213,645 |
|
|
|
|
|
|
| |
2,000 |
|
|
|
|
Reno, Nevada, Subordinate Lien Sales Tax Revenue Refunding Bonds, ReTrac-Reno Transporation Rail Access Corridor Project, Series
2018A, 5.000%, 6/01/48 |
|
|
12/28 at 100.00 |
|
|
|
1,867,447 |
|
|
|
|
|
|
| |
250 |
|
|
|
|
Reno, Nevada, Subordinate Lien Sales Tax Revenue Refunding Bonds, ReTrac-Reno
Transporation Rail Access Corridor Project, Series 2018B,
5.000%, 6/01/33 - AGM Insured |
|
|
12/28 at 100.00 |
|
|
|
257,514 |
|
|
|
|
|
|
|
Total Nevada |
|
|
|
|
|
|
49,118,072 |
|
|
|
|
|
|
|
|
|
|
|
|
New Jersey - 4.4% |
|
|
|
|
|
|
|
|
|
|
|
|
|
| |
2,500 |
|
|
|
|
Delaware River Port Authority, New Jersey and Pennsylvania, Revenue Bonds, Series 2018A, 5.000%, 1/01/36 |
|
|
1/29 at 100.00 |
|
|
|
2,602,084 |
|
|
|
|
|
|
| |
930 |
|
|
|
|
New Jersey Economic Development Authority, Private Activity Bonds, The Goethals Bridge Replacement Project, Series 2013, 5.125%,
1/01/39 - AGM Insured, (AMT) |
|
|
1/24 at 100.00 |
|
|
|
930,181 |
|
|
|
|
|
|
| |
6,000 |
|
|
(c) |
|
New Jersey Economic Development Authority, School Facilities Construction Bonds, Refunding Series 2016BBB, 5.500%, 6/15/31, (Pre-
refunded 12/15/26) |
|
|
12/26 at 100.00 |
|
|
|
6,303,208 |
|
31
|
|
|
| NUV |
|
Nuveen Municipal Value Fund, Inc. (continued) Portfolio of Investments October 31, 2023 |
|
|
|
|
|
|
|
|
|
|
|
|
|
|
|
|
Principal
Amount (000) |
|
|
|
|
Description (a) |
|
|
Optional Call
Provisions (b) |
|
|
|
Value |
|
|
|
|
|
|
|
|
|
|
|
|
New Jersey (continued) |
|
|
|
|
|
|
|
|
| $ |
5,990 |
|
|
|
|
New Jersey Economic Development Authority, School Facilities Construction Bonds, Series
2005N-1, 5.500%, 9/01/25 - AGM Insured |
|
|
No Opt. Call |
|
|
$ |
6,149,035 |
|
|
|
|
|
|
| |
3,380 |
|
|
|
|
New Jersey Transportation Trust Fund Authority, Transportation Program Bonds, Series 2022BB, 4.000%, 6/15/46 |
|
|
12/31 at 100.00 |
|
|
|
2,882,131 |
|
|
|
|
|
|
| |
9,420 |
|
|
|
|
New Jersey Transportation Trust Fund Authority, Transportation System Bonds, Capital Appreciation Series 2010A, 0.000%,
12/15/31 |
|
|
No Opt. Call |
|
|
|
6,471,304 |
|
|
|
|
|
|
|
|
|
|
|
|
New Jersey Transportation Trust Fund Authority, Transportation System Bonds, Refunding Series 2006C: |
|
|
|
|
|
|
|
|
| |
30,000 |
|
|
|
|
0.000%, 12/15/30 - FGIC Insured |
|
|
No Opt. Call |
|
|
|
21,760,968 |
|
| |
27,000 |
|
|
|
|
0.000%, 12/15/32 - AGM Insured |
|
|
No Opt. Call |
|
|
|
17,943,520 |
|
|
|
|
|
|
|
|
|
|
|
|
New Jersey Transportation Trust Fund Authority, Transportation System Bonds, Series 2015AA: |
|
|
|
|
|
|
|
|
| |
2,750 |
|
|
|
|
5.250%, 6/15/32 |
|
|
6/25 at 100.00 |
|
|
|
2,777,862 |
|
| |
2,150 |
|
|
|
|
5.250%, 6/15/34 |
|
|
6/25 at 100.00 |
|
|
|
2,167,144 |
|
|
|
|
|
|
| |
1,220 |
|
|
|
|
New Jersey Transportation Trust Fund Authority, Transportation System Bonds, Series 2020AA, 4.000%, 6/15/50 |
|
|
12/30 at 100.00 |
|
|
|
1,014,323 |
|
|
|
|
|
|
| |
2,000 |
|
|
|
|
New Jersey Turnpike Authority, Revenue Bonds, Series 2017B, 5.000%, 1/01/40 |
|
|
1/28 at 100.00 |
|
|
|
2,024,821 |
|
|
|
|
|
|
| |
3,760 |
|
|
|
|
New Jersey Turnpike Authority, Turnpike Revenue Bonds, Series 2017G, 4.000%, 1/01/43 |
|
|
1/28 at 100.00 |
|
|
|
3,337,050 |
|
|
|
|
|
|
| |
1,455 |
|
|
|
|
South Jersey Transportation Authority, New Jersey, Transportation System Revenue Bonds, Series 2020A, 5.000%, 11/01/41 - BAM
Insured |
|
|
11/30 at 100.00 |
|
|
|
1,453,788 |
|
|
|
|
|
|
| |
2,535 |
|
|
|
|
Tobacco Settlement Financing Corporation, New Jersey, Tobacco Settlement Asset-Backed
Bonds, Series 2018B, 5.000%, 6/01/46 |
|
|
6/28 at 100.00 |
|
|
|
2,353,567 |
|
|
|
|
|
|
|
Total New Jersey |
|
|
|
|
|
|
80,170,986 |
|
|
|
|
|
|
|
|
|
|
|
|
New York - 7.6% |
|
|
|
|
|
|
|
|
|
|
|
|
|
| |
4,200 |
|
|
|
|
Dormitory Authority of the State of New York, State Personal Income Tax Revenue Bonds, General Purpose, Series 2021B,
4.000%, 3/15/47 |
|
|
3/31 at 100.00 |
|
|
|
3,616,080 |
|
|
|
|
|
|
|
|
|
|
|
|
Dormitory Authority of the State of New York, Lease Revenue Bonds, State University Dormitory Facilities, Series 2017A: |
|
|
|
|
|
|
|
|
| |
2,970 |
|
|
|
|
5.000%, 7/01/42 |
|
|
7/27 at 100.00 |
|
|
|
2,997,246 |
|
| |
780 |
|
|
(c) |
|
5.000%, 7/01/42, (Pre-refunded 7/01/27) |
|
|
7/27 at 100.00 |
|
|
|
813,979 |
|
|
|
|
|
|
| |
1,950 |
|
|
|
|
Long Island Power Authority, New York, Electric System General Revenue Bonds, Series 2018, 5.000%, 9/01/39 |
|
|
9/28 at 100.00 |
|
|
|
1,984,378 |
|
|
|
|
|
|
|
|
|
|
|
|
Long Island Power Authority, New York, Electric System General Revenue Bonds, Series 2021A: |
|
|
|
|
|
|
|
|
| |
1,000 |
|
|
|
|
4.000%, 9/01/39 |
|
|
9/31 at 100.00 |
|
|
|
887,562 |
|
| |
2,100 |
|
|
|
|
4.000%, 9/01/41 |
|
|
9/31 at 100.00 |
|
|
|
1,828,233 |
|
|
|
|
|
|
|
|
|
|
|
|
Metropolitan Transportation Authority, New York, Transportation Revenue Bonds, Green Climate Bond Certified Series 2020C-1: |
|
|
|
|
|
|
|
|
| |
3,100 |
|
|
|
|
4.750%, 11/15/45 |
|
|
5/30 at 100.00 |
|
|
|
2,853,357 |
|
| |
8,325 |
|
|
|
|
5.000%, 11/15/50 |
|
|
5/30 at 100.00 |
|
|
|
7,929,126 |
|
|
|
|
|
|
|
|
|
|
|
|
MTA Hudson Rail Yards Trust Obligations, New York, MTA Financing Agreement Payable by the Metropolitan Transportation Authority,
Series 2016A: |
|
|
|
|
|
|
|
|
| |
3,135 |
|
|
|
|
5.000%, 11/15/51 |
|
|
11/23 at 100.00 |
|
|
|
2,955,701 |
|
| |
7,380 |
|
|
|
|
5.000%, 11/15/56 |
|
|
11/23 at 100.00 |
|
|
|
6,872,100 |
|
|
|
|
|
|
|
|
|
|
|
|
New York City Industrial Development Agency, New York, PILOT Payment in Lieu of Taxes Revenue Bonds, Queens Baseball Stadium
Project, Refunding Series 2021A: |
|
|
|
|
|
|
|
|
| |
1,500 |
|
|
|
|
5.000%, 1/01/29 - AGM Insured |
|
|
No Opt. Call |
|
|
|
1,556,992 |
|
32
|
|
|
|
|
|
|
|
|
|
|
|
|
|
|
|
Principal
Amount (000) |
|
|
|
|
Description (a) |
|
|
Optional Call
Provisions (b) |
|
|
|
Value |
|
|
|
|
|
|
|
|
|
|
|
|
New York (continued) |
|
|
|
|
|
|
|
|
| $ |
1,750 |
|
|
|
|
5.000%, 1/01/30 - AGM Insured |
|
|
No Opt. Call |
|
|
$ |
1,823,684 |
|
|
|
|
|
|
| |
4,000 |
|
|
|
|
New York City Municipal Water Finance Authority, New York, Water and Sewer System Second General Resolution Revenue Bonds, Fiscal
2019 Series FF-2, 4.000%, 6/15/37 |
|
|
6/29 at 100.00 |
|
|
|
3,733,725 |
|
|
|
|
|
|
| |
17,425 |
|
|
|
|
New York City Transitional Finance Authority, New York, Building Aid Revenue Bonds, Fiscal 2019 Subseries S-3A, 5.000%, 7/15/37 |
|
|
7/28 at 100.00 |
|
|
|
17,774,840 |
|
|
|
|
|
|
| |
5,000 |
|
|
|
|
New York City Transitional Finance Authority, New York, Future Tax Secured Bonds, Subordinate Fiscal 2022 Subseries F-1, 5.000%, 2/01/51 |
|
|
2/32 at 100.00 |
|
|
|
4,971,614 |
|
|
|
|
|
|
| |
3,465 |
|
|
|
|
New York City, New York, General Obligation Bonds, Fiscal 2021 Series C, 5.000%, 8/01/42 |
|
|
8/30 at 100.00 |
|
|
|
3,511,767 |
|
|
|
|
|
|
| |
11,755 |
|
|
|
|
New York Liberty Development Corporation, New York, Liberty Revenue Bonds, 3 World Trade Center Project, Class 1 Series
2014, 5.000%, 11/15/44, 144A |
|
|
11/24 at 100.00 |
|
|
|
10,528,369 |
|
|
|
|
|
|
| |
3,180 |
|
|
|
|
New York Liberty Development Corporation, New York, Liberty Revenue Bonds, Secured by Port Authority Consolidated Bonds,
Refunding Series 1WTC-2021, 4.000%, 2/15/43 - BAM Insured |
|
|
2/30 at 100.00 |
|
|
|
2,698,174 |
|
|
|
|
|
|
| |
4,000 |
|
|
|
|
New York State Power Authority, General Revenue Bonds, Series 2020A, 4.000%, 11/15/50 |
|
|
5/30 at 100.00 |
|
|
|
3,314,312 |
|
|
|
|
|
|
| |
1,000 |
|
|
|
|
New York State Thruway Authority, State Personal Income Tax Revenue Bonds, Bidding Group 1 Series 2022A, 4.000%, 3/15/49 |
|
|
9/32 at 100.00 |
|
|
|
856,085 |
|
|
|
|
|
|
| |
8,270 |
|
|
|
|
New York Transportation Development Corporation, New York, Special Facilities Bonds, LaGuardia Airport Terminal B Redevelopment
Project, Series 2016A, 5.000%, 7/01/41, (AMT) |
|
|
7/24 at 100.00 |
|
|
|
7,853,322 |
|
|
|
|
|
|
| |
5,000 |
|
|
|
|
New York Transportation Development Corporation, New York, Special Facility Revenue Bonds, Terminal 4 John F Kennedy
International Airport Project, Series 2022, 5.000%, 12/01/40, (AMT) |
|
|
12/32 at 100.00 |
|
|
|
4,809,173 |
|
|
|
|
|
|
|
|
|
|
|
|
New York Transportation Development Corporation, Special Facility Revenue Bonds, Delta Air Lines, Inc. - LaGuardia Airport
Terminals C&D Redevelopment Project, Series 2018: |
|
|
|
|
|
|
|
|
| |
3,250 |
|
|
|
|
5.000%, 1/01/34, (AMT) |
|
|
1/28 at 100.00 |
|
|
|
3,136,290 |
|
| |
5,250 |
|
|
|
|
5.000%, 1/01/36, (AMT) |
|
|
1/28 at 100.00 |
|
|
|
4,974,126 |
|
|
|
|
|
|
| |
4,500 |
|
|
|
|
Suffolk Tobacco Asset Securitization Corporation, New York, Tobacco Settlement Asset-Backed Bonds, Senior Series 2021A-2, 4.000%, 6/01/50 |
|
|
6/31 at 100.00 |
|
|
|
3,616,212 |
|
|
|
|
|
|
| |
8,000 |
|
|
|
|
Triborough Bridge and Tunnel Authority, New York, General Purpose Revenue Bonds, MTA Bridges & Tunnels, Series 2017A,
5.000%, 11/15/37 |
|
|
5/27 at 100.00 |
|
|
|
8,154,460 |
|
|
|
|
|
|
| |
3,000 |
|
|
|
|
Triborough Bridge and Tunnel Authority, New York, General Purpose Revenue Bonds, Refunding Series 2015A, 5.000%,
11/15/50 |
|
|
5/25 at 100.00 |
|
|
|
2,967,058 |
|
|
|
|
|
|
| |
7,000 |
|
|
|
|
Triborough Bridge and Tunnel Authority, New York, Payroll Mobility Tax Bonds, Senior Lien Green Bonds, Series 2022D-2, 4.500%, 5/15/52 |
|
|
11/32 at 100.00 |
|
|
|
6,446,789 |
|
|
|
|
|
|
| |
5,000 |
|
|
|
|
Triborough Bridge and Tunnel Authority, New York, Payroll Mobility Tax Bonds, Senior Lien Subseries 2021A-1, 5.000%, 5/15/51 |
|
|
5/31 at 100.00 |
|
|
|
4,957,045 |
|
|
|
|
|
|
| |
6,000 |
|
|
|
|
Triborough Bridge and Tunnel Authority, New York, Sales Tax Revenue Bonds, MTA Bridges & Tunnels, TBTA Capital
Lockbox-City Sales Tax, Series 2022A, 5.250%, 5/15/57 |
|
|
11/32 at 100.00 |
|
|
|
6,120,359 |
|
|
|
|
|
|
| |
650 |
|
|
|
|
TSASC Inc., New York, Tobacco Settlement Asset-Backed Bonds, Fiscal 2017 Series B,
5.000%, 6/01/24 |
|
|
No Opt. Call |
|
|
|
646,613 |
|
|
|
|
|
|
|
Total New York |
|
|
|
|
|
|
137,188,771 |
|
|
|
|
|
|
|
|
|
|
|
|
North Carolina - 1.0% |
|
|
|
|
|
|
|
|
|
|
|
|
|
| |
1,520 |
|
|
|
|
North Carolina Capital Facilities Finance Agency, Revenue Bonds, Duke University Project, Refunding Series 2016B, 5.000%,
10/01/44 |
|
|
10/26 at 100.00 |
|
|
|
1,523,786 |
|
33
|
|
|
| NUV |
|
Nuveen Municipal Value Fund, Inc. (continued) Portfolio of Investments October 31, 2023 |
|
|
|
|
|
|
|
|
|
|
|
|
|
|
|
|
Principal
Amount (000) |
|
|
|
|
Description (a) |
|
|
Optional Call
Provisions (b) |
|
|
|
Value |
|
|
|
|
|
|
|
|
|
|
|
|
North Carolina (continued) |
|
|
|
|
|
|
|
|
|
|
|
|
|
|
North Carolina Department of Transportation, Private Activity Revenue Bonds, I-77 Hot
Lanes Project, Series 2015: |
|
|
|
|
|
|
|
|
| $ |
2,155 |
|
|
|
|
5.000%, 12/31/37, (AMT) |
|
|
6/25 at 100.00 |
|
|
$ |
2,077,798 |
|
| |
4,175 |
|
|
|
|
5.000%, 6/30/54, (AMT) |
|
|
6/25 at 100.00 |
|
|
|
3,758,243 |
|
|
|
|
|
|
| |
2,995 |
|
|
|
|
North Carolina Turnpike Authority, Monroe Expressway Toll Revenue Bonds, Series 2017A, 5.000%, 7/01/54 |
|
|
7/26 at 100.00 |
|
|
|
2,786,029 |
|
|
|
|
|
|
|
|
|
|
|
|
North Carolina Turnpike Authority, Triangle Expressway System Revenue Bonds, Capital Appreciation Series 2019: |
|
|
|
|
|
|
|
|
| |
2,000 |
|
|
|
|
0.000%, 1/01/41 |
|
|
1/30 at 71.45 |
|
|
|
820,768 |
|
| |
1,500 |
|
|
|
|
0.000%, 1/01/42 |
|
|
1/30 at 68.97 |
|
|
|
577,723 |
|
| |
14,500 |
|
|
|
|
0.000%, 1/01/49 |
|
|
1/30 at 54.10 |
|
|
|
3,595,143 |
|
|
|
|
|
|
|
|
|
|
|
|
North Carolina Turnpike Authority, Triangle Expressway System Revenue Bonds, Refunding Senior Lien Series 2017: |
|
|
|
|
|
|
|
|
| |
1,625 |
|
|
|
|
5.000%, 1/01/30 |
|
|
1/27 at 100.00 |
|
|
|
1,648,800 |
|
|
|
|
|
|
| |
1,850 |
|
|
|
|
5.000%, 1/01/32 |
|
|
1/27 at 100.00 |
|
|
|
1,875,895 |
|
|
|
|
|
|
|
Total North Carolina |
|
|
|
|
|
|
18,664,185 |
|
|
|
|
|
|
|
|
|
|
|
|
North Dakota - 0.1% |
|
|
|
|
|
|
|
|
|
|
|
|
|
| |
1,840 |
|
|
|
|
Grand Forks, North Dakota, Health Care System Revenue Bonds, Altru Health System
Obligated Group, Series 2017A, 5.000%, 12/01/42 |
|
|
12/27 at 100.00 |
|
|
|
1,648,362 |
|
|
|
|
|
|
|
Total North Dakota |
|
|
|
|
|
|
1,648,362 |
|
|
|
|
|
|
|
|
|
|
|
|
Ohio - 4.0% |
|
|
|
|
|
|
|
|
|
|
|
|
|
| |
4,710 |
|
|
|
|
Buckeye Tobacco Settlement Financing Authority, Ohio, Tobacco Settlement Asset-Backed Revenue Bonds, Refunding Senior Lien Series
2020A-2 Class 1, 4.000%, 6/01/48 |
|
|
6/30 at 100.00 |
|
|
|
3,769,657 |
|
|
|
|
|
|
| |
44,200 |
|
|
|
|
Buckeye Tobacco Settlement Financing Authority, Ohio, Tobacco Settlement Asset-Backed Revenue Bonds, Refunding Senior Lien Series
2020B-2 Class 2, 5.000%, 6/01/55 |
|
|
6/30 at 100.00 |
|
|
|
36,208,406 |
|
|
|
|
|
|
| |
4,975 |
|
|
|
|
Central Ohio Transit Authority, Ohio, General Obligation Bonds, Capital Facilities Limited Tax Series 2023, 5.000%,
12/01/53 |
|
|
12/33 at 100.00 |
|
|
|
4,985,961 |
|
|
|
|
|
|
| |
1,195 |
|
|
|
|
Franklin County, Ohio, Hospital Revenue Bonds, Nationwide Children’s Hospital Project, Refunding & Improvement
Series 2017A, 5.000%, 11/01/32 |
|
|
11/27 at 100.00 |
|
|
|
1,241,427 |
|
|
|
|
|
|
| |
3,485 |
|
|
|
|
Franklin County, Ohio, Revenue Bonds, Trinity Health Credit Group, Series 2017OH, 4.000%, 12/01/46 |
|
|
6/27 at 100.00 |
|
|
|
2,904,570 |
|
|
|
|
|
|
| |
5,000 |
|
|
|
|
Franklin County, Ohio, Sales Tax Revenue Bonds, Various Purpose Series 2018, 5.000%, 6/01/43 |
|
|
6/28 at 100.00 |
|
|
|
5,061,014 |
|
|
|
|
|
|
| |
14,500 |
|
|
|
|
Ohio Air Quality Development Authority, Ohio, Pollution Control Revenue Bonds, FirstEnergy Generation Corporation Project,
Refunding Series 2009D, 3.375%, 8/01/29, (Mandatory Put 9/15/21) |
|
|
No Opt. Call |
|
|
|
12,774,236 |
|
|
|
|
|
|
| |
4,110 |
|
|
|
|
Ohio State, Private Activity Bonds, Portsmouth Gateway Group, LLC - Borrower, Portsmouth Bypass Project, Series 2015, 5.000%,
12/31/39 - AGM Insured, (AMT) |
|
|
6/25 at 100.00 |
|
|
|
3,870,372 |
|
|
|
|
|
|
| |
1,940 |
|
|
|
|
Port of Greater Cincinnati Development Authority, Ohio, Public Improvement TOT Revenue
Bonds, Series 2021, 4.250%, 12/01/50, 144A |
|
|
12/28 at 100.00 |
|
|
|
1,420,326 |
|
|
|
|
|
|
|
Total Ohio |
|
|
|
|
|
|
72,235,969 |
|
|
|
|
|
|
|
|
|
|
|
|
Oklahoma - 1.4% |
|
|
|
|
|
|
|
|
|
|
|
|
|
| |
4,000 |
|
|
(c) |
|
Oklahoma City Water Utilities Trust, Oklahoma, Water and Sewer Revenue Bonds, Refunding Series 2016, 5.000%, 7/01/36, (Pre-refunded 7/01/26) |
|
|
7/26 at 100.00 |
|
|
|
4,120,361 |
|
34
|
|
|
|
|
|
|
|
|
|
|
|
|
|
|
|
Principal
Amount (000) |
|
|
|
|
Description (a) |
|
|
Optional Call
Provisions (b) |
|
|
|
Value |
|
|
|
|
|
|
|
|
|
|
|
|
Oklahoma (continued) |
|
|
|
|
|
|
|
|
|
|
|
|
|
|
Oklahoma Development Finance Authority, Health System Revenue Bonds, Integris Baptist Medical Center, Refunding Series
2015A: |
|
|
|
|
|
|
|
|
| $ |
1,590 |
|
|
|
|
5.000%, 8/15/27 |
|
|
8/25 at 100.00 |
|
|
$ |
1,590,077 |
|
| |
1,250 |
|
|
|
|
5.000%, 8/15/29 |
|
|
8/25 at 100.00 |
|
|
|
1,236,967 |
|
|
|
|
|
|
|
|
|
|
|
|
Oklahoma Development Finance Authority, Health System Revenue Bonds, OU Medicine Project, Series 2018B: |
|
|
|
|
|
|
|
|
| |
1,790 |
|
|
|
|
5.250%, 8/15/43 |
|
|
8/28 at 100.00 |
|
|
|
1,562,093 |
|
| |
7,040 |
|
|
|
|
5.500%, 8/15/57 |
|
|
8/28 at 100.00 |
|
|
|
6,020,583 |
|
|
|
|
|
|
| |
1,000 |
|
|
|
|
Oklahoma Development Finance Authority, Health System Revenue Bonds, OU Medicine Project, Taxable Series 2022, 5.500%,
8/15/37 |
|
|
8/32 at 100.00 |
|
|
|
906,240 |
|
|
|
|
|
|
| |
10,000 |
|
|
|
|
Oklahoma State Turnpike Authority, Turnpike System Revenue Bonds, Second Senior Series
2017A, 5.000%, 1/01/42 |
|
|
1/26 at 100.00 |
|
|
|
9,893,641 |
|
|
|
|
|
|
|
Total Oklahoma |
|
|
|
|
|
|
25,329,962 |
|
|
|
|
|
|
|
|
|
|
|
|
Oregon - 1.3% |
|
|
|
|
|
|
|
|
|
|
|
|
|
| |
2,500 |
|
|
|
|
Oregon Health and Science University, Revenue Bonds, Green Series 2021A, 4.000%, 7/01/44 |
|
|
1/32 at 100.00 |
|
|
|
2,140,124 |
|
|
|
|
|
|
| |
6,585 |
|
|
|
|
Oregon State Department of Transportation, Highway User Tax Revenue Bonds, Refunding Senior Lien Series 2017B, 5.000%,
11/15/28 |
|
|
5/27 at 100.00 |
|
|
|
6,885,214 |
|
|
|
|
|
|
| |
2,000 |
|
|
|
|
Oregon State, General Obligation Bonds, Article XI-Q State Projects Series 2021A, 4.000%,
5/01/40 |
|
|
5/31 at 100.00 |
|
|
|
1,798,170 |
|
|
|
|
|
|
| |
7,500 |
|
|
|
|
Portland, Oregon, Sewer System Revenue Bonds, Second Lien Refunding Series 2023A, 5.000%, 12/01/47 |
|
|
6/33 at 100.00 |
|
|
|
7,598,698 |
|
|
|
|
|
|
| |
5,330 |
|
|
|
|
University of Oregon, General Revenue Bonds, Series 2018A, 5.000%, 4/01/48 |
|
|
4/28 at 100.00 |
|
|
|
5,338,917 |
|
|
|
|
|
|
|
Total Oregon |
|
|
|
|
|
|
23,761,123 |
|
|
|
|
|
|
|
|
|
|
|
|
Pennsylvania - 2.1% |
|
|
|
|
|
|
|
|
|
|
|
|
|
| |
3,155 |
|
|
|
|
Geisinger Authority, Montour County, Pennsylvania, Health System Revenue Bonds, Geisinger Health System, Series 2017A-1, 5.000%, 2/15/45 |
|
|
2/27 at 100.00 |
|
|
|
3,043,537 |
|
|
|
|
|
|
| |
3,035 |
|
|
|
|
Montgomery County Higher Education and Health Authority, Pennsylvania, Revenue Bonds, Thomas Jefferson University, Series 2022B,
4.000%, 5/01/52 |
|
|
5/32 at 100.00 |
|
|
|
2,346,227 |
|
|
|
|
|
|
| |
2,000 |
|
|
|
|
Pennsylvania State University, Revenue Bonds, Refunding Series 2016A, 5.000%, 9/01/41 |
|
|
9/26 at 100.00 |
|
|
|
2,026,219 |
|
|
|
|
|
|
| |
20,000 |
|
|
|
|
Pennsylvania State University, Revenue Bonds, Series 2023, 5.250%, 9/01/53 |
|
|
9/33 at 100.00 |
|
|
|
20,663,448 |
|
|
|
|
|
|
| |
1,250 |
|
|
|
|
Pennsylvania Turnpike Commission, Motor License Fund-Enhanced Turnpike Special Revenue Bonds, Subordinate Series 2014A, 4.750%,
12/01/37 |
|
|
12/26 at 100.00 |
|
|
|
1,251,445 |
|
|
|
|
|
|
| |
3,000 |
|
|
|
|
Pennsylvania Turnpike Commission, Turnpike Revenue Bonds, Series 2018A-2, 5.000%,
12/01/48 |
|
|
12/28 at 100.00 |
|
|
|
2,973,762 |
|
|
|
|
|
|
| |
1,025 |
|
|
|
|
Pennsylvania Turnpike Commission, Turnpike Revenue Bonds, Subordinate Series 2019A, 4.000%, 12/01/49 |
|
|
12/29 at 100.00 |
|
|
|
834,060 |
|
|
|
|
|
|
| |
2,620 |
|
|
|
|
Pennsylvania Turnpike Commission, Turnpike Revenue Bonds, Subordinate Series 2021A, 4.000%, 12/01/50 |
|
|
12/30 at 100.00 |
|
|
|
2,127,571 |
|
|
|
|
|
|
| |
570 |
|
|
|
|
Pittsburgh Water and Sewer Authority, Pennsylvania, Water and Sewer System Revenue Bonds, Refunding Subordinate Series 2019B,
4.000%, 9/01/34 - AGM Insured |
|
|
9/29 at 100.00 |
|
|
|
534,644 |
|
|
|
|
|
|
| |
1,350 |
|
|
|
|
Susquehanna Area Regional Airport Authority, Pennsylvania, Airport System Revenue Bonds,
Series 2017, 5.000%, 1/01/38, (AMT) |
|
|
1/28 at 100.00 |
|
|
|
1,261,640 |
|
|
|
|
|
|
|
Total Pennsylvania |
|
|
|
|
|
|
37,062,553 |
|
35
|
|
|
| NUV |
|
Nuveen Municipal Value Fund, Inc. (continued) Portfolio of Investments October 31, 2023 |
|
|
|
|
|
|
|
|
|
|
|
|
|
|
|
|
Principal
Amount (000) |
|
|
|
|
Description (a) |
|
|
Optional Call
Provisions (b) |
|
|
|
Value |
|
|
|
|
|
|
|
|
|
|
|
|
Puerto Rico - 1.8% |
|
|
|
|
|
|
|
|
|
|
|
|
|
|
|
|
|
|
|
Puerto Rico Sales Tax Financing Corporation, Sales Tax Revenue Bonds, Restructured
2018A-1: |
|
|
|
|
|
|
|
|
| $ |
10,046 |
|
|
|
|
0.000%, 7/01/33 |
|
|
7/28 at 86.06 |
|
|
$ |
6,292,458 |
|
| |
5,985 |
|
|
|
|
4.500%, 7/01/34 |
|
|
7/25 at 100.00 |
|
|
|
5,715,764 |
|
| |
5,125 |
|
|
|
|
5.000%, 7/01/58 |
|
|
7/28 at 100.00 |
|
|
|
4,486,978 |
|
|
|
|
|
|
| |
5,320 |
|
|
|
|
Puerto Rico Sales Tax Financing Corporation, Sales Tax Revenue Bonds, Restructured Cofina Project Series 2019A-2A, 4.550%, 7/01/40 |
|
|
7/28 at 100.00 |
|
|
|
4,735,414 |
|
|
|
|
|
|
| |
12,119 |
|
|
|
|
Puerto Rico Sales Tax Financing Corporation, Sales Tax Revenue Bonds, Taxable
Restructured Cofina Project Series 2019A-2, 4.329%, 7/01/40 |
|
|
7/28 at 100.00 |
|
|
|
10,498,999 |
|
|
|
|
|
|
|
Total Puerto Rico |
|
|
|
|
|
|
31,729,613 |
|
|
|
|
|
|
|
|
|
|
|
|
South Carolina - 2.4% |
|
|
|
|
|
|
|
|
|
|
|
|
|
|
|
|
|
|
|
Patriots Energy Group, South Carolina, Gas System Revenue Bonds, Improvement and Refunding Series 2021A: |
|
|
|
|
|
|
|
|
| |
3,750 |
|
|
|
|
4.000%, 6/01/46 |
|
|
6/31 at 100.00 |
|
|
|
3,034,979 |
|
| |
1,500 |
|
|
|
|
4.000%, 6/01/51 |
|
|
6/31 at 100.00 |
|
|
|
1,174,667 |
|
|
|
|
|
|
|
|
|
|
|
|
Piedmont Municipal Power Agency, South Carolina, Electric Revenue Bonds, Series
2004A-2: |
|
|
|
|
|
|
|
|
| |
12,760 |
|
|
|
|
0.000%, 1/01/28 - AGC Insured |
|
|
No Opt. Call |
|
|
|
10,534,170 |
|
| |
9,535 |
|
|
|
|
0.000%, 1/01/29 - AGC Insured |
|
|
No Opt. Call |
|
|
|
7,507,633 |
|
|
|
|
|
|
| |
4,000 |
|
|
|
|
South Carolina Public Service Authority, Santee Cooper Revenue Obligations, Refunding & Improvement Series 2020A,
4.000%, 12/01/39 |
|
|
12/30 at 100.00 |
|
|
|
3,461,535 |
|
|
|
|
|
|
|
|
|
|
|
|
South Carolina Public Service Authority, Santee Cooper Revenue Obligations, Refunding Series 2016B: |
|
|
|
|
|
|
|
|
| |
5,500 |
|
|
|
|
5.000%, 12/01/46 |
|
|
12/26 at 100.00 |
|
|
|
5,245,353 |
|
| |
8,000 |
|
|
|
|
5.000%, 12/01/56 |
|
|
12/26 at 100.00 |
|
|
|
7,425,938 |
|
|
|
|
|
|
| |
1,500 |
|
|
|
|
South Carolina Public Service Authority, Santee Cooper Revenue Obligations, Refunding Series 2022A, 5.000%, 12/01/55 |
|
|
6/32 at 100.00 |
|
|
|
1,393,565 |
|
|
|
|
|
|
| |
3,455 |
|
|
|
|
South Carolina Public Service Authority, Santee Cooper Revenue Obligations, Series 2014A,
5.500%, 12/01/54 |
|
|
6/24 at 100.00 |
|
|
|
3,373,686 |
|
|
|
|
|
|
|
Total South Carolina |
|
|
|
|
|
|
43,151,526 |
|
|
|
|
|
|
|
|
|
|
|
|
South Dakota - 0.1% |
|
|
|
|
|
|
|
|
|
|
|
|
|
| |
2,630 |
|
|
|
|
Baltic School District No. 49-1, South
Dakota, General Obligation Bonds, Series 2022, 5.250%, 12/01/47 - AGM Insured |
|
|
12/31 at 100.00 |
|
|
|
2,671,699 |
|
|
|
|
|
|
|
Total South Dakota |
|
|
|
|
|
|
2,671,699 |
|
|
|
|
|
|
|
|
|
|
|
|
Tennessee - 1.5% |
|
|
|
|
|
|
|
|
|
|
|
|
|
|
|
|
|
|
|
Hallsdale-Powell Utility District, Knox County, Tennessee, Water and Sewer Revenue Bonds, Refunding & Improvement Series
2022A: |
|
|
|
|
|
|
|
|
| |
760 |
|
|
|
|
4.000%, 4/01/37 |
|
|
4/31 at 100.00 |
|
|
|
707,682 |
|
| |
1,305 |
|
|
|
|
4.000%, 4/01/40 |
|
|
4/31 at 100.00 |
|
|
|
1,182,160 |
|
|
|
|
|
|
|
|
|
|
|
|
Loudon, Tennessee, Water and Sewer Revenue Bonds, Series 2023: |
|
|
|
|
|
|
|
|
| |
1,000 |
|
|
|
|
5.000%, 3/01/40 |
|
|
3/33 at 100.00 |
|
|
|
1,019,881 |
|
| |
1,000 |
|
|
|
|
5.000%, 3/01/41 |
|
|
3/33 at 100.00 |
|
|
|
1,015,808 |
|
| |
1,495 |
|
|
|
|
5.000%, 3/01/42 |
|
|
3/33 at 100.00 |
|
|
|
1,511,295 |
|
| |
4,250 |
|
|
|
|
4.375%, 3/01/48 |
|
|
3/33 at 100.00 |
|
|
|
3,623,295 |
|
|
|
|
|
|
| |
1,450 |
|
|
|
|
Memphis, Tennessee, Sanitary Sewerage System Revenue Bonds, Refunding Series 2020B, 5.000%, 10/01/45 |
|
|
10/30 at 100.00 |
|
|
|
1,474,024 |
|
|
|
|
|
|
| |
2,260 |
|
|
|
|
Metropolitan Government of Nashville-Davidson County, Tennessee, Water and Sewerage Revenue Bonds, Green Series 2017A, 5.000%,
7/01/42 |
|
|
7/27 at 100.00 |
|
|
|
2,253,742 |
|
36
|
|
|
|
|
|
|
|
|
|
|
|
|
|
|
|
Principal
Amount (000) |
|
|
|
|
Description (a) |
|
|
Optional Call
Provisions (b) |
|
|
|
Value |
|
|
|
|
|
|
|
|
|
|
|
|
Tennessee (continued) |
|
|
|
|
|
|
|
|
| $ |
2,000 |
|
|
|
|
Metropolitan Nashville Airport Authority, Tennessee, Airport Improvement Revenue Bonds, Series 2022A, 5.250%, 7/01/47 |
|
|
7/32 at 100.00 |
|
|
$ |
2,016,988 |
|
|
|
|
|
|
| |
1,375 |
|
|
|
|
New Memphis Arena Public Building Authority, Memphis and Shelby County, Tennessee, Local Government Public Improvement Bonds,
Capital Appreciation Series 2021, 0.000%, 4/01/40 |
|
|
4/31 at 81.47 |
|
|
|
548,070 |
|
|
|
|
|
|
| |
3,000 |
|
|
|
|
Tennessee State School Bond Authority, Higher Educational Facilities Second Program Bonds, Series 2017A, 5.000%,
11/01/42 |
|
|
11/27 at 100.00 |
|
|
|
3,013,735 |
|
|
|
|
|
|
| |
5,000 |
|
|
|
|
Tennessee State, General Obligation Bonds, Series 2023A, 5.000%, 5/01/40 |
|
|
5/33 at 100.00 |
|
|
|
5,221,722 |
|
|
|
|
|
|
| |
3,240 |
|
|
|
|
West Wilson Utility District, Wilson County, Tennessee, Water Revenue Bonds, Improvement
Series 2022, 4.000%, 6/01/52 |
|
|
6/32 at 100.00 |
|
|
|
2,723,491 |
|
|
|
|
|
|
|
Total Tennessee |
|
|
|
|
|
|
26,311,893 |
|
|
|
|
|
|
|
|
|
|
|
|
Texas - 13.0% |
|
|
|
|
|
|
|
|
|
|
|
|
|
| |
240 |
|
|
|
|
Baytown Municipal Development District, Texas, Hotel Revenue Bonds, Baytown Convention Center Hotel, First-Lien Series 2021A,
4.000%, 10/01/50 |
|
|
10/31 at 100.00 |
|
|
|
170,943 |
|
|
|
|
|
|
| |
14,355 |
|
|
(e) |
|
Bexar County Hospital District, Texas, Certificates of Obligation, Series 2018, 4.000%, 2/15/43, (UB) |
|
|
2/27 at 100.00 |
|
|
|
12,372,986 |
|
|
|
|
|
|
| |
4,750 |
|
|
|
|
Bexar County Hospital District, Texas, Certificates of Obligation, Series 2023, 5.000%, 2/15/48 |
|
|
8/32 at 100.00 |
|
|
|
4,785,493 |
|
|
|
|
|
|
| |
710 |
|
|
|
|
Central Texas Regional Mobility Authority, Revenue Bonds, Senior Lien Series 2020A, 5.000%, 1/01/39 |
|
|
1/30 at 100.00 |
|
|
|
716,041 |
|
|
|
|
|
|
| |
240 |
|
|
|
|
Decatur Hospital Authority, Texas, Revenue Bonds, Wise Regional Health System, Series 2014A, 5.250%, 9/01/44 |
|
|
9/24 at 100.00 |
|
|
|
221,144 |
|
|
|
|
|
|
| |
5,000 |
|
|
|
|
El Paso County Hospital District, Texas, General Obligtion Bonds, Certificates of Obligation Series 2013, 5.000%,
8/15/39 |
|
|
12/23 at 100.00 |
|
|
|
4,504,587 |
|
|
|
|
|
|
|
|
|
|
|
|
Fort Bend County Municipal Utility District 50, Texas, General Obligation Bonds, Series 2018A: |
|
|
|
|
|
|
|
|
| |
2,600 |
|
|
|
|
4.000%, 9/01/46 - AGM Insured |
|
|
12/23 at 100.00 |
|
|
|
2,068,642 |
|
| |
5,500 |
|
|
|
|
4.000%, 9/01/48 - AGM Insured |
|
|
12/23 at 100.00 |
|
|
|
4,296,252 |
|
|
|
|
|
|
| |
2,845 |
|
|
|
|
Harris County Cultural Education Facilities Finance Corporation, Texas, Revenue Bonds, Houston Methodist Hospital System, Series
2015, 4.000%, 12/01/45 |
|
|
6/25 at 100.00 |
|
|
|
2,304,640 |
|
|
|
|
|
|
| |
7,295 |
|
|
|
|
Harris County-Houston Sports Authority, Texas, Revenue Bonds, Capital Appreciation Refunding Senior Lien Series 2014A, 0.000%,
11/15/50 - AGM Insured |
|
|
11/31 at 39.79 |
|
|
|
1,435,475 |
|
|
|
|
|
|
|
|
|
|
|
|
Harris County-Houston Sports Authority, Texas, Revenue Bonds, Junior Lien Series 2001H: |
|
|
|
|
|
|
|
|
| |
11,055 |
|
|
|
|
0.000%, 11/15/27 |
|
|
No Opt. Call |
|
|
|
9,046,029 |
|
| |
845 |
|
|
(c) |
|
0.000%, 11/15/27, (ETM) |
|
|
No Opt. Call |
|
|
|
708,235 |
|
|
|
|
|
|
|
|
|
|
|
|
Harris County-Houston Sports Authority, Texas, Revenue Bonds, Refunding Second Lien Series 2014C: |
|
|
|
|
|
|
|
|
| |
425 |
|
|
|
|
5.000%, 11/15/23 |
|
|
No Opt. Call |
|
|
|
425,034 |
|
| |
1,565 |
|
|
|
|
5.000%, 11/15/31 |
|
|
11/24 at 100.00 |
|
|
|
1,566,251 |
|
|
|
|
|
|
| |
14,905 |
|
|
|
|
Harris County-Houston Sports Authority, Texas, Revenue Bonds, Third Lien Series 2004A-3,
0.000%, 11/15/33 - NPFG Insured |
|
|
11/24 at 59.10 |
|
|
|
8,232,872 |
|
|
|
|
|
|
| |
1,000 |
|
|
|
|
Hidalgo County Regional Mobility Authority, Texas, Toll and Vehicle Registration Fee Revenue Bonds, Senior Lien Series 2022A,
4.000%, 12/01/40 |
|
|
12/31 at 100.00 |
|
|
|
832,002 |
|
37
|
|
|
| NUV |
|
Nuveen Municipal Value Fund, Inc. (continued) Portfolio of Investments October 31, 2023 |
|
|
|
|
|
|
|
|
|
|
|
|
|
|
|
|
Principal
Amount (000) |
|
|
|
|
Description (a) |
|
|
Optional Call
Provisions (b) |
|
|
|
Value |
|
|
|
|
|
|
|
|
|
|
|
|
Texas (continued) |
|
|
|
|
|
|
|
|
|
|
|
|
|
|
|
|
|
|
|
Houston, Texas, Airport System Revenue Bonds, Refunding & Subordinate Lien Series 2018B: |
|
|
|
|
|
|
|
|
| $ |
1,590 |
|
|
|
|
5.000%, 7/01/43 |
|
|
7/28 at 100.00 |
|
|
$ |
1,581,606 |
|
| |
2,290 |
|
|
|
|
5.000%, 7/01/48 |
|
|
7/28 at 100.00 |
|
|
|
2,226,598 |
|
|
|
|
|
|
|
|
|
|
|
|
Houston, Texas, Hotel Occupancy Tax and Special Revenue Bonds, Convention and Entertainment Project, Series 2001B: |
|
|
|
|
|
|
|
|
| |
24,755 |
|
|
|
|
0.000%, 9/01/29 - AMBAC Insured |
|
|
No Opt. Call |
|
|
|
18,977,178 |
|
| |
12,940 |
|
|
|
|
0.000%, 9/01/30 - AMBAC Insured |
|
|
No Opt. Call |
|
|
|
9,440,851 |
|
| |
10,000 |
|
|
|
|
0.000%, 9/01/31 - AMBAC Insured |
|
|
No Opt. Call |
|
|
|
6,936,354 |
|
| |
19,500 |
|
|
|
|
0.000%, 9/01/32 - AMBAC Insured |
|
|
No Opt. Call |
|
|
|
12,849,726 |
|
|
|
|
|
|
| |
5,120 |
|
|
|
|
Leander Independent School District, Williamson and Travis Counties, Texas, General Obligation Bonds, Refunding Series 2015A,
5.000%, 8/15/39 |
|
|
8/25 at 100.00 |
|
|
|
5,151,147 |
|
|
|
|
|
|
| |
4,510 |
|
|
|
|
Leander Independent School District, Williamson and Travis Counties, Texas, General Obligation Bonds, Refunding Series 2016A,
5.000%, 8/15/49 |
|
|
8/26 at 100.00 |
|
|
|
4,537,931 |
|
|
|
|
|
|
| |
1,705 |
|
|
|
|
Love Field Airport Modernization Corporation, Texas, Special Facilities Revenue Bonds, Southwest Airlines Company - Love Field
Modernization Program Project, Series 2012, 5.000%, 11/01/28, (AMT) |
|
|
12/23 at 100.00 |
|
|
|
1,685,737 |
|
|
|
|
|
|
| |
3,570 |
|
|
|
|
Lower Colorado River Authority, Texas, Transmission Contract Revenue Bonds, LCRA Transmission Services Corporation Project,
Refunding Series 2021A, 5.000%, 5/15/51 |
|
|
5/31 at 100.00 |
|
|
|
3,409,853 |
|
|
|
|
|
|
|
|
|
|
|
|
Lubbock, Texas, Electric Light and Power System Revenue Bonds, Series 2018: |
|
|
|
|
|
|
|
|
| |
2,170 |
|
|
|
|
5.000%, 4/15/40 |
|
|
4/28 at 100.00 |
|
|
|
2,129,934 |
|
| |
3,930 |
|
|
|
|
5.000%, 4/15/43 |
|
|
4/28 at 100.00 |
|
|
|
3,782,896 |
|
|
|
|
|
|
|
|
|
|
|
|
North Texas Tollway Authority, System Revenue Bonds, Refunding First Tier Capital Appreciation Series 2008I: |
|
|
|
|
|
|
|
|
| |
30,000 |
|
|
(c) |
|
6.200%, 1/01/42, (Pre-refunded 1/01/25) - AGC Insured |
|
|
1/25 at 100.00 |
|
|
|
30,758,016 |
|
| |
5,220 |
|
|
(c) |
|
6.500%, 1/01/43, (Pre-refunded 1/01/25) |
|
|
1/25 at 100.00 |
|
|
|
5,366,517 |
|
|
|
|
|
|
| |
15,450 |
|
|
|
|
North Texas Tollway Authority, System Revenue Bonds, Refunding First Tier, Series 2008D, 0.000%, 1/01/36 - AGC Insured |
|
|
No Opt. Call |
|
|
|
8,637,676 |
|
|
|
|
|
|
| |
5,000 |
|
|
|
|
North Texas Tollway Authority, System Revenue Bonds, Refunding First Tier, Series 2017A, 4.000%, 1/01/43 |
|
|
1/28 at 100.00 |
|
|
|
4,196,241 |
|
|
|
|
|
|
| |
8,000 |
|
|
|
|
North Texas Tollway Authority, System Revenue Bonds, Refunding Second Tier Series 2017B, 5.000%, 1/01/43 |
|
|
1/27 at 100.00 |
|
|
|
8,004,671 |
|
|
|
|
|
|
| |
9,100 |
|
|
|
|
North Texas Tollway Authority, System Revenue Bonds, Refunding Second Tier, Series 2015A, 5.000%, 1/01/32 |
|
|
1/25 at 100.00 |
|
|
|
9,128,811 |
|
|
|
|
|
|
| |
1,750 |
|
|
|
|
Tarrant County Cultural Education Facilities Finance Corporation, Texas, Revenue Bonds, Texas Health Resources System, Series
2016A, 5.000%, 2/15/41 |
|
|
8/26 at 100.00 |
|
|
|
1,732,073 |
|
|
|
|
|
|
| |
5,000 |
|
|
|
|
Temple, Texas, General Obligation Bonds, Combination Tax and Revenue Series 2022B, 4.000%, 8/01/47 |
|
|
8/31 at 100.00 |
|
|
|
4,133,296 |
|
|
|
|
|
|
| |
3,990 |
|
|
|
|
Texas Municipal Gas Acquisition and Supply Corporation I, Gas Supply Revenue Bonds, Senior Lien Series 2008D, 6.250%,
12/15/26 |
|
|
No Opt. Call |
|
|
|
4,067,548 |
|
|
|
|
|
|
| |
5,400 |
|
|
|
|
Texas Private Activity Bond Surface Transporation Corporation, Revenue Bonds, NTE Mobility Partners LLC North Tarrant Express
Managed Lanes Project, Refunding Senior Lien Series 2019A, 5.000%, 12/31/35 |
|
|
12/29 at 100.00 |
|
|
|
5,480,304 |
|
|
|
|
|
|
| |
3,000 |
|
|
|
|
Texas Transportation Commission, Central Texas Turnpike System Revenue Bonds, Refunding First Tier Series 2015B, 5.000%,
8/15/37 |
|
|
8/24 at 100.00 |
|
|
|
2,979,319 |
|
|
|
|
|
|
| |
1,750 |
|
|
|
|
Texas Transportation Commission, Central Texas Turnpike System Revenue Bonds, Refunding Second Tier Series 2015C, 5.000%,
8/15/33 |
|
|
8/24 at 100.00 |
|
|
|
1,719,553 |
|
38
|
|
|
|
|
|
|
|
|
|
|
|
|
|
|
|
Principal
Amount (000) |
|
|
|
|
Description (a) |
|
|
Optional Call
Provisions (b) |
|
|
|
Value |
|
|
|
|
|
|
|
|
|
|
|
|
Texas (continued) |
|
|
|
|
|
|
|
|
| $ |
5,500 |
|
|
|
|
Texas Turnpike Authority, Central Texas Turnpike System Revenue Bonds, First Tier Series 2002A, 0.000%, 8/15/25 - AMBAC
Insured |
|
|
No Opt. Call |
|
|
$ |
5,094,062 |
|
|
|
|
|
|
|
|
|
|
|
|
Texas Water Development Board, State Water Implementation Revenue Fund Bonds, Master Trust Series 2017A: |
|
|
|
|
|
|
|
|
| |
12,500 |
|
|
(e) |
|
4.000%, 10/15/42, (UB) |
|
|
10/27 at 100.00 |
|
|
|
10,993,433 |
|
| |
1,500 |
|
|
|
|
5.000%, 10/15/42 |
|
|
10/27 at 100.00 |
|
|
|
1,512,807 |
|
|
|
|
|
|
| |
5,000 |
|
|
|
|
Texas Water Development Board, State Water Implementation Revenue Fund Bonds, Master
Trust Series 2018B, 5.000%, 10/15/38 |
|
|
10/28 at 100.00 |
|
|
|
5,097,591 |
|
|
|
|
|
|
|
Total Texas |
|
|
|
|
|
|
235,298,355 |
|
|
|
|
|
|
|
|
|
|
|
|
Utah - 1.4% |
|
|
|
|
|
|
|
|
|
|
|
|
|
| |
5,345 |
|
|
|
|
Salt Lake City, Utah, Airport Revenue Bonds, International Airport Series 2017B, 5.000%, 7/01/42 |
|
|
7/27 at 100.00 |
|
|
|
5,279,207 |
|
|
|
|
|
|
| |
3,500 |
|
|
|
|
Salt Lake City, Utah, Airport Revenue Bonds, International Airport Series 2018B, 5.000%, 7/01/43 |
|
|
7/28 at 100.00 |
|
|
|
3,455,734 |
|
|
|
|
|
|
| |
9,550 |
|
|
|
|
Salt Lake City, Utah, Airport Revenue Bonds, International Airport Series 2023A, 5.250%, 7/01/48, (AMT) |
|
|
7/33 at 100.00 |
|
|
|
9,380,832 |
|
|
|
|
|
|
|
|
|
|
|
|
Salt Lake County, Utah, Sales Tax Revenue Bonds, TRCC Series 2017: |
|
|
|
|
|
|
|
|
| |
695 |
|
|
|
|
5.000%, 2/01/36 |
|
|
2/27 at 100.00 |
|
|
|
713,162 |
|
| |
1,150 |
|
|
|
|
5.000%, 2/01/37 |
|
|
2/27 at 100.00 |
|
|
|
1,175,489 |
|
|
|
|
|
|
|
|
|
|
|
|
Utah Associated Municipal Power Systems, Revenue Bonds, Horse Butte Wind Project, Refunding Series 2017A: |
|
|
|
|
|
|
|
|
| |
1,250 |
|
|
|
|
5.000%, 9/01/29 |
|
|
3/28 at 100.00 |
|
|
|
1,299,468 |
|
| |
1,000 |
|
|
|
|
5.000%, 9/01/30 |
|
|
3/28 at 100.00 |
|
|
|
1,037,557 |
|
| |
1,250 |
|
|
|
|
5.000%, 9/01/31 |
|
|
3/28 at 100.00 |
|
|
|
1,293,572 |
|
| |
660 |
|
|
|
|
5.000%, 9/01/32 |
|
|
3/28 at 100.00 |
|
|
|
681,826 |
|
|
|
|
|
|
| |
540 |
|
|
|
|
Utah Water Finance Agency, Revenue Bonds, Pooled Loan Financing Program, Series 2017A,
5.000%, 3/01/37 |
|
|
3/27 at 100.00 |
|
|
|
549,419 |
|
|
|
|
|
|
|
Total Utah |
|
|
|
|
|
|
24,866,266 |
|
|
|
|
|
|
|
|
|
|
|
|
Virginia - 0.5% |
|
|
|
|
|
|
|
|
|
|
|
|
|
| |
1,805 |
|
|
|
|
Chesapeake Bay Bridge and Tunnel District, Virginia, General Resolution Revenue Bonds, First Tier Series 2016, 5.000%,
7/01/51 |
|
|
7/26 at 100.00 |
|
|
|
1,677,834 |
|
|
|
|
|
|
| |
4,355 |
|
|
|
|
Tobacco Settlement Financing Corporation of Virginia, Tobacco Settlement Asset Backed Bonds, Series 2007B1, 5.000%,
6/01/47 |
|
|
11/23 at 100.00 |
|
|
|
3,735,581 |
|
|
|
|
|
|
| |
4,100 |
|
|
|
|
Virginia Small Business Financing Authority, Private Activity Revenue Bonds, Transform 66
P3 Project, Senior Lien Series 2017, 5.000%, 12/31/49, (AMT) |
|
|
6/27 at 100.00 |
|
|
|
3,838,603 |
|
|
|
|
|
|
|
Total Virginia |
|
|
|
|
|
|
9,252,018 |
|
|
|
|
|
|
|
|
|
|
|
|
Washington - 4.0% |
|
|
|
|
|
|
|
|
|
|
|
|
|
| |
8,825 |
|
|
|
|
Central Puget Sound Regional Transit Authority, Washington, Sales Tax and Motor Vehicle Excise Tax Bonds, Refunding &
Improvement, Green Series 2021S-1, 4.000%, 11/01/46 |
|
|
11/31 at 100.00 |
|
|
|
7,473,395 |
|
|
|
|
|
|
| |
2,235 |
|
|
|
|
Pierce County School District 10, Tacoma, Washington, General Obligation Bonds, Series 2020B, 4.000%, 12/01/43 |
|
|
12/30 at 100.00 |
|
|
|
1,942,115 |
|
|
|
|
|
|
|
|
|
|
|
|
Port of Seattle, Washington, Revenue Bonds, Refunding Intermediate Lien Series 2016: |
|
|
|
|
|
|
|
|
| |
1,930 |
|
|
|
|
5.000%, 2/01/29 |
|
|
2/26 at 100.00 |
|
|
|
1,966,634 |
|
| |
1,000 |
|
|
|
|
5.000%, 2/01/30 |
|
|
2/26 at 100.00 |
|
|
|
1,016,616 |
|
|
|
|
|
|
|
|
|
|
|
|
Spokane Public Facilities District, Washington, Hotel, Motel, and Sales Use Tax Revenue Bonds, Series 2017: |
|
|
|
|
|
|
|
|
| |
1,175 |
|
|
|
|
5.000%, 12/01/38 |
|
|
6/27 at 100.00 |
|
|
|
1,150,121 |
|
39
|
|
|
| NUV |
|
Nuveen Municipal Value Fund, Inc. (continued) Portfolio of Investments October 31, 2023 |
|
|
|
|
|
|
|
|
|
|
|
|
|
|
|
|
Principal
Amount (000) |
|
|
|
|
Description (a) |
|
|
Optional Call
Provisions (b) |
|
|
|
Value |
|
|
|
|
|
|
|
|
|
|
|
|
Washington (continued) |
|
|
|
|
|
|
|
|
| $ |
5,000 |
|
|
|
|
5.000%, 12/01/41 |
|
|
6/27 at 100.00 |
|
|
$ |
4,962,944 |
|
|
|
|
|
|
| |
1,390 |
|
|
|
|
Washington Health Care Facilities Authority, Revenue Bonds, CommonSpirit Health, Series
2019A-1, 4.000%, 8/01/44 |
|
|
8/29 at 100.00 |
|
|
|
1,120,404 |
|
|
|
|
|
|
| |
12,000 |
|
|
|
|
Washington Health Care Facilities Authority, Revenue Bonds, Providence Health & Services, Refunding Series 2012A,
5.000%, 10/01/33 |
|
|
12/23 at 100.00 |
|
|
|
12,000,745 |
|
|
|
|
|
|
| |
1,310 |
|
|
|
|
Washington Health Care Facilities Authority, Revenue Bonds, Virginia Mason Medical Center, Series 2017, 5.000%, 8/15/30 |
|
|
8/27 at 100.00 |
|
|
|
1,321,172 |
|
|
|
|
|
|
| |
6,030 |
|
|
|
|
Washington State Convention Center Public Facilities District, Lodging Tax Revenue Bonds, Refunding Series2021B. Exchange
Purchase, 4.000%, 7/01/37 |
|
|
7/31 at 100.00 |
|
|
|
5,369,469 |
|
|
|
|
|
|
|
|
|
|
|
|
Washington State Convention Center Public Facilities District, Lodging Tax Revenue Bonds, Refunding Subordinate Series
2021B. Exchange Purchase: |
|
|
|
|
|
|
|
|
| |
4,615 |
|
|
|
|
4.000%, 7/01/43 |
|
|
7/31 at 100.00 |
|
|
|
3,822,156 |
|
| |
7,830 |
|
|
|
|
3.000%, 7/01/48 |
|
|
7/31 at 100.00 |
|
|
|
4,920,305 |
|
|
|
|
|
|
|
|
|
|
|
|
Washington State Convention Center Public Facilities District, Lodging Tax Revenue Bonds, Series 2018: |
|
|
|
|
|
|
|
|
| |
3,240 |
|
|
|
|
4.000%, 7/01/58 |
|
|
7/28 at 100.00 |
|
|
|
2,442,044 |
|
| |
3,000 |
|
|
|
|
5.000%, 7/01/58 |
|
|
7/28 at 100.00 |
|
|
|
2,776,721 |
|
|
|
|
|
|
|
|
|
|
|
|
Washington State, Motor Vehicle Fuel Tax General Obligation Bonds, Series
2002-03C: |
|
|
|
|
|
|
|
|
| |
9,100 |
|
|
|
|
0.000%, 6/01/29 - NPFG Insured |
|
|
No Opt. Call |
|
|
|
7,321,760 |
|
| |
16,195 |
|
|
|
|
0.000%, 6/01/30 - NPFG Insured |
|
|
No Opt. Call |
|
|
|
12,480,881 |
|
|
|
|
|
|
|
Total Washington |
|
|
|
|
|
|
72,087,482 |
|
|
|
|
|
|
|
|
|
|
|
|
West Virginia - 0.7% |
|
|
|
|
|
|
|
|
|
|
|
|
|
| |
1,830 |
|
|
|
|
West Virginia Hospital Finance Authority, Hospital Revenue Bonds, Cabell Huntington Hospital, Inc. Project, Refunding &
Improvement Series 2018A, 5.000%, 1/01/34 |
|
|
1/29 at 100.00 |
|
|
|
1,817,186 |
|
|
|
|
|
|
| |
2,750 |
|
|
|
|
West Virginia Hospital Finance Authority, Hospital Revenue Bonds, Charleston Area Medical Center, Refunding &
Improvement Series 2019A, 5.000%, 9/01/38 |
|
|
9/29 at 100.00 |
|
|
|
2,590,859 |
|
|
|
|
|
|
| |
3,570 |
|
|
|
|
West Virginia Parkways Authority, Turnpike Toll Revenue Bonds, Senior Lien Series 2018, 5.000%, 6/01/43 |
|
|
6/28 at 100.00 |
|
|
|
3,596,869 |
|
|
|
|
|
|
| |
4,135 |
|
|
|
|
West Virginia Parkways Authority, Turnpike Toll Revenue Bonds, Senior Lien Series 2021,
5.000%, 6/01/47 |
|
|
6/31 at 100.00 |
|
|
|
4,182,683 |
|
|
|
|
|
|
|
Total West Virginia |
|
|
|
|
|
|
12,187,597 |
|
|
|
|
|
|
|
|
|
|
|
|
Wisconsin - 0.7% |
|
|
|
|
|
|
|
|
|
|
|
|
|
| |
5,000 |
|
|
|
|
Public Finance Authority Wisconsin, Tax Exempt Pooled Securities, Class A Social Impact Certificates, Series 2023-1, 4.000%, 8/01/59, (Mandatory Put 7/01/26) |
|
|
No Opt. Call |
|
|
|
4,850,862 |
|
|
|
|
|
|
| |
4,410 |
|
|
|
|
Wisconsin Health and Educational Facilities Authority, Revenue Bonds, Mercy Alliance, Inc., Series 2012, 5.000%, 6/01/39 |
|
|
12/23 at 100.00 |
|
|
|
4,198,879 |
|
|
|
|
|
|
|
|
|
|
|
|
Wisconsin Health and Educational Facilities Authority, Wisconsin, Revenue Bonds, Ascension Health Alliance Senior Credit Group,
Series 2016A: |
|
|
|
|
|
|
|
|
| |
2,870 |
|
|
|
|
4.000%, 11/15/46 |
|
|
5/26 at 100.00 |
|
|
|
2,406,393 |
|
40
|
|
|
|
|
|
|
|
|
|
|
|
|
|
|
|
Principal
Amount (000) |
|
|
|
|
Description (a) |
|
|
Optional Call
Provisions (b) |
|
|
|
Value |
|
|
|
|
|
|
|
|
|
|
|
|
Wisconsin (continued) |
|
|
|
|
|
|
|
|
| $ |
935 |
|
|
(c) |
|
4.000%, 11/15/46, (Pre-refunded 5/15/26) |
|
|
5/26 at 100.00 |
|
|
$ |
933,573 |
|
|
|
|
|
|
|
Total Wisconsin |
|
|
|
|
|
|
12,389,707 |
|
|
|
|
|
|
|
Total Municipal Bonds
(cost $1,882,403,978) |
|
|
|
|
|
|
1,795,221,291 |
|
|
|
|
|
|
|
Total Long-Term Investments
(cost $1,882,403,978) |
|
|
|
|
|
|
1,795,221,291 |
|
|
|
|
|
|
|
Floating Rate Obligations - (1.2)% |
|
|
|
|
|
|
(21,480,000 |
) |
|
|
|
|
|
|
Other Assets & Liabilities, Net - 1.7% |
|
|
|
|
|
|
30,712,131 |
|
|
|
|
|
|
|
Net Assets Applicable to Common Shares - 100% |
|
|
|
|
|
$ |
1,804,453,422 |
|
| (a) |
All percentages shown in the Portfolio of Investments are based on net assets applicable to common shares unless otherwise
noted. |
| (b) |
Optional Call Provisions: Dates (month and year) and prices of the earliest optional call or redemption. There may be
other call provisions at varying prices at later dates. Certain mortgage-backed securities may be subject to periodic principal paydowns. Optional Call Provisions are not covered by the report of independent registered public accounting firm.
|
| (c) |
Backed by an escrow or trust containing sufficient U.S. Government or U.S. Government agency securities, which ensure the
timely payment of principal and interest. |
| (d) |
Step-up coupon bond, a bond with a coupon that increases (“steps up”), usually at regular intervals, while the
bond is outstanding. The rate shown is the coupon as of the end of the reporting period. |
| (e) |
Investment, or portion of investment, has been pledged to collateralize the net payment obligations for investments in
inverse floating rate transactions. |
| 144A |
Investment is exempt from registration under Rule 144A of the Securities Act of 1933, as amended. These investments may
only be resold in transactions exempt from registration, which are normally those transactions with qualified institutional buyers. |
| AMT |
Alternative Minimum Tax |
| UB |
Underlying bond of an inverse floating rate trust reflected as a financing transaction. |
See Notes to Financial Statements
41
|
|
|
| NUW |
|
Nuveen AMT-Free Municipal Value Fund
Portfolio of Investments October 31,
2023 |
|
|
|
|
|
|
|
|
|
|
|
|
|
|
|
|
Principal
Amount (000) |
|
|
|
|
Description (a) |
|
|
Optional Call
Provisions (b) |
|
|
|
Value |
|
|
|
|
|
|
|
LONG-TERM INVESTMENTS - 99.0% |
|
|
|
|
|
|
|
|
|
|
|
|
|
|
MUNICIPAL BONDS - 98.5% |
|
|
|
|
|
|
|
|
|
|
|
|
|
|
|
|
|
|
|
Alaska - 0.3% |
|
|
|
|
|
|
|
|
|
|
|
|
|
| $ |
800 |
|
|
|
|
Northern Tobacco Securitization Corporation, Alaska, Tobacco Settlement Asset-Backed
Bonds, Senior Series 2021A Class 1, 5.000%, 6/01/31 |
|
|
No Opt. Call |
|
|
$ |
837,169 |
|
|
|
|
|
|
|
Total Alaska |
|
|
|
|
|
|
837,169 |
|
|
|
|
|
|
|
|
|
|
|
|
Arizona - 1.3% |
|
|
|
|
|
|
|
|
|
|
|
|
|
| |
345 |
|
|
|
|
Phoenix Civic Improvement Corporation, Arizona, Excise Tax Revenue Bonds, Subordinate Lien Series 2020A, 4.000%, 7/01/45 |
|
|
7/30 at 100.00 |
|
|
|
296,029 |
|
|
|
|
|
|
| |
3,045 |
|
|
|
|
Salt Verde Financial Corporation, Arizona, Senior Gas Revenue Bonds, Citigroup Energy Inc
Prepay Contract Obligations, Series 2007, 5.000%, 12/01/37 |
|
|
No Opt. Call |
|
|
|
2,955,888 |
|
|
|
|
|
|
|
Total Arizona |
|
|
|
|
|
|
3,251,917 |
|
|
|
|
|
|
|
|
|
|
|
|
California - 11.3% |
|
|
|
|
|
|
|
|
|
|
|
|
|
| |
1,730 |
|
|
|
|
Anaheim Public Financing Authority, California, Lease Revenue Bonds, Public Improvement Project, Series 1997C, 0.000%, 9/01/30 -
AGM Insured |
|
|
No Opt. Call |
|
|
|
1,277,102 |
|
|
|
|
|
|
| |
45 |
|
|
|
|
California County Tobacco Securitization Agency, Tobacco Settlement Asset-Backed Bonds, Los Angeles County Securitization
Corporation, Series 2020A, 4.000%, 6/01/49 |
|
|
6/30 at 100.00 |
|
|
|
36,639 |
|
|
|
|
|
|
| |
340 |
|
|
|
|
California Pollution Control Financing Authority, Water Furnishing Revenue Bonds, San Diego County Water Authoriity Desalination
Project Pipeline, Refunding Series 2019, 5.000%, 7/01/39, 144A |
|
|
1/29 at 100.00 |
|
|
|
335,617 |
|
|
|
|
|
|
|
|
|
|
|
|
Los Angeles Department of Airports, California, Revenue Bonds, Los Angeles International Airport, Private Activity/Non AMT
Refunding Subordinate Series 2019C: |
|
|
|
|
|
|
|
|
| |
1,280 |
|
|
(c) |
|
5.000%, 5/15/30, (Pre-refunded 5/15/29) |
|
|
5/29 at 100.00 |
|
|
|
1,378,384 |
|
| |
760 |
|
|
|
|
5.000%, 5/15/30 |
|
|
5/29 at 100.00 |
|
|
|
816,203 |
|
|
|
|
|
|
| |
450 |
|
|
|
|
M-S-R Energy Authority, California, Gas Revenue Bonds, Citigroup Prepay Contracts, Series 2009A, 6.500%, 11/01/39 |
|
|
No Opt. Call |
|
|
|
506,850 |
|
|
|
|
|
|
| |
10,200 |
|
|
|
|
Palomar Pomerado Health, California, General Obligation Bonds, Series 2009A, 7.000%, 8/01/38 - AGC Insured |
|
|
8/29 at 100.00 |
|
|
|
11,277,824 |
|
|
|
|
|
|
| |
1,030 |
|
|
|
|
Poway Unified School District, San Diego County, California, General Obligation Bonds, School Facilities Improvement District
2007-1, Series 2011A, 0.000%, 8/01/35 |
|
|
No Opt. Call |
|
|
|
610,569 |
|
|
|
|
|
|
| |
2,470 |
|
|
|
|
San Francisco Airports Commission, California, Revenue Bonds, San Francisco International Airport, Governmental Purpose Second
Series 2017B, 5.000%, 5/01/47 |
|
|
5/27 at 100.00 |
|
|
|
2,470,286 |
|
|
|
|
|
|
| |
12,955 |
|
|
|
|
San Ysidro School District, San Diego County, California, General Obligation Bonds, 1997 Election Series 2012G, 0.000%, 8/01/35 -
AGM Insured |
|
|
No Opt. Call |
|
|
|
7,530,609 |
|
|
|
|
|
|
| |
5,185 |
|
|
|
|
San Ysidro School District, San Diego County, California, General Obligation Bonds, Refunding Series 2015, 0.000%,
8/01/44 |
|
|
8/25 at 36.88 |
|
|
|
1,712,417 |
|
|
|
|
|
|
| |
115 |
|
|
|
|
Vernon, California, Electric System Revenue Bonds, Series 2021A, 5.000%, 4/01/28 |
|
|
No Opt. Call |
|
|
|
115,272 |
|
|
|
|
|
|
| |
700 |
|
|
|
|
Victor Elementary School District, San Bernardino County, California, General Obligation
Bonds, Series 2002A, 0.000%, 8/01/24 - FGIC Insured |
|
|
No Opt. Call |
|
|
|
677,941 |
|
|
|
|
|
|
|
Total California |
|
|
|
|
|
|
28,745,713 |
|
42
|
|
|
|
|
|
|
|
|
|
|
|
|
|
|
|
Principal
Amount (000) |
|
|
|
|
Description (a) |
|
|
Optional Call
Provisions (b) |
|
|
|
Value |
|
|
|
|
|
|
|
|
|
|
|
|
Colorado - 4.0% |
|
|
|
|
|
|
|
|
|
|
|
|
|
|
|
|
|
|
|
Denver Convention Center Hotel Authority, Colorado, Revenue Bonds, Convention Center Hotel, Refunding Senior Lien Series
2016: |
|
|
|
|
|
|
|
|
| $ |
1,000 |
|
|
|
|
5.000%, 12/01/30 |
|
|
12/26 at 100.00 |
|
|
$ |
995,788 |
|
| |
1,500 |
|
|
|
|
5.000%, 12/01/36 |
|
|
12/26 at 100.00 |
|
|
|
1,423,611 |
|
|
|
|
|
|
|
|
|
|
|
|
Denver Health and Hospitals Authority, Colorado, Healthcare Revenue Bonds, Series 2019A: |
|
|
|
|
|
|
|
|
| |
1,750 |
|
|
|
|
4.000%, 12/01/38 |
|
|
12/29 at 100.00 |
|
|
|
1,448,830 |
|
| |
2,000 |
|
|
|
|
4.000%, 12/01/39 |
|
|
12/29 at 100.00 |
|
|
|
1,630,836 |
|
|
|
|
|
|
| |
5,885 |
|
|
|
|
E-470 Public Highway Authority, Colorado, Toll Revenue Bonds, Series 2004A, 0.000%, 9/01/34 - NPFG Insured |
|
|
No Opt. Call |
|
|
|
3,592,948 |
|
|
|
|
|
|
| |
1,000 |
|
|
|
|
Public Authority for Colorado Energy, Natural Gas Purchase Revenue Bonds, Colorado
Springs Utilities, Series 2008, 6.500%, 11/15/38 |
|
|
No Opt. Call |
|
|
|
1,105,931 |
|
|
|
|
|
|
|
Total Colorado |
|
|
|
|
|
|
10,197,944 |
|
|
|
|
|
|
|
|
|
|
|
|
Delaware - 0.2% |
|
|
|
|
|
|
|
|
|
|
|
|
|
|
|
|
|
|
|
Delaware River and Bay Authority, Delaware and New Jersey, Revenue Bonds, Series 2014A: |
|
|
|
|
|
|
|
|
| |
150 |
|
|
|
|
4.125%, 1/01/39 |
|
|
1/24 at 100.00 |
|
|
|
134,677 |
|
| |
200 |
|
|
|
|
5.000%, 1/01/44 |
|
|
1/24 at 100.00 |
|
|
|
200,106 |
|
|
|
|
|
|
| |
130 |
|
|
|
|
Delaware River and Bay Authority, Delaware and New Jersey, Revenue Bonds, Series 2019,
4.000%, 1/01/44 |
|
|
1/29 at 100.00 |
|
|
|
109,049 |
|
|
|
|
|
|
|
Total Delaware |
|
|
|
|
|
|
443,832 |
|
|
|
|
|
|
|
|
|
|
|
|
District of Columbia - 0.9% |
|
|
|
|
|
|
|
|
|
|
|
|
|
| |
1,735 |
|
|
|
|
Metropolitan Washington Airports Authority, District of Columbia, Dulles Toll Road Revenue Bonds, Dulles Metrorail & Capital
improvement Projects, Refunding & Subordinate Lien Series 2019B, 5.000%, 10/01/47 |
|
|
10/29 at 100.00 |
|
|
|
1,634,286 |
|
|
|
|
|
|
| |
725 |
|
|
|
|
Washington Metropolitan Area Transit Authority, District of Columbia, Dedicated Revenue
Bonds, Series 2020A, 5.000%, 7/15/45 |
|
|
7/30 at 100.00 |
|
|
|
734,493 |
|
|
|
|
|
|
|
Total District of Columbia |
|
|
|
|
|
|
2,368,779 |
|
|
|
|
|
|
|
|
|
|
|
|
Florida - 3.8% |
|
|
|
|
|
|
|
|
|
|
|
|
|
| |
1,655 |
|
|
|
|
Fort Myers, Florida, Utility System Revenue Bonds, Refunding Series 2019A, 4.000%, 10/01/49 |
|
|
10/28 at 100.00 |
|
|
|
1,356,795 |
|
|
|
|
|
|
| |
500 |
|
|
|
|
Gainesville, Florida, Utilities System Revenue Bonds, Series 2017A, 5.000%, 10/01/36 |
|
|
10/27 at 100.00 |
|
|
|
513,975 |
|
|
|
|
|
|
| |
1,000 |
|
|
|
|
JEA, Florida, Water and Sewer System Revenue Bonds, Series 2020A, 5.000%, 10/01/34 |
|
|
4/30 at 100.00 |
|
|
|
1,062,371 |
|
|
|
|
|
|
| |
1,605 |
|
|
|
|
Lakeland, Florida, Hospital System Revenue Bonds, Lakeland Regional Health, Series 2015, 5.000%, 11/15/45 |
|
|
11/24 at 100.00 |
|
|
|
1,503,727 |
|
|
|
|
|
|
| |
535 |
|
|
|
|
Miami Beach Redevelopment Agency, Florida, Tax Increment Revenue Bonds, City Center/Historic Convention Village, Series 2015A,
5.000%, 2/01/44 - AGM Insured |
|
|
2/24 at 100.00 |
|
|
|
535,017 |
|
|
|
|
|
|
| |
3,350 |
|
|
|
|
Miami-Dade County, Florida, Water and Sewer System Revenue Bonds, Refunding Series 2017B, 5.000%, 10/01/32 |
|
|
10/25 at 100.00 |
|
|
|
3,391,033 |
|
|
|
|
|
|
| |
510 |
|
|
|
|
Putnam County Development Authority, Florida, Pollution Control Revenue Bonds, Seminole Electric Cooperatice, Inc. Project,
Refunding Series 2018B, 5.000%, 3/15/42 |
|
|
5/28 at 100.00 |
|
|
|
490,887 |
|
|
|
|
|
|
| |
805 |
|
|
(d) |
|
Tolomato Community Development District, Florida, Special Assessment Bonds, Refunding Series 2015-2, 0.000%, 5/01/40 |
|
|
12/23 at 100.00 |
|
|
|
749,123 |
|
|
|
|
|
|
| |
880 |
|
|
(e) |
|
Tolomato Community Development District, Florida, Special Assessment Bonds, Refunding
Series 2015-3, 6.610%, 5/01/40 |
|
|
12/23 at 100.00 |
|
|
|
9 |
|
|
|
|
|
|
|
Total Florida |
|
|
|
|
|
|
9,602,937 |
|
43
|
|
|
| NUW |
|
Nuveen AMT-Free Municipal Value Fund (continued) Portfolio of Investments October 31, 2023 |
|
|
|
|
|
|
|
|
|
|
|
|
|
|
|
|
Principal
Amount (000) |
|
|
|
|
Description (a) |
|
|
Optional Call
Provisions (b) |
|
|
|
Value |
|
|
|
|
|
|
|
|
|
|
|
|
Georgia - 2.6% |
|
|
|
|
|
|
|
|
|
|
|
|
|
| $ |
2,000 |
|
|
|
|
Gainesville and Hall County Hospital Authority, Georgia, Revenue Anticipation Certificates, Northeast Georgia Health Services
Inc., Series 2017B, 5.250%, 2/15/45 |
|
|
2/27 at 100.00 |
|
|
$ |
2,019,789 |
|
|
|
|
|
|
| |
1,470 |
|
|
|
|
Municipal Electric Authority of Georgia, Plant Vogtle Units 3 & 4 Project J Bonds, Series 2019A, 5.000%, 1/01/49 - BAM
Insured |
|
|
7/28 at 100.00 |
|
|
|
1,431,020 |
|
|
|
|
|
|
|
|
|
|
|
|
Municipal Electric Authority of Georgia, Project One Revenue Bonds, Subordinate Lien Series 2015A: |
|
|
|
|
|
|
|
|
| |
1,790 |
|
|
|
|
0.000%, 1/01/32 |
|
|
No Opt. Call |
|
|
|
1,179,963 |
|
| |
2,000 |
|
|
|
|
5.000%, 1/01/35 |
|
|
1/25 at 100.00 |
|
|
|
1,989,652 |
|
|
|
|
|
|
|
Total Georgia |
|
|
|
|
|
|
6,620,424 |
|
|
|
|
|
|
|
|
|
|
|
|
Illinois - 10.2% |
|
|
|
|
|
|
|
|
|
|
|
|
|
| |
2,000 |
|
|
|
|
Chicago Board of Education, Illinois, Dedicated Capital Improvement Tax Revenue Bonds, Series 2016, 6.000%, 4/01/46 |
|
|
4/27 at 100.00 |
|
|
|
2,012,033 |
|
|
|
|
|
|
| |
2,000 |
|
|
|
|
Cook County, Illinois, Sales Tax Revenue Bonds, Series 2017, 5.000%, 11/15/38 |
|
|
11/27 at 100.00 |
|
|
|
2,012,185 |
|
|
|
|
|
|
| |
1,800 |
|
|
|
|
Evanston, Cook County, Illinois, General Obligation Bonds, Corporate Purpose Series 2019A, 5.000%, 12/01/43 |
|
|
12/29 at 100.00 |
|
|
|
1,794,392 |
|
|
|
|
|
|
| |
7,500 |
|
|
|
|
Illinois Finance Authority, Revenue Bonds, University of Chicago, Series 2023A, 5.250%, 5/15/54 |
|
|
5/33 at 100.00 |
|
|
|
7,708,613 |
|
|
|
|
|
|
|
|
|
|
|
|
Illinois Finance Authority, State of Illinois Clean Water Initiative Revolving Fund Revenue Bonds, Series 2017: |
|
|
|
|
|
|
|
|
| |
3,125 |
|
|
|
|
5.000%, 7/01/37 |
|
|
1/27 at 100.00 |
|
|
|
3,204,935 |
|
| |
375 |
|
|
(c) |
|
5.000%, 7/01/37, (Pre-refunded 1/01/27) |
|
|
1/27 at 100.00 |
|
|
|
387,594 |
|
|
|
|
|
|
| |
1,500 |
|
|
|
|
Illinois State, General Obligation Bonds, November Series 2017D, 5.000%, 11/01/27 |
|
|
No Opt. Call |
|
|
|
1,537,373 |
|
|
|
|
|
|
| |
525 |
|
|
|
|
Illinois State, General Obligation Bonds, October Series 2016, 5.000%, 2/01/27 |
|
|
No Opt. Call |
|
|
|
535,865 |
|
|
|
|
|
|
| |
495 |
|
|
|
|
Metropolitan Pier and Exposition Authority, Illinois, McCormick Place Expansion Project Bonds, Refunding Series 2020A, 4.000%,
6/15/50 |
|
|
12/29 at 100.00 |
|
|
|
385,334 |
|
|
|
|
|
|
| |
11,420 |
|
|
|
|
Metropolitan Pier and Exposition Authority, Illinois, Revenue Bonds, McCormick Place Expansion Project, Series 2002A, 0.000%,
12/15/37 - NPFG Insured |
|
|
No Opt. Call |
|
|
|
5,471,233 |
|
|
|
|
|
|
|
|
|
|
|
|
Will County Community Unit School District 201-U Crete-Monee, Illinois, General Obligation Bonds, Capital Appreciation Series
2004: |
|
|
|
|
|
|
|
|
| |
340 |
|
|
(c) |
|
0.000%, 11/01/23 - NPFG Insured, (ETM) |
|
|
No Opt. Call |
|
|
|
340,000 |
|
| |
330 |
|
|
|
|
0.000%, 11/01/23 - NPFG Insured |
|
|
No Opt. Call |
|
|
|
330,000 |
|
| |
300 |
|
|
(c) |
|
0.000%, 11/01/23 - NPFG Insured, (ETM) |
|
|
No Opt. Call |
|
|
|
300,000 |
|
| |
50 |
|
|
(c) |
|
0.000%, 11/01/23 - NPFG Insured, (ETM) |
|
|
No Opt. Call |
|
|
|
50,000 |
|
| |
25 |
|
|
(c) |
|
0.000%, 11/01/23 - NPFG Insured, (ETM) |
|
|
No Opt. Call |
|
|
|
25,000 |
|
|
|
|
|
|
|
Total Illinois |
|
|
|
|
|
|
26,094,557 |
|
|
|
|
|
|
|
|
|
|
|
|
Indiana - 0.6% |
|
|
|
|
|
|
|
|
|
|
|
|
|
| |
1,500 |
|
|
|
|
Indianapolis Local Public Improvement Bond Bank, Indiana, Series 1999E, 0.000%, 2/01/25 -
AMBAC Insured |
|
|
No Opt. Call |
|
|
|
1,420,923 |
|
|
|
|
|
|
|
Total Indiana |
|
|
|
|
|
|
1,420,923 |
|
|
|
|
|
|
|
|
|
|
|
|
Kentucky - 3.3% |
|
|
|
|
|
|
|
|
|
|
|
|
|
| |
1,150 |
|
|
|
|
Kenton County Airport Board, Kentucky, Airport Revenue Bonds, Cincinnati/Northern Kentucky International Airport, Refunding
Series 2016, 5.000%, 1/01/29 |
|
|
1/26 at 100.00 |
|
|
|
1,167,985 |
|
44
|
|
|
|
|
|
|
|
|
|
|
|
|
|
|
|
Principal
Amount (000) |
|
|
|
|
Description (a) |
|
|
Optional Call
Provisions (b) |
|
|
|
Value |
|
|
|
|
|
|
|
|
|
|
|
|
Kentucky (continued) |
|
|
|
|
|
|
|
|
| $ |
1,000 |
|
|
|
|
Kentucky Bond Development Corporation, Transient Room Tax Revenue Bonds, Lexington Center Corporation Project, Series 2018A,
5.000%, 9/01/43 |
|
|
9/28 at 100.00 |
|
|
$ |
945,469 |
|
|
|
|
|
|
| |
1,185 |
|
|
|
|
Kentucky Economic Development Finance Authority, Louisville Arena Project Revenue Bonds, Louisville Arena Authority, Inc., Series
2017A, 5.000%, 12/01/47 - AGM Insured |
|
|
12/23 at 100.00 |
|
|
|
1,128,196 |
|
|
|
|
|
|
| |
1,000 |
|
|
|
|
Kentucky Economic Development Finance Authority, Revenue Bonds, CommonSpirit Health, Series 2019A-1, 5.000%, 8/01/32 |
|
|
8/29 at 100.00 |
|
|
|
1,023,256 |
|
|
|
|
|
|
| |
3,750 |
|
|
|
|
Kentucky Economic Development Finance Authority, Revenue Bonds, Next Generation Kentucky Information Highway Project, Senior
Series 2015A, 5.000%, 1/01/45 |
|
|
7/25 at 100.00 |
|
|
|
3,404,477 |
|
|
|
|
|
|
| |
1,080 |
|
|
|
|
Kentucky Public Transportation Infrastructure Authority, Toll Revenue Bonds, Downtown
Crossing Project, Refunding First Tier Series 2021B, 4.000%, 7/01/53 - AGM Insured |
|
|
7/31 at 100.00 |
|
|
|
839,270 |
|
|
|
|
|
|
|
Total Kentucky |
|
|
|
|
|
|
8,508,653 |
|
|
|
|
|
|
|
|
|
|
|
|
Maine - 0.9% |
|
|
|
|
|
|
|
|
|
|
|
|
|
| |
2,425 |
|
|
|
|
University of Maine, System Revenue Bonds, Series 2022, 5.000%, 3/01/47 |
|
|
3/32 at 100.00 |
|
|
|
2,372,621 |
|
|
|
|
|
|
|
Total Maine |
|
|
|
|
|
|
2,372,621 |
|
|
|
|
|
|
|
|
|
|
|
|
Maryland - 3.2% |
|
|
|
|
|
|
|
|
|
|
|
|
|
| |
3,420 |
|
|
|
|
Baltimore, Maryland, Convention Center Hotel Revenue Bonds, Refunding Series 2017, 5.000%, 9/01/33 |
|
|
9/27 at 100.00 |
|
|
|
3,190,451 |
|
|
|
|
|
|
| |
5,000 |
|
|
|
|
Maryland Health and Higher Educational Facilities Authority, Revenue Bonds, MedStar
Health Issue, Series 2017A, 5.000%, 5/15/45 |
|
|
5/27 at 100.00 |
|
|
|
4,861,899 |
|
|
|
|
|
|
|
Total Maryland |
|
|
|
|
|
|
8,052,350 |
|
|
|
|
|
|
|
|
|
|
|
|
Michigan - 0.7% |
|
|
|
|
|
|
|
|
|
|
|
|
|
| |
1,000 |
|
|
|
|
Michigan Finance Authority, Distributable State Aid Revenue Bonds, Charter County of Wayne Criminal Justice Center Project,
Senior Lien Series 2018, 5.000%, 11/01/43 |
|
|
11/28 at 100.00 |
|
|
|
1,007,813 |
|
|
|
|
|
|
| |
850 |
|
|
|
|
Michigan Finance Authority, Tobacco Settlement Asset- Backed Bonds, 2007 Sold Tobacco
Receipts, Series 2020B-1-CL2, 5.000%, 6/01/49 |
|
|
12/30 at 100.00 |
|
|
|
833,133 |
|
|
|
|
|
|
|
Total Michigan |
|
|
|
|
|
|
1,840,946 |
|
|
|
|
|
|
|
|
|
|
|
|
Minnesota - 1.1% |
|
|
|
|
|
|
|
|
|
|
|
|
|
| |
1,145 |
|
|
|
|
Rochester, Minnesota, Electric Utility Revenue Bonds, Refunding Series 2017A, 5.000%, 12/01/47 |
|
|
12/26 at 100.00 |
|
|
|
1,131,002 |
|
|
|
|
|
|
| |
700 |
|
|
|
|
Southern Minnesota Municipal Power Agency, Badger Coulee Project Revenue Bonds, Series 2019A, 5.000%, 1/01/32 |
|
|
1/30 at 100.00 |
|
|
|
746,074 |
|
|
|
|
|
|
| |
1,000 |
|
|
|
|
University of Minnesota, General Obligation Bonds, Series 2017A, 5.000%, 9/01/36 |
|
|
9/27 at 100.00 |
|
|
|
1,028,233 |
|
|
|
|
|
|
|
Total Minnesota |
|
|
|
|
|
|
2,905,309 |
|
|
|
|
|
|
|
|
|
|
|
|
Montana - 0.8% |
|
|
|
|
|
|
|
|
|
|
|
|
|
|
|
|
|
|
|
Montana Facility Finance Authority, Montana, Health Facilities Reveue Bonds, Bozeman Deaconess Health Services Obligated Group,
Series 2021A: |
|
|
|
|
|
|
|
|
| |
500 |
|
|
|
|
5.000%, 6/01/31 |
|
|
No Opt. Call |
|
|
|
512,832 |
|
| |
640 |
|
|
|
|
4.000%, 6/01/38 |
|
|
6/31 at 100.00 |
|
|
|
559,073 |
|
| |
1,245 |
|
|
|
|
4.000%, 6/01/40 |
|
|
6/31 at 100.00 |
|
|
|
1,064,153 |
|
|
|
|
|
|
|
Total Montana |
|
|
|
|
|
|
2,136,058 |
|
45
|
|
|
| NUW |
|
Nuveen AMT-Free Municipal Value Fund (continued) Portfolio of Investments October 31, 2023 |
|
|
|
|
|
|
|
|
|
|
|
|
|
|
|
|
Principal
Amount (000) |
|
|
|
|
Description (a) |
|
|
Optional Call
Provisions (b) |
|
|
|
Value |
|
|
|
|
|
|
|
|
|
|
|
|
Nevada - 5.5% |
|
|
|
|
|
|
|
|
|
|
|
|
|
| $ |
3,000 |
|
|
|
|
Clark County, Nevada, General Obligation Bonds, Transportation Improvement, Limited Tax, Additionally Secured by Pledged Revenue
Series 2018B, 5.000%, 12/01/33 |
|
|
12/28 at 100.00 |
|
|
$ |
3,138,660 |
|
|
|
|
|
|
| |
4,000 |
|
|
|
|
Las Vegas Convention and Visitors Authority, Nevada, Revenue Bonds, Series 2018C, 5.250%, 7/01/43 |
|
|
7/28 at 100.00 |
|
|
|
4,059,862 |
|
|
|
|
|
|
|
|
|
|
|
|
Las Vegas Convention and Visitors Authority, Nevada, Revenue Bonds, Series 2019B: |
|
|
|
|
|
|
|
|
| |
3,015 |
|
|
|
|
5.000%, 7/01/36 |
|
|
7/29 at 100.00 |
|
|
|
3,116,101 |
|
| |
1,665 |
|
|
|
|
5.000%, 7/01/37 |
|
|
7/29 at 100.00 |
|
|
|
1,707,725 |
|
|
|
|
|
|
| |
2,000 |
|
|
|
|
Las Vegas Valley Water District, Nevada, General Obligation Bonds, Refunding Series 2015, 5.000%, 6/01/39 |
|
|
12/24 at 100.00 |
|
|
|
2,008,772 |
|
|
|
|
|
|
| |
60 |
|
|
|
|
Sparks, Nevada, Sales Tax Revenue Bonds, Tourism Improvement District 1 Legends at Sparks
Marina, Refunding Senior Series 2019A, 2.750%, 6/15/28, 144A |
|
|
No Opt. Call |
|
|
|
54,440 |
|
|
|
|
|
|
|
Total Nevada |
|
|
|
|
|
|
14,085,560 |
|
|
|
|
|
|
|
|
|
|
|
|
New Jersey - 6.8% |
|
|
|
|
|
|
|
|
|
|
|
|
|
|
|
|
|
|
|
Camden County Improvement Authority, New Jersey, Health Care Redevelopment Revenue Bonds, Cooper Health System Obligated Group
Issue, Refunding Series 2014A: |
|
|
|
|
|
|
|
|
| |
105 |
|
|
(c) |
|
5.000%, 2/15/25, (Pre-refunded 2/15/24) |
|
|
2/24 at 100.00 |
|
|
|
105,250 |
|
| |
100 |
|
|
(c) |
|
5.000%, 2/15/34, (Pre-refunded 2/15/24) |
|
|
2/24 at 100.00 |
|
|
|
100,238 |
|
|
|
|
|
|
| |
110 |
|
|
|
|
Camden County Improvement Authority, New Jersey, Lease Revenue Bonds, Rowan University School of Osteopathic Medicine Project,
Refunding Series 2013A, 5.000%, 12/01/32 |
|
|
12/23 at 100.00 |
|
|
|
108,491 |
|
|
|
|
|
|
| |
80 |
|
|
|
|
Cumberland County Improvement Authority, New Jersey, Guaranteed Lease Revenue Bonds, County Correctional Facility Project, Series
2018, 4.000%, 10/01/43 - BAM Insured |
|
|
10/28 at 100.00 |
|
|
|
68,133 |
|
|
|
|
|
|
|
|
|
|
|
|
Delaware River Port Authority, New Jersey and Pennsylvania, Revenue Bonds, Series 2018A: |
|
|
|
|
|
|
|
|
| |
175 |
|
|
|
|
5.000%, 1/01/37 |
|
|
1/29 at 100.00 |
|
|
|
180,794 |
|
| |
125 |
|
|
|
|
5.000%, 1/01/38 |
|
|
1/29 at 100.00 |
|
|
|
128,035 |
|
|
|
|
|
|
| |
245 |
|
|
|
|
Garden State Preservation Trust, New Jersey, Open Space and Farmland Preservation Bonds, Series 2005A, 5.750%, 11/01/28 - AGM
Insured |
|
|
No Opt. Call |
|
|
|
255,754 |
|
|
|
|
|
|
|
|
|
|
|
|
Harrison, New Jersey, General Obligation Bonds, Parking Utility Series 2018: |
|
|
|
|
|
|
|
|
| |
35 |
|
|
|
|
3.125%, 3/01/31 - BAM Insured |
|
|
3/28 at 100.00 |
|
|
|
31,671 |
|
| |
30 |
|
|
|
|
3.250%, 3/01/32 - BAM Insured |
|
|
3/28 at 100.00 |
|
|
|
27,041 |
|
| |
50 |
|
|
|
|
3.500%, 3/01/36 - BAM Insured |
|
|
3/28 at 100.00 |
|
|
|
43,635 |
|
|
|
|
|
|
| |
150 |
|
|
|
|
Hudson County Improvement Authority, New Jersey, County Secured Lease Revenue Bonds, Hudson County Vocational Technical Schools
Project, Series 2016, 5.250%, 5/01/51 |
|
|
5/26 at 100.00 |
|
|
|
150,970 |
|
|
|
|
|
|
| |
100 |
|
|
|
|
Jersey City, New Jersey, General Obligation Bonds, Refunding General Improvement Series 2017A, 5.000%, 11/01/29 |
|
|
11/27 at 100.00 |
|
|
|
104,203 |
|
|
|
|
|
|
| |
100 |
|
|
(e) |
|
Middlesex County Improvement Authority, New Jersey, Senior Revenue Bonds, Heldrich Center Hotel/Conference Center Project, Series
2005A, 5.000%, 1/01/32 |
|
|
12/23 at 100.00 |
|
|
|
69,607 |
|
|
|
|
|
|
| |
125 |
|
|
|
|
Middlesex County, New Jersey, General Obligation Bonds, Refunding Redevelopment Series 2017, 5.000%, 1/15/27 |
|
|
No Opt. Call |
|
|
|
129,983 |
|
|
|
|
|
|
| |
20 |
|
|
|
|
Montclair Township, Essex County, New Jersey, General Obligation Bonds, Refunding Parking Utility Series 2014A, 5.000%,
1/01/37 |
|
|
1/24 at 100.00 |
|
|
|
20,016 |
|
46
|
|
|
|
|
|
|
|
|
|
|
|
|
|
|
|
Principal
Amount (000) |
|
|
|
|
Description (a) |
|
|
Optional Call
Provisions (b) |
|
|
|
Value |
|
|
|
|
|
|
|
|
|
|
|
|
New Jersey (continued) |
|
|
|
|
|
|
|
|
|
|
|
|
|
| $ |
100 |
|
|
|
|
Montclair Township, Essex County, New Jersey, General Obligation Bonds, Refunding School Series 2017B, 4.000%, 3/01/25 |
|
|
No Opt. Call |
|
|
$ |
100,281 |
|
|
|
|
|
|
|
|
|
|
|
|
New Brunswick Parking Authority, Middlesex County, New Jersey, Guaranteed Parking Revenue Bonds, Refunding Series 2016A: |
|
|
|
|
|
|
|
|
| |
300 |
|
|
|
|
5.000%, 9/01/32 - BAM Insured |
|
|
9/26 at 100.00 |
|
|
|
305,633 |
|
| |
140 |
|
|
|
|
5.000%, 9/01/39 - BAM Insured |
|
|
9/26 at 100.00 |
|
|
|
140,298 |
|
|
|
|
|
|
| |
25 |
|
|
|
|
New Jersey Economic Development Authority, Charter School Revenue Bonds, Foundation Academy Charter School, Series 2018A, 5.000%,
7/01/38 |
|
|
1/28 at 100.00 |
|
|
|
23,209 |
|
|
|
|
|
|
|
|
|
|
|
|
New Jersey Economic Development Authority, Charter School Revenue Bonds, North Star Academy Charter School of Newark, Series
2017: |
|
|
|
|
|
|
|
|
| |
220 |
|
|
|
|
4.000%, 7/15/37 |
|
|
7/27 at 100.00 |
|
|
|
191,990 |
|
| |
25 |
|
|
|
|
5.000%, 7/15/47 |
|
|
7/27 at 100.00 |
|
|
|
22,779 |
|
|
|
|
|
|
| |
100 |
|
|
|
|
New Jersey Economic Development Authority, Charter School Revenue Bonds, Teaneck Community Charter School, Series 2017A, 5.125%,
9/01/52, 144A |
|
|
9/27 at 100.00 |
|
|
|
82,406 |
|
|
|
|
|
|
| |
35 |
|
|
|
|
New Jersey Economic Development Authority, Fixed Rate Revenue Bonds, Lions Gate Project, Series 2014, 5.250%, 1/01/44 |
|
|
1/24 at 100.00 |
|
|
|
30,014 |
|
|
|
|
|
|
| |
100 |
|
|
|
|
New Jersey Economic Development Authority, Lease Revenue Bonds, State House Project, Series 2017B, 4.500%, 6/15/40 |
|
|
12/28 at 100.00 |
|
|
|
93,367 |
|
|
|
|
|
|
| |
215 |
|
|
|
|
New Jersey Economic Development Authority, Natural Gas Facilities Revenue Bonds, New Jersey Natural Gas Company Project,
Refunding Series 2011A, 2.750%, 8/01/39 |
|
|
8/24 at 100.00 |
|
|
|
153,158 |
|
|
|
|
|
|
| |
125 |
|
|
|
|
New Jersey Economic Development Authority, Revenue Bonds, Motor Vehicle Surcharge, Refunding Subordinate Series 2017A, 3.375%,
7/01/30 |
|
|
7/27 at 100.00 |
|
|
|
112,630 |
|
|
|
|
|
|
| |
55 |
|
|
|
|
New Jersey Economic Development Authority, Revenue Bonds, Provident Group - Kean Properties LLC - Kean University Student Housing
Project, Series 2017A, 5.000%, 7/01/47 |
|
|
1/27 at 100.00 |
|
|
|
46,800 |
|
|
|
|
|
|
| |
100 |
|
|
|
|
New Jersey Economic Development Authority, Revenue Bonds, Provident Group - Rowan Properties LLC - Rowan University Student
Housing Project, Series 2015A, 5.000%, 1/01/48 |
|
|
1/25 at 100.00 |
|
|
|
83,749 |
|
|
|
|
|
|
| |
115 |
|
|
|
|
New Jersey Economic Development Authority, Revenue Bonds, The Seeing Eye Inc., Refunding Series 2015, 5.000%, 3/01/25 |
|
|
No Opt. Call |
|
|
|
116,383 |
|
|
|
|
|
|
|
|
|
|
|
|
New Jersey Economic Development Authority, Revenue Bonds, The Seeing Eye Inc., Refunding Series 2017: |
|
|
|
|
|
|
|
|
| |
20 |
|
|
|
|
3.000%, 6/01/32 |
|
|
12/27 at 100.00 |
|
|
|
17,334 |
|
| |
15 |
|
|
|
|
5.000%, 6/01/32 |
|
|
12/27 at 100.00 |
|
|
|
15,203 |
|
|
|
|
|
|
| |
40 |
|
|
(c) |
|
New Jersey Economic Development Authority, Revenue Bonds, United Methodist Homes of New Jersey Obligated Group Issue, Refunding
Series 2014A, 5.000%, 7/01/29, (Pre-refunded 7/01/24) |
|
|
7/24 at 100.00 |
|
|
|
40,154 |
|
|
|
|
|
|
| |
155 |
|
|
|
|
New Jersey Economic Development Authority, Revenue Bonds, West Campus Housing LLC - New Jersey City University Student Housing
Project, Series 2015, 5.000%, 7/01/47 |
|
|
7/25 at 100.00 |
|
|
|
119,246 |
|
|
|
|
|
|
| |
100 |
|
|
|
|
New Jersey Economic Development Authority, Revenue Bonds, White Horse HMT Urban Renewal LLC Project, Series 2020, 5.000%,
1/01/40, 144A |
|
|
1/28 at 102.00 |
|
|
|
66,445 |
|
|
|
|
|
|
| |
935 |
|
|
|
|
New Jersey Economic Development Authority, School Facilities Construction Bonds, Series 2005N-1, 5.500%, 9/01/27 - NPFG
Insured |
|
|
No Opt. Call |
|
|
|
986,216 |
|
|
|
|
|
|
| |
15 |
|
|
|
|
New Jersey Economic Development Authority, School Facilities Construction Bonds, Social Series 2021QQQ, 4.000%, 6/15/50 |
|
|
12/30 at 100.00 |
|
|
|
12,340 |
|
|
|
|
|
|
| |
145 |
|
|
|
|
New Jersey Educational Facilities Authority, Revenue Bonds, College of New Jersey, Refunding Series 2016F, 3.000%,
7/01/40 |
|
|
7/26 at 100.00 |
|
|
|
104,148 |
|
47
|
|
|
| NUW |
|
Nuveen AMT-Free Municipal Value Fund (continued) Portfolio of Investments October 31, 2023 |
|
|
|
|
|
|
|
|
|
|
|
|
|
|
|
|
Principal
Amount (000) |
|
|
|
|
Description (a) |
|
|
Optional Call
Provisions (b) |
|
|
|
Value |
|
|
|
|
|
|
|
|
|
|
|
|
New Jersey (continued) |
|
|
|
|
|
|
|
|
|
|
|
|
|
| $ |
100 |
|
|
|
|
New Jersey Educational Facilities Authority, Revenue Bonds, Kean University, Refunding Series 2015H, 4.000%, 7/01/39 - AGM
Insured |
|
|
7/25 at 100.00 |
|
|
$ |
86,470 |
|
|
|
|
|
|
| |
50 |
|
|
|
|
New Jersey Educational Facilities Authority, Revenue Bonds, Montclair State University, Series 2014A, 5.000%, 7/01/44 |
|
|
7/24 at 100.00 |
|
|
|
48,677 |
|
|
|
|
|
|
|
|
|
|
|
|
New Jersey Educational Facilities Authority, Revenue Bonds, Rider University, Series 2017F: |
|
|
|
|
|
|
|
|
| |
5 |
|
|
|
|
3.750%, 7/01/37 |
|
|
7/27 at 100.00 |
|
|
|
3,613 |
|
| |
100 |
|
|
|
|
4.000%, 7/01/42 |
|
|
7/27 at 100.00 |
|
|
|
68,601 |
|
| |
100 |
|
|
|
|
5.000%, 7/01/47 |
|
|
7/27 at 100.00 |
|
|
|
76,933 |
|
|
|
|
|
|
| |
75 |
|
|
|
|
New Jersey Educational Facilities Authority, Revenue Bonds, Seton Hall University, Series 2013D, 5.000%, 7/01/38 |
|
|
12/23 at 100.00 |
|
|
|
73,711 |
|
|
|
|
|
|
|
|
|
|
|
|
New Jersey Educational Facilities Authority, Revenue Bonds, Seton Hall University, Series 2016C: |
|
|
|
|
|
|
|
|
| |
435 |
|
|
|
|
3.000%, 7/01/41 |
|
|
7/26 at 100.00 |
|
|
|
299,324 |
|
| |
50 |
|
|
|
|
3.000%, 7/01/46 |
|
|
7/26 at 100.00 |
|
|
|
31,674 |
|
| |
25 |
|
|
|
|
4.000%, 7/01/46 |
|
|
7/26 at 100.00 |
|
|
|
19,412 |
|
|
|
|
|
|
|
|
|
|
|
|
New Jersey Educational Facilities Authority, Revenue Bonds, Stevens Institute of Technology, Series 2017A: |
|
|
|
|
|
|
|
|
| |
200 |
|
|
|
|
4.000%, 7/01/47 |
|
|
7/27 at 100.00 |
|
|
|
155,113 |
|
| |
30 |
|
|
|
|
5.000%, 7/01/47 |
|
|
7/27 at 100.00 |
|
|
|
27,483 |
|
|
|
|
|
|
| |
25 |
|
|
|
|
New Jersey Educational Facilities Authority, Revenue Bonds, The College of Saint Elizabeth, Series 2016D, 5.000%,
7/01/46 |
|
|
7/26 at 100.00 |
|
|
|
20,379 |
|
|
|
|
|
|
| |
80 |
|
|
|
|
New Jersey Health Care Facilities Financing Authority, Revenue Bonds, AHS Hospital Corporation, Refunding Series 2016, 4.000%,
7/01/41 |
|
|
1/27 at 100.00 |
|
|
|
72,084 |
|
|
|
|
|
|
| |
230 |
|
|
|
|
New Jersey Health Care Facilities Financing Authority, Revenue Bonds, Barnabas Health, Refunding Series 2014A, 5.000%,
7/01/44 |
|
|
7/24 at 100.00 |
|
|
|
225,055 |
|
|
|
|
|
|
|
|
|
|
|
|
New Jersey Health Care Facilities Financing Authority, Revenue Bonds, Hackensack Meridian Health Obligated Group, Refunding
Series 2017A: |
|
|
|
|
|
|
|
|
| |
150 |
|
|
|
|
5.000%, 7/01/28 |
|
|
7/27 at 100.00 |
|
|
|
155,834 |
|
| |
150 |
|
|
|
|
5.000%, 7/01/57 |
|
|
7/27 at 100.00 |
|
|
|
141,581 |
|
|
|
|
|
|
| |
110 |
|
|
|
|
New Jersey Health Care Facilities Financing Authority, Revenue Bonds, Hunterdon Medical Center, Refunding Series 2014A, 4.000%,
7/01/45 |
|
|
7/24 at 100.00 |
|
|
|
89,097 |
|
|
|
|
|
|
| |
50 |
|
|
|
|
New Jersey Health Care Facilities Financing Authority, Revenue Bonds, Inspira Health Obligated Group Issue, Refunding Series
2016A, 4.000%, 7/01/41 |
|
|
7/26 at 100.00 |
|
|
|
42,068 |
|
|
|
|
|
|
| |
360 |
|
|
|
|
New Jersey Health Care Facilities Financing Authority, Revenue Bonds, Inspira Health Obligated Group Issue, Series 2017A, 5.000%,
7/01/42 |
|
|
7/27 at 100.00 |
|
|
|
348,066 |
|
|
|
|
|
|
|
|
|
|
|
|
New Jersey Health Care Facilities Financing Authority, Revenue Bonds, Princeton HealthCare System, Series 2016A: |
|
|
|
|
|
|
|
|
| |
25 |
|
|
|
|
5.000%, 7/01/32 |
|
|
7/26 at 100.00 |
|
|
|
25,521 |
|
| |
40 |
|
|
|
|
5.000%, 7/01/33 |
|
|
7/26 at 100.00 |
|
|
|
40,796 |
|
| |
30 |
|
|
|
|
5.000%, 7/01/34 |
|
|
7/26 at 100.00 |
|
|
|
30,554 |
|
|
|
|
|
|
| |
130 |
|
|
|
|
New Jersey Health Care Facilities Financing Authority, Revenue Bonds, Robert Wood Johnson University Hospital Issue, Series
2014A, 5.000%, 7/01/39 |
|
|
7/24 at 100.00 |
|
|
|
128,773 |
|
|
|
|
|
|
| |
110 |
|
|
|
|
New Jersey Health Care Facilities Financing Authority, Revenue Bonds, Robert Wood Johnson University Hospital, Series 2013A,
5.500%, 7/01/43 |
|
|
12/23 at 100.00 |
|
|
|
110,010 |
|
|
|
|
|
|
| |
125 |
|
|
|
|
New Jersey Health Care Facilities Financing Authority, Revenue Bonds, RWJ Barnabas Health Obligated Group, Refunding Series
2016A, 5.000%, 7/01/43 |
|
|
7/26 at 100.00 |
|
|
|
123,671 |
|
48
|
|
|
|
|
|
|
|
|
|
|
|
|
|
|
|
Principal
Amount (000) |
|
|
|
|
Description (a) |
|
|
Optional Call
Provisions (b) |
|
|
|
Value |
|
|
|
|
|
|
|
|
|
|
|
|
New Jersey (continued) |
|
|
|
|
|
|
|
|
|
|
|
|
|
|
New Jersey Health Care Facilities Financing Authority, Revenue Bonds, Saint Joseph’s Healthcare System Obligated Group
Issue, Refunding Series 2016: |
|
|
|
|
|
|
|
|
| $ |
10 |
|
|
|
|
3.000%, 7/01/32 |
|
|
7/26 at 100.00 |
|
|
$ |
8,093 |
|
| |
405 |
|
|
|
|
4.000%, 7/01/48 |
|
|
7/26 at 100.00 |
|
|
|
313,052 |
|
|
|
|
|
|
|
|
|
|
|
|
New Jersey Health Care Facilities Financing Authority, Revenue Bonds, University Hospital Issue, Refunding Series 2015A: |
|
|
|
|
|
|
|
|
| |
130 |
|
|
|
|
4.125%, 7/01/38 - AGM Insured |
|
|
7/25 at 100.00 |
|
|
|
121,770 |
|
| |
110 |
|
|
|
|
5.000%, 7/01/46 - AGM Insured |
|
|
7/25 at 100.00 |
|
|
|
108,214 |
|
|
|
|
|
|
|
|
|
|
|
|
New Jersey Health Care Facilities Financing Authority, Revenue Bonds, Valley Health System Obligated Group, Series 2019: |
|
|
|
|
|
|
|
|
| |
50 |
|
|
|
|
4.000%, 7/01/44 |
|
|
7/29 at 100.00 |
|
|
|
40,696 |
|
| |
205 |
|
|
|
|
3.000%, 7/01/49 |
|
|
7/29 at 100.00 |
|
|
|
133,022 |
|
|
|
|
|
|
| |
50 |
|
|
(e) |
|
New Jersey Health Care Facilities Financing Authority, Revenue Bonds, Village Drive Healthcare Urban Renewal LLC, Series 2018,
5.750%, 10/01/38, 144A |
|
|
10/26 at 102.00 |
|
|
|
36,212 |
|
|
|
|
|
|
| |
120 |
|
|
|
|
New Jersey Housing and Mortgage Finance Agency, Multifamily Revenue Bonds, Series 2015A, 4.000%, 11/01/45 |
|
|
11/24 at 100.00 |
|
|
|
96,724 |
|
|
|
|
|
|
| |
270 |
|
|
|
|
New Jersey Housing and Mortgage Finance Agency, Multifamily Revenue Bonds, Series 2016B, 3.600%, 11/01/40 |
|
|
11/25 at 100.00 |
|
|
|
222,623 |
|
|
|
|
|
|
| |
435 |
|
|
|
|
New Jersey Housing and Mortgage Finance Agency, Multifamily Revenue Bonds, Series 2018A, 3.875%, 11/01/38 |
|
|
11/27 at 100.00 |
|
|
|
368,674 |
|
|
|
|
|
|
| |
100 |
|
|
|
|
New Jersey Housing and Mortgage Finance Agency, Multifamily Revenue Bonds, Series 2019A, 2.900%, 11/01/39 |
|
|
11/28 at 100.00 |
|
|
|
74,708 |
|
|
|
|
|
|
|
|
|
|
|
|
New Jersey Housing and Mortgage Finance Agency, Single Family Housing Revenue Bonds, Series 2018A: |
|
|
|
|
|
|
|
|
| |
125 |
|
|
|
|
3.600%, 4/01/33 |
|
|
10/27 at 100.00 |
|
|
|
116,310 |
|
| |
75 |
|
|
|
|
3.750%, 10/01/35 |
|
|
10/27 at 100.00 |
|
|
|
66,331 |
|
|
|
|
|
|
| |
665 |
|
|
|
|
New Jersey Housing and Mortgage Finance Agency, Single Family Housing Revenue Bonds, Series 2019C, 3.950%, 10/01/44 |
|
|
4/28 at 100.00 |
|
|
|
551,004 |
|
|
|
|
|
|
| |
235 |
|
|
|
|
New Jersey Housing and Mortgage Finance Agency, Single Family Housing Revenue Bonds, Series 2020E, 2.250%, 10/01/40 |
|
|
4/29 at 100.00 |
|
|
|
157,564 |
|
|
|
|
|
|
| |
200 |
|
|
|
|
New Jersey Institute of Technology, New Jersey, General Obligation Bonds, Series 2015A, 5.000%, 7/01/45 |
|
|
7/25 at 100.00 |
|
|
|
200,519 |
|
|
|
|
|
|
| |
70 |
|
|
|
|
New Jersey State, General Obligation Bonds, Covid-19 Emergency Series 2020A, 4.000%, 6/01/32 |
|
|
No Opt. Call |
|
|
|
69,401 |
|
|
|
|
|
|
| |
100 |
|
|
|
|
New Jersey State, General Obligation Bonds, Various Purpose Series 2020, 2.250%, 6/01/35 |
|
|
12/27 at 100.00 |
|
|
|
74,695 |
|
|
|
|
|
|
| |
5,020 |
|
|
|
|
New Jersey Transportation Trust Fund Authority, Transportation System Bonds, Capital Appreciation Series 2010A, 0.000%,
12/15/31 |
|
|
No Opt. Call |
|
|
|
3,448,614 |
|
|
|
|
|
|
| |
2,170 |
|
|
|
|
New Jersey Transportation Trust Fund Authority, Transportation System Bonds, Series 2009A, 0.000%, 12/15/39 |
|
|
No Opt. Call |
|
|
|
916,749 |
|
|
|
|
|
|
| |
255 |
|
|
|
|
New Jersey Transportation Trust Fund Authority, Transportation System Bonds, Series 2015AA, 5.250%, 6/15/41 |
|
|
6/25 at 100.00 |
|
|
|
255,207 |
|
|
|
|
|
|
| |
50 |
|
|
|
|
New Jersey Transportation Trust Fund Authority, Transportation System Bonds, Series 2019A, 4.000%, 12/15/39 |
|
|
12/29 at 100.00 |
|
|
|
44,745 |
|
|
|
|
|
|
|
|
|
|
|
|
New Jersey Transportation Trust Fund Authority, Transportation System Bonds, Series 2019BB: |
|
|
|
|
|
|
|
|
| |
225 |
|
|
|
|
3.500%, 6/15/46 |
|
|
12/28 at 100.00 |
|
|
|
173,091 |
|
| |
100 |
|
|
|
|
4.000%, 6/15/50 |
|
|
12/28 at 100.00 |
|
|
|
83,141 |
|
49
|
|
|
| NUW |
|
Nuveen AMT-Free Municipal Value Fund (continued) Portfolio of Investments October 31, 2023 |
|
|
|
|
|
|
|
|
|
|
|
|
|
|
|
|
Principal
Amount (000) |
|
|
|
|
Description (a) |
|
|
Optional Call
Provisions (b) |
|
|
|
Value |
|
|
|
|
|
|
|
|
|
|
|
|
New Jersey (continued) |
|
|
|
|
|
|
|
|
|
|
|
|
|
|
New Jersey Transportation Trust Fund Authority, Transportation System Bonds, Series 2020AA: |
|
|
|
|
|
|
|
|
| $ |
40 |
|
|
|
|
3.000%, 6/15/50 |
|
|
12/30 at 100.00 |
|
|
$ |
26,206 |
|
| |
30 |
|
|
|
|
4.000%, 6/15/50 |
|
|
12/30 at 100.00 |
|
|
|
24,942 |
|
| |
70 |
|
|
|
|
5.000%, 6/15/50 |
|
|
12/30 at 100.00 |
|
|
|
68,243 |
|
|
|
|
|
|
| |
255 |
|
|
|
|
New Jersey Turnpike Authority, Revenue Bonds, Refunding Series 2015E, 5.000%, 1/01/45 |
|
|
1/25 at 100.00 |
|
|
|
247,708 |
|
|
|
|
|
|
| |
200 |
|
|
|
|
Ocean City, New Jersey, General Obligation Bonds, General Improvement Series 2019, 2.250%, 9/15/33 |
|
|
9/26 at 100.00 |
|
|
|
157,485 |
|
|
|
|
|
|
| |
300 |
|
|
|
|
Salem County Pollution Control Financing Authority, New Jersey, Revenue Bonds, Atlantic City Electric Company Project, Refunding
Series 2020, 2.250%, 6/01/29 |
|
|
No Opt. Call |
|
|
|
255,279 |
|
|
|
|
|
|
| |
250 |
|
|
|
|
South Jersey Transportation Authority, New Jersey, Transportation System Revenue Bonds, Refunding Series 2019A, 5.000%, 11/01/31
- AGM Insured |
|
|
11/29 at 100.00 |
|
|
|
258,127 |
|
|
|
|
|
|
| |
30 |
|
|
|
|
South Jersey Transportation Authority, New Jersey, Transportation System Revenue Bonds, Series 2020A, 5.000%, 11/01/45 |
|
|
11/30 at 100.00 |
|
|
|
28,482 |
|
|
|
|
|
|
| |
125 |
|
|
|
|
Sussex County, New Jersey, General Obligation Bonds, Series 2019, 3.000%, 6/01/27 |
|
|
6/26 at 100.00 |
|
|
|
119,512 |
|
|
|
|
|
|
|
|
|
|
|
|
Tobacco Settlement Financing Corporation, New Jersey, Tobacco Settlement Asset-Backed Bonds, Series 2018A: |
|
|
|
|
|
|
|
|
| |
215 |
|
|
|
|
4.000%, 6/01/37 |
|
|
6/28 at 100.00 |
|
|
|
200,370 |
|
| |
305 |
|
|
|
|
5.250%, 6/01/46 |
|
|
6/28 at 100.00 |
|
|
|
299,838 |
|
|
|
|
|
|
| |
450 |
|
|
|
|
Tobacco Settlement Financing Corporation, New Jersey, Tobacco Settlement Asset-Backed Bonds, Series 2018B, 5.000%,
6/01/46 |
|
|
6/28 at 100.00 |
|
|
|
417,793 |
|
|
|
|
|
|
| |
535 |
|
|
|
|
Union County Improvement Authority, New Jersey, General Obligation Lease Bonds, Juvenile Detention Center Facility Project,
Refunding Series 2015A, 5.500%, 5/01/30 |
|
|
No Opt. Call |
|
|
|
588,294 |
|
|
|
|
|
|
| |
170 |
|
|
|
|
Union County Utilities Authority, New Jersey, Solid Waste System County Deficiency
Revenue Bonds, Series 2011A, 5.000%, 6/15/41 |
|
|
12/23 at 100.00 |
|
|
|
170,025 |
|
|
|
|
|
|
|
Total New Jersey |
|
|
|
|
|
|
17,375,567 |
|
|
|
|
|
|
|
|
|
|
|
|
New York - 6.8% |
|
|
|
|
|
|
|
|
|
|
|
|
|
| |
500 |
|
|
|
|
Dormitory Authority of the State of New York, Revenue Bonds, School Districts Financing Program, Series 2021A, 5.000%, 10/01/32 -
AGM Insured |
|
|
10/29 at 100.00 |
|
|
|
527,170 |
|
|
|
|
|
|
| |
3,000 |
|
|
|
|
Liberty Development Corporation, New York, Goldman Sachs Headquarters Revenue Bonds Series 2007, 5.500%, 10/01/37 |
|
|
No Opt. Call |
|
|
|
3,118,661 |
|
|
|
|
|
|
| |
1,500 |
|
|
|
|
Long Island Power Authority, New York, Electric System General Revenue Bonds, Series 2017, 5.000%, 9/01/42 |
|
|
9/27 at 100.00 |
|
|
|
1,502,876 |
|
|
|
|
|
|
| |
2,050 |
|
|
|
|
Long Island Power Authority, New York, Electric System General Revenue Bonds, Series 2018, 5.000%, 9/01/39 |
|
|
9/28 at 100.00 |
|
|
|
2,086,141 |
|
|
|
|
|
|
| |
1,390 |
|
|
|
|
Metropolitan Transportation Authority, New York, Transportation Revenue Bonds, Green Climate Bond Certified Series 2020C-1,
5.000%, 11/15/50 |
|
|
5/30 at 100.00 |
|
|
|
1,323,902 |
|
|
|
|
|
|
| |
750 |
|
|
|
|
Metropolitan Transportation Authority, New York, Transportation Revenue Bonds, Refunding Green Climate Certified Series 2020E,
5.000%, 11/15/30 |
|
|
No Opt. Call |
|
|
|
770,695 |
|
|
|
|
|
|
|
|
|
|
|
|
New York City Transitional Finance Authority, New York, Future Tax Secured Bonds, Subordinate Fiscal Series 2024A-1: |
|
|
|
|
|
|
|
|
| |
1,450 |
|
|
|
|
4.000%, 5/01/53 |
|
|
5/33 at 100.00 |
|
|
|
1,203,166 |
|
| |
1,510 |
|
|
|
|
5.000%, 5/01/53 |
|
|
5/33 at 100.00 |
|
|
|
1,498,156 |
|
50
|
|
|
|
|
|
|
|
|
|
|
|
|
|
|
|
Principal
Amount (000) |
|
|
|
|
Description (a) |
|
|
Optional Call
Provisions (b) |
|
|
|
Value |
|
|
|
|
|
|
|
|
|
|
|
|
New York (continued) |
|
|
|
|
|
|
|
|
| $ |
1,230 |
|
|
|
|
New York City, New York, General Obligation Bonds, Fiscal 2021 Series C, 5.000%, 8/01/42 |
|
|
8/30 at 100.00 |
|
|
$ |
1,246,601 |
|
|
|
|
|
|
| |
315 |
|
|
|
|
Port Authority of New York and New Jersey, Consolidated Revenue Bonds, One Hundred Seventy Ninth Series 2013, 5.000%,
12/01/43 |
|
|
12/23 at 100.00 |
|
|
|
315,371 |
|
|
|
|
|
|
| |
1,000 |
|
|
|
|
Suffolk Tobacco Asset Securitization Corporation, New York, Tobacco Settlement Asset-Backed Bonds, Senior Series 2021A-2, 5.000%, 6/01/31 |
|
|
No Opt. Call |
|
|
|
1,045,762 |
|
|
|
|
|
|
| |
3,000 |
|
|
|
|
Triborough Bridge and Tunnel Authority, New York, Payroll Mobility Tax Bonds, Senior Lien
Subseries 2021A-1, 2.000%, 5/15/45, (Mandatory Put 5/15/26) |
|
|
No Opt. Call |
|
|
|
2,793,487 |
|
|
|
|
|
|
|
Total New York |
|
|
|
|
|
|
17,431,988 |
|
|
|
|
|
|
|
|
|
|
|
|
North Carolina - 1.1% |
|
|
|
|
|
|
|
|
|
|
|
|
|
| |
1,000 |
|
|
|
|
North Carolina Capital Facilities Finance Agency, Revenue Bonds, Duke University Project, Refunding Series 2016B, 5.000%,
7/01/42 |
|
|
10/26 at 100.00 |
|
|
|
1,004,106 |
|
|
|
|
|
|
|
|
|
|
|
|
North Carolina Turnpike Authority, Triangle Expressway System Revenue Bonds, Refunding Senior Lien Series 2017: |
|
|
|
|
|
|
|
|
| |
1,095 |
|
|
|
|
5.000%, 1/01/31 - AGM Insured |
|
|
1/27 at 100.00 |
|
|
|
1,123,530 |
|
| |
700 |
|
|
|
|
5.000%, 1/01/32 |
|
|
1/27 at 100.00 |
|
|
|
709,798 |
|
|
|
|
|
|
|
Total North Carolina |
|
|
|
|
|
|
2,837,434 |
|
|
|
|
|
|
|
|
|
|
|
|
Ohio - 4.2% |
|
|
|
|
|
|
|
|
|
|
|
|
|
| |
570 |
|
|
|
|
Buckeye Tobacco Settlement Financing Authority, Ohio, Tobacco Settlement Asset-Backed Revenue Bonds, Refunding Senior Lien Series
2020A-2 Class 1, 4.000%, 6/01/48 |
|
|
6/30 at 100.00 |
|
|
|
456,201 |
|
|
|
|
|
|
| |
8,580 |
|
|
|
|
Buckeye Tobacco Settlement Financing Authority, Ohio, Tobacco Settlement Asset-Backed Revenue Bonds, Refunding Senior Lien Series
2020B-2 Class 2, 5.000%, 6/01/55 |
|
|
6/30 at 100.00 |
|
|
|
7,028,690 |
|
|
|
|
|
|
| |
3,095 |
|
|
|
|
Central Ohio Transit Authority, Ohio, General Obligation Bonds, Capital Facilities
Limited Tax Series 2023, 5.000%, 12/01/48 |
|
|
12/33 at 100.00 |
|
|
|
3,119,268 |
|
|
|
|
|
|
|
Total Ohio |
|
|
|
|
|
|
10,604,159 |
|
|
|
|
|
|
|
|
|
|
|
|
Oklahoma - 0.2% |
|
|
|
|
|
|
|
|
|
|
|
|
|
| |
500 |
|
|
|
|
Oklahoma Development Finance Authority, Health System Revenue Bonds, OU Medicine Project,
Series 2018B, 5.500%, 8/15/57 |
|
|
8/28 at 100.00 |
|
|
|
427,598 |
|
|
|
|
|
|
|
Total Oklahoma |
|
|
|
|
|
|
427,598 |
|
|
|
|
|
|
|
|
|
|
|
|
Pennsylvania - 4.3% |
|
|
|
|
|
|
|
|
|
|
|
|
|
| |
160 |
|
|
|
|
Adams County, Pennsylvania, General Obligation Bonds, Series 2017B, 2.500%, 11/15/29 |
|
|
11/25 at 100.00 |
|
|
|
141,196 |
|
|
|
|
|
|
| |
50 |
|
|
|
|
Allegheny County Higher Education Building Authority, Pennsylvania, Revenue Bonds, Robert Morris University, Series 2017, 5.000%,
10/15/37 |
|
|
10/27 at 100.00 |
|
|
|
45,473 |
|
|
|
|
|
|
| |
465 |
|
|
|
|
Allegheny County Hospital Development Authority, Pennsylvania, Revenue Bonds, Allegheny Health Network Obligated Group Issue,
Series 2018A, 4.000%, 4/01/44 |
|
|
4/28 at 100.00 |
|
|
|
365,212 |
|
|
|
|
|
|
| |
115 |
|
|
|
|
Allegheny County Hospital Development Authority, Pennsylvania, Revenue Bonds, University of Pittsburgh Medical Center, Series
2019A, 4.000%, 7/15/35 |
|
|
7/29 at 100.00 |
|
|
|
108,118 |
|
|
|
|
|
|
| |
220 |
|
|
(c) |
|
Allegheny County, Pennsylvania, General Obligation Bonds, Series 2013C-72, 5.250%,
12/01/32, (Pre-refunded 12/01/23) |
|
|
12/23 at 100.00 |
|
|
|
220,239 |
|
|
|
|
|
|
| |
230 |
|
|
|
|
Allentown Neighborhood Improvement Zone Development Authority, Pennsylvania, Tax Revenue Bonds, City Center Refunding Project,
Series 2017, 5.000%, 5/01/42, 144A |
|
|
5/27 at 100.00 |
|
|
|
210,758 |
|
|
|
|
|
|
| |
105 |
|
|
|
|
Avon Grove School District, Chester County, Pennsylvania, General Obligation Bonds, Series 2021A, 4.000%, 11/15/37 |
|
|
5/29 at 100.00 |
|
|
|
94,820 |
|
51
|
|
|
| NUW |
|
Nuveen AMT-Free Municipal Value Fund (continued) Portfolio of Investments October 31, 2023 |
|
|
|
|
|
|
|
|
|
|
|
|
|
|
|
|
Principal
Amount (000) |
|
|
|
|
Description (a) |
|
|
Optional Call
Provisions (b) |
|
|
|
Value |
|
|
|
|
|
|
|
|
|
|
|
|
Pennsylvania (continued) |
|
|
|
|
|
|
|
|
| $ |
380 |
|
|
|
|
Berks County Industrial Development Authority, Pennsylvania, Health System Revenue Bonds, Tower Health Project, Series 2017,
5.000%, 11/01/50 |
|
|
11/27 at 100.00 |
|
|
$ |
207,306 |
|
|
|
|
|
|
| |
155 |
|
|
|
|
Berks County Industrial Development Authority, Pennsylvania, Healthcare Facilities Revenue Bonds, Highlands at Wyomissing, Series
2017A, 5.000%, 5/15/42 |
|
|
5/27 at 100.00 |
|
|
|
133,293 |
|
|
|
|
|
|
| |
15 |
|
|
|
|
Berks County Municipal Authority, Pennsylvania, Revenue Bonds, Alvernia University Project, Series 2020, 5.000%,
10/01/39 |
|
|
10/29 at 100.00 |
|
|
|
13,098 |
|
|
|
|
|
|
| |
125 |
|
|
|
|
Bethel Park School District, Allegheny County, Pennsylvania, General Obligation Bonds, Refunding Series 2016, 4.000%,
8/01/33 |
|
|
8/26 at 100.00 |
|
|
|
123,006 |
|
|
|
|
|
|
| |
45 |
|
|
|
|
Boyertown Area School District, Berks and Montgomery Counties, Pennsylvania, General Obligation Bonds, Series 2015, 5.000%,
10/01/38 |
|
|
4/24 at 100.00 |
|
|
|
45,140 |
|
|
|
|
|
|
| |
155 |
|
|
|
|
Bucks County Industrial Development Authority, Pennsylvania, Hospital Revenue Bonds, Saint Luke’s University Health Network
Project, Series 2021, 3.000%, 8/15/53 |
|
|
8/30 at 100.00 |
|
|
|
91,009 |
|
|
|
|
|
|
| |
70 |
|
|
|
|
Bucks County Industrial Development Authority, Pennsylvania, Revenue Bonds, School Lane Charter School Project, Series 2016,
5.125%, 3/15/36 |
|
|
3/27 at 100.00 |
|
|
|
67,733 |
|
|
|
|
|
|
| |
20 |
|
|
|
|
Bucks County Water and Sewer Authority, Pennsylvania, Water System Revenue Bonds, Series 2020, 2.125%, 12/01/45 |
|
|
12/28 at 100.00 |
|
|
|
11,204 |
|
|
|
|
|
|
| |
115 |
|
|
|
|
Canon-McMillan School District, Washington County, Pennsylvania, General Obligation Bonds, Series 2014D, 5.000%,
12/15/39 |
|
|
12/24 at 100.00 |
|
|
|
115,184 |
|
|
|
|
|
|
| |
100 |
|
|
(c) |
|
Centre County Hospital Authority, Pennsylvania, Hospital Revenue Bonds, Mount Nittany Medical Center Project, Series 2016A,
5.000%, 11/15/46, (Pre-refunded 11/15/25) |
|
|
11/25 at 100.00 |
|
|
|
102,220 |
|
|
|
|
|
|
| |
75 |
|
|
|
|
Chester County Health and Education Facilities Authority, Pennsylvania, Health System Revenue Bonds, Main Line Health System,
Series 2017A, 4.000%, 10/01/37 |
|
|
10/27 at 100.00 |
|
|
|
66,376 |
|
|
|
|
|
|
| |
190 |
|
|
|
|
Chester County Health and Education Facilities Authority, Pennsylvania, Health System Revenue Bonds, Main Line Health System,
Series 2020A, 4.000%, 9/01/50 |
|
|
9/30 at 100.00 |
|
|
|
151,794 |
|
|
|
|
|
|
| |
35 |
|
|
|
|
Chester County Health and Education Facilities Authority, Pennsylvania, Revenue Bonds, Simpson Senior Services Project, Series
2019, 5.000%, 12/01/51 |
|
|
12/25 at 103.00 |
|
|
|
22,661 |
|
|
|
|
|
|
| |
20 |
|
|
|
|
Chester County Industrial Development Authority, Pennsylvania, Avon Grove Charter School Revenue Bonds, Series 2017A, 5.000%,
12/15/47 |
|
|
12/27 at 100.00 |
|
|
|
17,001 |
|
|
|
|
|
|
| |
15 |
|
|
|
|
Chester County Industrial Development Authority, Pennsylvania, Student Housing Revenue Bonds, University Student Housing, LLC
Project at West Chester University Series 2013A, 5.000%, 8/01/45 |
|
|
12/23 at 100.00 |
|
|
|
12,945 |
|
|
|
|
|
|
| |
35 |
|
|
|
|
Clarion County Industrial Development Authority, Pennsylvania, Revenue Bonds, Clarion University Foundation Inc. Student Housing
Project at Clarion University, Series 2014A, 5.000%, 7/01/45 |
|
|
7/24 at 100.00 |
|
|
|
33,370 |
|
|
|
|
|
|
| |
100 |
|
|
|
|
Colonial School District, Montgomery County, Pennsylvania, General Obligation Bonds, Series 2020, 5.000%, 2/15/44 |
|
|
2/27 at 100.00 |
|
|
|
101,626 |
|
|
|
|
|
|
|
|
|
|
|
|
Commonwealth Financing Authority, Pennsylvania, State Appropriation Lease Bonds, Master Settlement, Series 2018: |
|
|
|
|
|
|
|
|
| |
40 |
|
|
|
|
5.000%, 6/01/33 |
|
|
6/28 at 100.00 |
|
|
|
40,924 |
|
| |
355 |
|
|
|
|
4.000%, 6/01/39 - AGM Insured |
|
|
6/28 at 100.00 |
|
|
|
318,037 |
|
|
|
|
|
|
| |
70 |
|
|
|
|
Cumberland County Municipal Authority, Pennsylvania, Revenue Bonds, Asbury Pennsylvania Obligated Group, Refunding Series
2019, 5.000%, 1/01/45 |
|
|
1/25 at 104.00 |
|
|
|
54,914 |
|
52
|
|
|
|
|
|
|
|
|
|
|
|
|
|
|
|
Principal
Amount (000) |
|
|
|
|
Description (a) |
|
|
Optional Call
Provisions (b) |
|
|
|
Value |
|
|
|
|
|
|
|
|
|
|
|
|
Pennsylvania (continued) |
|
|
|
|
|
|
|
|
|
|
|
|
|
|
Cumberland County Municipal Authority, Pennsylvania, Revenue Bonds, Diakon Lutheran Social Ministries Project, Series
2015: |
|
|
|
|
|
|
|
|
| $ |
60 |
|
|
(c) |
|
4.000%, 1/01/33, (Pre-refunded 1/01/25) |
|
|
1/25 at 100.00 |
|
|
$ |
59,983 |
|
| |
45 |
|
|
|
|
4.000%, 1/01/33 |
|
|
1/25 at 100.00 |
|
|
|
40,309 |
|
| |
20 |
|
|
(c) |
|
4.000%, 1/01/33, (Pre-refunded 1/01/25) |
|
|
1/25 at 100.00 |
|
|
|
19,994 |
|
| |
65 |
|
|
|
|
5.000%, 1/01/38 |
|
|
1/25 at 100.00 |
|
|
|
61,155 |
|
| |
55 |
|
|
(c) |
|
5.000%, 1/01/38, (Pre-refunded 1/01/25) |
|
|
1/25 at 100.00 |
|
|
|
55,603 |
|
| |
15 |
|
|
(c) |
|
5.000%, 1/01/38, (Pre-refunded 1/01/25) |
|
|
1/25 at 100.00 |
|
|
|
15,165 |
|
|
|
|
|
|
| |
100 |
|
|
|
|
Cumberland County Municipal Authority, Pennsylvania, Revenue Bonds, Diakon Lutheran Social Ministries Project, Series 2016,
5.000%, 1/01/29 |
|
|
1/26 at 100.00 |
|
|
|
99,053 |
|
|
|
|
|
|
|
|
|
|
|
|
Cumberland County Municipal Authority, Pennsylvania, Revenue Bonds, Diakon Lutheran Social Ministries Project, Series
2019A: |
|
|
|
|
|
|
|
|
| |
25 |
|
|
|
|
4.125%, 1/01/38 |
|
|
1/29 at 100.00 |
|
|
|
21,185 |
|
| |
20 |
|
|
(c) |
|
5.000%, 1/01/39, (Pre-refunded 1/01/29) |
|
|
1/29 at 100.00 |
|
|
|
21,092 |
|
| |
5 |
|
|
(c) |
|
5.000%, 1/01/39, (Pre-refunded 1/01/29) |
|
|
1/29 at 100.00 |
|
|
|
5,273 |
|
| |
5 |
|
|
|
|
5.000%, 1/01/39 |
|
|
1/29 at 100.00 |
|
|
|
4,605 |
|
|
|
|
|
|
| |
100 |
|
|
|
|
Cumberland County Municipal Authority, Pennsylvania, Revenue Bonds, Dickinson College Project, Second Series 2017A, 5.000%,
11/01/39 |
|
|
11/27 at 100.00 |
|
|
|
101,454 |
|
|
|
|
|
|
| |
200 |
|
|
|
|
Cumberland County Municipal Authority, Pennsylvania, Revenue Bonds, Penn State Health, Series 2019, 4.000%, 11/01/44 |
|
|
11/29 at 100.00 |
|
|
|
163,775 |
|
|
|
|
|
|
| |
30 |
|
|
|
|
Dallas Area Municipal Authority, Pennsylvania, Revenue Bonds, Misericordia University Project, Series 2019, 5.000%,
5/01/48 |
|
|
5/29 at 100.00 |
|
|
|
24,490 |
|
|
|
|
|
|
| |
30 |
|
|
|
|
Dallas Area Municipal Authority, Pennsylvania, Revenue Bonds, Misericordia University, Series 2014, 5.000%, 5/01/37 |
|
|
5/24 at 100.00 |
|
|
|
27,301 |
|
|
|
|
|
|
| |
55 |
|
|
|
|
Dauphin County General Authority, Pennsylvania, Health System Revenue Bonds, Pinnacle Health System Project, Refunding Series
2016A, 5.000%, 6/01/35 |
|
|
6/26 at 100.00 |
|
|
|
55,372 |
|
|
|
|
|
|
|
|
|
|
|
|
Delaware River Joint Toll Bridge Commission, New Jersey and Pennsylvania, Bridge System Revenue Bonds, Series 2017: |
|
|
|
|
|
|
|
|
| |
245 |
|
|
|
|
5.000%, 7/01/42 |
|
|
7/27 at 100.00 |
|
|
|
247,179 |
|
| |
540 |
|
|
|
|
5.000%, 7/01/47 |
|
|
7/27 at 100.00 |
|
|
|
538,621 |
|
|
|
|
|
|
| |
295 |
|
|
|
|
Delaware River Joint Toll Bridge Commission, New Jersey and Pennsylvania, Bridge System Revenue Bonds, Series 2019A, 5.000%,
7/01/28 |
|
|
No Opt. Call |
|
|
|
308,829 |
|
|
|
|
|
|
|
|
|
|
|
|
Doylestown Hospital Authority, Pennsylvania, Hospital Revenue Bonds, Series 2016A: |
|
|
|
|
|
|
|
|
| |
185 |
|
|
|
|
5.000%, 7/01/41 |
|
|
No Opt. Call |
|
|
|
155,912 |
|
| |
40 |
|
|
|
|
5.000%, 7/01/41 |
|
|
No Opt. Call |
|
|
|
41,102 |
|
|
|
|
|
|
| |
25 |
|
|
|
|
Doylestown Hospital Authority, Pennsylvania, Hospital Revenue Bonds, Series 2019A, 4.000%, 7/01/45 |
|
|
No Opt. Call |
|
|
|
17,406 |
|
|
|
|
|
|
| |
150 |
|
|
|
|
Dubois Hospital Authority, Pennsylvania, Hospital Revenue Bonds, Penn Highlands Healthcare, Series 2018, 5.000%, 7/15/48 |
|
|
1/28 at 100.00 |
|
|
|
137,046 |
|
|
|
|
|
|
| |
30 |
|
|
(c) |
|
East Hempfield Township Industrial Development Authority, Pennsylvania, Student Services Inc - Student Housing Project at
Millersville University, Series 2014, 5.000%, 7/01/46, (Pre-refunded 7/01/24) |
|
|
7/24 at 100.00 |
|
|
|
30,174 |
|
|
|
|
|
|
| |
100 |
|
|
(c) |
|
East Hempfield Township Industrial Development Authority, Pennsylvania, Student Services Inc - Student Housing Project at
Millersville University, Series 2015, 5.000%, 7/01/47, (Pre-refunded 7/01/25) |
|
|
7/25 at 100.00 |
|
|
|
101,570 |
|
|
|
|
|
|
| |
25 |
|
|
|
|
Easton Area School District, Northampton County, Pennsylvania, General Obligation Bonds, Series 2020B, 5.000%, 2/01/31 |
|
|
2/28 at 100.00 |
|
|
|
26,180 |
|
|
|
|
|
|
| |
60 |
|
|
|
|
Erie Higher Education Building Authority, Pennsylvania, Revenue Bonds, Gannon University, Series 2016, 4.000%, 5/01/46 |
|
|
11/26 at 100.00 |
|
|
|
43,513 |
|
53
|
|
|
| NUW |
|
Nuveen AMT-Free Municipal Value Fund (continued) Portfolio of Investments October 31, 2023 |
|
|
|
|
|
|
|
|
|
|
|
|
|
|
|
|
Principal
Amount (000) |
|
|
|
|
Description (a) |
|
|
Optional Call
Provisions (b) |
|
|
|
Value |
|
|
|
|
|
|
|
|
|
|
|
|
Pennsylvania (continued) |
|
|
|
|
|
|
|
|
| $ |
75 |
|
|
|
|
General Authority of Southcentral Pennsylvania, Revenue Bonds, AICUP Financing Program-York College of Pennsylvania, Series 2017
PP4, 3.375%, 11/01/37 |
|
|
10/27 at 100.00 |
|
|
$ |
60,129 |
|
|
|
|
|
|
|
|
|
|
|
|
Huntingdon County General Authority, Pennsylvania, Revenue Bonds, Juniata College, Series 2016OO2: |
|
|
|
|
|
|
|
|
| |
15 |
|
|
|
|
3.250%, 5/01/36 |
|
|
5/26 at 100.00 |
|
|
|
11,773 |
|
| |
35 |
|
|
|
|
3.500%, 5/01/41 |
|
|
5/26 at 100.00 |
|
|
|
25,183 |
|
|
|
|
|
|
| |
20 |
|
|
|
|
Lancaster County Hospital Authority, Pennsylvania, Health Center Revenue Bonds, Masonic Villages Project, Series 2015, 5.000%,
11/01/35 |
|
|
5/25 at 100.00 |
|
|
|
19,869 |
|
|
|
|
|
|
| |
40 |
|
|
|
|
Lancaster County Hospital Authority, Pennsylvania, Health Center Revenue Bonds, Saint Anne’s Retirement Community, Inc.,
Series 2020, 5.000%, 3/01/50 |
|
|
3/27 at 102.00 |
|
|
|
28,938 |
|
|
|
|
|
|
| |
100 |
|
|
|
|
Lancaster County Hospital Authority, Revenue Bonds, University of Pennsylvania Health System, Refunding Series 2016B, 5.000%,
8/15/46 |
|
|
8/26 at 100.00 |
|
|
|
96,357 |
|
|
|
|
|
|
| |
155 |
|
|
|
|
Lancaster County Hospital Authority, Revenue Bonds, University of Pennsylvania Health System, Series 2016A, 5.000%,
8/15/42 |
|
|
8/26 at 100.00 |
|
|
|
153,187 |
|
|
|
|
|
|
| |
25 |
|
|
|
|
Lancaster School District, Lancaster County, Pennsylvania, General Obligation Bonds, Series 2020, 4.000%, 6/01/35 - AGM
Insured |
|
|
12/28 at 100.00 |
|
|
|
24,001 |
|
|
|
|
|
|
|
|
|
|
|
|
Lehigh County Authority, Pennsylvania, Water and Sewer Revenue Bonds, Allentown Concession, Series 2013A: |
|
|
|
|
|
|
|
|
| |
105 |
|
|
(c) |
|
5.125%, 12/01/47, (Pre-refunded 12/01/23) |
|
|
12/23 at 100.00 |
|
|
|
105,104 |
|
| |
95 |
|
|
|
|
5.125%, 12/01/47 |
|
|
12/23 at 100.00 |
|
|
|
95,013 |
|
|
|
|
|
|
| |
100 |
|
|
|
|
Lehigh County General Purpose Authority, Pennsylvania, Revenue Bonds, Good Shepherd Group, Refunding Series 2016, 4.000%,
11/01/41 |
|
|
5/26 at 100.00 |
|
|
|
79,463 |
|
|
|
|
|
|
| |
100 |
|
|
|
|
Monroe County Industrial Development Authority, Pennsylvania, Special Obligation Revenue Bonds, Tobyhanna Township Project,
Series 2014, 6.875%, 7/01/33, 144A |
|
|
7/24 at 100.00 |
|
|
|
94,246 |
|
|
|
|
|
|
| |
50 |
|
|
|
|
Montgomery County Higher Education and Health Authority, Pennsylvania, Revenue Bonds, Thomas Jefferson University, Series 2018A,
5.000%, 9/01/48 |
|
|
9/28 at 100.00 |
|
|
|
46,925 |
|
|
|
|
|
|
|
|
|
|
|
|
Montgomery County Higher Education and Health Authority, Pennsylvania, Revenue Bonds, Thomas Jefferson University, Series
2019: |
|
|
|
|
|
|
|
|
| |
50 |
|
|
|
|
4.000%, 9/01/44 |
|
|
9/29 at 100.00 |
|
|
|
41,948 |
|
|
|
|
|
|
| |
25 |
|
|
|
|
4.000%, 9/01/49 |
|
|
9/29 at 100.00 |
|
|
|
19,929 |
|
|
|
|
|
|
| |
200 |
|
|
(c) |
|
Montgomery County Industrial Development Authority, Pennsylvania, Health System Revenue Bonds, Albert Einstein Healthcare Network
Issue, Series 2015A, 5.250%, 1/15/45, (Pre-refunded 1/15/25) |
|
|
1/25 at 100.00 |
|
|
|
203,080 |
|
|
|
|
|
|
| |
200 |
|
|
|
|
Montgomery County Industrial Development Authority, Pennsylvania, Revenue Bonds, ACTS Retirement-Life Communities, Inc. Obligated
Group, Series 2016, 5.000%, 11/15/36 |
|
|
11/26 at 100.00 |
|
|
|
192,758 |
|
|
|
|
|
|
| |
90 |
|
|
|
|
Northampton County General Purpose Authority, Pennsylvania, Revenue Bonds, Lafayette College, Refunding Series 2018, 4.000%,
11/01/38 |
|
|
11/28 at 100.00 |
|
|
|
79,644 |
|
|
|
|
|
|
| |
55 |
|
|
|
|
Northampton County Industrial Development Authority, Pennsylvania, Revenue Bonds, Morningstar Senior Living, Inc., Series 2019,
5.000%, 11/01/44 |
|
|
11/26 at 103.00 |
|
|
|
43,861 |
|
|
|
|
|
|
| |
140 |
|
|
|
|
Pennsylvania Economic Development Financing Authority, Parking System Revenue Bonds, Capitol Region Parking System, Series 2013A,
5.250%, 1/01/44 - AGM Insured |
|
|
1/24 at 100.00 |
|
|
|
140,091 |
|
|
|
|
|
|
| |
250 |
|
|
|
|
Pennsylvania Economic Development Financing Authority, Revenue Bonds, Pennsylvania-American Water Company, Refunding Series 2019,
3.000%, 4/01/39 |
|
|
10/29 at 100.00 |
|
|
|
186,255 |
|
54
|
|
|
|
|
|
|
|
|
|
|
|
|
|
|
|
Principal
Amount (000) |
|
|
|
|
Description (a) |
|
|
Optional Call
Provisions (b) |
|
|
|
Value |
|
|
|
|
|
|
|
|
|
|
|
|
Pennsylvania (continued) |
|
|
|
|
|
|
|
|
|
|
|
|
|
|
Pennsylvania Higher Educational Facilities Authority, Revenue Bonds, University of the Sciences in Philadelphia, Series
2012: |
|
|
|
|
|
|
|
|
| $ |
35 |
|
|
|
|
4.000%, 11/01/39 |
|
|
12/23 at 100.00 |
|
|
$ |
27,894 |
|
| |
60 |
|
|
|
|
5.000%, 11/01/42 |
|
|
12/23 at 100.00 |
|
|
|
55,740 |
|
|
|
|
|
|
| |
300 |
|
|
|
|
Pennsylvania Higher Educational Facilities Authority, Revenue Bonds, University Properties Inc. Student Housing Project at East
Stroudsburg University of Pennsylvania, Series 2016A, 5.000%, 7/01/35 |
|
|
7/26 at 100.00 |
|
|
|
280,634 |
|
|
|
|
|
|
| |
45 |
|
|
|
|
Pennsylvania Housing Finance Agency, Single Family Mortgage Revenue Bonds, Series
2016-119, 3.500%, 10/01/36 |
|
|
4/25 at 100.00 |
|
|
|
38,578 |
|
|
|
|
|
|
| |
350 |
|
|
|
|
Pennsylvania Housing Finance Agency, Single Family Mortgage Revenue Bonds, Series
2016-120, 3.200%, 4/01/40 |
|
|
10/25 at 100.00 |
|
|
|
275,153 |
|
|
|
|
|
|
| |
450 |
|
|
|
|
Pennsylvania Housing Finance Agency, Single Family Mortgage Revenue Bonds, Series
2016-121, 3.200%, 10/01/41 |
|
|
10/25 at 100.00 |
|
|
|
343,597 |
|
|
|
|
|
|
| |
65 |
|
|
|
|
Pennsylvania Housing Finance Agency, Single Family Mortgage Revenue Bonds, Series 2017-123B, 3.450%, 10/01/32 |
|
|
10/26 at 100.00 |
|
|
|
59,293 |
|
|
|
|
|
|
| |
45 |
|
|
|
|
Pennsylvania Housing Finance Agency, Single Family Mortgage Revenue Bonds, Series 2017-125B, 3.700%, 10/01/47 |
|
|
4/27 at 100.00 |
|
|
|
38,666 |
|
|
|
|
|
|
| |
250 |
|
|
|
|
Pennsylvania Housing Finance Agency, Single Family Mortgage Revenue Bonds, Series
2019-129, 3.350%, 10/01/45 |
|
|
10/28 at 100.00 |
|
|
|
183,477 |
|
|
|
|
|
|
| |
125 |
|
|
|
|
Pennsylvania Housing Finance Agency, Single Family Mortgage Revenue Bonds, Series 2019-130A, 3.000%, 10/01/46 |
|
|
10/28 at 100.00 |
|
|
|
81,889 |
|
|
|
|
|
|
| |
45 |
|
|
|
|
Pennsylvania Housing Finance Agency, Single Family Mortgage Revenue Bonds, Series
2020-133, 2.500%, 10/01/45 |
|
|
10/29 at 100.00 |
|
|
|
27,614 |
|
|
|
|
|
|
| |
100 |
|
|
|
|
Pennsylvania Turnpike Commission, Motor License Fund-Enhanced Turnpike Special Revenue Bonds, Subordinate Series 2014A, 4.750%,
12/01/37 |
|
|
12/26 at 100.00 |
|
|
|
100,116 |
|
|
|
|
|
|
| |
100 |
|
|
|
|
Pennsylvania Turnpike Commission, Oil Franchise Tax Revenue Bonds, Subordinate Series 2018B, 5.000%, 12/01/48 |
|
|
12/28 at 100.00 |
|
|
|
95,437 |
|
|
|
|
|
|
| |
585 |
|
|
|
|
Pennsylvania Turnpike Commission, Turnpike Revenue Bonds, Series 2015B, 5.000%, 12/01/45 |
|
|
12/25 at 100.00 |
|
|
|
575,155 |
|
|
|
|
|
|
| |
50 |
|
|
|
|
Pennsylvania Turnpike Commission, Turnpike Revenue Bonds, Subordinate Series 2019A, 4.000%, 12/01/49 |
|
|
12/29 at 100.00 |
|
|
|
40,686 |
|
|
|
|
|
|
| |
25 |
|
|
|
|
Philadelphia Authority for Industrial Development, Pennsylvania, Charter School Revenue Bonds, Philadelphia Performing Arts: A
String Theory Charter School, Series 2020, 5.000%, 6/15/50, 144A |
|
|
6/28 at 100.00 |
|
|
|
20,970 |
|
|
|
|
|
|
| |
70 |
|
|
|
|
Philadelphia Authority for Industrial Development, Pennsylvania, Revenue Bonds, La Salle University, Series 2017, 3.625%,
5/01/35 |
|
|
11/27 at 100.00 |
|
|
|
53,261 |
|
|
|
|
|
|
|
|
|
|
|
|
Philadelphia Authority for Industrial Development, Pennsylvania, Revenue Bonds, University of the Arts, Series 2017: |
|
|
|
|
|
|
|
|
| |
45 |
|
|
|
|
5.000%, 3/15/45, 144A |
|
|
3/28 at 100.00 |
|
|
|
35,153 |
|
| |
5 |
|
|
(c) |
|
5.000%, 3/15/45, (Pre-refunded 3/15/28), 144A |
|
|
3/28 at 100.00 |
|
|
|
5,261 |
|
|
|
|
|
|
| |
150 |
|
|
|
|
Philadelphia Gas Works, Pennsylvania, Revenue Bonds, 1998 General Ordinance, Fifteenth Series 2017, 5.000%, 8/01/47 |
|
|
8/27 at 100.00 |
|
|
|
142,201 |
|
|
|
|
|
|
| |
105 |
|
|
|
|
Philadelphia Gas Works, Pennsylvania, Revenue Bonds, 1998 General Ordinance, Sixteenth Series 2020A, 5.000%, 8/01/50 - AGM
Insured |
|
|
8/30 at 100.00 |
|
|
|
103,609 |
|
|
|
|
|
|
| |
125 |
|
|
|
|
Philadelphia Gas Works, Pennsylvania, Revenue Bonds, Refunding Thirteenth Series 2015, 5.000%, 8/01/30 |
|
|
8/25 at 100.00 |
|
|
|
125,811 |
|
|
|
|
|
|
| |
100 |
|
|
|
|
Philadelphia Hospitals and Higher Education Facilities Authority, Pennsylvania, Hospital Revenue Bonds, Temple University Health
System Obligated Group, Series of 2017, 5.000%, 7/01/30 |
|
|
7/27 at 100.00 |
|
|
|
99,889 |
|
55
|
|
|
| NUW |
|
Nuveen AMT-Free Municipal Value Fund (continued) Portfolio of Investments October 31, 2023 |
|
|
|
|
|
|
|
|
|
|
|
|
|
|
|
|
Principal
Amount (000) |
|
|
|
|
Description (a) |
|
|
Optional Call
Provisions (b) |
|
|
|
Value |
|
|
|
|
|
|
|
|
|
|
|
|
Pennsylvania (continued) |
|
|
|
|
|
|
|
|
| $ |
100 |
|
|
|
|
Pittsburgh and Allegheny County Sports and Exhibition Authority, Pennsylvania, Parking Revenue Bonds, Series 2017, 5.000%,
12/15/34 |
|
|
12/27 at 100.00 |
|
|
$ |
101,596 |
|
|
|
|
|
|
| |
20 |
|
|
|
|
Pittsburgh Water and Sewer Authority, Pennsylvania, Water and Sewer System Revenue Bonds, First Lien Series 2020B, 4.000%,
9/01/45 - AGM Insured |
|
|
9/30 at 100.00 |
|
|
|
17,105 |
|
|
|
|
|
|
| |
25 |
|
|
|
|
Pittsburgh Water and Sewer Authority, Pennsylvania, Water and Sewer System Revenue Bonds, Refunding Subordinate Series 2019B,
4.000%, 9/01/34 - AGM Insured |
|
|
9/29 at 100.00 |
|
|
|
23,449 |
|
|
|
|
|
|
| |
200 |
|
|
|
|
Pottsville Hospital Authority, Pennsylvania, Hospital Revenue Bonds, Lehigh Valley Health Network, Series 2016B, 5.000%,
7/01/45 |
|
|
1/27 at 100.00 |
|
|
|
186,054 |
|
|
|
|
|
|
| |
35 |
|
|
|
|
Rostraver Township, Westmoreland County, Pennsylvania, General Obligation Bonds, Series 2018, 3.500%, 9/01/34 - AGM
Insured |
|
|
9/25 at 100.00 |
|
|
|
31,130 |
|
|
|
|
|
|
| |
80 |
|
|
|
|
Scranton, Lackawanna County, Pennsylvania, General Obligation Notes, Series 2016, 5.000%, 11/15/32 |
|
|
5/24 at 100.00 |
|
|
|
74,690 |
|
|
|
|
|
|
| |
100 |
|
|
|
|
Scranton-Lackawanna Health and Welfare Authority, Pennsylvania, University Revenue Bonds, Marywood University, Series 2016,
5.000%, 6/01/46 |
|
|
6/26 at 100.00 |
|
|
|
80,946 |
|
|
|
|
|
|
| |
210 |
|
|
|
|
Southcentral Pennsylvania General Authority, Revenue Bonds, Wellspan Health Obligated Group, Series 2019A, 5.000%,
6/01/49 |
|
|
6/29 at 100.00 |
|
|
|
201,183 |
|
|
|
|
|
|
| |
10 |
|
|
|
|
The Redevelopment Authority of the City of Scranton, Lackawanna county, Pennsylvania, Guaranteed Lease Revenue Bonds, Series
2016A, 5.000%, 11/15/28 |
|
|
5/24 at 100.00 |
|
|
|
9,757 |
|
|
|
|
|
|
| |
40 |
|
|
|
|
Upper Allegheny Joint Sanitary Authority, Allegheny County, Pennsylvania, Sewer Revenue Bonds, Refunding Series 2019A, 3.000%,
9/01/44 - AGM Insured |
|
|
9/29 at 100.00 |
|
|
|
27,671 |
|
|
|
|
|
|
| |
100 |
|
|
|
|
Upper Dublin School District, Montgomery County, Pennsylvania, General Obligation Bonds, Series 2021A, 4.000%, 9/15/38 |
|
|
3/29 at 100.00 |
|
|
|
90,884 |
|
|
|
|
|
|
| |
145 |
|
|
|
|
Washington County Industrial Development Authority, Pennsylvania, College Revenue Bonds, AICUP Financing Program-Washington and
Jefferson College Project, Series 2017-PP5, 3.375%, 11/01/36 |
|
|
11/27 at 100.00 |
|
|
|
116,529 |
|
|
|
|
|
|
| |
15 |
|
|
|
|
Washington County Redevelopment Authority, Pennsylvania, Tanger Outlet Victory Center Tax Increment Bonds, Series 2018, 5.000%,
7/01/35 |
|
|
1/28 at 100.00 |
|
|
|
13,884 |
|
|
|
|
|
|
| |
15 |
|
|
|
|
Westmoreland County Industrial Development Authority, Pennsylvania, Revenue Bonds, Excela Health Project, Series 2020A, 4.000%,
7/01/37 |
|
|
1/31 at 100.00 |
|
|
|
12,495 |
|
|
|
|
|
|
|
|
|
|
|
|
Williamsport Sanitary Authority, Lycoming County, Pennsylvania, Sewer Revenue Bonds, Series 2021.: |
|
|
|
|
|
|
|
|
| |
100 |
|
|
|
|
5.000%, 1/01/25 - BAM Insured |
|
|
No Opt. Call |
|
|
|
101,199 |
|
| |
25 |
|
|
|
|
5.000%, 1/01/28 - BAM Insured |
|
|
No Opt. Call |
|
|
|
26,225 |
|
|
|
|
|
|
|
Total Pennsylvania |
|
|
|
|
|
|
11,010,633 |
|
|
|
|
|
|
|
|
|
|
|
|
Puerto Rico - 3.0% |
|
|
|
|
|
|
|
|
|
|
|
|
|
|
|
|
|
|
|
Puerto Rico Sales Tax Financing Corporation, Sales Tax Revenue Bonds, Restructured
2018A-1: |
|
|
|
|
|
|
|
|
| |
1,170 |
|
|
|
|
0.000%, 7/01/33 |
|
|
7/28 at 86.06 |
|
|
|
732,847 |
|
| |
1,739 |
|
|
|
|
4.500%, 7/01/34 |
|
|
7/25 at 100.00 |
|
|
|
1,660,771 |
|
| |
3,812 |
|
|
|
|
5.000%, 7/01/58 |
|
|
7/28 at 100.00 |
|
|
|
3,337,436 |
|
|
|
|
|
|
| |
710 |
|
|
|
|
Puerto Rico Sales Tax Financing Corporation, Sales Tax Revenue Bonds, Restructured Cofina Project Series 2019A-2A, 4.550%, 7/01/40 |
|
|
7/28 at 100.00 |
|
|
|
631,982 |
|
|
|
|
|
|
|
|
|
|
|
|
Puerto Rico Sales Tax Financing Corporation, Sales Tax Revenue Bonds, Taxable Restructured Cofina Project Series 2019A-2: |
|
|
|
|
|
|
|
|
| |
1,360 |
|
|
|
|
4.329%, 7/01/40 |
|
|
7/28 at 100.00 |
|
|
|
1,178,203 |
|
| |
10 |
|
|
|
|
4.329%, 7/01/40 |
|
|
7/28 at 100.00 |
|
|
|
8,663 |
|
56
|
|
|
|
|
|
|
|
|
|
|
|
|
|
|
|
Principal
Amount (000) |
|
|
|
|
Description (a) |
|
|
Optional Call
Provisions (b) |
|
|
|
Value |
|
|
|
|
|
|
|
|
|
|
|
|
Puerto Rico (continued) |
|
|
|
|
|
|
|
|
| $ |
49 |
|
|
|
|
4.784%, 7/01/58 |
|
|
7/28 at 100.00 |
|
|
$ |
41,214 |
|
|
|
|
|
|
|
Total Puerto Rico |
|
|
|
|
|
|
7,591,116 |
|
|
|
|
|
|
|
|
|
|
|
|
South Carolina - 1.7% |
|
|
|
|
|
|
|
|
|
|
|
|
|
| |
5,435 |
|
|
|
|
Piedmont Municipal Power Agency, South Carolina, Electric Revenue Bonds, Series 2004A-2, 0.000%, 1/01/29 - AGC Insured |
|
|
No Opt. Call |
|
|
|
4,279,390 |
|
|
|
|
|
|
|
Total South Carolina |
|
|
|
|
|
|
4,279,390 |
|
|
|
|
|
|
|
|
|
|
|
|
Tennessee - 3.7% |
|
|
|
|
|
|
|
|
|
|
|
|
|
| |
3,090 |
|
|
|
|
Chattanooga Health, Educational and Housing Facility Board, Tennessee, Revenue Bonds, CommonSpirit Health, Series 2019A-2, 5.000%, 8/01/44 |
|
|
8/29 at 100.00 |
|
|
|
2,921,656 |
|
|
|
|
|
|
| |
135 |
|
|
|
|
Metropolitan Government of Nashville-Davidson County Health and Educational Facilities Board, Tennessee, Revenue Bonds,
Vanderbilt University Medical Center, Series 2016A, 5.000%, 7/01/46 |
|
|
7/26 at 100.00 |
|
|
|
130,903 |
|
|
|
|
|
|
| |
605 |
|
|
|
|
Metropolitan Government of Nashville-Davidson County, Tennessee, Water and Sewerage Revenue Bonds, Green Series 2017A, 5.000%,
7/01/42 |
|
|
7/27 at 100.00 |
|
|
|
603,325 |
|
|
|
|
|
|
| |
4,000 |
|
|
|
|
The Tennessee Energy Acquisition Corporation, Gas Revenue Bonds, Series 2006B, 5.625%, 9/01/26 |
|
|
No Opt. Call |
|
|
|
4,000,608 |
|
|
|
|
|
|
| |
2,160 |
|
|
|
|
West Wilson Utility District, Wilson County, Tennessee, Water Revenue Bonds, Improvement
Series 2022, 4.000%, 6/01/47 |
|
|
6/32 at 100.00 |
|
|
|
1,856,061 |
|
|
|
|
|
|
|
Total Tennessee |
|
|
|
|
|
|
9,512,553 |
|
|
|
|
|
|
|
|
|
|
|
|
Texas - 9.5% |
|
|
|
|
|
|
|
|
|
|
|
|
|
| |
1,000 |
|
|
|
|
Austin Community College District Public Facility Corporation, Texas, Lease Revenue Bonds, Highland Campus - Building 3000
Project, Series 2018A, 5.000%, 8/01/42 |
|
|
8/27 at 100.00 |
|
|
|
1,010,422 |
|
|
|
|
|
|
| |
1,000 |
|
|
|
|
Austin, Texas, Electric Utility System Revenue Bonds, Refunding Series 2017, 5.000%, 11/15/35 |
|
|
11/26 at 100.00 |
|
|
|
1,017,146 |
|
|
|
|
|
|
| |
500 |
|
|
|
|
Bexar County Hospital District, Texas, Certificates of Obligation, Series 2020, 5.000%, 2/15/45 |
|
|
2/29 at 100.00 |
|
|
|
503,710 |
|
|
|
|
|
|
| |
1,000 |
|
|
|
|
Bexar County Hospital District, Texas, Certificates of Obligation, Series 2023, 5.000%, 2/15/48 |
|
|
8/32 at 100.00 |
|
|
|
1,007,472 |
|
|
|
|
|
|
| |
745 |
|
|
|
|
Central Texas Regional Mobility Authority, Revenue Bonds, Senior Lien Series 2020A, 5.000%, 1/01/40 |
|
|
1/30 at 100.00 |
|
|
|
748,752 |
|
|
|
|
|
|
|
|
|
|
|
|
Houston, Texas, Hotel Occupancy Tax and Special Revenue Bonds, Convention and Entertainment Project, Series 2001B: |
|
|
|
|
|
|
|
|
| |
3,000 |
|
|
|
|
0.000%, 9/01/32 - AMBAC Insured |
|
|
No Opt. Call |
|
|
|
1,976,881 |
|
| |
7,935 |
|
|
|
|
0.000%, 9/01/33 - AMBAC Insured |
|
|
No Opt. Call |
|
|
|
4,959,299 |
|
|
|
|
|
|
| |
1,430 |
|
|
|
|
Lower Colorado River Authority, Texas, Transmission Contract Revenue Bonds, LCRA Transmission Services Corporation Project,
Refunding Series 2021A, 5.000%, 5/15/51 |
|
|
5/31 at 100.00 |
|
|
|
1,365,852 |
|
|
|
|
|
|
| |
915 |
|
|
|
|
North Texas Tollway Authority, System Revenue Bonds, Refunding First Tier, Series 2015B, 5.000%, 1/01/45 |
|
|
1/25 at 100.00 |
|
|
|
906,172 |
|
|
|
|
|
|
| |
250 |
|
|
|
|
Tarrant County Cultural Education Facilities Finance Corporation, Texas, Revenue Bonds, Texas Health Resources System, Series
2016A, 5.000%, 2/15/41 |
|
|
8/26 at 100.00 |
|
|
|
247,439 |
|
|
|
|
|
|
| |
1,600 |
|
|
|
|
Texas Private Activity Bond Surface Transporation Corporation, Revenue Bonds, NTE Mobility Partners LLC North Tarrant Express
Managed Lanes Project, Refunding Senior Lien Series 2019A, 5.000%, 12/31/35 |
|
|
12/29 at 100.00 |
|
|
|
1,623,794 |
|
|
|
|
|
|
| |
7,635 |
|
|
|
|
Texas Water Development Board, State Water Implementation Revenue Fund Bonds, Master Trust Series 2016, 4.000%, 10/15/41 |
|
|
10/26 at 100.00 |
|
|
|
6,675,762 |
|
57
|
|
|
| NUW |
|
Nuveen AMT-Free Municipal Value Fund (continued) Portfolio of Investments October 31, 2023 |
|
|
|
|
|
|
|
|
|
|
|
|
|
|
|
|
Principal
Amount (000) |
|
|
|
|
Description (a) |
|
|
Optional Call
Provisions (b) |
|
|
|
Value |
|
|
|
|
|
|
|
|
|
|
|
|
Texas (continued) |
|
|
|
|
|
|
|
|
| $ |
2,500 |
|
|
(f) |
|
Texas Water Development Board, State Water Implementation Revenue Fund Bonds, Master
Trust Series 2017A, 4.000%, 10/15/42, (UB) |
|
|
10/27 at 100.00 |
|
|
$ |
2,198,686 |
|
|
|
|
|
|
|
Total Texas |
|
|
|
|
|
|
24,241,387 |
|
|
|
|
|
|
|
|
|
|
|
|
Utah - 0.6% |
|
|
|
|
|
|
|
|
|
|
|
|
|
| |
1,500 |
|
|
|
|
Salt Lake City, Utah, Airport Revenue Bonds, International Airport Series 2017B, 5.000%,
7/01/47 |
|
|
7/27 at 100.00 |
|
|
|
1,474,096 |
|
|
|
|
|
|
|
Total Utah |
|
|
|
|
|
|
1,474,096 |
|
|
|
|
|
|
|
|
|
|
|
|
Virginia - 1.0% |
|
|
|
|
|
|
|
|
|
|
|
|
|
| |
1,160 |
|
|
|
|
Chesapeake Bay Bridge and Tunnel District, Virginia, General Resolution Revenue Bonds, First Tier Series 2016, 5.000%,
7/01/51 |
|
|
7/26 at 100.00 |
|
|
|
1,078,276 |
|
|
|
|
|
|
| |
1,400 |
|
|
|
|
Chesapeake, Virginia, Transportation System Senior Toll Road Revenue Bonds, Capital
Appreciation Series 2012B, 4.875%, 7/15/40 |
|
|
7/28 at 100.00 |
|
|
|
1,346,028 |
|
|
|
|
|
|
|
Total Virginia |
|
|
|
|
|
|
2,424,304 |
|
|
|
|
|
|
|
|
|
|
|
|
Washington - 3.5% |
|
|
|
|
|
|
|
|
|
|
|
|
|
| |
3,330 |
|
|
|
|
Chelan County Public Utility District 1, Washington, Columbia River-Rock Island Hydro-Electric System Revenue Refunding Bonds,
Series 1997A, 0.000%, 6/01/29 - NPFG Insured |
|
|
No Opt. Call |
|
|
|
2,635,682 |
|
|
|
|
|
|
| |
690 |
|
|
|
|
Washington Health Care Facilities Authority, Revenue Bonds, Virginia Mason Medical Center, Series 2017, 5.000%, 8/15/30 |
|
|
8/27 at 100.00 |
|
|
|
695,884 |
|
|
|
|
|
|
|
|
|
|
|
|
Washington State Convention Center Public Facilities District, Lodging Tax Revenue Bonds, Refunding Series2021B. Exchange
Purchase: |
|
|
|
|
|
|
|
|
| |
2,165 |
|
|
|
|
4.000%, 7/01/37 |
|
|
7/31 at 100.00 |
|
|
|
1,927,844 |
|
| |
2,140 |
|
|
|
|
4.000%, 7/01/43 |
|
|
7/31 at 100.00 |
|
|
|
1,783,734 |
|
|
|
|
|
|
| |
2,000 |
|
|
|
|
Washington State Convention Center Public Facilities District, Lodging Tax Revenue Bonds,
Series 2018, 5.000%, 7/01/58 |
|
|
7/28 at 100.00 |
|
|
|
1,851,148 |
|
|
|
|
|
|
|
Total Washington |
|
|
|
|
|
|
8,894,292 |
|
|
|
|
|
|
|
|
|
|
|
|
West Virginia - 1.4% |
|
|
|
|
|
|
|
|
|
|
|
|
|
| |
530 |
|
|
|
|
West Virginia Hospital Finance Authority, Hospital Revenue Bonds, Cabell Huntington Hospital, Inc. Project, Refunding &
Improvement Series 2018A, 5.000%, 1/01/34 |
|
|
1/29 at 100.00 |
|
|
|
526,289 |
|
|
|
|
|
|
| |
1,800 |
|
|
|
|
West Virginia Hospital Finance Authority, Hospital Revenue Bonds, Charleston Area Medical Center, Refunding &
Improvement Series 2019A, 5.000%, 9/01/38 |
|
|
9/29 at 100.00 |
|
|
|
1,695,835 |
|
|
|
|
|
|
| |
1,430 |
|
|
|
|
West Virginia Parkways Authority, Turnpike Toll Revenue Bonds, Senior Lien
Series 2018, 5.000%, 6/01/43 |
|
|
6/28 at 100.00 |
|
|
|
1,440,763 |
|
|
|
|
|
|
|
Total West Virginia |
|
|
|
|
|
|
3,662,887 |
|
|
|
|
|
|
|
|
|
|
|
|
Total Municipal Bonds
(cost $265,679,392) |
|
|
|
|
|
|
251,253,096 |
|
58
|
|
|
|
|
|
|
|
|
|
|
|
|
|
|
| |
Shares |
|
|
|
|
Description (a) |
|
|
|
|
|
|
Value |
|
|
|
|
|
|
|
|
|
|
|
|
COMMON STOCKS - 0.5% |
|
|
|
|
|
|
|
|
|
|
|
|
|
|
|
|
|
|
|
Utilities - 0.5% |
|
|
|
|
|
|
|
|
| |
14,686 |
|
|
(g),(h) |
|
Energy Harbor Corp |
|
|
|
|
|
$ |
1,166,318 |
|
| |
977 |
|
|
(h),(i) |
|
Talen Energy Supply LLC |
|
|
|
|
|
|
51,049 |
|
|
|
|
|
|
|
Total Utilities |
|
|
|
|
|
|
1,217,367 |
|
|
|
|
|
|
|
|
|
|
|
|
Total Common Stocks
(cost $439,065) |
|
|
|
|
|
|
1,217,367 |
|
|
|
|
|
|
|
|
|
|
|
|
Total Long-Term Investments
(cost $266,118,457) |
|
|
|
|
|
|
252,470,463 |
|
|
|
|
|
|
|
|
|
|
|
|
Floating Rate Obligations - (0.8)% |
|
|
|
|
|
|
(2,000,000) |
|
|
|
|
|
|
|
|
|
|
|
|
Other Assets & Liabilities, Net -1.8% |
|
|
|
|
|
|
4,490,033 |
|
|
|
|
|
|
|
|
|
|
|
|
Net Assets Applicable to Common Shares - 100% |
|
|
|
|
|
$ |
254,960,496 |
|
Investments in Derivatives
Futures Contracts -
Short
|
|
|
|
|
|
|
|
|
|
|
| Description |
|
Number of
Contracts |
|
Expiration
Date |
|
Notional
Amount |
|
Value |
|
Unrealized
Appreciation
(Depreciation) |
| U.S. Treasury 10-Year
Note |
|
(159) |
|
12/23 |
|
$(17,536,172) |
|
$(16,881,328) |
|
$654,844 |
| (a) |
All percentages shown in the Portfolio of Investments are based on net assets applicable to common shares unless otherwise
noted. |
| (b) |
Optional Call Provisions: Dates (month and year) and prices of the earliest optional call or redemption. There may be
other call provisions at varying prices at later dates. Certain mortgage-backed securities may be subject to periodic principal paydowns. Optional Call Provisions are not covered by the report of independent registered public accounting firm.
|
| (c) |
Backed by an escrow or trust containing sufficient U.S. Government or U.S. Government agency securities, which ensure the
timely payment of principal and interest. |
| (d) |
Step-up coupon bond, a bond with a coupon that increases (“steps up”),
usually at regular intervals, while the bond is outstanding. The rate shown is the coupon as of the end of the reporting period. |
| (e) |
Defaulted security. A security whose issuer has failed to fully pay principal and/or interest when due, or is under the
protection of bankruptcy. |
| (f) |
Investment, or portion of investment, has been pledged to collateralize the net payment obligations for investments in
inverse floating rate transactions. |
| (g) |
Energy Harbor Corp (ENGH) common stock received as part of the bankruptcy settlements during February 2020 for Beaver
County Industrial Development Authority, Pennsylvania, Pollution Control Revenue Bonds, FirstEnergy Nuclear Generation Project, Refunding Series 2005A, 4.000%, 1/01/35; Beaver County Industrial Development Authority, Pennsylvania, Pollution Control
Revenue Refunding Bonds, FirstEnergy Nuclear Generation Project, Series 2006A, 4.375%, 1/01/35; Beaver County Industrial Development Authority, Pennsylvania, Pollution Control Revenue Refunding Bonds, FirstEnergy Nuclear Generation Project, Series
2006B, 3.500%, 12/01/35; and Pennsylvania Economic Development Financing Authority, Exempt Facilities Revenue Bonds, Shippingport Project, First Energy Guarantor, Series 2006A, 2.550%, 11/01/41. Various funds and accounts managed by Nuveen,
including the Fund, collectively are a substantial minority holder of ENGH’s outstanding shares of common stock, and possess certain other rights with respect to the corporate governance of ENGH. Due to these facts, under the federal securities
laws, the securities of ENGH held by Nuveen funds and accounts, including the Fund, cannot be sold except under limited conditions (which are not currently satisfied). The Fund is therefore unable to sell such shares in ordinary secondary
market transactions at this time. On March 6, 2023 Vistra Corp. (“Vistra”) announced that it has executed a definitive agreement with Energy Harbor Corp., pursuant to which Energy Harbor will merge with and into a newly-formed
subsidiary of Vistra. In connection with the transaction, Nuveen funds and accounts expect to receive a combination of cash and shares in a newly formed entity. Nuveen expects these shares to be issued in a private transaction and may have
reduced secondary market liquidity. The transaction is subject to certain regulatory approvals and there can be no assurance that the transaction will close. |
| (h) |
Non-income producing; issuer has not declared an
ex-dividend date within the past twelve months. |
| (i) |
In May 2023, Talen Energy completed a Chapter 11 plan of reorganization whereby the Fund received Talen Energy Common
Stock in exchange for the following portfolio holding: Pennsylvania Economic Development Financing Authority, Exempt Facilities Revenue Refunding Bonds, PPL Energy Supply, LLC Project, Series 2009A, 6.400%, 12/01/38. |
| 144A |
Investment is exempt from registration under Rule 144A of the Securities Act of 1933, as amended. These investments may
only be resold in transactions exempt from registration, which are normally those transactions with qualified institutional buyers. |
| UB |
Underlying bond of an inverse floating rate trust reflected as a financing transaction. |
See Notes to Financial Statements
59
|
|
|
| NMI |
|
Nuveen Municipal Income Fund, Inc. |
| |
Portfolio of Investments October 31, 2023 |
|
|
|
|
|
|
|
|
|
|
|
|
|
|
|
|
Principal
Amount (000) |
|
|
|
|
Description (a) |
|
|
Optional Call
Provisions (b) |
|
|
|
Value |
|
|
|
|
|
|
|
|
|
|
|
|
LONG-TERM INVESTMENTS - 96.6% |
|
|
|
|
|
|
|
|
|
|
|
|
|
|
|
|
|
|
|
MUNICIPAL BONDS - 96.6% |
|
|
|
|
|
|
|
|
|
|
|
|
|
|
|
|
|
|
|
Alabama - 2.2% |
|
|
|
|
|
|
|
|
|
|
|
|
|
| $ |
1,000 |
|
|
|
|
Southeast Energy Authority, Alabama, Commodity Supply Revenue Bonds, Project 4, Series
2022B-1, 5.000%, 5/01/53, (Mandatory Put 8/01/28) |
|
|
5/28 at 100.34 |
|
|
$ |
990,715 |
|
|
|
|
|
|
| |
1,000 |
|
|
|
|
Southeast Energy Authority, Alabama, Commodity Supply Revenue Bonds, Project 5, Series 2023A, 5.250%, 1/01/54, (Mandatory
Put 7/01/29) |
|
|
4/29 at 100.18 |
|
|
|
996,954 |
|
|
|
|
|
|
| |
100 |
|
|
|
|
Tuscaloosa County Industrial Development Authority, Alabama, Gulf Opportunity Zone Bonds,
Hunt Refining Project, Refunding Series 2019A, 5.250%, 5/01/44, 144A |
|
|
5/29 at 100.00 |
|
|
|
82,420 |
|
|
|
|
|
|
|
Total Alabama |
|
|
|
|
|
|
2,070,089 |
|
|
|
|
|
|
|
|
|
|
|
|
Arizona - 4.9% |
|
|
|
|
|
|
|
|
|
|
|
|
|
| |
600 |
|
|
|
|
Arizona Health Facilities Authority, Revenue Bonds, Scottsdale Lincoln Hospitals Project, Refunding Series 2014A, 5.000%,
12/01/39 |
|
|
12/24 at 100.00 |
|
|
|
566,885 |
|
|
|
|
|
|
| |
275 |
|
|
|
|
Arizona Industrial Development Authority Education Revenue Bonds, Academies of Math & Science Projects, Series 2023,
5.250%, 7/01/43 |
|
|
7/31 at 100.00 |
|
|
|
243,809 |
|
|
|
|
|
|
| |
1,000 |
|
|
|
|
Arizona Industrial Development Authority, Arizona, Education Revenue Bonds, Academies of Math & Science Projects, Series
2018A, 5.000%, 7/01/48 |
|
|
1/28 at 100.00 |
|
|
|
915,234 |
|
|
|
|
|
|
| |
1,000 |
|
|
|
|
Arizona Industrial Development Authority, Arizona, Education Revenue Bonds, KIPPC NYC Public Charter Schools - Macombs Facility
Project, Series 2021A, 4.000%, 7/01/41 |
|
|
7/31 at 100.00 |
|
|
|
827,140 |
|
|
|
|
|
|
| |
1,495 |
|
|
|
|
Phoenix Civic Improvement Corporation, Arizona, Airport Revenue Bonds, Junior Lien Series 2019A, 5.000%, 7/01/49 |
|
|
7/29 at 100.00 |
|
|
|
1,448,794 |
|
|
|
|
|
|
| |
515 |
|
|
|
|
Salt Verde Financial Corporation, Arizona, Senior Gas Revenue Bonds, Citigroup Energy Inc
Prepay Contract Obligations, Series 2007, 5.250%, 12/01/28 |
|
|
No Opt. Call |
|
|
|
520,208 |
|
|
|
|
|
|
|
Total Arizona |
|
|
|
|
|
|
4,522,070 |
|
|
|
|
|
|
|
|
|
|
|
|
Arkansas - 0.4% |
|
|
|
|
|
|
|
|
|
|
|
|
|
| |
200 |
|
|
|
|
Arkansas Development Finance Authority, Arkansas, Environmental Improvement Revenue Bonds, United States Steel Corporation, Green
Series 2022, 5.450%, 9/01/52, (AMT), 144A |
|
|
9/25 at 105.00 |
|
|
|
176,309 |
|
|
|
|
|
|
| |
200 |
|
|
|
|
Arkansas Development Finance Authority, Arkansas, Environmental Improvement Revenue
Bonds, United States Steel Corporation, Green Series 2023, 5.700%, 5/01/53, (AMT) |
|
|
5/26 at 105.00 |
|
|
|
182,519 |
|
|
|
|
|
|
|
Total Arkansas |
|
|
|
|
|
|
358,828 |
|
|
|
|
|
|
|
|
|
|
|
|
California - 2.7% |
|
|
|
|
|
|
|
|
|
|
|
|
|
| |
430 |
|
|
|
|
California Infrastructure and Economic Development Bank, Revenue Bonds, Brightline West Passenger Rail Project, Series 2020A,
3.650%, 1/01/50, (AMT), (Mandatory Put 1/31/24) |
|
|
12/23 at 100.00 |
|
|
|
427,606 |
|
|
|
|
|
|
| |
625 |
|
|
|
|
California Municipal Finance Authority, Special Tax Revenue Bonds, Bold Program, Series 2023B, 5.500%, 9/01/43 |
|
|
No Opt. Call |
|
|
|
595,100 |
|
|
|
|
|
|
| |
365 |
|
|
|
|
California Statewide Communities Development Authority, California, Revenue Bonds, Loma Linda University Medical Center, Series
2016A, 5.250%, 12/01/56, 144A |
|
|
6/26 at 100.00 |
|
|
|
323,368 |
|
|
|
|
|
|
| |
275 |
|
|
|
|
California Statewide Communities Development Authority, Revenue Bonds, Front Porch Communities & Services Project,
Series 2017A, 4.000%, 4/01/36 |
|
|
4/27 at 100.00 |
|
|
|
249,433 |
|
60
|
|
|
|
|
|
|
|
|
|
|
|
|
|
|
|
Principal
Amount (000) |
|
|
|
|
Description (a) |
|
|
Optional Call
Provisions (b) |
|
|
|
Value |
|
|
|
|
|
|
|
|
|
|
|
|
California (continued) |
|
|
|
|
|
|
|
|
| $ |
11 |
|
|
(c),(d) |
|
California Statewide Community Development Authority, Revenue Bonds, Daughters of Charity Health System, Series 2005A, 5.500%,
7/01/39 |
|
|
1/22 at 100.00 |
|
|
$ |
10,994 |
|
|
|
|
|
|
| |
300 |
|
|
|
|
M-S-R Energy Authority, California, Gas Revenue
Bonds, Citigroup Prepay Contracts, Series 2009A, 7.000%, 11/01/34 |
|
|
No Opt. Call |
|
|
|
349,294 |
|
|
|
|
|
|
| |
500 |
|
|
|
|
San Joaquin Hills Transportation Corridor Agency, Orange County, California, Toll Road
Revenue Bonds, Refunding Junior Lien Series 2014B, 5.250%, 1/15/44 |
|
|
1/25 at 100.00 |
|
|
|
501,576 |
|
|
|
|
|
|
|
Total California |
|
|
|
|
|
|
2,457,371 |
|
|
|
|
|
|
|
|
|
|
|
|
Colorado - 13.5% |
|
|
|
|
|
|
|
|
|
|
|
|
|
| |
1,000 |
|
|
|
|
Boulder Valley School District RE2, Boulder County, Colorado, General Obligation Bonds, Series 2019A, 4.000%, 12/01/48 |
|
|
6/29 at 100.00 |
|
|
|
847,197 |
|
|
|
|
|
|
|
|
|
|
|
|
Central Platte Valley Metropolitan District, Colorado, General Obligation Bonds, Refunding Series 2013A: |
|
|
|
|
|
|
|
|
| |
150 |
|
|
(e) |
|
5.125%, 12/01/29, (Pre-refunded 12/01/23) |
|
|
12/23 at 100.00 |
|
|
|
150,124 |
|
| |
250 |
|
|
(e) |
|
5.375%, 12/01/33, (Pre-refunded 12/01/23) |
|
|
12/23 at 100.00 |
|
|
|
250,255 |
|
|
|
|
|
|
| |
350 |
|
|
(e) |
|
Colorado Health Facilities Authority, Colorado, Health Facilities Revenue Bonds, The Evangelical Lutheran Good Samaritan Society
Project, Refunding Series 2017, 5.000%, 6/01/42, (Pre-refunded 6/01/27) |
|
|
6/27 at 100.00 |
|
|
|
362,958 |
|
|
|
|
|
|
| |
1,000 |
|
|
|
|
Colorado Health Facilities Authority, Colorado, Revenue Bonds, AdventHealth Obligated Group, Series 2019A, 4.000%,
11/15/43 |
|
|
11/29 at 100.00 |
|
|
|
862,555 |
|
|
|
|
|
|
| |
500 |
|
|
|
|
Colorado Health Facilities Authority, Colorado, Revenue Bonds, Christian Living Neighborhoods Project, Refunding Series 2016,
5.000%, 1/01/37 |
|
|
1/24 at 102.00 |
|
|
|
452,778 |
|
|
|
|
|
|
| |
1,000 |
|
|
|
|
Colorado Health Facilities Authority, Colorado, Revenue Bonds, CommonSpirit Health, Series
2019A-2, 5.000%, 8/01/44 |
|
|
8/29 at 100.00 |
|
|
|
945,520 |
|
|
|
|
|
|
| |
1,395 |
|
|
|
|
Denver City and County, Colorado, Airport System Revenue Bonds, Subordinate Lien Series 2018A, 5.000%, 12/01/43, (AMT) |
|
|
12/28 at 100.00 |
|
|
|
1,343,250 |
|
|
|
|
|
|
| |
700 |
|
|
|
|
Erie Farm Metropolitan District, Erie, Boulder County, Colorado, General Obligation Limited Tax Bonds, Refunding &
Improvement, Series 2021, 5.000%, 12/01/46 - AGM Insured |
|
|
12/31 at 100.00 |
|
|
|
700,730 |
|
|
|
|
|
|
| |
700 |
|
|
|
|
Falcon Area Water and Wastewater Authority (El Paso County, Colorado), Tap Fee Revenue Bonds, Series 2022A, 6.750%, 12/01/34,
144A |
|
|
9/27 at 103.00 |
|
|
|
649,828 |
|
|
|
|
|
|
| |
1,000 |
|
|
|
|
Lewis Pointe Metropolitan District, Thornton, Colorado, Limited Tax General Obligation Bonds, Refunding Series 2021, 4.000%,
12/01/47 - BAM Insured |
|
|
12/31 at 100.00 |
|
|
|
795,213 |
|
|
|
|
|
|
| |
500 |
|
|
|
|
Park Creek Metropolitan District, Colorado, Senior Limited Property Tax Supported Revenue Bonds, Series 2017A, 5.000%,
12/01/46 |
|
|
12/25 at 100.00 |
|
|
|
477,351 |
|
|
|
|
|
|
| |
650 |
|
|
|
|
Park Creek Metropolitan District, Colorado, Senior Limited Property Tax Supported Revenue Bonds, Series 2018A, 4.000%,
12/01/51 |
|
|
12/28 at 100.00 |
|
|
|
478,304 |
|
|
|
|
|
|
| |
500 |
|
|
|
|
Peak Metropolitan District 1, Colorado Springs, El Paso County, Colorado, Limited Tax General Obligation Bonds, Series 2021A,
5.000%, 12/01/41, 144A |
|
|
3/26 at 103.00 |
|
|
|
423,566 |
|
|
|
|
|
|
| |
1,000 |
|
|
|
|
Platte River Metropolitan District, Weld County, Colorado, General Obligation Bonds, Limited Tax Refunding Series 2023A, 6.500%,
8/01/53, 144A |
|
|
8/29 at 103.00 |
|
|
|
940,026 |
|
|
|
|
|
|
| |
125 |
|
|
|
|
Public Authority for Colorado Energy, Natural Gas Purchase Revenue Bonds, Colorado Springs Utilities, Series 2008, 6.125%,
11/15/23 |
|
|
No Opt. Call |
|
|
|
125,064 |
|
|
|
|
|
|
| |
463 |
|
|
(e) |
|
Tallyn’s Reach Metropolitan District 3, Aurora, Colorado, General Obligation Bonds, Limited Tax Convertible to Unlimited
Tax, Refunding & Improvement Series 2013, 5.000%, 12/01/33, (Pre-refunded 12/01/23), 144A |
|
|
12/23 at 100.00 |
|
|
|
463,336 |
|
61
|
|
|
| NMI |
|
Nuveen Municipal Income Fund, Inc. (continued) Portfolio of Investments October 31, 2023 |
|
|
|
|
|
|
|
|
|
|
|
|
|
|
|
|
Principal
Amount (000) |
|
|
|
|
Description (a) |
|
|
Optional Call
Provisions (b) |
|
|
|
Value |
|
|
|
|
|
|
|
|
|
|
|
|
Colorado (continued) |
|
|
|
|
|
|
|
|
| $ |
1,275 |
|
|
|
|
Ventana Metropolitan District, El Paso County, Colorado, General Obligation Bonds, Limited Tax Refunding and Improvement Series
2023A, 6.500%, 9/01/53, 144A |
|
|
12/28 at 103.00 |
|
|
$ |
1,255,049 |
|
|
|
|
|
|
| |
525 |
|
|
|
|
Waterview II Metropolitan District, El Paso County, Colorado, Limited Tax General Obligation Bonds, Series 2022A, 4.500%,
12/01/31 |
|
|
3/27 at 103.00 |
|
|
|
460,382 |
|
|
|
|
|
|
| |
500 |
|
|
|
|
West Globeville Metropolitan District 1, Denver, Colorado, General Obligation Limited Tax
Bonds, Series 2022, 6.750%, 12/01/52 |
|
|
12/29 at 103.00 |
|
|
|
432,303 |
|
|
|
|
|
|
|
Total Colorado |
|
|
|
|
|
|
12,415,789 |
|
|
|
|
|
|
|
|
|
|
|
|
Delaware - 0.1% |
|
|
|
|
|
|
|
|
|
|
|
|
|
| |
100 |
|
|
|
|
Delaware Health Facilities Authroity, Revenue Bonds, Beebe Medical Center Project, Series
2018, 5.000%, 6/01/48 |
|
|
12/28 at 100.00 |
|
|
|
90,433 |
|
|
|
|
|
|
|
Total Delaware |
|
|
|
|
|
|
90,433 |
|
|
|
|
|
|
|
|
|
|
|
|
District of Columbia - 0.1% |
|
|
|
|
|
|
|
|
|
|
|
|
|
| |
105 |
|
|
|
|
Metropolitan Washington Airports Authority, District of Columbia, Dulles Toll Road
Revenue Bonds, Dulles Metrorail & Capital improvement Projects, Refunding & Subordinate Lien Series 2019B, 4.000%, 10/01/49 |
|
|
10/29 at 100.00 |
|
|
|
82,293 |
|
|
|
|
|
|
|
Total District of Columbia |
|
|
|
|
|
|
82,293 |
|
|
|
|
|
|
|
|
|
|
|
|
Florida - 5.6% |
|
|
|
|
|
|
|
|
|
|
|
|
|
| |
815 |
|
|
|
|
Bay County, Florida, Educational Facilities Revenue Refunding Bonds, Bay Haven Charter Academy, Inc. Project, Series 2013A,
5.000%, 9/01/33 |
|
|
12/23 at 100.00 |
|
|
|
815,099 |
|
|
|
|
|
|
| |
210 |
|
|
|
|
Florida Development Finance Corporation, Educational Facilities Revenue Bonds, Renaissance Charter School Income Projects, Series
2023A, 6.500%, 6/15/38, 144A |
|
|
6/30 at 103.00 |
|
|
|
205,530 |
|
|
|
|
|
|
| |
700 |
|
|
|
|
Florida Development Finance Corporation, Florida, Surface Transportation Facility Revenue Bonds, Brightline Passenger Rail
Project, Green Series 2019B, 7.375%, 1/01/49, (AMT), 144A |
|
|
1/24 at 107.00 |
|
|
|
682,501 |
|
|
|
|
|
|
|
|
|
|
|
|
Florida Development Finance Corporation, Florida, Surface Transportation Facility Revenue Bonds, Virgin Trains USA Passenger Rail
Project, Series 2019A: |
|
|
|
|
|
|
|
|
| |
350 |
|
|
|
|
6.375%, 1/01/49, (AMT), (Mandatory Put 1/01/26), 144A |
|
|
12/23 at 102.00 |
|
|
|
333,168 |
|
| |
380 |
|
|
|
|
6.500%, 1/01/49, (AMT), (Mandatory Put 1/01/29), 144A |
|
|
12/23 at 102.00 |
|
|
|
359,156 |
|
|
|
|
|
|
| |
500 |
|
|
|
|
Florida Development Finance Corporation, Revenue Bonds, Brightline Passenger Rail Expansion Project, Series 2023C, 8.000%,
7/01/57, (AMT), (Mandatory Put 4/01/24), 144A |
|
|
11/23 at 100.00 |
|
|
|
503,534 |
|
|
|
|
|
|
| |
500 |
|
|
|
|
Greater Orlando Aviation Authority, Florida, Orlando Airport Facilities Revenue Bonds, Priority Subordinated Series 2017A,
5.000%, 10/01/42, (AMT) |
|
|
10/27 at 100.00 |
|
|
|
484,958 |
|
|
|
|
|
|
| |
1,145 |
|
|
|
|
Hillsborough County Industrial Development Authority, Florida, Hospital Revenue Bonds, Florida Health Sciences Center Inc D/B/A
Tampa General Hospital, Series 2020A, 4.000%, 8/01/55 |
|
|
2/31 at 100.00 |
|
|
|
868,735 |
|
|
|
|
|
|
| |
300 |
|
|
|
|
Lakewood Ranch Stewardship District, Florida, Special Assessment Revenue Bonds, Taylor Ranch Project, Series 2023, 6.125%,
5/01/43 |
|
|
5/33 at 100.00 |
|
|
|
293,659 |
|
|
|
|
|
|
| |
645 |
|
|
|
|
Woodsdale Community Development District, Pasco County, Florida, Revenue Bonds, Capital
Improvement Series 2023, 6.125%, 11/01/43, 144A |
|
|
11/33 at 100.00 |
|
|
|
622,331 |
|
|
|
|
|
|
|
Total Florida |
|
|
|
|
|
|
5,168,671 |
|
|
|
|
|
|
|
|
|
|
|
|
Georgia - 2.2% |
|
|
|
|
|
|
|
|
|
|
|
|
|
| |
455 |
|
|
|
|
Atlanta Development Authority, Georgia, Revenue Bonds, New Downtown Atlanta Stadium Project, Senior Lien Series 2015A-1, 5.250%, 7/01/40 |
|
|
7/25 at 100.00 |
|
|
|
457,173 |
|
62
|
|
|
|
|
|
|
|
|
|
|
|
|
|
|
|
Principal
Amount (000) |
|
|
|
|
Description (a) |
|
|
Optional Call
Provisions (b) |
|
|
|
Value |
|
|
|
|
|
|
|
|
|
|
|
|
Georgia (continued) |
|
|
|
|
|
|
|
|
| $ |
170 |
|
|
|
|
Atlanta Urban Residential Finance Authority, Georgia, Multifamily Housing Revenue Bonds, Testletree Village Apartments, Series
2013A, 4.000%, 11/01/25 |
|
|
12/23 at 100.00 |
|
|
$ |
159,210 |
|
|
|
|
|
|
| |
500 |
|
|
|
|
Fulton County Development Authority, Georgia, Hospital Revenue Bonds, Wellstar Health System, Inc Project, Series 2017A, 4.000%,
4/01/50 |
|
|
4/30 at 100.00 |
|
|
|
396,989 |
|
|
|
|
|
|
| |
1,000 |
|
|
|
|
Main Street Natural Gas Inc., Georgia, Gas Supply Revenue Bonds, Series 2023B, 5.000%,
7/01/53, (Mandatory Put 3/01/30) |
|
|
12/29 at 100.31 |
|
|
|
993,968 |
|
|
|
|
|
|
|
Total Georgia |
|
|
|
|
|
|
2,007,340 |
|
|
|
|
|
|
|
|
|
|
|
|
Hawaii - 1.8% |
|
|
|
|
|
|
|
|
|
|
|
|
|
| |
250 |
|
|
|
|
Hawaii Department of Budget and Finance, Special Purpose Revenue Bonds, Hawaii Pacific University, Series 2013A, 6.625%, 7/01/33,
144A |
|
|
12/23 at 100.00 |
|
|
|
250,102 |
|
|
|
|
|
|
| |
1,500 |
|
|
|
|
Hawaii State, Airport System Revenue Bonds, Series 2022, 5.000%, 7/01/47, (AMT) |
|
|
7/32 at 100.00 |
|
|
|
1,420,978 |
|
|
|
|
|
|
|
Total Hawaii |
|
|
|
|
|
|
1,671,080 |
|
|
|
|
|
|
|
|
|
|
|
|
Illinois - 12.5% |
|
|
|
|
|
|
|
|
|
|
|
|
|
| |
250 |
|
|
|
|
Chicago Board of Education, Illinois, Dedicated Capital Improvement Tax Revenue Bonds, Series 2016, 6.000%, 4/01/46 |
|
|
4/27 at 100.00 |
|
|
|
251,504 |
|
|
|
|
|
|
| |
500 |
|
|
|
|
Chicago Board of Education, Illinois, Dedicated Capital Improvement Tax Revenue Bonds, Series 2023, 5.750%, 4/01/48 |
|
|
4/33 at 100.00 |
|
|
|
502,830 |
|
|
|
|
|
|
| |
435 |
|
|
|
|
Chicago Board of Education, Illinois, General Obligation Bonds, Dedicated Revenues, Refunding Series 2018D, 5.000%,
12/01/46 |
|
|
12/28 at 100.00 |
|
|
|
382,882 |
|
|
|
|
|
|
| |
650 |
|
|
|
|
Chicago Board of Education, Illinois, General Obligation Bonds, Dedicated Revenues, Series 2016A, 7.000%, 12/01/44 |
|
|
12/25 at 100.00 |
|
|
|
664,299 |
|
|
|
|
|
|
| |
500 |
|
|
|
|
Chicago Board of Education, Illinois, General Obligation Bonds, Dedicated Revenues, Series 2023A, 6.000%, 12/01/49,
(WI/DD) |
|
|
12/33 at 100.00 |
|
|
|
499,976 |
|
|
|
|
|
|
| |
1,000 |
|
|
|
|
Chicago, Illinois, General Airport Revenue Bonds, O’Hare International Airport, Senior Lien Series 2022A, 5.500%,
1/01/55 |
|
|
1/32 at 100.00 |
|
|
|
998,227 |
|
|
|
|
|
|
| |
1,000 |
|
|
|
|
Illinois Educational Facilities Authority, Revenue Bonds, Field Museum of Natural History, Series 2002.RMKT, 4.500%,
11/01/36 |
|
|
11/24 at 100.00 |
|
|
|
972,114 |
|
|
|
|
|
|
| |
500 |
|
|
|
|
Illinois Finance Authority, Revenue Bonds, Bradley University, Refunding Series 2021A, 4.000%, 8/01/51 |
|
|
8/31 at 100.00 |
|
|
|
372,777 |
|
|
|
|
|
|
| |
1,000 |
|
|
|
|
Illinois Finance Authority, Revenue Bonds, Northshore - Edward-Elmhurst Health Credit Group, Series 2022A, 5.000%,
8/15/51 |
|
|
8/32 at 100.00 |
|
|
|
948,868 |
|
|
|
|
|
|
| |
1,105 |
|
|
|
|
Illinois Finance Authority, Revenue Bonds, OSF Healthcare System, Series 2015A, 5.000%, 11/15/45 |
|
|
11/25 at 100.00 |
|
|
|
1,047,432 |
|
|
|
|
|
|
| |
200 |
|
|
|
|
Illinois Finance Authority, Revenue Bonds, Silver Cross Hospital and Medical Centers, Refunding Series 2015C, 5.000%,
8/15/44 |
|
|
8/25 at 100.00 |
|
|
|
188,109 |
|
|
|
|
|
|
| |
540 |
|
|
|
|
Illinois State, General Obligation Bonds, June Series 2022A, 5.500%, 3/01/47 |
|
|
3/32 at 100.00 |
|
|
|
543,204 |
|
|
|
|
|
|
| |
500 |
|
|
|
|
Illinois State, General Obligation Bonds, March Series 2021A, 5.000%, 3/01/46 |
|
|
3/31 at 100.00 |
|
|
|
469,947 |
|
|
|
|
|
|
| |
400 |
|
|
|
|
Illinois State, General Obligation Bonds, May Series 2020, 5.500%, 5/01/39 |
|
|
5/30 at 100.00 |
|
|
|
409,437 |
|
|
|
|
|
|
| |
1,000 |
|
|
|
|
Illinois State, General Obligation Bonds, October Series 2022C, 5.500%, 10/01/41 |
|
|
10/32 at 100.00 |
|
|
|
1,019,385 |
|
|
|
|
|
|
| |
1,900 |
|
|
|
|
Illinois Toll Highway Authority, Toll Highway Revenue Bonds, Senior Lien Series 2019A, 5.000%, 1/01/44 |
|
|
7/29 at 100.00 |
|
|
|
1,900,167 |
|
|
|
|
|
|
| |
200 |
|
|
|
|
Metropolitan Pier and Exposition Authority, Illinois, McCormick Place Expansion Project Bonds, Series 2015A, 5.500%,
6/15/53 |
|
|
12/25 at 100.00 |
|
|
|
198,788 |
|
63
|
|
|
| NMI |
|
Nuveen Municipal Income Fund, Inc. (continued) Portfolio of Investments October 31,
2023 |
|
|
|
|
|
|
|
|
|
|
|
|
|
|
|
|
Principal
Amount (000) |
|
|
|
|
Description (a) |
|
|
Optional Call
Provisions (b) |
|
|
|
Value |
|
|
|
|
|
|
|
|
|
|
|
|
Illinois (continued) |
|
|
|
|
|
|
|
|
| $ |
205 |
|
|
|
|
Metropolitan Pier and Exposition Authority, Illinois, Revenue Bonds, McCormick Place
Expansion Project, Series 2002A, 0.000%, 12/15/35 - NPFG Insured |
|
|
No Opt. Call |
|
|
$ |
112,652 |
|
|
|
|
|
|
|
Total Illinois |
|
|
|
|
|
|
11,482,598 |
|
|
|
|
|
|
|
|
|
|
|
|
Indiana - 2.8% |
|
|
|
|
|
|
|
|
|
|
|
|
|
| |
735 |
|
|
|
|
Gary Local Public Improvement Bond Bank, Indiana, Economic Development Revenue Bonds, Drexel Foundation for Educational
Excellence Project, Refunding Series 2020A, 5.875%, 6/01/55, 144A |
|
|
6/30 at 100.00 |
|
|
|
578,545 |
|
|
|
|
|
|
| |
1,000 |
|
|
|
|
Indiana Finance Authority, Environmental Improvement Revenue Bonds, Fulcrum CenterPoint, LLC Project, Series 2022, 4.500%,
12/15/46, (AMT), (Mandatory Put 11/15/23) |
|
|
11/23 at 100.00 |
|
|
|
999,778 |
|
|
|
|
|
|
|
|
|
|
|
|
Indiana Finance Authority, Hospital Revenue Bonds, Indiana University Health Obligation Group, Fixed Rate Series 2023A: |
|
|
|
|
|
|
|
|
|
|
|
|
|
| |
1,000 |
|
|
|
|
5.000%, 10/01/46 |
|
|
No Opt. Call |
|
|
|
987,679 |
|
|
|
|
|
|
|
Total Indiana |
|
|
|
|
|
|
2,566,002 |
|
|
|
|
|
|
|
|
|
|
|
|
Iowa - 0.5% |
|
|
|
|
|
|
|
|
|
|
|
|
|
| |
500 |
|
|
|
|
Iowa Finance Authority, Iowa, Midwestern Disaster Area Revenue Bonds, Iowa Fertilizer
Company Project, Refunding Series 2022, 5.000%, 12/01/50 |
|
|
12/29 at 103.00 |
|
|
|
443,807 |
|
|
|
|
|
|
|
Total Iowa |
|
|
|
|
|
|
443,807 |
|
|
|
|
|
|
|
|
|
|
|
|
Louisiana - 2.3% |
|
|
|
|
|
|
|
|
|
|
|
|
|
| |
1,000 |
|
|
|
|
East Baton Rouge Parish Capital Improvement District, Louisiana, MOVEBR Sales Tax Revenue Bonds, Series 2019, 5.000%,
8/01/48 |
|
|
8/29 at 100.00 |
|
|
|
985,382 |
|
|
|
|
|
|
| |
1,230 |
|
|
|
|
Louisiana Local Government Environmental Facilities and Community Development Authority,
Louisiana, Revenue Bonds, Womans Hospital Foundation Project, Refunding Series 2017A, 5.000%, 10/01/41 |
|
|
10/27 at 100.00 |
|
|
|
1,157,146 |
|
|
|
|
|
|
|
Total Louisiana |
|
|
|
|
|
|
2,142,528 |
|
|
|
|
|
|
|
|
|
|
|
|
Maryland - 0.5% |
|
|
|
|
|
|
|
|
|
|
|
|
|
| |
500 |
|
|
(e) |
|
Maryland Health and Higher Educational Facilities Authority, Revenue Bonds, Peninsula
Regional Medical Center Issue, Refunding Series 2015, 5.000%, 7/01/45, (Pre-refunded 7/01/24) |
|
|
7/24 at 100.00 |
|
|
|
502,745 |
|
|
|
|
|
|
|
Total Maryland |
|
|
|
|
|
|
502,745 |
|
|
|
|
|
|
|
|
|
|
|
|
Massachusetts - 0.1% |
|
|
|
|
|
|
|
|
|
|
|
|
|
| |
50 |
|
|
(e) |
|
Massachusetts Development Finance Agency, Revenue Bonds, Atrius Health Issue, Series
2019A, 4.000%, 6/01/49, (Pre-refunded 6/01/29) |
|
|
6/29 at 100.00 |
|
|
|
50,788 |
|
|
|
|
|
|
|
Total Massachusetts |
|
|
|
|
|
|
50,788 |
|
|
|
|
|
|
|
|
|
|
|
|
Michigan - 0.9% |
|
|
|
|
|
|
|
|
|
|
|
|
|
| |
1,000 |
|
|
|
|
Michigan State University, General Revenue Bonds, Refunding Series 2019C, 4.000%,
2/15/44 |
|
|
8/29 at 100.00 |
|
|
|
846,997 |
|
|
|
|
|
|
|
Total Michigan |
|
|
|
|
|
|
846,997 |
|
|
|
|
|
|
|
|
|
|
|
|
Minnesota - 1.8% |
|
|
|
|
|
|
|
|
|
|
|
|
|
| |
75 |
|
|
|
|
Baytown Township, Minnesota Charter School Lease Revenue Bonds, Saint Croix Preparatory Academy, Refunding Series 2016A, 4.250%,
8/01/46 |
|
|
8/26 at 100.00 |
|
|
|
54,756 |
|
|
|
|
|
|
| |
1,000 |
|
|
|
|
Duluth Economic Development Authority, Minnesota, Health Care Facilities Revenue Bonds, Essentia Health Obligated Group, Series
2018A, 5.000%, 2/15/48 |
|
|
2/28 at 100.00 |
|
|
|
910,622 |
|
64
|
|
|
|
|
|
|
|
|
|
|
|
|
|
|
|
Principal
Amount (000) |
|
|
|
|
Description (a) |
|
|
Optional Call
Provisions (b) |
|
|
|
Value |
|
|
|
|
|
|
|
|
|
|
|
|
Minnesota (continued) |
|
|
|
|
|
|
|
|
| $ |
555 |
|
|
|
|
Saint Paul Housing & Redevelopment Authority, Minnesota, Charter School Lease Revenue Bonds, Twin Cities German
Immersion School Project, Series 2019, 5.000%, 7/01/49 |
|
|
7/27 at 102.00 |
|
|
$ |
444,087 |
|
|
|
|
|
|
| |
300 |
|
|
|
|
Saint Paul Park, Minnesota, Senior Housing and Health Care Revenue Bonds, Presbyterian
Homes Bloomington Project, Refunding Series 2017, 4.250%, 9/01/37 |
|
|
9/24 at 100.00 |
|
|
|
258,742 |
|
|
|
|
|
|
|
Total Minnesota |
|
|
|
|
|
|
1,668,207 |
|
|
|
|
|
|
|
|
|
|
|
|
Mississippi - 1.0% |
|
|
|
|
|
|
|
|
|
|
|
|
|
| |
1,000 |
|
|
|
|
Mississippi Hospital Equipment and Facilities Authority, Revenue Bonds, Baptist Memorial
Healthcare, Series 2016A, 5.000%, 9/01/41 |
|
|
9/26 at 100.00 |
|
|
|
947,148 |
|
|
|
|
|
|
|
Total Mississippi |
|
|
|
|
|
|
947,148 |
|
|
|
|
|
|
|
|
|
|
|
|
Missouri - 2.5% |
|
|
|
|
|
|
|
|
|
|
|
|
|
| |
1,000 |
|
|
|
|
Missouri Health and Educational Facilities Authority, Educational Facilities Revenue Bonds, Southwest Baptist University Project,
Series 2012, 5.000%, 10/01/33 |
|
|
12/23 at 100.00 |
|
|
|
918,332 |
|
|
|
|
|
|
| |
1,000 |
|
|
|
|
Missouri Health and Educational Facilities Authority, Health Facilities Revenue Bonds, Mosaic Health System, Series 2019A,
4.000%, 2/15/54 |
|
|
2/29 at 100.00 |
|
|
|
777,328 |
|
|
|
|
|
|
| |
215 |
|
|
|
|
Saint Louis County Industrial Development Authority, Missouri, Revenue Bonds, Friendship Village Saint Louis Obligated Group,
Series 2018A, 5.250%, 9/01/53 |
|
|
9/25 at 103.00 |
|
|
|
171,777 |
|
|
|
|
|
|
| |
335 |
|
|
|
|
Saline County Industrial Development Authority, Missouri, First Mortgage Revenue Bonds, Missouri Valley College, Series 2017,
4.500%, 10/01/40 |
|
|
12/23 at 100.00 |
|
|
|
264,802 |
|
|
|
|
|
|
| |
225 |
|
|
|
|
Taney County Industrial Development Authority, Missouri, Sales Tax Revenue Improvement
Bonds, Big Cedar Infrastructure Project Series 2023, 6.000%, 10/01/49, 144A |
|
|
10/30 at 100.00 |
|
|
|
202,941 |
|
|
|
|
|
|
|
Total Missouri |
|
|
|
|
|
|
2,335,180 |
|
|
|
|
|
|
|
|
|
|
|
|
Nebraska - 1.6% |
|
|
|
|
|
|
|
|
|
|
|
|
|
| |
500 |
|
|
|
|
Central Plains Energy Project, Nebraska, Gas Project 3 Revenue Bonds, Refunding Crossover Series 2017A, 5.000%, 9/01/42 |
|
|
No Opt. Call |
|
|
|
470,174 |
|
|
|
|
|
|
| |
1,000 |
|
|
|
|
Douglas County School District 54, Ralston, Nebraska, General Obligation Bonds, Series
2023, 5.000%, 12/15/48 |
|
|
12/32 at 100.00 |
|
|
|
1,004,859 |
|
|
|
|
|
|
|
Total Nebraska |
|
|
|
|
|
|
1,475,033 |
|
|
|
|
|
|
|
|
|
|
|
|
New Jersey - 2.6% |
|
|
|
|
|
|
|
|
|
|
|
|
|
| |
35 |
|
|
(e) |
|
Gloucester County Pollution Control Financing Authority, New Jersey, Pollution Control Revenue Bonds, Logan Project, Refunding
Series 2014A, 5.000%, 12/01/24, (AMT), (ETM) |
|
|
No Opt. Call |
|
|
|
35,060 |
|
|
|
|
|
|
| |
545 |
|
|
|
|
New Jersey Transportation Trust Fund Authority, Transportation System Bonds, Series 2015AA, 5.000%, 6/15/45 |
|
|
6/25 at 100.00 |
|
|
|
524,917 |
|
|
|
|
|
|
| |
1,000 |
|
|
|
|
New Jersey Transportation Trust Fund Authority, Transportation System Bonds, Series 2019BB, 4.000%, 6/15/44 |
|
|
12/28 at 100.00 |
|
|
|
856,473 |
|
|
|
|
|
|
| |
1,000 |
|
|
|
|
Tobacco Settlement Financing Corporation, New Jersey, Tobacco Settlement Asset-Backed
Bonds, Series 2018A, 5.000%, 6/01/46 |
|
|
6/28 at 100.00 |
|
|
|
938,203 |
|
|
|
|
|
|
|
Total New Jersey |
|
|
|
|
|
|
2,354,653 |
|
|
|
|
|
|
|
|
|
|
|
|
New York - 3.8% |
|
|
|
|
|
|
|
|
|
|
|
|
|
| |
60 |
|
|
|
|
Buffalo and Erie County Industrial Land Development Corporation, New York, Revenue Bonds, Catholic Health System, Inc. Project,
Series 2015, 5.250%, 7/01/35 |
|
|
7/25 at 100.00 |
|
|
|
49,701 |
|
|
|
|
|
|
| |
1,500 |
|
|
|
|
Dormitory Authority of the State of New York, State Personal Income Tax Revenue Bonds, General Purpose Series 2022A, 5.000%,
3/15/46 |
|
|
3/32 at 100.00 |
|
|
|
1,512,019 |
|
65
|
|
|
| NMI |
|
Nuveen Municipal Income Fund, Inc. (continued) Portfolio of Investments October 31,
2023 |
|
|
|
|
|
|
|
|
|
|
|
|
|
|
|
|
Principal
Amount (000) |
|
|
|
|
Description (a) |
|
|
Optional Call
Provisions (b) |
|
|
|
Value |
|
|
|
|
|
|
|
|
|
|
|
|
New York (continued) |
|
|
|
|
|
|
|
|
| $ |
250 |
|
|
|
|
Genesee County Funding Corporation, New York, Revenue Bonds, Rochester Regional Health Project, Series 2022A, 5.250%,
12/01/52 |
|
|
12/32 at 100.00 |
|
|
$ |
236,834 |
|
|
|
|
|
|
| |
315 |
|
|
|
|
Metropolitan Transportation Authority, New York, Transportation Revenue Bonds, Green Climate Bond Certified Series 2020C-1, 5.250%, 11/15/55 |
|
|
5/30 at 100.00 |
|
|
|
309,858 |
|
|
|
|
|
|
| |
500 |
|
|
|
|
New York City Transitional Finance Authority, New York, Future Tax Secured Bonds, Subordinate Fiscal 2021 Subseries E-1, 4.000%, 2/01/42 |
|
|
2/31 at 100.00 |
|
|
|
443,130 |
|
|
|
|
|
|
| |
500 |
|
|
|
|
New York Liberty Development Corporation, New York, Liberty Revenue Bonds, 3 World Trade Center Project, Class 1 Series
2014, 5.000%, 11/15/44, 144A |
|
|
11/24 at 100.00 |
|
|
|
447,825 |
|
|
|
|
|
|
| |
500 |
|
|
|
|
New York Transportation Development Corporation, Special Facility Revenue Bonds, Delta
Air Lines, Inc. - LaGuardia Airport Terminals C&D Redevelopment Project, Series 2023, 6.000%, 4/01/35, (AMT) |
|
|
4/31 at 100.00 |
|
|
|
518,093 |
|
|
|
|
|
|
|
Total New York |
|
|
|
|
|
|
3,517,460 |
|
|
|
|
|
|
|
|
|
|
|
|
North Carolina - 2.8% |
|
|
|
|
|
|
|
|
|
|
|
|
|
| |
685 |
|
|
|
|
North Carolina Medical Care Commission, Retirement Facilities First Mortgage Revenue Bonds, Southminster Project, Refunding
Series 2016, 5.000%, 10/01/31 |
|
|
10/24 at 102.00 |
|
|
|
651,409 |
|
|
|
|
|
|
| |
2,000 |
|
|
|
|
North Carolina Turnpike Authority, Triangle Expressway System Revenue Bonds, Senior Lien
Series 2019, 5.000%, 1/01/49 |
|
|
1/30 at 100.00 |
|
|
|
1,914,477 |
|
|
|
|
|
|
|
Total North Carolina |
|
|
|
|
|
|
2,565,886 |
|
|
|
|
|
|
|
|
|
|
|
|
North Dakota - 0.1% |
|
|
|
|
|
|
|
|
|
|
|
|
|
| |
100 |
|
|
|
|
Grand Forks, North Dakota, Senior Housing & Nursing Facilities Revenue Bonds,
Valley Homes and Services Obligated Group, Series 2017, 5.000%, 12/01/36 |
|
|
12/26 at 100.00 |
|
|
|
84,639 |
|
|
|
|
|
|
|
Total North Dakota |
|
|
|
|
|
|
84,639 |
|
|
|
|
|
|
|
|
|
|
|
|
Ohio - 1.7% |
|
|
|
|
|
|
|
|
|
|
|
|
|
| |
1,000 |
|
|
|
|
Buckeye Tobacco Settlement Financing Authority, Ohio, Tobacco Settlement Asset-Backed Revenue Bonds, Refunding Senior Lien Series
2020B-2 Class 2, 5.000%, 6/01/55 |
|
|
6/30 at 100.00 |
|
|
|
819,195 |
|
|
|
|
|
|
| |
1,000 |
|
|
|
|
Cleveland-Cuyahoga County Port Authroity, Ohio, Cultural Facility Revenue Bonds, The
Cleveland Museum of Natural History Project, Series 2021, 4.000%, 7/01/51 |
|
|
7/31 at 100.00 |
|
|
|
786,015 |
|
|
|
|
|
|
|
Total Ohio |
|
|
|
|
|
|
1,605,210 |
|
|
|
|
|
|
|
|
|
|
|
|
Oklahoma - 0.6% |
|
|
|
|
|
|
|
|
|
|
|
|
|
| |
670 |
|
|
|
|
Oklahoma Development Finance Authority, Health System Revenue Bonds, OU Medicine Project,
Series 2018B, 5.500%, 8/15/52 |
|
|
8/28 at 100.00 |
|
|
|
580,917 |
|
|
|
|
|
|
|
Total Oklahoma |
|
|
|
|
|
|
580,917 |
|
|
|
|
|
|
|
|
|
|
|
|
Oregon - 0.1% |
|
|
|
|
|
|
|
|
|
|
|
|
|
| |
55 |
|
|
|
|
Clackamas County Hospital Facility Authority, Oregon, Revenue Bonds, Rose Villa Inc.,
Series 2020A, 5.250%, 11/15/50 |
|
|
11/25 at 102.00 |
|
|
|
45,753 |
|
|
|
|
|
|
|
Total Oregon |
|
|
|
|
|
|
45,753 |
|
|
|
|
|
|
|
|
|
|
|
|
Pennsylvania - 2.3% |
|
|
|
|
|
|
|
|
|
|
|
|
|
| |
1,000 |
|
|
|
|
Berks County Municipal Authority, Pennsylvania, Revenue Bonds, Reading Hospital & Medical Center Project, Series 2012A,
5.000%, 11/01/40 |
|
|
11/23 at 100.00 |
|
|
|
546,412 |
|
|
|
|
|
|
| |
500 |
|
|
|
|
Lancaster County Hospital Authority, Pennsylvania, Revenue Bonds, Penn State Health, Series 2021, 5.000%, 11/01/51 |
|
|
11/29 at 100.00 |
|
|
|
472,117 |
|
|
|
|
|
|
| |
500 |
|
|
|
|
Lehigh County, Pennsylvania, Revenue Bonds, Lehigh Valley Dual Language Charter School, General Purpose Authority, Series 2023,
7.000%, 6/01/53 |
|
|
6/30 at 103.00 |
|
|
|
488,979 |
|
66
|
|
|
|
|
|
|
|
|
|
|
|
|
|
|
|
Principal
Amount (000) |
|
|
|
|
Description (a) |
|
|
Optional Call
Provisions (b) |
|
|
|
Value |
|
|
|
|
|
|
|
|
|
|
|
|
Pennsylvania (continued) |
|
|
|
|
|
|
|
|
| $ |
560 |
|
|
(e) |
|
Montgomery County Industrial Development Authority, Pennsylvania, Health System Revenue
Bonds, Albert Einstein Healthcare Network Issue, Series 2015A, 5.250%, 1/15/36, (Pre-refunded 1/15/25) |
|
|
1/25 at 100.00 |
|
|
$ |
568,624 |
|
|
|
|
|
|
|
Total Pennsylvania |
|
|
|
|
|
|
2,076,132 |
|
|
|
|
|
|
|
|
|
|
|
|
Puerto Rico - 1.7% |
|
|
|
|
|
|
|
|
|
|
|
|
|
|
|
|
|
|
|
Puerto Rico Sales Tax Financing Corporation, Sales Tax Revenue Bonds, Restructured
2018A-1: |
|
|
|
|
|
|
|
|
| |
1,760 |
|
|
|
|
0.000%, 7/01/51 |
|
|
7/28 at 30.01 |
|
|
|
318,141 |
|
| |
500 |
|
|
|
|
4.750%, 7/01/53 |
|
|
7/28 at 100.00 |
|
|
|
423,560 |
|
| |
745 |
|
|
|
|
5.000%, 7/01/58 |
|
|
7/28 at 100.00 |
|
|
|
652,254 |
|
|
|
|
|
|
| |
200 |
|
|
|
|
Puerto Rico Sales Tax Financing Corporation, Sales Tax Revenue Bonds, Taxable
Restructured Cofina Project Series 2019A-2, 4.329%, 7/01/40 |
|
|
7/28 at 100.00 |
|
|
|
173,265 |
|
|
|
|
|
|
|
Total Puerto Rico |
|
|
|
|
|
|
1,567,220 |
|
|
|
|
|
|
|
|
|
|
|
|
South Carolina - 0.5% |
|
|
|
|
|
|
|
|
|
|
|
|
|
| |
620 |
|
|
|
|
South Carolina Jobs-Economic Development Authority, Economic Development Revenue Bonds,
Bishop Gadsden Episcopal Retirement Community, Series 2019A, 4.000%, 4/01/49 |
|
|
4/26 at 103.00 |
|
|
|
418,625 |
|
|
|
|
|
|
|
Total South Carolina |
|
|
|
|
|
|
418,625 |
|
|
|
|
|
|
|
|
|
|
|
|
South Dakota - 1.5% |
|
|
|
|
|
|
|
|
|
|
|
|
|
| |
100 |
|
|
|
|
Sioux Falls, South Dakota, Health Facilities Revenue Bonds, Dow Rummel Village Project, Series 2017, 5.125%, 11/01/47 |
|
|
11/26 at 100.00 |
|
|
|
79,228 |
|
|
|
|
|
|
| |
1,300 |
|
|
|
|
South Dakota Health and Educational Facilities Authority, Revenue Bonds, Avera Health
System, Series 2014, 5.000%, 7/01/44 |
|
|
7/24 at 100.00 |
|
|
|
1,259,217 |
|
|
|
|
|
|
|
Total South Dakota |
|
|
|
|
|
|
1,338,445 |
|
|
|
|
|
|
|
|
|
|
|
|
Tennessee - 1.1% |
|
|
|
|
|
|
|
|
|
|
|
|
|
| |
870 |
|
|
|
|
Knox County Health, Educational and Housing Facilities Board, Tennessee, Revenue Bonds, University Health System, Inc., Series
2016, 5.000%, 9/01/47 |
|
|
9/26 at 100.00 |
|
|
|
747,328 |
|
|
|
|
|
|
| |
250 |
|
|
|
|
Metropolitan Nashville Airport Authority, Tennessee, Airport Improvement Revenue Bonds,
Series 2022B, 5.500%, 7/01/42, (AMT) |
|
|
7/32 at 100.00 |
|
|
|
255,115 |
|
|
|
|
|
|
|
Total Tennessee |
|
|
|
|
|
|
1,002,443 |
|
|
|
|
|
|
|
|
|
|
|
|
Texas - 10.2% |
|
|
|
|
|
|
|
|
|
|
|
|
|
| |
250 |
|
|
|
|
Bexar County Hospital District, Texas, Certificates of Obligation, Series 2023, 5.000%, 2/15/48 |
|
|
8/32 at 100.00 |
|
|
|
251,868 |
|
|
|
|
|
|
| |
670 |
|
|
(e) |
|
Central Texas Regional Mobility Authority, Revenue Bonds, Senior Lien, Series 2015A, 5.000%, 1/01/40, (Pre-refunded 7/01/25) |
|
|
7/25 at 100.00 |
|
|
|
681,602 |
|
|
|
|
|
|
| |
1,000 |
|
|
|
|
Dallas-Fort Worth International Airport, Texas, Joint Revenue Bonds, Refunding Series 2021A, 4.000%, 11/01/46 |
|
|
11/30 at 100.00 |
|
|
|
844,688 |
|
|
|
|
|
|
| |
500 |
|
|
|
|
Grand Parkway Transportation Corporation, Texas, System Toll Revenue Bonds, Refunding First Tier Series 2020C, 4.000%,
10/01/45 |
|
|
4/30 at 100.00 |
|
|
|
412,516 |
|
|
|
|
|
|
| |
450 |
|
|
|
|
Hutto Independent School District, Williamson County, Texas, General Obligation Bonds, School Building Series 2023, 5.000%,
8/01/48 |
|
|
8/33 at 100.00 |
|
|
|
461,490 |
|
|
|
|
|
|
| |
500 |
|
|
|
|
Kyle, Texas, Special Assessment Revenue Bonds, Southwest Kyle Public Improvement District 1 Improvement Area 2 Project, Series
2023, 6.750%, 9/01/48, 144A, (WI/DD) |
|
|
9/33 at 100.00 |
|
|
|
496,365 |
|
|
|
|
|
|
| |
500 |
|
|
|
|
Lower Colorado River Authority, Texas, Transmission Contract Revenue Bonds, LCRA Transmission Services Corporation Project,
Refunding Series 2015, 5.000%, 5/15/40 |
|
|
5/25 at 100.00 |
|
|
|
497,338 |
|
67
|
|
|
| NMI |
|
Nuveen Municipal Income Fund, Inc. (continued) Portfolio of Investments October 31,
2023 |
|
|
|
|
|
|
|
|
|
|
|
|
|
|
|
|
Principal
Amount (000) |
|
|
|
|
Description (a) |
|
|
Optional Call
Provisions (b) |
|
|
|
Value |
|
|
|
|
|
|
|
|
|
|
|
|
Texas (continued) |
|
|
|
|
|
|
|
|
| $ |
125 |
|
|
|
|
Mission Economic Development Corporation, Texas, Revenue Bonds, Natgasoline Project, Senior Lien Series 2018, 4.625%, 10/01/31,
(AMT), 144A |
|
|
11/23 at 103.00 |
|
|
$ |
117,670 |
|
|
|
|
|
|
| |
1,000 |
|
|
|
|
New Hope Cultural Education Facilities Finance Corporation, Texas, Student Housing Revenue Bonds,
CHF-Collegiate Housing Foundation - College Station I LLC - Texas A&M University Project, Series 2014A, 5.000%, 4/01/46 - AGM Insured |
|
|
4/24 at 100.00 |
|
|
|
895,721 |
|
|
|
|
|
|
| |
200 |
|
|
(e) |
|
North Texas Tollway Authority, Special Projects System Revenue Bonds, Convertible Capital Appreciation Series 2011C, 7.000%,
9/01/43, (Pre-refunded 9/01/31) |
|
|
9/31 at 100.00 |
|
|
|
235,907 |
|
|
|
|
|
|
| |
500 |
|
|
|
|
North Texas Tollway Authority, System Revenue Bonds, Refunding Second Tier, Series 2015A, 5.000%, 1/01/38 |
|
|
1/25 at 100.00 |
|
|
|
489,772 |
|
|
|
|
|
|
| |
535 |
|
|
|
|
Plano, Collin and Denton Counties, Texas, Special Assessment Revenue Bonds, Haggard Farm Public Improvement District Project,
Area 1 Project Series 2023, 7.500%, 9/15/53, 144A, (WI/DD) |
|
|
9/33 at 100.00 |
|
|
|
535,282 |
|
|
|
|
|
|
| |
240 |
|
|
|
|
Reagan Hospital District of Reagan County, Texas, Limited Tax Revenue Bonds, Series 2014A, 5.000%, 2/01/34 |
|
|
2/24 at 100.00 |
|
|
|
235,795 |
|
|
|
|
|
|
| |
295 |
|
|
|
|
SA Energy Acquisition Public Facilities Corporation, Texas, Gas Supply Revenue Bonds, Series 2007, 5.500%, 8/01/27 |
|
|
No Opt. Call |
|
|
|
298,353 |
|
|
|
|
|
|
| |
1,000 |
|
|
|
|
San Antonio, Texas, Water System Revenue Bonds, Refunding Junior Lien Series 2018A, 5.000%, 5/15/48 |
|
|
5/28 at 100.00 |
|
|
|
1,006,865 |
|
|
|
|
|
|
| |
1,000 |
|
|
|
|
Texas Private Activity Bond Surface Transporation Corporation, Senior Lien Revenue Bonds, NTE Mobility Partners Segments 3 LLC
Segments 3C Project, Series 2019, 5.000%, 6/30/58, (AMT) |
|
|
6/29 at 100.00 |
|
|
|
915,685 |
|
|
|
|
|
|
| |
1,000 |
|
|
|
|
Texas Transportation Commission, Central Texas Turnpike System Revenue Bonds, Refunding
Second Tier Series 2015C, 5.000%, 8/15/32 |
|
|
8/24 at 100.00 |
|
|
|
985,308 |
|
|
|
|
|
|
|
Total Texas |
|
|
|
|
|
|
9,362,225 |
|
|
|
|
|
|
|
|
|
|
|
|
Utah - 0.4% |
|
|
|
|
|
|
|
|
|
|
|
|
|
| |
410 |
|
|
|
|
Salt Lake City, Utah, Airport Revenue Bonds, International Airport Series 2023A, 5.250%,
7/01/53, (AMT) |
|
|
7/33 at 100.00 |
|
|
|
400,840 |
|
|
|
|
|
|
|
Total Utah |
|
|
|
|
|
|
400,840 |
|
|
|
|
|
|
|
|
|
|
|
|
Virgin Islands - 0.4% |
|
|
|
|
|
|
|
|
|
|
|
|
|
| |
380 |
|
|
|
|
Matching Fund Special Purpose Securitization Corporation, Virgin Islands, Revenue Bonds,
Series 2022A, 5.000%, 10/01/32 |
|
|
No Opt. Call |
|
|
|
373,654 |
|
|
|
|
|
|
|
Total Virgin Islands |
|
|
|
|
|
|
373,654 |
|
|
|
|
|
|
|
|
|
|
|
|
Virginia - 2.0% |
|
|
|
|
|
|
|
|
|
|
|
|
|
| |
1,265 |
|
|
|
|
Virginia Small Business Financing Authority, Private Activity Revenue Bonds, Transform 66 P3 Project, Senior Lien Series 2017,
5.000%, 12/31/56, (AMT) |
|
|
6/27 at 100.00 |
|
|
|
1,159,947 |
|
|
|
|
|
|
| |
750 |
|
|
|
|
Virginia Small Business Financing Authority, Revenue Bonds, 95 Express Lanes LLC Project,
Refunding Senior Lien Series 2022, 5.000%, 12/31/47, (AMT) |
|
|
12/32 at 100.00 |
|
|
|
708,146 |
|
|
|
|
|
|
|
Total Virginia |
|
|
|
|
|
|
1,868,093 |
|
|
|
|
|
|
|
|
|
|
|
|
West Virginia - 1.0% |
|
|
|
|
|
|
|
|
|
|
|
|
|
| |
1,000 |
|
|
|
|
West Virginia Hospital Finance Authority, Revenue Bonds, West Virginia University Health
System Obligated Group, Improvement Series 2017A, 5.000%, 6/01/47 |
|
|
6/27 at 100.00 |
|
|
|
959,062 |
|
|
|
|
|
|
|
Total West Virginia |
|
|
|
|
|
|
959,062 |
|
68
|
|
|
|
|
|
|
|
|
|
|
|
|
|
|
|
Principal
Amount (000) |
|
|
|
|
Description (a) |
|
|
Optional Call
Provisions (b) |
|
|
|
Value |
|
|
|
|
|
|
|
|
|
|
|
|
Wisconsin - 3.8% |
|
|
|
|
|
|
|
|
|
|
|
|
|
|
|
|
|
|
|
Public Finance Authority of Wisconsin, Conference Center and Hotel Revenue Bonds, Lombard Public Facilities Corporation, Second
Tier Series 2018B: |
|
|
|
|
|
|
|
|
| $ |
4 |
|
|
(c) |
|
0.000%, 1/01/46, 144A |
|
|
No Opt. Call |
|
|
$ |
79 |
|
| |
4 |
|
|
(c) |
|
0.000%, 1/01/47, 144A |
|
|
No Opt. Call |
|
|
|
72 |
|
| |
4 |
|
|
(c) |
|
0.000%, 1/01/48, 144A |
|
|
No Opt. Call |
|
|
|
67 |
|
| |
4 |
|
|
(c) |
|
0.000%, 1/01/49, 144A |
|
|
No Opt. Call |
|
|
|
63 |
|
| |
3 |
|
|
(c) |
|
0.000%, 1/01/50, 144A |
|
|
No Opt. Call |
|
|
|
57 |
|
| |
4 |
|
|
(c) |
|
0.000%, 1/01/51, 144A |
|
|
No Opt. Call |
|
|
|
59 |
|
| |
98 |
|
|
(c) |
|
1.000%, 7/01/51, 144A |
|
|
3/28 at 100.00 |
|
|
|
51,864 |
|
| |
4 |
|
|
(c) |
|
0.000%, 1/01/52, 144A |
|
|
No Opt. Call |
|
|
|
54 |
|
| |
4 |
|
|
(c) |
|
0.000%, 1/01/53, 144A |
|
|
No Opt. Call |
|
|
|
51 |
|
| |
4 |
|
|
(c) |
|
0.000%, 1/01/54, 144A |
|
|
No Opt. Call |
|
|
|
47 |
|
| |
4 |
|
|
(c) |
|
0.000%, 1/01/55, 144A |
|
|
No Opt. Call |
|
|
|
44 |
|
| |
4 |
|
|
(c) |
|
0.000%, 1/01/56, 144A |
|
|
No Opt. Call |
|
|
|
41 |
|
| |
4 |
|
|
(c) |
|
0.000%, 1/01/57, 144A |
|
|
No Opt. Call |
|
|
|
38 |
|
| |
4 |
|
|
(c) |
|
0.000%, 1/01/58, 144A |
|
|
No Opt. Call |
|
|
|
35 |
|
| |
3 |
|
|
(c) |
|
0.000%, 1/01/59, 144A |
|
|
No Opt. Call |
|
|
|
33 |
|
| |
3 |
|
|
(c) |
|
0.000%, 1/01/60, 144A |
|
|
No Opt. Call |
|
|
|
31 |
|
| |
3 |
|
|
(c) |
|
0.000%, 1/01/61, 144A |
|
|
No Opt. Call |
|
|
|
28 |
|
| |
3 |
|
|
(c) |
|
0.000%, 1/01/62, 144A |
|
|
No Opt. Call |
|
|
|
26 |
|
| |
3 |
|
|
(c) |
|
0.000%, 1/01/63, 144A |
|
|
No Opt. Call |
|
|
|
24 |
|
| |
3 |
|
|
(c) |
|
0.000%, 1/01/64, 144A |
|
|
No Opt. Call |
|
|
|
23 |
|
| |
3 |
|
|
(c) |
|
0.000%, 1/01/65, 144A |
|
|
No Opt. Call |
|
|
|
21 |
|
| |
3 |
|
|
(c) |
|
0.000%, 1/01/66, 144A |
|
|
No Opt. Call |
|
|
|
19 |
|
| |
42 |
|
|
(c) |
|
0.000%, 1/01/67, 144A |
|
|
No Opt. Call |
|
|
|
226 |
|
|
|
|
|
|
| |
500 |
|
|
|
|
Public Finance Authority of Wisconsin, Pollution Control Revenue Bonds, Duke Energy Progress Project, Refunding Series 2022A-2, 3.300%, 10/01/46, (Mandatory Put 10/01/26) |
|
|
No Opt. Call |
|
|
|
487,380 |
|
|
|
|
|
|
| |
200 |
|
|
|
|
Wisconsin Health and Educational Facilities Authority, Wisconsin, Revenue Bonds, Dickson Hollow Project. Series 2014, 5.125%,
10/01/34 |
|
|
12/23 at 101.00 |
|
|
|
172,248 |
|
|
|
|
|
|
| |
200 |
|
|
|
|
Wisconsin Health and Educational Facilities Authority, Wisconsin, Revenue Bonds, Oakwood Lutheran Senior Ministries, Series 2021,
4.000%, 1/01/57 |
|
|
1/27 at 103.00 |
|
|
|
105,478 |
|
|
|
|
|
|
| |
1,000 |
|
|
|
|
Wisconsin Health and Educational Facilities Authority, Wisconsin, Revenue Bonds, PHW Oconomowoc, Inc. Project, Series 2018,
5.125%, 10/01/48 |
|
|
12/23 at 102.00 |
|
|
|
788,175 |
|
|
|
|
|
|
| |
1,000 |
|
|
|
|
Wisconsin Health and Educational Facilities Authority, Wisconsin, Revenue Bonds, ProHealth Care, Inc. Obligated Group, Refunding
Series 2015, 5.000%, 8/15/39 |
|
|
8/24 at 100.00 |
|
|
|
966,744 |
|
|
|
|
|
|
| |
1,000 |
|
|
|
|
Wisconsin Health and Educational Facilities Authority, Wisconsin, Revenue Bonds,
ThedaCare Inc, Series 2015, 5.000%, 12/15/44 |
|
|
12/24 at 100.00 |
|
|
|
932,670 |
|
|
|
|
|
|
|
Total Wisconsin |
|
|
|
|
|
|
3,505,697 |
|
|
|
|
|
|
|
Total Municipal Bonds
(cost $95,989,478) |
|
|
|
|
|
|
88,931,951 |
|
|
|
|
|
|
|
Total Long-Term Investments
(cost $95,989,478) |
|
|
|
|
|
|
88,931,951 |
|
|
|
|
|
|
|
Principal
Amount (000) |
|
|
|
|
Description (a) |
|
|
Optional Call
Provisions (b) |
|
|
|
Value |
|
|
|
|
|
|
|
SHORT-TERM INVESTMENTS - 2.9% |
|
|
|
|
|
|
|
|
|
|
|
|
|
|
|
|
|
|
|
MUNICIPAL BONDS - 2.9% |
|
|
|
|
|
|
|
|
|
|
|
|
|
|
|
|
|
|
|
Colorado - 1.3% |
|
|
|
|
|
|
|
|
| $ |
1,200 |
|
|
(f) |
|
Colorado Springs, Colorado, Utilities System Revenue Bonds, Refunding Series 2009C,
4.090%, 11/01/28, (Mandatory Put 11/7/2023) |
|
|
10/23 at 100.00 |
|
|
$ |
1,200,000 |
|
|
|
|
|
|
|
Total Colorado |
|
|
|
|
|
|
1,200,000 |
|
69
|
|
|
| NMI |
|
Nuveen Municipal Income Fund, Inc. (continued) Portfolio of Investments October 31, 2023 |
|
|
|
|
|
|
|
|
|
|
|
|
|
|
|
|
Principal
Amount (000) |
|
|
|
|
Description (a) |
|
|
Optional Call
Provisions (b) |
|
|
|
Value |
|
|
|
|
|
|
|
|
|
|
|
|
Missouri - 1.6% |
|
|
|
|
|
|
|
|
| $ |
1,480 |
|
|
(f) |
|
Missouri Health and Educational Facilities Authority, Revenue Bonds, BJC Health System,
Variable Rate Demand Obligations, Series 2008C, 4.060%, 5/15/38, (Mandatory Put 11/7/2023) |
|
|
10/23 at 100.00 |
|
|
$ |
1,480,000 |
|
|
|
|
|
|
|
Total Missouri |
|
|
|
|
|
|
1,480,000 |
|
|
|
|
|
|
|
Total Municipal Bonds
(cost $2,680,000) |
|
|
|
|
|
|
2,680,000 |
|
|
|
|
|
|
|
Total Short-Term Investments
(cost $2,680,000) |
|
|
|
|
|
|
2,680,000 |
|
|
|
|
|
|
|
Total Investments (cost $98,669,478) - 99.5% |
|
|
|
|
|
|
91,611,951 |
|
|
|
|
|
|
|
Other Assets & Liabilities, Net - 0.5% |
|
|
|
|
|
|
505,457 |
|
|
|
|
|
|
|
Net Assets Applicable to Common Shares - 100% |
|
|
|
|
|
$ |
92,117,408 |
|
| (a) |
All percentages shown in the Portfolio of Investments are based on net assets applicable to common shares unless otherwise
noted. |
| (b) |
Optional Call Provisions: Dates (month and year) and prices of the earliest optional call or redemption. There may be
other call provisions at varying prices at later dates. Certain mortgage-backed securities may be subject to periodic principal paydowns. Optional Call Provisions are not covered by the report of independent registered public accounting firm.
|
| (c) |
Defaulted security. A security whose issuer has failed to fully pay principal and/or interest when due, or is under the
protection of bankruptcy. |
| (d) |
For fair value measurement disclosure purposes, investment classified as Level 3. |
| (e) |
Backed by an escrow or trust containing sufficient U.S. Government or U.S. Government agency securities, which ensure the
timely payment of principal and interest. |
| (f) |
Investment has a maturity of greater than one year, but has variable rate and/or demand features which qualify it as a
short-term investment. The rate disclosed, as well as the reference rate and spread, where applicable, is that in effect as of the end of the reporting period. This rate changes periodically based on market conditions or a specified market index.
|
| 144A |
Investment is exempt from registration under Rule 144A of the Securities Act of 1933, as amended. These investments may
only be resold in transactions exempt from registration, which are normally those transactions with qualified institutional buyers. |
| AMT |
Alternative Minimum Tax |
| WI/DD |
When-issued or delayed delivery security. |
See Notes to Financial Statements
70
Statement of Assets and Liabilities
|
|
|
|
|
|
|
|
|
|
|
|
|
| October 31, 2023 |
|
NUV |
|
|
NUW |
|
|
NMI |
|
| ASSETS |
|
|
|
|
|
|
|
|
|
|
|
|
|
|
|
|
| Long-term investments, at
value† |
|
$ |
1,795,221,291 |
|
|
$ |
252,470,463 |
|
|
$ |
88,931,951 |
|
|
|
|
|
| Short-term investments, at value◇ |
|
|
– |
|
|
|
– |
|
|
|
2,680,000 |
|
|
|
|
|
| Cash |
|
|
12,245,560 |
|
|
|
1,611,440 |
|
|
|
849,455 |
|
|
|
|
|
| Cash collateral at broker for investments in futures
contracts(1) |
|
|
– |
|
|
|
318,012 |
|
|
|
– |
|
|
|
|
|
| Receivables: |
|
|
|
|
|
|
|
|
|
|
|
|
|
|
|
|
| Interest |
|
|
22,675,621 |
|
|
|
3,279,355 |
|
|
|
1,348,503 |
|
|
|
|
|
| Investments sold |
|
|
2,455,000 |
|
|
|
195,000 |
|
|
|
2,550,636 |
|
|
|
|
|
| Variation margin on futures contracts |
|
|
– |
|
|
|
7,453 |
|
|
|
– |
|
|
|
|
|
| Deferred offering costs |
|
|
– |
|
|
|
– |
|
|
|
111,370 |
|
|
|
|
|
| Other |
|
|
490,160 |
|
|
|
14,064 |
|
|
|
4,259 |
|
| |
|
|
|
| Total assets |
|
|
1,833,087,632 |
|
|
|
257,895,787 |
|
|
|
96,476,174 |
|
|
|
|
|
| LIABILITIES |
|
|
|
|
|
|
|
|
|
|
|
|
|
|
|
|
| Floating rate obligations |
|
|
21,480,000 |
|
|
|
2,000,000 |
|
|
|
– |
|
|
|
|
|
| Payables: |
|
|
|
|
|
|
|
|
|
|
|
|
|
|
|
|
| Dividends |
|
|
5,545,982 |
|
|
|
748,253 |
|
|
|
301,151 |
|
|
|
|
|
| Interest |
|
|
117,606 |
|
|
|
3,919 |
|
|
|
– |
|
|
|
|
|
| Investments purchased - regular settlement |
|
|
– |
|
|
|
– |
|
|
|
2,465,565 |
|
|
|
|
|
| Investments purchased - when-issued/delayed-delivery settlement |
|
|
– |
|
|
|
– |
|
|
|
1,505,466 |
|
|
|
|
|
| Accrued expenses: |
|
|
|
|
|
|
|
|
|
|
|
|
|
|
|
|
| Custodian fees |
|
|
117,454 |
|
|
|
33,546 |
|
|
|
15,039 |
|
|
|
|
|
| Investor relations |
|
|
30,841 |
|
|
|
4,682 |
|
|
|
1,067 |
|
|
|
|
|
| Management fees |
|
|
711,203 |
|
|
|
122,141 |
|
|
|
48,421 |
|
|
|
|
|
| Directors/Trustees fees |
|
|
492,142 |
|
|
|
7,874 |
|
|
|
2,293 |
|
|
|
|
|
| Professional fees |
|
|
10,436 |
|
|
|
7,454 |
|
|
|
3,971 |
|
|
|
|
|
| Shareholder reporting expenses |
|
|
57,333 |
|
|
|
7,264 |
|
|
|
3,973 |
|
|
|
|
|
| Shareholder servicing agent fees |
|
|
71,192 |
|
|
|
141 |
|
|
|
1,025 |
|
|
|
|
|
| Shelf offering costs |
|
|
– |
|
|
|
– |
|
|
|
10,787 |
|
|
|
|
|
| Other |
|
|
21 |
|
|
|
17 |
|
|
|
8 |
|
| |
|
|
|
| Total liabilities |
|
|
28,634,210 |
|
|
|
2,935,291 |
|
|
|
4,358,766 |
|
|
|
|
|
| Commitments and
contingencies(2) |
|
|
|
|
|
|
|
|
|
|
|
|
| |
|
|
|
| Net assets applicable to common
shares |
|
$ |
1,804,453,422 |
|
|
$ |
254,960,496 |
|
|
$ |
92,117,408 |
|
|
|
|
|
| Common shares outstanding |
|
|
207,541,595 |
|
|
|
17,951,336 |
|
|
|
10,051,095 |
|
| Net asset value (“NAV”) per common
share outstanding |
|
$ |
8.69 |
|
|
$ |
14.20 |
|
|
$ |
9.16 |
|
|
|
|
|
| NET ASSETS APPLICABLE TO COMMON SHARES
CONSIST OF: |
|
|
|
|
|
|
|
|
|
|
|
|
|
|
|
|
| Common shares, $0.01 par value per share |
|
$ |
2,075,416 |
|
|
$ |
179,513 |
|
|
$ |
100,511 |
|
|
|
|
|
| Paid-in capital |
|
|
1,963,547,908 |
|
|
|
268,620,421 |
|
|
|
105,319,950 |
|
|
|
|
|
| Total distributable earnings (loss) |
|
|
(161,169,902 |
) |
|
|
(13,839,438 |
) |
|
|
(13,303,053 |
) |
| |
|
|
|
| Net assets applicable to common shares |
|
$ |
1,804,453,422 |
|
|
$ |
254,960,496 |
|
|
$ |
92,117,408 |
|
|
|
|
|
| Authorized shares: |
|
|
|
|
|
|
|
|
|
|
|
|
|
|
|
|
| Common |
|
|
350,000,000 |
|
|
|
Unlimited |
|
|
|
200,000,000 |
|
|
|
|
|
| † Long-term investments, cost |
|
$ |
1,882,403,978 |
|
|
$ |
266,118,457 |
|
|
$ |
95,989,478 |
|
|
|
|
|
|
◇
Short-term investments, cost |
|
$ |
– |
|
|
$ |
– |
|
|
$ |
2,680,000 |
|
| (1) |
Cash pledged to collateralize the net payment obligations for investments in derivatives. |
| (2) |
As disclosed in Notes to Financial Statements. |
See Notes to Financial Statements
71
Statement of Operations
|
|
|
|
|
|
|
|
|
|
|
|
|
| Year Ended October 31,
2023 |
|
|
NUV |
|
|
|
NUW |
|
|
|
NMI |
|
|
|
|
|
| INVESTMENT INCOME |
|
|
|
|
|
|
|
|
|
|
|
|
| |
|
|
|
| Interest |
|
$ |
82,246,713 |
|
|
$ |
10,677,425 |
|
|
$ |
4,503,481 |
|
|
|
|
|
| Total investment income |
|
|
82,246,713 |
|
|
|
10,677,425 |
|
|
|
4,503,481 |
|
|
|
|
|
| EXPENSES |
|
|
|
|
|
|
|
|
|
|
|
|
|
|
|
|
| Management fees |
|
|
8,599,863 |
|
|
|
1,490,583 |
|
|
|
595,150 |
|
|
|
|
|
| Shareholder servicing agent fees |
|
|
302,074 |
|
|
|
316 |
|
|
|
5,831 |
|
|
|
|
|
| Interest expense |
|
|
791,579 |
|
|
|
74,476 |
|
|
|
761 |
|
|
|
|
|
| Directors/Trustees fees |
|
|
63,865 |
|
|
|
8,982 |
|
|
|
3,270 |
|
|
|
|
|
| Custodian expenses, net |
|
|
53,379 |
|
|
|
30,179 |
|
|
|
14,351 |
|
|
|
|
|
| Investor relations expenses |
|
|
75,177 |
|
|
|
10,825 |
|
|
|
4,293 |
|
|
|
|
|
| Professional fees |
|
|
109,787 |
|
|
|
48,556 |
|
|
|
55,405 |
|
|
|
|
|
| Shareholder reporting expenses |
|
|
128,425 |
|
|
|
23,845 |
|
|
|
23,381 |
|
|
|
|
|
| Stock exchange listing fees |
|
|
62,551 |
|
|
|
7,326 |
|
|
|
7,789 |
|
|
|
|
|
| Other |
|
|
57,854 |
|
|
|
585 |
|
|
|
11,564 |
|
| |
|
|
|
| Total expenses |
|
|
10,244,554 |
|
|
|
1,695,673 |
|
|
|
721,795 |
|
|
|
|
|
| Net investment income (loss) |
|
|
72,002,159 |
|
|
|
8,981,752 |
|
|
|
3,781,686 |
|
|
|
|
|
| REALIZED AND UNREALIZED GAIN (LOSS) |
|
|
|
|
|
|
|
|
|
|
|
|
|
|
|
|
| Realized gain (loss) from: |
|
|
|
|
|
|
|
|
|
|
|
|
|
|
|
|
| Investments |
|
|
(21,685,836 |
) |
|
|
(1,450,379 |
) |
|
|
(1,348,719 |
) |
|
|
|
|
| Futures contracts |
|
|
– |
|
|
|
1,687,127 |
|
|
|
– |
|
| |
|
|
|
| Net realized gain (loss) |
|
|
(21,685,836 |
) |
|
|
236,748 |
|
|
|
(1,348,719 |
) |
|
|
|
|
| Change in unrealized appreciation (depreciation) on: |
|
|
|
|
|
|
|
|
|
|
|
|
|
|
|
|
| Investments |
|
|
4,622,056 |
|
|
|
101,760 |
|
|
|
483,356 |
|
|
|
|
|
| Futures contracts |
|
|
– |
|
|
|
(686,998 |
) |
|
|
– |
|
| |
|
|
|
| Net change in unrealized appreciation
(depreciation) |
|
|
4,622,056 |
|
|
|
(585,238 |
) |
|
|
483,356 |
|
| |
|
|
|
| Net realized and unrealized gain (loss) |
|
|
(17,063,780 |
) |
|
|
(348,490 |
) |
|
|
(865,363 |
) |
|
|
|
|
| Net increase (decrease) in net assets applicable to common
shares from operations |
|
$ |
54,938,379 |
|
|
$ |
8,633,262 |
|
|
$ |
2,916,323 |
|
See Notes to Financial Statements
72
Statement of Changes in Net Assets
|
|
|
|
|
|
|
|
|
|
|
|
|
|
|
|
|
|
|
|
|
|
|
| |
|
NUV |
|
|
|
NUW |
| |
|
|
|
|
|
|
|
|
|
|
|
|
| |
|
Year Ended
10/31/23 |
|
|
Year Ended
10/31/22 |
|
|
|
|
|
|
Year Ended
10/31/23 |
|
|
Year Ended
10/31/22 |
|
|
| OPERATIONS |
|
|
|
|
|
|
|
|
|
|
|
|
|
|
|
|
|
|
|
|
|
|
|
|
|
|
|
|
|
|
| Net investment income (loss) |
|
$ |
72,002,159 |
|
|
$ |
68,382,062 |
|
|
|
|
|
|
$ |
8,981,752 |
|
|
$ |
8,265,079 |
|
|
|
|
|
|
|
|
|
|
|
| Net realized gain (loss) |
|
|
(21,685,836 |
) |
|
|
(42,644,074 |
) |
|
|
|
|
|
|
236,748 |
|
|
|
(953,863 |
) |
|
|
|
|
|
|
|
|
|
|
| Net change in unrealized appreciation
(depreciation) |
|
|
4,622,056 |
|
|
|
(340,070,110 |
) |
|
|
|
|
|
|
(585,238 |
) |
|
|
(51,604,479 |
) |
|
|
|
|
|
|
|
|
|
|
| Net increase (decrease) in net assets applicable to common shares
from operations |
|
|
54,938,379 |
|
|
|
(314,332,122 |
) |
|
|
|
|
|
|
8,633,262 |
|
|
|
(44,293,263 |
) |
|
|
|
|
|
|
|
|
|
|
| DISTRIBUTIONS TO COMMON SHAREHOLDERS |
|
|
|
|
|
|
|
|
|
|
|
|
|
|
|
|
|
|
|
|
|
|
|
|
|
|
|
|
|
|
| Dividends |
|
|
(69,941,517 |
) |
|
|
(69,733,974 |
) |
|
|
|
|
|
|
(8,625,617 |
) |
|
|
(11,846,086 |
) |
|
|
|
|
|
|
|
|
|
|
| Total distributions |
|
|
(69,941,517 |
) |
|
|
(69,733,974 |
) |
|
|
|
|
|
|
(8,625,617 |
) |
|
|
(11,846,086 |
) |
|
|
|
|
|
|
|
|
|
|
| CAPITAL SHARE TRANSACTIONS |
|
|
|
|
|
|
|
|
|
|
|
|
|
|
|
|
|
|
|
|
|
|
|
|
|
|
|
|
|
|
| Common shares: |
|
|
|
|
|
|
|
|
|
|
|
|
|
|
|
|
|
|
|
|
|
|
|
|
|
|
|
|
|
|
| Reinvestments of distributions |
|
|
– |
|
|
|
347,096 |
|
|
|
|
|
|
|
– |
|
|
|
– |
|
|
|
|
|
|
|
|
|
|
|
| Net increase (decrease) applicable to common shares from capital
share transactions |
|
|
– |
|
|
|
347,096 |
|
|
|
|
|
|
|
– |
|
|
|
– |
|
|
|
|
|
|
|
|
|
|
|
| Net increase (decrease) in net assets applicable
to common shares |
|
|
(15,003,138 |
) |
|
|
(383,719,000 |
) |
|
|
|
|
|
|
7,645 |
|
|
|
(56,139,349 |
) |
|
|
|
|
|
|
|
|
|
|
| Net assets applicable to common shares at the
beginning of the period |
|
|
1,819,456,560 |
|
|
|
2,203,175,560 |
|
|
|
|
|
|
|
254,952,851 |
|
|
|
311,092,200 |
|
|
|
|
|
|
|
|
|
|
|
| Net assets applicable to common shares at the end of the
period |
|
$ |
1,804,453,422 |
|
|
$ |
1,819,456,560 |
|
|
|
|
|
|
$ |
254,960,496 |
|
|
$ |
254,952,851 |
|
|
|
See Notes to Financial Statements
73
|
|
|
|
|
|
|
|
|
|
|
|
|
| |
|
NMI |
|
|
|
|
|
| |
|
Year Ended
10/31/23 |
|
|
|
|
Year Ended
10/31/22 |
|
|
| OPERATIONS |
|
|
|
|
|
|
|
|
|
|
|
|
|
|
|
|
|
| Net investment income (loss) |
|
$ |
3,781,686 |
|
|
|
|
$ |
3,444,459 |
|
|
|
|
|
|
|
|
| Net realized gain (loss) |
|
|
(1,348,719 |
) |
|
|
|
|
(5,141,509 |
) |
|
|
|
|
|
|
|
| Net change in unrealized appreciation (depreciation) |
|
|
483,356 |
|
|
|
|
|
(15,433,338 |
) |
|
|
| |
|
|
|
|
| Net increase (decrease) in net assets applicable to common shares
from operations |
|
|
2,916,323 |
|
|
|
|
|
(17,130,388 |
) |
|
|
|
|
|
|
|
| DISTRIBUTIONS TO COMMON SHAREHOLDERS |
|
|
|
|
|
|
|
|
|
|
|
|
|
|
|
|
|
| Dividends |
|
|
(3,678,642 |
) |
|
|
|
|
(3,259,831 |
) |
|
|
| |
|
|
|
|
| Total distributions |
|
|
(3,678,642 |
) |
|
|
|
|
(3,259,831 |
) |
|
|
|
|
|
|
|
| CAPITAL SHARE TRANSACTIONS |
|
|
|
|
|
|
|
|
|
|
|
|
|
|
|
|
|
| Common shares: |
|
|
|
|
|
|
|
|
|
|
|
|
|
|
|
|
|
| Proceeds from shelf offering, net of offering costs |
|
|
49,338 |
|
|
|
|
|
(9,169 |
) |
|
|
|
|
|
|
|
| Reinvestments of distributions |
|
|
– |
|
|
|
|
|
38,776 |
|
|
|
| |
|
|
|
|
| Net increase (decrease) applicable to common shares from capital
share transactions |
|
|
49,338 |
|
|
|
|
|
29,607 |
|
|
|
|
|
|
|
|
| Net increase (decrease) in net assets applicable to common shares |
|
|
(712,981 |
) |
|
|
|
|
(20,360,612 |
) |
|
|
| |
|
|
|
|
| Net assets applicable to common shares at the
beginning of the period |
|
|
92,830,389 |
|
|
|
|
|
113,191,001 |
|
|
|
|
|
|
|
|
| Net assets applicable to common shares at the end of the
period |
|
$ |
92,117,408 |
|
|
|
|
$ |
92,830,389 |
|
|
|
See Notes to Financial Statements
74
[This page intentionally left blank.]
75
Financial Highlights
The following data is for a common share outstanding for each fiscal year end unless otherwise noted:
|
|
|
|
|
|
|
|
|
|
|
|
|
|
|
|
|
|
|
|
|
|
|
|
|
|
|
|
|
|
|
|
|
|
|
|
|
|
|
|
|
| |
|
|
|
|
Investment Operations |
|
|
Less Distributions to
Common Shareholders |
|
|
Common Share |
|
|
|
|
|
|
|
|
|
|
|
|
| |
|
Common
Share Net Asset
Value, Beginning
of Period |
|
|
Net
Investment
Income (NII)
(Loss) |
|
|
Net
Realized/ Unrealized
Gain (Loss) |
|
|
Total |
|
|
From
NII |
|
|
From Net
Realized Gains |
|
|
Total |
|
|
Premium
per Share
Sold through
Shelf Offering |
|
|
Net Asset
Value, End of
Period |
|
|
Share
Price, End of
Period |
|
| NUV |
|
|
|
|
|
|
|
|
|
|
|
|
|
|
|
|
|
|
|
|
|
|
|
|
|
|
|
|
|
|
|
|
|
|
|
|
|
|
|
|
| 10/31/23 |
|
|
$8.77 |
|
|
|
$0.35 |
|
|
|
$(0.09) |
|
|
|
$0.26 |
|
|
|
$(0.34) |
|
|
|
$– |
|
|
|
$(0.34) |
|
|
|
$– |
|
|
|
$8.69 |
|
|
|
$7.99 |
|
| 10/31/22 |
|
|
10.62 |
|
|
|
0.33 |
|
|
|
(1.84) |
|
|
|
(1.51) |
|
|
|
(0.34) |
|
|
|
– |
|
|
|
(0.34) |
|
|
|
– |
|
|
|
8.77 |
|
|
|
8.35 |
|
| 10/31/21 |
|
|
10.48 |
|
|
|
0.35 |
|
|
|
0.15 |
|
|
|
0.50 |
|
|
|
(0.36) |
|
|
|
– |
|
|
|
(0.36) |
|
|
|
– |
|
|
|
10.62 |
|
|
|
11.21 |
|
| 10/31/20 |
|
|
10.57 |
|
|
|
0.37 |
|
|
|
(0.09) |
|
|
|
0.28 |
|
|
|
(0.37) |
|
|
|
– |
|
|
|
(0.37) |
|
|
|
– |
|
|
|
10.48 |
|
|
|
10.81 |
|
| 10/31/19 |
|
|
9.84 |
|
|
|
0.37 |
|
|
|
0.73 |
|
|
|
1.10 |
|
|
|
(0.37) |
|
|
|
– |
|
|
|
(0.37) |
|
|
|
– |
|
|
|
10.57 |
|
|
|
10.43 |
|
| NUW |
|
|
|
|
|
|
|
|
|
|
|
|
|
|
|
|
|
|
|
|
|
|
|
|
|
|
|
|
|
|
|
|
|
|
|
|
|
|
|
|
| 10/31/23 |
|
|
14.20 |
|
|
|
0.50 |
|
|
|
(0.02) |
|
|
|
0.48 |
|
|
|
(0.48) |
|
|
|
– |
|
|
|
(0.48) |
|
|
|
– |
|
|
|
14.20 |
|
|
|
12.60 |
|
| 10/31/22 |
|
|
17.33 |
|
|
|
0.46 |
|
|
|
(2.93) |
|
|
|
(2.47) |
|
|
|
(0.47) |
|
|
|
(0.19) |
|
|
|
(0.66) |
|
|
|
– |
|
|
|
14.20 |
|
|
|
13.19 |
|
| 10/31/21 |
|
|
16.81 |
|
|
|
0.45 |
|
|
|
0.54 |
|
|
|
0.99 |
|
|
|
(0.47) |
|
|
|
– |
|
|
|
(0.47) |
|
|
|
–(c) |
|
|
|
17.33 |
|
|
|
16.76 |
|
| 10/31/20 |
|
|
16.90 |
|
|
|
0.47 |
|
|
|
(0.08) |
|
|
|
0.39 |
|
|
|
(0.48) |
|
|
|
– |
|
|
|
(0.48) |
|
|
|
– |
|
|
|
16.81 |
|
|
|
16.21 |
|
| 10/31/19 |
|
|
15.88 |
|
|
|
0.60 |
|
|
|
1.16 |
|
|
|
1.76 |
|
|
|
(0.65) |
|
|
|
(0.10) |
|
|
|
(0.75) |
|
|
|
0.01 |
|
|
|
16.90 |
|
|
|
16.83 |
|
| (a) |
Percentage is not annualized. |
| (b) |
The expense ratios reflect, among other things, the interest expense deemed to have been paid by the Fund on the floating
rate certificates issued by the special purpose trusts for the self-deposited inverse floaters held by the Fund (as described in Notes to Financial Statements), where applicable, as follows: |
|
|
|
|
|
|
|
|
|
| |
|
Ratios of Interest Expense to
Average Net Assets Applicable
to Common Shares |
|
|
| |
|
NUV |
|
|
NUW |
|
|
| 10/31/23 |
|
|
0.04% |
|
|
0.03% |
|
|
| 10/31/22 |
|
|
0.01 |
|
|
0.01 |
|
|
| 10/31/21 |
|
|
0.01 |
|
|
0.01 |
|
|
| 10/31/20 |
|
|
0.02 |
|
|
0.01 |
|
|
| 10/31/19 |
|
|
0.04 |
|
|
0.07 |
|
|
76
|
|
|
|
|
|
|
|
|
|
|
|
|
| |
|
|
|
|
|
Common Share Supplemental Data/
Ratios Applicable to Common Shares |
| |
|
Common Share
Total Returns |
|
|
|
Ratios to Average
Net Assets |
|
|
|
|
|
|
|
|
|
| |
|
Based
on Net Asset
Value(a) |
|
Based
on Share
Price(a) |
|
Net
Assets, End of
Period (000) |
|
Expenses(b) |
|
Net
Investment Income
(Loss) |
|
Portfolio
Turnover Rate |
| |
|
|
|
|
|
|
|
|
|
|
|
|
|
|
|
2.79% |
|
(0.52)% |
|
$1,804,453 |
|
0.53% |
|
3.77% |
|
17% |
|
|
(14.52) |
|
(22.80) |
|
1,819,457 |
|
0.50 |
|
3.36 |
|
29 |
|
|
4.79 |
|
7.19 |
|
2,203,176 |
|
0.48 |
|
3.27 |
|
11 |
|
|
2.72 |
|
7.41 |
|
2,171,104 |
|
0.51 |
|
3.52 |
|
11 |
|
|
11.35 |
|
17.92 |
|
2,186,923 |
|
0.54 |
|
3.63 |
|
13 |
| |
|
|
|
|
|
|
|
|
|
|
|
|
|
|
3.27 |
|
(1.08) |
|
254,960 |
|
0.63 |
|
3.35 |
|
14 |
|
|
(14.65) |
|
(17.84) |
|
254,953 |
|
0.64 |
|
2.90 |
|
17 |
|
|
5.89 |
|
6.31 |
|
311,092 |
|
0.68 (d) |
|
2.60 (d) |
|
10 |
|
|
2.33 |
|
(0.77) |
|
260,790 |
|
0.78 (d) |
|
2.79 (d) |
|
13 |
| |
|
11.38 |
|
22.81 |
|
262,190 |
|
0.73 |
|
3.61 |
|
31 |
| (c) |
Value rounded to zero. |
| (d) |
During the period ended October 31, 2021 and October 31, 2020, the Adviser voluntarily reimbursed the Fund for
certain expenses incurred in connection with a common shares equity shelf program. As a result, the Expenses and Net Investment Income (Loss) Ratios to Average Net Assets reflect the voluntary expense reimbursement from Adviser. The Expenses and Net
Investment Income (Loss) Ratios to Average Net Assets excluding this expense reimbursement from Adviser were as follows: |
|
|
|
|
|
|
|
|
|
|
|
|
|
|
|
| |
|
Ratios to Average Net Assets |
|
|
|
|
|
| |
|
NUW |
|
Expenses |
|
|
|
|
|
NII
(Loss) |
|
|
|
|
|
|
|
10/31/21 |
|
|
0.68% |
|
|
|
|
|
|
|
2.60% |
|
|
|
10/31/20 |
|
|
0.82 |
|
|
|
|
|
|
|
2.75 |
|
|
|
|
|
See Notes to Financial Statements
77
Financial Highlights (continuted)
The following data is for a common share outstanding for each fiscal year end unless otherwise noted:
|
|
|
|
|
|
|
|
|
|
|
|
|
|
|
|
|
|
|
|
|
|
|
|
|
|
|
|
|
|
|
|
|
|
|
|
|
|
|
|
|
|
|
| |
|
|
|
|
Investment Operations |
|
|
Less Distributions to
Common Shareholders |
|
|
|
|
Common Share |
|
|
|
|
|
|
|
|
|
|
|
|
|
| |
|
Common
Share Net Asset
Value, Beginning
of Period |
|
|
Net
Investment
Income (NII) (Loss) |
|
|
Net
Realized/
Unrealized Gain (Loss) |
|
|
Total |
|
|
From
NII |
|
|
From Net
Realized Gains |
|
|
Total |
|
|
|
|
Premium
per Share
Sold through
Shelf
Offering |
|
|
Net Asset
Value, End of
Period |
|
|
Share
Price, End of
Period |
|
| |
|
| NMI |
|
|
|
|
|
|
|
|
|
|
|
|
|
|
|
|
|
|
|
|
|
|
|
|
|
|
|
|
|
|
|
|
|
|
|
|
|
|
|
|
|
|
| |
|
| 10/31/23 |
|
|
$9.24 |
|
|
|
$0.38 |
|
|
|
$(0.09) |
|
|
|
$0.29 |
|
|
|
$(0.37) |
|
|
|
$– |
|
|
|
$(0.37) |
|
|
|
|
|
$-(c) |
|
|
|
$9.16 |
|
|
|
$8.35 |
|
| 10/31/22 |
|
|
11.27 |
|
|
|
0.34 |
|
|
|
(2.05) |
|
|
|
(1.71) |
|
|
|
(0.32) |
|
|
|
–(c) |
|
|
|
(0.32) |
|
|
|
|
|
– |
|
|
|
9.24 |
|
|
|
8.53 |
|
| 10/31/21 |
|
|
11.08 |
|
|
|
0.37 |
|
|
|
0.20 |
|
|
|
0.57 |
|
|
|
(0.38) |
|
|
|
– |
|
|
|
(0.38) |
|
|
|
|
|
– |
|
|
|
11.27 |
|
|
|
11.65 |
|
| 10/31/20 |
|
|
11.32 |
|
|
|
0.41 |
|
|
|
(0.20) |
|
|
|
0.21 |
|
|
|
(0.41) |
|
|
|
(0.04) |
|
|
|
(0.45) |
|
|
|
|
|
–(c) |
|
|
|
11.08 |
|
|
|
11.31 |
|
| 10/31/19 |
|
|
10.92 |
|
|
|
0.43 |
|
|
|
0.47 |
|
|
|
0.90 |
|
|
|
(0.43) |
|
|
|
(0.07) |
|
|
|
(0.50) |
|
|
|
|
|
–(c) |
|
|
|
11.32 |
|
|
|
11.33 |
|
| |
|
| (a) |
Percentage is not annualized. |
78
|
|
|
|
|
|
|
|
|
|
|
|
|
|
|
|
|
|
|
|
|
|
|
|
|
|
|
|
|
|
|
|
|
|
|
|
|
|
|
|
|
|
|
| |
|
|
|
|
|
|
|
|
|
|
Common Share Supplemental Data/
Ratios Applicable to Common Shares |
| |
|
Common Share
Total Returns |
|
|
|
|
|
|
|
|
Ratios to Average
Net Assets |
|
|
|
|
|
|
|
|
|
|
|
|
|
|
|
|
|
|
| |
|
Based
on Net Asset
Value(a) |
|
|
|
|
|
Based
on Share
Price(a) |
|
|
|
|
|
Net
Assets, End of
Period (000) |
|
|
|
|
|
Expenses(b) |
|
|
|
|
|
Net
Investment Income
(Loss) |
|
|
|
|
|
Portfolio
Turnover
Rate |
| |
|
|
|
|
|
|
|
|
|
|
|
|
|
|
|
|
|
|
|
|
|
|
|
|
|
|
|
|
|
|
|
|
|
|
|
|
|
|
|
|
|
|
| |
|
|
2.94% |
|
|
|
|
|
|
|
1.80% |
|
|
|
|
|
|
|
$92,117 |
|
|
|
|
|
|
|
0.74% |
|
|
|
|
|
|
|
3.87% |
|
|
|
|
|
|
33% |
|
|
|
(15.39) |
|
|
|
|
|
|
|
(24.32) |
|
|
|
|
|
|
|
92,830 |
|
|
|
|
|
|
|
0.72 |
|
|
|
|
|
|
|
3.29 |
|
|
|
|
|
|
61 |
|
|
|
5.18 |
|
|
|
|
|
|
|
6.51 |
|
|
|
|
|
|
|
113,191 |
|
|
|
|
|
|
|
0.73 |
|
|
|
|
|
|
|
3.23 |
|
|
|
|
|
|
15 |
|
|
|
1.86 |
|
|
|
|
|
|
|
3.87 |
|
|
|
|
|
|
|
101,924 |
|
|
|
|
|
|
|
0.74 |
|
|
|
|
|
|
|
3.70 |
|
|
|
|
|
|
15 |
| |
|
|
8.45 |
|
|
|
|
|
|
|
17.61 |
|
|
|
|
|
|
|
99,822 |
|
|
|
|
|
|
|
0.79 |
|
|
|
|
|
|
|
3.83 |
|
|
|
|
|
|
10 |
| (b) |
The expense ratios reflect, among other things, the interest expense deemed to have been paid by the Fund on the floating
rate certificates issued by the special purpose trusts for the self-deposited inverse floaters held by the Fund (as described in Notes to Financial Statements), where applicable, as follows: |
|
|
|
|
|
|
|
|
|
|
Ratios of Interest
Expense to
Average Net Assets
Applicable to
Common Shares |
| |
|
| |
|
|
NMI |
| |
|
| |
10/31/23 |
|
–% |
| |
10/31/22 |
|
– |
| |
10/31/21 |
|
– |
| |
10/31/20 |
|
– |
| |
10/31/19 |
|
– |
|
|
|
| (c) |
Value rounded to zero. |
See Notes to Financial Statements
79
Notes to Financial Statements
Fund Information: The funds covered in this report and their
corresponding New York Stock Exchange (“NYSE”) symbols are as follows (each a “Fund” and collectively, the “Funds”):
| |
· |
|
Nuveen Municipal Value Fund, Inc. (NUV) |
| |
· |
|
Nuveen AMT-Free Municipal Value Fund (NUW) |
| |
· |
|
Nuveen Municipal Income Fund, Inc. (NMI) |
The Funds are registered under the Investment Company Act of 1940 (the “1940 Act”), as amended, as diversified
closed-end management investment companies. NUV and NMI were incorporated under the state laws of Minnesota on April 8, 1987 and February 26, 1988, respectively. NUW was organized as Massachusetts
business trusts on November 19, 2008.
Current Fiscal Period: The end of the reporting period for the Funds is October 31, 2023, and the period
covered by these Notes to Financial Statements is the fiscal year ended October 31, 2023 (the “current fiscal period”).
Investment Adviser and Sub-Adviser: The Funds’ investment adviser is Nuveen Fund Advisors, LLC (the “Adviser”), a subsidiary of Nuveen, LLC (“Nuveen”). Nuveen is the investment management arm of Teachers
Insurance and Annuity Association of America (TIAA). The Adviser has overall responsibility for management of the Funds, oversees the management of the Funds’ portfolios, manages the Funds’ business affairs and provides certain clerical,
bookkeeping and other administrative services, and, if necessary, asset allocation decisions. The Adviser has entered into sub-advisory agreements with Nuveen Asset Management, LLC (the “Sub-Adviser”), a subsidiary of the Adviser, under which the Sub-Adviser manages the investment portfolios of the Funds.
Developments Regarding the Funds’ Control Share By-Law: On October 5, 2020, the Funds and certain other closed-end funds in the Nuveen fund complex amended their by-laws. Among other things, the amended by-laws included provisions pursuant
to which, in summary, a shareholder who obtains beneficial ownership of common shares in a Control Share Acquisition (as defined in the by-laws) shall have the same voting rights as other common shareholders
only to the extent authorized by the other disinterested shareholders (the “Control Share By-Law”). On January 14, 2021, a shareholder of certain Nuveen
closed-end funds filed a civil complaint in the U.S. District Court for the Southern District of New York (the “District Court”) against certain Nuveen funds and their trustees, seeking a declaration
that such funds’ Control Share By-Laws violate the 1940 Act, rescission of such fund’s Control Share By-Laws and a permanent injunction against such funds
applying the Control Share By-Laws. On February 18, 2022, the District Court granted judgment in favor of the plaintiff’s claim for rescission of such funds’ Control Share By-Laws and the plaintiff’s declaratory judgment claim, and declared that such funds’ Control Share By-Laws violate Section 18(i) of the 1940 Act. Following
review of the judgment of the District Court, on February 22, 2022, the Board of Directors/Trustees (the “Board”) amended the Funds’ by-laws to provide that the Funds’ Control Share By-Law shall be of no force and effect for so long as the judgment of the District Court is effective and that if the judgment of the District Court is reversed, overturned, vacated, stayed, or otherwise nullified,
the Funds’ Control Share By-Law will be automatically reinstated and apply to any beneficial owner of common shares acquired in a Control Share Acquisition, regardless of whether such Control Share
Acquisition occurs before or after such reinstatement, for the duration of the stay or upon issuance of the mandate reversing, overturning, vacating or otherwise nullifying the judgment of the District Court. On February 25, 2022, the Board and
the Funds appealed the District Court’s decision to the U.S. Court of Appeals for the Second Circuit. On November 30, 2023, the U.S. Court of Appeals for the Second Circuit upheld the opinion of the District Court.
| 2. |
Significant Accounting Policies |
The accompanying financial statements were prepared in accordance with accounting principles generally accepted in the United States of America (“U.S. GAAP”),
which may require the use of estimates made by management and the evaluation of subsequent events. Actual results may differ from those estimates. Each Fund is an investment company and follows accounting guidance in the Financial Accounting
Standards Board (“FASB”) Accounting Standards Codification 946, Financial Services – Investment Companies. The net asset value (“NAV”) for financial reporting purposes may differ from the NAV for processing security and
shareholder transactions. The NAV for financial reporting purposes includes security and shareholder transactions through the date of the report. Total return is computed based on the NAV used for processing security and shareholder transactions.
The following is a summary of the significant accounting policies consistently followed by the Funds.
Compensation: The Funds pay no compensation directly to
those of its officers, all of whom receive remuneration for their services to each Fund from the Adviser or its affiliates. The Board has adopted a deferred compensation plan for independent directors/trustees that enables directors/
trustees to elect to defer receipt of all or a portion of the annual compensation they are entitled to receive from certain Nuveen-advised funds. Under the plan, deferred amounts are treated as though equal dollar amounts had been invested in shares
of select Nuveen-advised funds.
Custodian Fee Credit: As an alternative to overnight investments, each Fund has an arrangement with its custodian bank, State Street Bank and Trust Company, (the “Custodian”) whereby certain custodian fees and expenses
are reduced by net credits earned on each Fund’s cash on deposit with the bank. Credits for cash balances may be offset by charges for any days on which a Fund overdraws its account at the Custodian. The amount of custodian fee credit earned by
a Fund is recognized on the Statement of Operations as a component of “Custodian expenses, net.” During the current reporting period, the custodian fee credit earned by each Fund was as follows:
80
|
|
|
|
|
| Fund |
|
Gross
Custodian Fee Credits |
|
|
|
| NUV |
|
$ |
101,097 |
|
|
|
| NUW |
|
|
13,121 |
|
|
|
| NMI |
|
|
8,181 |
|
Distributions to Common Shareholders: Distributions to common shareholders are recorded on the ex-dividend date. The amount, character and timing of distributions are determined in accordance with
federal income tax regulations, which may differ from U.S. GAAP.
Indemnifications: Under the Funds’ organizational documents, their officers and directors/trustees are indemnified against certain liabilities arising out of the performance of their duties to the Funds. In addition,
in the normal course of business, the Funds enter into contracts that provide general indemnifications to other parties. The Funds’ maximum exposure under these arrangements is unknown as this would involve future claims that may be made
against the Funds that have not yet occurred. However, the Funds have not had prior claims or losses pursuant to these contracts and expect the risk of loss to be remote.
Investments and Investment Income: Securities transactions are
accounted for as of the trade date for financial reporting purposes. Realized gains and losses on securities transactions are based upon the specific identification method. Investment income is comprised of interest income, which is recorded on an
accrual basis and includes accretion of discounts and amortization of premiums for financial reporting purposes. Investment income also reflects payment-in-kind
(“PIK”) interest and paydown gains and losses, if any. PIK interest represents income received in the form of securities in lieu of cash. Investment income also reflects dividend income, which is recorded on the ex-dividend date.
Netting Agreements: In the ordinary course of business, the Funds may enter into transactions subject to enforceable International Swaps and Derivatives Association, Inc. (ISDA) master agreements or other similar arrangements
(“netting agreements”). Generally, the right to offset in netting agreements allows each Fund to offset certain securities and derivatives with a specific counterparty, when applicable, as well as any collateral received or delivered to
that counterparty based on the terms of the agreements. Generally, each Fund manages its cash collateral and securities collateral on a counterparty basis. With respect to certain counterparties, in accordance with the terms of the netting
agreements, collateral posted to the Funds is held in a segregated account by the Funds’ custodian and/or with respect to those amounts which can be sold or repledged, are presented in the Funds’ Portfolio of Investments or Statement of
Assets and Liabilities.
The Funds’ investments subject to netting agreements as of the end of the reporting period, if any, are further described later
in these Notes to Financials.
New Accounting Pronouncement:
In March 2020, FASB issued Accounting Standards Update (“ASU”) 2020-04, Reference Rate Reform: Facilitation of the Effects of Reference Rate
Reform on Financial Reporting. The main objective of the new guidance is to provide relief to companies that will be impacted by the expected change in benchmark interest rates, when participating banks will no longer be required to submit London
Interbank Offered Rate (LIBOR) quotes by the UK Financial Conduct Authority (FCA). The new guidance allows companies to, provided the only change to existing contracts are a change to an approved benchmark interest rate, account for modifications as
a continuance of the existing contract without additional analysis. For new and existing contracts, the Funds may elect to apply the amendments as of March 12, 2020 through December 31, 2022. In December 2022, FASB deferred ASU 2022-04 and issued ASU 2022-06, Reference Rate Reform: Deferral of the Sunset Date of Topic 848, which extends the application of the amendments through December 31,
2024. Management has not yet elected to apply the amendments, is continuously evaluating the potential effect a discontinuation of LIBOR could have on the Funds’ investments and has currently determined that it is unlikely the ASU’s
adoption will have a significant impact on the Funds’ financial statements and various filings.
New
Accounting Pronouncement: In June 2022, the FASB issued ASU 2022-03 to clarify the guidance in Topic 820, Fair Value Measurement (“Topic
820”). The amendments in ASU 2022-03 affect all entities that have investments in equity securities measured at fair value that are subject to a contractual sale restriction. ASU 2022-03 (1) clarifies the guidance in Topic 820, when measuring the fair value of an equity security subject to contractual restrictions that prohibit the sale of equity security, (2) amends a related
illustrative example, and (3) introduces new disclosure requirements for equity securities subject to contractual sale restrictions that are measured at fair value in accordance with Topic 820. For public business entities, the amendments in
ASU 2022-03 are effective for fiscal years beginning after December 15, 2023, and interim periods within those fiscal years. For all other entities, the amendments are effective for fiscal years beginning
after December 15, 2024, and interim periods within those fiscal years. Early adoption is permitted for both interim and annual financial statements that have not yet been issued or made available for issuance. During the current fiscal period,
the Funds adopted the new guidance and there was no material impact to the Funds.
| 3. |
Investment Valuation and Fair Value Measurements |
The Funds’ investments in securities are recorded at their estimated fair value utilizing valuation methods approved by the Adviser, subject to oversight of
the Board. Fair value is defined as the price that would be received upon selling an investment or transferring a liability in an orderly transaction to an independent buyer in the principal or most advantageous market for the investment. U.S.
GAAP establishes the three-tier hierarchy which is used to maximize the use of observable market data and minimize the use of unobservable inputs and to establish classification of fair value measurements for disclosure purposes. Observable inputs
reflect the assumptions market participants would use in pricing the asset or liability. Observable inputs are based on market data obtained from sources independent of the reporting entity. Unobservable inputs reflect management’s assumptions
about the assumptions market participants would use in pricing the asset or liability. Unobservable inputs are based on the best information available in the circumstances. The following is a summary of the three-tiered hierarchy of valuation input
levels.
81
Notes to Financial Statements (continued)
|
|
|
| Level 1 – |
|
Inputs are unadjusted and prices are determined using quoted prices in active markets for identical securities. |
|
|
| Level 2 – |
|
Prices are determined using other significant observable inputs (including quoted prices for similar securities, interest rates, credit spreads, etc.). |
|
|
| Level 3 – |
|
Prices are determined using significant unobservable inputs (including management’s assumptions in determining the fair value of investments). |
A description of the valuation techniques applied to the Funds’ major classifications of assets and liabilities measured at
fair value follows:
Equity securities and exchange-traded funds listed or traded on a national market or exchange are valued based on their last reported sales
price or official closing price of such market or exchange on the valuation date. Foreign equity securities and registered investment companies that trade on a foreign exchange are valued at the last reported sales price or official
closing price on the principal exchange where traded, and converted to U.S. dollars at the prevailing rates of exchange on the valuation date. For events affecting the value of foreign securities between the time when the exchange on
which they are traded closes and the time when the Funds’ net assets are calculated, such securities will be valued at fair value in accordance with procedures adopted by the Adviser, subject to the oversight of the Board. To the extent
these securities are actively traded and no valuation adjustments are applied, they are generally classified as Level 1. When valuation adjustments are applied to the most recent last sales price or official closing price, these securities
are generally classified as Level 2.
Prices of fixed-income securities are generally provided by pricing services approved by the Adviser, which is subject to
review by the Adviser and oversight of the Board. Pricing services establish a security’s fair value using methods that may include consideration of the following: yields or prices of investments of comparable quality, type of issue,
coupon, maturity and rating, market quotes or indications of value from security dealers, evaluations of anticipated cash flows or collateral, general market conditions and other information and analysis, including the obligor’s credit
characteristics considered relevant. In pricing certain securities, particularly less liquid and lower quality securities, pricing services may consider information about a security, its issuer or market activity provided by the Adviser. These
securities are generally classified as Level 2.
Futures contracts are valued using the closing settlement price or, in the absence of such a price, the last
traded price and are generally classified as Level 1.
For any portfolio security or derivative for which market quotations are not readily available or for which
the Adviser deems the valuations derived using the valuation procedures described above not to reflect fair value, the Adviser will determine a fair value in good faith using alternative procedures approved by the Adviser, subject to the oversight
of the Board. As a general principle, the fair value of a security is the amount that the owner might reasonably expect to receive for it in a current sale. A variety of factors may be considered in determining the fair value of such securities,
which may include consideration of the following: yields or prices of investments of comparable quality, type of issue, coupon, maturity and rating, market quotes or indications of value from security dealers, evaluations of anticipated cash flows
or collateral, general market conditions and other information and analysis, including the obligor’s credit characteristics considered relevant. To the extent the inputs are observable and timely, the values would be classified as Level 2;
otherwise they would be classified as Level 3.
The following table summarizes the market value of the Funds’ investments as of the end of the reporting
period, based on the inputs used to value them:
|
|
|
|
|
|
|
|
|
|
|
|
|
|
|
|
|
| NUV |
|
Level 1 |
|
|
Level 2 |
|
|
Level 3 |
|
|
Total |
|
| Long-Term Investments: |
|
|
|
|
|
|
|
|
|
|
|
|
|
|
|
|
| Municipal Bonds |
|
$ |
– |
|
|
$ |
1,795,221,291 |
|
|
$ |
– |
|
|
$ |
1,795,221,291 |
|
| Total |
|
$ |
– |
|
|
$ |
1,795,221,291 |
|
|
$ |
– |
|
|
$ |
1,795,221,291 |
|
|
|
|
|
|
| NUW |
|
Level 1 |
|
|
Level 2 |
|
|
Level 3 |
|
|
Total |
|
| Long-Term Investments: |
|
|
|
|
|
|
|
|
|
|
|
|
|
|
|
|
| Municipal Bonds |
|
$ |
– |
|
|
$ |
251,253,096 |
|
|
$ |
– |
|
|
$ |
251,253,096 |
|
| Common Stocks |
|
|
– |
|
|
|
1,217,367 |
|
|
|
– |
|
|
|
1,217,367 |
|
| Investments in Derivatives: |
|
|
|
|
|
|
|
|
|
|
|
|
|
|
|
|
| Futures Contracts* |
|
|
654,844 |
|
|
|
– |
|
|
|
– |
|
|
|
654,844 |
|
| Total |
|
$ |
654,844 |
|
|
$ |
252,470,463 |
|
|
$ |
– |
|
|
$ |
253,125,307 |
|
82
|
|
|
|
|
|
|
|
|
|
|
|
|
|
|
|
|
|
|
|
|
|
| NMI |
|
Level 1 |
|
|
Level 2 |
|
|
Level 3 |
|
|
Total |
|
| Long-Term Investments: |
|
|
|
|
|
|
|
|
|
|
|
|
|
|
|
|
| Municipal Bonds |
|
$ |
– |
|
|
$ |
88,920,957 |
|
|
$ |
10,994** |
|
|
$ |
88,931,951 |
|
| Short-Term Investments: |
|
|
|
|
|
|
|
|
|
|
|
|
|
|
|
|
| Municipal Bonds |
|
|
– |
|
|
|
2,680,000 |
|
|
|
– |
|
|
|
2,680,000 |
|
| Total |
|
$ |
– |
|
|
$ |
91,600,957 |
|
|
$ |
10,994 |
|
|
$ |
91,611,951 |
|
| * |
Represents net unrealized appreciation (depreciation) as reported in Fund’s Portfolio of Investments.
|
| ** |
Refer to the Fund’s Portfolio of Investments for securities classified as Level 3. |
The Funds hold liabilities in floating rate obligations, where applicable, which are not reflected in the tables above. The fair values of the Funds’ liabilities
for floating rate obligations approximate their liquidation values. Floating rate obligations are generally classified as Level 2 and further described in these Notes to Financial Statements.
Inverse Floating Rate Securities: Each Fund is authorized to
invest in inverse floating rate securities. An inverse floating rate security is created by depositing a municipal bond (referred to as an “Underlying Bond”), typically with a fixed interest rate, into a special purpose tender option bond
(“TOB”) trust (referred to as the “TOB Trust”) created by or at the direction of one or more Funds. In turn, the TOB Trust issues (a) floating rate certificates (referred to as “Floaters”), in face amounts equal to
some fraction of the Underlying Bond’s par amount or market value, and (b) an inverse floating rate certificate (referred to as an “Inverse Floater”) that represents all remaining or residual interest in the TOB Trust. Floaters
typically pay short-term tax-exempt interest rates to third parties who are also provided a right to tender their certificate and receive its par value, which may be paid from the proceeds of a remarketing of
the Floaters, by a loan to the TOB Trust from a third party liquidity provider (“Liquidity Provider”), or by the sale of assets from the TOB Trust. The Inverse Floater is issued to a long term investor, such as one or more Funds. The
income received by the Inverse Floater holder varies inversely with the short-term rate paid to holders of the Floaters, and in most circumstances the Inverse Floater holder bears substantially all of the Underlying Bond’s downside investment
risk and also benefits disproportionately from any potential appreciation of the Underlying Bond’s value. The value of an Inverse Floater will be more volatile than that of the Underlying Bond because the interest rate is dependent on not only
the fixed coupon rate of the Underlying Bond but also on the short-term interest paid on the Floaters, and because the Inverse Floater essentially bears the risk of loss (and possible gain) of the greater face value of the Underlying Bond.
The Inverse Floater held by a Fund gives the Fund the right to (a) cause the holders of the Floaters to tender their certificates at par (or slightly
more than par in certain circumstances), and (b) have the trustee of the TOB Trust (the “Trustee”) transfer the Underlying Bond held by the TOB Trust to the Fund, thereby collapsing the TOB Trust.
A Fund may acquire an Inverse Floater in a transaction where it (a) transfers an Underlying Bond that it owns to a TOB Trust created by a third party or
(b) transfers an Underlying Bond that it owns, or that it has purchased in a secondary market transaction for the purpose of creating an Inverse Floater, to a TOB Trust created at its direction, and in return receives the Inverse Floater of the
TOB Trust (referred to as a “self-deposited Inverse Floater”). A Fund may also purchase an Inverse Floater in a secondary market transaction from a third party creator of the TOB Trust without first owning the Underlying Bond (referred to
as an “externally-deposited Inverse Floater”).
An investment in a self-deposited Inverse Floater is accounted for as a “financing” transaction
(i.e., a secured borrowing). For a self-deposited Inverse Floater, the Underlying Bond deposited into the TOB Trust is identified in the Fund’s Portfolio of Investments as “(UB) – Underlying bond of an inverse floating rate trust
reflected as a financing transaction,” with the Fund recognizing as liabilities, labeled “Floating rate obligations” on the Statement of Assets and Liabilities, (a) the liquidation value of Floaters issued by the TOB Trust, and
(b) the amount of any borrowings by the TOB Trust from a Liquidity Provider to enable the TOB Trust to purchase outstanding Floaters in lieu of a remarketing. In addition, the Fund recognizes in “Investment Income” the entire earnings
of the Underlying Bond, and recognizes (a) the interest paid to the holders of the Floaters or on the TOB Trust’s borrowings, and (b) other expenses related to remarketing, administration, trustee, liquidity and other services to a
TOB Trust, as a component of “Interest expense and amortization of offering costs” on the Statement of Operations. Earnings due from the Underlying Bond and interest due to the holders of the Floaters as of the end of the reporting period
are recognized as components of “Receivable for interest” and “Payable for interest” on the Statement of Assets and Liabilities, respectively.
In
contrast, an investment in an externally-deposited Inverse Floater is accounted for as a purchase of the Inverse Floater and is identified in the Fund’s Portfolio of Investments as “(IF) – Inverse floating rate investment.” For
an externally-deposited Inverse Floater, a Fund’s Statement of Assets and Liabilities recognizes the Inverse Floater and not the Underlying Bond as an asset, and the Fund does not recognize the Floaters, or any related borrowings from a
Liquidity Provider, as a liability. Additionally, the Fund reflects in “Investment Income” only the net amount of earnings on the Inverse Floater (net of the interest paid to the holders of the Floaters or the Liquidity Provider as lender,
and the expenses of the Trust), and does not show the amount of that interest paid or the expenses of the TOB Trust as described above as interest expense on the Statement of Operations.
Fees paid upon the creation of a TOB Trust for self-deposited Inverse Floaters and externally-deposited Inverse Floaters are recognized as part of the cost basis of the
Inverse Floater and are capitalized over the term of the TOB Trust.
As of the end of the reporting period, the aggregate value of Floaters issued by each Fund’s
TOB Trust for self-deposited Inverse Floaters and externally-deposited Inverse Floaters was as follows:
83
Notes to Financial Statements (continued)
|
|
|
|
|
|
|
|
|
|
|
|
|
| Fund |
|
Floating Rate
Obligations: Self-
Deposited Inverse Floaters |
|
|
Floating Rate
Obligations:
Externally-Deposited
Inverse Floaters |
|
|
Total |
|
|
|
|
|
| NUV |
|
$ |
21,480,000 |
|
|
$ |
– |
|
|
$ |
21,480,000 |
|
|
|
|
|
| NUW |
|
|
2,000,000 |
|
|
|
– |
|
|
|
2,000,000 |
|
|
|
|
|
| NMI |
|
|
– |
|
|
|
– |
|
|
|
– |
|
During the current fiscal period, the average amount of Floaters (including any borrowings from a Liquidity Provider) outstanding, and
the average annual interest rates and fees related to self-deposited Inverse Floaters, were as follows:
|
|
|
|
|
|
|
| Fund |
|
Average Floating
Rate Obligations Outstanding |
|
|
Average Annual
Interest Rate
And Fees |
| |
|
|
|
| NUV |
|
$ |
21,480,000 |
|
|
3.62% |
|
|
|
| NUW |
|
|
2,000,000 |
|
|
3.62 |
|
|
|
| NMI |
|
|
– |
|
|
– |
| |
TOB Trusts are supported by a liquidity facility provided by a Liquidity Provider pursuant to which the Liquidity Provider agrees, in the
event that Floaters are (a) tendered to the Trustee for remarketing and the remarketing does not occur, or (b) subject to mandatory tender pursuant to the terms of the TOB Trust agreement, to either purchase Floaters or to provide the
Trustee with an advance from a loan facility to fund the purchase of Floaters by the TOB Trust. In certain circumstances, the Liquidity Provider may otherwise elect to have the Trustee sell the Underlying Bond to retire the Floaters that were
tendered and not remarketed prior to providing such a loan. In these circumstances, the Liquidity Provider remains obligated to provide a loan to the extent that the proceeds of the sale of the Underlying Bond are not sufficient to pay the purchase
price of the Floaters.
The size of the commitment under the loan facility for a given TOB Trust is at least equal to the balance of that TOB Trust’s outstanding
Floaters plus any accrued interest. In consideration of the loan facility, fee schedules are in place and are charged by the Liquidity Provider(s). Any loans made by the Liquidity Provider will be secured by the purchased Floaters held by the TOB
Trust. Interest paid on any outstanding loan balances will be effectively borne by the Fund that owns the Inverse Floaters of the TOB Trust that has incurred the borrowing and may be at a rate that is greater than the rate that would have been paid
had the Floaters been successfully remarketed.
As described above, any amounts outstanding under a liquidity facility are recognized as a component of “Floating
rate obligations” on the Statement of Assets and Liabilities by the Fund holding the corresponding Inverse Floaters issued by the borrowing TOB Trust. As of the end of the reporting period, there were no loans outstanding under any such
facility.
Each Fund may also enter into shortfall and forbearance agreements (sometimes referred to as a “recourse arrangement”) (TOB Trusts involving such
agreements are referred to herein as “Recourse Trusts”), under which a Fund agrees to reimburse the Liquidity Provider for the Trust’s Floaters, in certain circumstances, for the amount (if any) by which the liquidation value of the
Underlying Bond held by the TOB Trust may fall short of the sum of the liquidation value of the Floaters issued by the TOB Trust plus any amounts borrowed by the TOB Trust from the Liquidity Provider, plus any shortfalls in interest cash flows.
Under these agreements, a Fund’s potential exposure to losses related to or on an Inverse Floater may increase beyond the value of the Inverse Floater as a Fund may potentially be liable to fulfill all amounts owed to holders of the Floaters or
the Liquidity Provider. Any such shortfall amount in the aggregate is recognized as “Unrealized depreciation on Recourse Trusts” on the Statement of Assets and Liabilities.
As of the end of the reporting period, each Fund’s maximum exposure to the Floaters issued by Recourse Trusts for self-deposited Inverse Floaters and
externally-deposited Inverse Floaters was as follows:
|
|
|
|
|
|
|
|
|
|
|
|
|
| Fund |
|
Maximum Exposure
to Recourse Trusts:
Self-Deposited Inverse Floaters |
|
|
Maximum Exposure
to Recourse Trusts: Externally-Deposited Inverse Floaters |
|
|
Total |
|
|
|
|
|
| NUV |
|
$ |
21,480,000 |
|
|
$ |
– |
|
|
$ |
21,480,000 |
|
|
|
|
|
| NUW |
|
|
2,000,000 |
|
|
|
– |
|
|
|
2,000,000 |
|
|
|
|
|
| NMI |
|
|
– |
|
|
|
– |
|
|
|
– |
|
Zero Coupon Securities: A
zero coupon security does not pay a regular interest coupon to its holders during the life of the security. Income to the holder of the security comes from accretion of the difference between the original purchase price of the security at issuance
and the par value of the security at maturity and is effectively paid at maturity. The market prices of zero coupon securities generally are more volatile than the market prices of securities that pay interest periodically.
84
Purchases and Sales: Long-term purchases and sales during the current fiscal period were as follows:
|
|
|
|
|
|
|
| Fund |
|
Non-U.S.
Government Purchases |
|
|
Non-U.S.
Government Sales and
Maturities |
| NUV |
|
$ |
324,376,367 |
|
|
$ 337,792,880 |
|
|
|
| NUW |
|
|
36,445,858 |
|
|
36,965,435 |
| NMI |
|
|
34,428,539 |
|
|
30,812,843 |
The Funds may purchase securities on a when-issued or delayed-delivery basis. Securities purchased on a when-issued or delayed-delivery
basis may have extended settlement periods; interest income is not accrued until settlement date. Any securities so purchased are subject to market fluctuation during this period. If a Fund has outstanding when-issued/delayed-delivery purchases
commitments as of the end of the reporting period, such amounts are recognized on the Statement of Assets and Liabilities.
| 5. |
Derivative Investments |
Each Fund is authorized to invest in certain derivative instruments. As defined by U.S. GAAP, a derivative is a financial instrument whose value is derived from an
underlying security price, foreign exchange rate, interest rate, index of prices or rates, or other variables. Investments in derivatives as of the end of and/or during the current fiscal period, if any, are included within the Statement of Assets
and Liabilities and the Statement of Operations, respectively.
Futures Contracts: During the current fiscal period, NUW managed the duration of its portfolio by shorting interest rate futures contracts.
A futures contract is an agreement between two parties to buy and sell a financial instrument for a set price on a future date. Upon execution of a futures contract, the
Fund is obligated to deposit cash or eligible securities, also known as “initial margin,” into an account at its clearing broker equal to a specified percentage of the contract amount. Securities deposited for initial margin, if any, are
identified in the Portfolio of Investments and cash deposited for initial margin, if any, is reflected on the Statement of Assets and Liabilities.
During the period
the futures contract is open, changes in the market value of the contract are recognized as an unrealized gain or loss by “marking-to-market” on a daily basis.
The Fund and the clearing broker are obligated to settle monies on a daily basis representing the changes in the value of the contracts. These daily cash settlements are known as “variation margin” and is recognized on the Statement of
Assets and Liabilities as a receivable or payable for variation margin on futures contracts. When the contract is closed or expired, the Fund records a realized gain or loss equal to the difference between the value of the contract on the closing
date and value of the contract when originally entered into. The net realized gain or loss and the change in unrealized appreciation (depreciation) on futures contracts held during the period is included on the Statement of Operations.
Risks of investments in futures contracts include the possible adverse movement in the price of the securities or indices underlying the contracts, the possibility that
there may not be a liquid secondary market for the contracts and/or that a change in the value of the contract may not correlate with a change in the value of the underlying securities or indices.
The average notional amount of futures contracts outstanding during the current fiscal period was as follows:
|
|
|
| Fund |
|
Average Notional Amount of Futures
Contracts Outstanding* |
| NUW |
|
$20,128,845 |
| * |
The average notional amount is calculated based on the absolute aggregate notional amount of contracts outstanding at the
beginning of the current fiscal period and at the end of each fiscal quarter within the current fiscal period. |
As of the end of the reporting
period, the following Funds have invested in derivative contracts which are reflected in the Statement of Assets and Liabilities as follows:.
|
|
|
|
|
|
|
|
|
|
|
|
|
|
|
|
|
|
|
| |
|
|
|
Asset Derivatives
|
|
|
Liability Derivatives
|
|
|
|
|
|
|
|
| Derivative Instrument |
|
Risk Exposure |
|
Location |
|
|
Value |
|
|
Location |
|
|
Value |
|
| |
|
|
|
|
|
| NUW |
|
|
|
|
|
|
|
|
|
|
|
|
|
|
|
|
|
|
| Futures Contracts |
|
Interest rate |
|
|
Unrealized
appreciation on
futures contracts*
|
|
|
|
$654,844 |
|
|
|
– |
|
|
|
$– |
|
| * |
The fair value presented includes cumulative gain (loss) on open futures contracts; however, the value reflected in the
accompanying Statements of Assets and Liabilities is only the receivable or payable for variation margin on open futures contacts. |
85
Notes to Financial Statements (continued)
During the current fiscal period, the effect of derivative contracts on the Funds’ Statement of Operations was as follows:
|
|
|
|
|
|
|
|
|
|
|
|
|
| Derivative Instrument |
|
Risk Exposure |
|
|
|
Net Realized Gain
(Loss) |
|
|
Change in
Unrealized Appreciation
(Depreciation) |
|
| NUW |
|
|
|
|
|
|
|
|
|
|
|
|
| Futures contracts |
|
Interest rate |
|
|
|
|
$1,687,127 |
|
|
|
$(686,998) |
|
Market and Counterparty Credit Risk: In the normal course of business each Fund may invest in financial instruments and enter into financial transactions where risk of potential loss exists due to changes in the market (market risk) or failure
of the other party to the transaction to perform (counterparty credit risk). The potential loss could exceed the value of the financial assets recorded on the financial statements. Financial assets, which potentially expose each Fund to counterparty
credit risk, consist principally of cash due from counterparties on forward, option and swap transactions, when applicable. The extent of each Fund’s exposure to counterparty credit risk in respect to these financial assets approximates their
carrying value as recorded on the Statement of Assets and Liabilities.
Each Fund helps manage counterparty credit risk by entering into agreements only with
counterparties the Adviser believes have the financial resources to honor their obligations and by having the Adviser monitor the financial stability of the counterparties. Additionally, counterparties may be required to pledge collateral daily
(based on the daily valuation of the financial asset) on behalf of each Fund with a value approximately equal to the amount of any unrealized gain above a pre-determined threshold. Reciprocally, when each Fund
has an unrealized loss, the Funds have instructed the custodian to pledge assets of the Funds as collateral with a value approximately equal to the amount of the unrealized loss above a pre-determined
threshold. Collateral pledges are monitored and subsequently adjusted if and when the valuations fluctuate, either up or down, by at least the pre-determined threshold amount.
Common Shares Equity Shelf Programs and Offering Costs: The following Fund has filed a registration statement with the Securities and Exchange
Commission (“SEC”) authorizing the Fund to issue additional common shares through one or more equity shelf programs (“Shelf Offering”), which became effective with the SEC during the current and prior fiscal periods.
Under this Shelf Offering, the Fund, subject to market conditions, may raise additional equity capital by issuing additional common shares from time to time
in varying amounts and by different offering methods at a net price at or above the Fund’s NAV per common share. In the event the Fund’s Shelf Offering registration statement is no longer current, the Fund may not issue additional common
shares until a post-effective amendment to the registration statement has been filed with the SEC.
Additional authorized common shares, common shares sold and
offering proceeds, net of offering costs under the Fund’s Shelf Offering during the Fund’s current fiscal period were as follows:
|
|
|
|
|
|
|
| |
|
NMI |
| |
|
Year Ended
10/31/23 |
|
|
Year Ended
10/31/22 |
| Additional authorized common shares |
|
|
2,000,000* |
|
|
2,200,000 |
|
|
|
| Common shares sold |
|
|
– |
|
|
– |
| Offering proceeds, net of offering costs |
|
|
49,338 |
|
|
(9,169) |
| * |
For the period September 22, 2023 through October 31, 2023. |
Costs incurred by the Fund in connection with its initial shelf registration are recorded as a prepaid expense and recognized as “Deferred offering costs” on
the Statement of Assets and Liabilities. These costs are amortized pro rata as common shares are sold and are recognized as a component of “Proceeds from shelf offering, net of offering costs” on the Statement of Changes in Net Assets. Any
deferred offering costs remaining one year after effectiveness of the initial shelf registration will be expensed. Costs incurred by the Fund to keep the shelf registration current are expensed as incurred and recognized as a component of
“Other expenses” on the Statement of Operations.
Common Share Transactions: Transactions in common shares for the Funds during the Funds’ current and prior fiscal period, where applicable, were as follows:
|
|
|
|
|
|
|
| |
|
NUV |
| |
|
Year Ended
10/31/23 |
|
|
Year Ended
10/31/22 |
| Common Shares: |
|
|
|
|
|
|
| Issued to shareholders due to reinvestment of distributions |
|
|
– |
|
|
32,361 |
| Total |
|
|
– |
|
|
32,361 |
86
|
|
|
|
|
|
|
| |
|
NMI |
| |
|
Year Ended
10/31/23 |
|
|
Year Ended
10/31/22 |
| Common Shares: |
|
|
|
|
|
|
| Sold through shelf offering |
|
|
4,954 |
|
|
– |
| Issued to shareholders due to reinvestment of distributions |
|
|
– |
|
|
3,430 |
| Total |
|
|
4,954 |
|
|
3,430 |
| Weighted average common share: |
|
|
|
|
|
|
| Premium to NAV per shelf offering common share sold |
|
|
1.11% |
|
|
–% |
| 7. |
Income Tax Information |
Each Fund is a separate taxpayer for federal income tax purposes. Each Fund intends to distribute substantially all of its net investment income and net capital gains to
shareholders and otherwise comply with the requirements of Subchapter M of the Internal Revenue Code applicable to regulated investment companies. Therefore, no federal income tax provision is required.
Each Fund intends to satisfy conditions that will enable interest from municipal securities, which is exempt from regular federal income tax, and in the case of NUW the
AMT applicable to individuals to retain such tax-exempt status when distributed to shareholders of the Funds. Net realized capital gains and ordinary income distributions paid by the Funds are subject to
federal taxation.
Each Fund files income tax returns in U.S. federal and applicable state and local jurisdictions. A Fund’s federal income tax returns are
generally subject to examination for a period of three fiscal years after being filed. State and local tax returns may be subject to examination for an additional period of time depending on the jurisdiction. Management has analyzed each Fund’s
tax positions taken for all open tax years and has concluded that no provision for income tax is required in the Fund’s financial statements.
Differences
between amounts for financial statement and federal income tax purposes are primarily due to timing differences in recognizing gains and losses on investment transactions. Temporary differences do not require reclassification. As of year end,
permanent differences that resulted in reclassifications among the components of net assets relate primarily to nondeductible expenses, paydowns, and taxable market discount. Temporary and permanent differences have no impact on a Fund’s net
assets.
As of year end, the aggregate cost and the net unrealized appreciation/(depreciation) of all investments for federal income tax purposes were as follows:
|
|
|
|
|
|
|
|
|
|
|
|
|
|
|
|
|
| Fund |
|
Tax Cost |
|
|
Gross Unrealized
Appreciation |
|
|
Gross
Unrealized (Depreciation) |
|
|
Net
Unrealized Appreciation
(Depreciation) |
|
|
|
|
|
|
| NUV |
|
$ |
1,853,279,580 |
|
|
$ |
37,243,869 |
|
|
$ |
(116,782,158) |
|
|
$ |
(79,538,289) |
|
|
|
|
|
|
| NUW |
|
|
264,384,489 |
|
|
|
4,722,860 |
|
|
|
(17,982,042 |
) |
|
|
(13,259,182) |
|
|
|
|
|
|
| NMI |
|
|
98,632,080 |
|
|
|
280,115 |
|
|
|
(7,300,244 |
) |
|
|
(7,020,129) |
|
For purposes of this disclosure, tax cost generally includes the cost of portfolio investments as well as
up-front fees or premiums exchanged on derivatives and any amounts unrealized for income statement reporting but realized income and/or capital gains for tax reporting, if applicable.
As of year end, the components of accumulated earnings on a tax basis were as follows:
|
|
|
|
|
|
|
|
|
|
|
|
|
|
|
|
|
|
|
|
|
|
|
|
|
|
|
|
|
|
|
|
|
|
|
| Fund |
|
|
|
Undistributed
Tax-Exempt
Income1 |
|
|
Undistributed
Ordinary Income |
|
|
Undistributed
Long-Term Capital Gains |
|
|
Unrealized
Appreciation (Depreciation) |
|
|
Capital Loss
Carryforwards |
|
|
Late-Year Loss
Deferrals |
|
|
Other
Book-to-Tax
Differences |
|
|
Total |
|
|
|
|
|
|
|
|
|
|
|
| NUV |
|
|
|
$ |
8,960,607 |
|
|
$ |
5,789 |
|
|
$ |
– |
|
|
$ |
(79,538,289) |
|
|
$ |
(84,579,303) |
|
|
$ |
– |
|
|
$ |
(6,018,706) |
|
|
$ |
(161,169,902) |
|
|
|
|
|
|
|
|
|
|
|
| NUW |
|
|
|
|
1,387,709 |
|
|
|
1,864 |
|
|
|
– |
|
|
|
(13,259,182) |
|
|
|
(542,698) |
|
|
|
– |
|
|
|
(1,427,131) |
|
|
|
(13,839,438) |
|
|
|
|
|
|
|
|
|
|
|
| NMI |
|
|
|
|
433,537 |
|
|
|
– |
|
|
|
– |
|
|
|
(7,020,129) |
|
|
|
(6,399,852) |
|
|
|
– |
|
|
|
(316,609) |
|
|
|
(13,303,053) |
|
| 1 |
Undistributed tax-exempt income (on a tax basis) has not been reduced for the
dividend declared on October 2, 2023 and paid on November 1, 2023. |
The tax character of distributions paid was as
follows:
|
|
|
|
|
|
|
|
|
|
|
|
|
|
|
|
|
|
|
|
|
|
|
|
|
| |
|
10/31/23 |
|
|
10/31/22 |
|
| Fund |
|
Tax-Exempt
Income1 |
|
|
Ordinary
Income |
|
|
Long-Term
Capital Gains |
|
|
Tax-Exempt
Income |
|
|
Ordinary
Income |
|
|
Long-Term
Capital Gains |
|
|
|
|
|
|
|
|
| NUV |
|
$ |
69,485,651 |
|
|
$ |
455,866 |
|
|
$ |
– |
|
|
$ |
68,791,746 |
|
|
$ |
942,228 |
|
|
$ |
– |
|
|
|
|
|
|
|
|
| NUW |
|
|
8,621,293 |
|
|
|
4,324 |
|
|
|
– |
|
|
|
8,231,947 |
|
|
|
538,802 |
|
|
|
3,075,337 |
|
|
|
|
|
|
|
|
| NMI |
|
|
3,678,642 |
|
|
|
– |
|
|
|
– |
|
|
|
3,254,922 |
|
|
|
– |
|
|
|
4,909 |
|
| 1 |
Each Fund designates these amounts paid during the period as Exempt Interest Dividends. |
87
Notes to Financial Statements (continued)
As of year end, the Funds had capital loss carryforwards, which will not expire:
|
|
|
|
|
|
|
|
|
|
|
|
|
| Fund |
|
Short-Term |
|
|
Long-Term |
|
|
Total |
|
|
|
|
| NUV |
|
$ |
39,918,409 |
|
|
$ |
44,660,894 |
|
|
$ |
84,579,303 |
|
|
|
|
|
| NUW |
|
|
– |
|
|
|
542,698 |
|
|
|
542,698 |
|
|
|
|
|
| NMI |
|
|
3,319,863 |
|
|
|
3,079,989 |
|
|
|
6,399,852 |
|
| 8. |
Management Fees and Other Transactions with Affiliates |
Management Fees: Each Fund’s management fee compensates
the Adviser for the overall investment advisory and administrative services and general office facilities. The Sub-Adviser is compensated for its services to the Funds from the management fees paid to the
Adviser.
Each Fund’s management fee consists of two components – a fund-level fee, based only on the amount of assets within each individual Fund,
and a complex-level fee, based on the aggregate amount of all eligible fund assets managed by the Adviser and for NUV a gross interest income component. This pricing structure enables each Fund’s shareholders to benefit from growth in the
assets within their respective Fund as well as from growth in the amount of complex-wide assets managed by the Adviser.
The annual fund-level fee, payable monthly,
for NUV is calculated according to the following schedule:
|
|
|
|
|
| |
|
NUV |
|
| Average Daily Net Assets |
|
Fund-Level Fee
Rate |
|
| For the first $500 million |
|
|
0.1500 |
% |
| For the next $500 million |
|
|
0.1250 |
|
| For net assets over $1 billion |
|
|
0.1000 |
|
In addition, NUV pays an annual management fee, payable monthly, based on gross interest income (excluding interest on bonds underlying a
“self-deposited inverse floater” trust that is attributed to the Fund over and above the net interest earned on the inverse floater itself) as follows:
|
|
|
|
|
| |
|
NUV |
|
| Gross Interest Income |
|
Gross Income Fee
Rate |
|
| For the first $50 million |
|
|
4.125 |
% |
| For the next $50 million |
|
|
4.000 |
|
| For gross income over $100 million |
|
|
3.875 |
|
The annual fund-level fee, payable monthly, for NUW and NMI is calculated according to the following schedules:
|
|
|
|
|
| |
|
NUW |
|
| Average Daily Managed Assets* |
|
Fund-Level Fee
Rate |
|
| For the first $125 million |
|
|
0.4000 |
% |
| For the next $125 million |
|
|
0.3875 |
|
| For the next $250 million |
|
|
0.3750 |
|
| For the next $500 million |
|
|
0.3625 |
|
| For the next $1 billion |
|
|
0.3500 |
|
| For the next $3 billion |
|
|
0.3250 |
|
| For managed assets over $5 billion |
|
|
0.3125 |
|
|
|
|
|
|
| |
|
NMI |
|
| Average Daily Net Assets |
|
Fund-Level Fee
Rate |
|
| For the first $125 million |
|
|
0.4500 |
% |
| For the next $125 million |
|
|
0.4375 |
|
| For the next $250 million |
|
|
0.4250 |
|
| For the next $500 million |
|
|
0.4125 |
|
| For the next $1 billion |
|
|
0.4000 |
|
| For the next $3 billion |
|
|
0.3750 |
|
| For net assets over $5 billion |
|
|
0.3625 |
|
88
The annual complex-level fee, payable monthly, for each Fund is calculated by multiplying the current complex-wide fee rate, determined according to the following
schedule by the Fund’s daily managed assets:
|
|
|
| Complex-Level Eligible Asset Breakpoint Level* |
|
Effective Complex-Level Fee Rate at Breakpoint Level |
| $55 billion |
|
0.2000% |
| $56 billion |
|
0.1996 |
| $57 billion |
|
0.1989 |
| $60 billion |
|
0.1961 |
| $63 billion |
|
0.1931 |
| $66 billion |
|
0.1900 |
| $71 billion |
|
0.1851 |
| $76 billion |
|
0.1806 |
| $80 billion |
|
0.1773 |
| $91 billion |
|
0.1691 |
| $125 billion |
|
0.1599 |
| $200 billion |
|
0.1505 |
| $250 billion |
|
0.1469 |
| $300 billion |
|
0.1445 |
| * |
For the complex-level fees, managed assets include closed-end fund assets managed
by the Adviser that are attributable to certain types of leverage. For these purposes, leverage includes the funds’ use of preferred stock and borrowings and certain investments in the residual interest certificates (also called inverse
floating rate securities) in tender option bond (TOB) trusts, including the portion of assets held by a TOB trust that has been effectively financed by the trust’s issuance of floating rate securities, subject to an agreement by the Adviser as
to certain funds to limit the amount of such assets for determining managed assets in certain circumstances. The complex-level fee is calculated based upon the aggregate daily managed assets of all Nuveen
open-end and closed-end funds that constitute ‘‘eligible assets.” Eligible assets do not include assets attributable to investments in other Nuveen funds
or assets in excess of a determined amount (originally $2 billion) added to the Nuveen fund complex in connection with the Adviser’s assumption of the management of the former First American Funds effective January 1, 2011, but do not
include certain assets of certain Nuveen funds that were reorganized into funds advised by an affiliate of the Adviser during the 2019 calendar year. As of October 31, 2023, the complex-level fee for each Fund was as follows:
|
|
|
|
|
|
| Fund |
|
Complex-Level Fee |
|
|
|
| NUV |
|
|
0.1623% |
|
|
|
| NUW |
|
|
0.1623% |
|
|
|
| NMI |
|
|
0.1623% |
|
Other Transactions with Affiliates: Each Fund is permitted to purchase or sell securities from or to certain other funds or accounts managed by the Sub-Adviser (“Affiliated Entity”) under
specified conditions outlined in procedures adopted by the Board (“cross-trade”). These procedures have been designed to ensure that any cross-trade of securities by the Fund from or to an Affiliated Entity by virtue of having a common
investment adviser (or affiliated investment adviser), common officer and/or common trustee complies with Rule 17a-7 under the 1940 Act. These transactions are effected at the current market price (as provided
by an independent pricing service) without incurring broker commissions.
During the current fiscal period, the Funds engaged in cross-trades pursuant to
these procedures as follows:
|
|
|
|
|
|
|
|
|
|
|
|
|
| Fund |
|
Purchases |
|
|
Sales |
|
|
Realized
Gain (Loss) |
|
|
|
|
|
| NUV |
|
$ |
– |
|
|
$ |
– |
|
|
$ |
– |
|
|
|
|
|
| NUW |
|
|
– |
|
|
|
– |
|
|
|
– |
|
|
|
|
|
| NMI |
|
|
4,861,068 |
|
|
|
6,928,503 |
|
|
|
(452,816) |
|
| 9. |
Commitments and Contingencies |
In the normal course of business, each Fund enters into a variety of agreements that may expose the Funds to some risk of loss. These could include recourse arrangements
for certain TOB Trusts, which are described elsewhere in these Notes to Financial Statements. The risk of future loss arising from such agreements, while not quantifiable, is expected to be remote. As of the end of the reporting period, the Funds
did not have any unfunded commitments.
From time to time, the Funds may be a party to certain legal proceedings in the ordinary course of business, including
proceedings relating to the enforcement of the Funds’ rights under contracts. As of the end of the reporting period, the Funds are not subject to any material legal proceedings.
89
Notes to Financial Statements (continued)
| 10. |
Borrowing Arrangements |
Committed Line of Credit: The Funds, along with certain other
funds managed by the Adviser (“Participating Funds”), have established a 364-day, $2.700 billion standby credit facility with a group of lenders, under which the Participating Funds may borrow
for temporary purposes (other than on-going leveraging for investment purposes). Each Participating Fund is allocated a designated proportion of the facility’s capacity (and its associated costs, as described below) based upon a multi-factor
assessment of the likelihood and frequency of its need to draw on the facility, the size of the Fund and its anticipated draws, and the potential importance of such draws to the operations and well-being of the Fund, relative to those of the other
Funds. A Fund may effect draws on the facility in excess of its designated capacity if and to the extent that other Participating Funds have undrawn capacity. The current credit facility was entered into on June 21, 2023 expiring on
June 19, 2024, replacing the previous facility, which expired June 2023.
The credit facility has the following terms: 0.15% per annum on unused
commitment amounts and a drawn interest rate equal to the higher of (a) OBFR (Overnight Bank Funding Rate) plus 1.20% per annum or (b) the Fed Funds Effective Rate plus 1.20% per annum on amounts borrowed. The Participating Funds also
incurred a 0.05% upfront fee on the increased commitments from select lenders. Interest expense incurred by the Participating Funds, when applicable, is recognized as a component of “Interest expense” on the Statement of Operations.
Participating Funds paid administration, legal and arrangement fees, which are recognized as a component of “Interest expense” on the Statement of Operations, and along with commitment fees, have been allocated among such Participating
Funds based upon the relative proportions of the facility’s aggregate capacity reserved for them and other factors deemed relevant by the Adviser and the Board of each Participating Fund.
During the current fiscal period, the Funds utilized this facility. Each Fund’s maximum outstanding balance during the utilization period was as follows:
|
|
|
|
|
| Fund |
|
Maximum
Outstanding Balance |
|
|
|
| NUV |
|
$ |
2,942,327 |
|
|
|
| NUW |
|
|
296,365 |
|
|
|
| NMI |
|
|
197,550 |
|
During each Fund’s utilization period(s) during the current fiscal period, the average daily balance outstanding and average annual
interest rate on the Borrowings were as follows:
|
|
|
|
|
|
|
|
|
|
|
|
|
| Fund |
|
Utilization
Period (Days Outstanding) |
|
|
Average
Daily Balance
Outstanding |
|
|
Average Annual
Interest Rate |
|
|
|
|
|
| NUV |
|
|
8 |
|
|
$ |
2,002,377 |
|
|
|
6.12% |
|
|
|
|
|
| NUW |
|
|
4 |
|
|
|
296,365 |
|
|
|
5.53 |
|
|
|
|
|
| NMI |
|
|
7 |
|
|
|
157,964 |
|
|
|
5.85 |
|
Borrowings outstanding as of the end of the reporting period, if any, are recognized as “Borrowings” on the Statement of Assets
and Liabilities, where applicable.
Inter-Fund Borrowing and Lending: The SEC has granted an
exemptive order permitting registered open-end and closed-end Nuveen funds to participate in an inter-fund lending facility whereby the Nuveen funds may directly lend to
and borrow money from each other for temporary purposes (e.g., to satisfy redemption requests or when a sale of securities “fails,” resulting in an unanticipated cash shortfall) (the “Inter-Fund Program”). The closed-end Nuveen funds, including the Funds covered by this shareholder report, will participate only as lenders, and not as borrowers, in the Inter-Fund Program because such
closed-end funds rarely, if ever, need to borrow cash to meet redemptions. The Inter-Fund Program is subject to a number of conditions, including, among other things, the requirements that (1) no fund may
borrow or lend money through the Inter-Fund Program unless it receives a more favorable interest rate than is typically available from a bank or other financial institution for a comparable transaction; (2) no fund may borrow on an unsecured
basis through the Inter-Fund Program unless the fund’s outstanding borrowings from all sources immediately after the inter-fund borrowing total 10% or less of its total assets; provided that if the borrowing fund has a secured borrowing
outstanding from any other lender, including but not limited to another fund, the inter-fund loan must be secured on at least an equal priority basis with at least an equivalent percentage of collateral to loan value; (3) if a fund’s total
outstanding borrowings immediately after an inter-fund borrowing would be greater than 10% of its total assets, the fund may borrow through the inter-fund loan on a secured basis only; (4) no fund may lend money if the loan would cause its
aggregate outstanding loans through the Inter-Fund Program to exceed 15% of its net assets at the time of the loan; (5) a fund’s inter-fund loans to any one fund shall not exceed 5% of the lending fund’s net assets; (6) the
duration of inter-fund loans will be limited to the time required to receive payment for securities sold, but in no event more than seven days; and (7) each inter-fund loan may be called on one business day’s notice by a lending fund and
may be repaid on any day by a borrowing fund. In addition, a Nuveen fund may participate in the Inter-Fund Program only if and to the extent that such participation is consistent with the fund’s investment objective and investment policies. The
Board is responsible for overseeing the Inter-Fund Program.
90
The limitations detailed above and the other conditions of the SEC exemptive order permitting the Inter-Fund Program are designed to minimize the risks associated with
Inter-Fund Program for both the lending fund and the borrowing fund. However, no borrowing or lending activity is without risk. When a fund borrows money from another fund, there is a risk that the loan could be called on one day’s notice or
not renewed, in which case the fund may have to borrow from a bank at a higher rate or take other actions to payoff such loan if an inter-fund loan is not available from another fund. Any delay in repayment to a lending fund could result in a
lost investment opportunity or additional borrowing costs.
During the current reporting period, none of the Funds covered by this shareholder report have entered
into any inter-fund loan activity.
12. Subsequent Events
As noted in the
Common Share information section of this report, effective with distributions payable on December 1, 2023, each Fund’s distribution policy, which may be changed by the Board, is to make regular monthly cash distributions to holders of its
common shares (stated in terms of a fixed cents per common share dividend distribution rate which may be set from time to time). The Fund intends to distribute all or substantially all of its net investment income through its regular monthly
distribution and to distribute realized capital gains at least annually. In addition, in any monthly period, to maintain its declared per common share distribution amount, the Fund may distribute more or less than its net investment income during
the period. In the event the Fund distributes more than its net investment income during any yearly period, such distributions may also include realized gains and/or a return of capital. To the extent that a distribution includes a return of capital
the NAV per share may erode. If the Fund’s distribution includes anything other than net investment income, the Fund will provide a notice to shareholders of its best estimate of the distribution sources at that the time of the distribution.
These estimates may not match the final tax characterization (for the full year’s distributions) contained in shareholders’ 1099-DIV forms after the end of the year.
91
Shareholder Update
(Unaudited)
CURRENT INVESTMENT OBJECTIVES, INVESTMENT POLICIES AND PRINCIPAL RISKS
OF THE FUNDS
NUVEEN MUNICIPAL VALUE FUND, INC. (NUV)
Investment Objectives
The Fund’s primary investment objective is current
income exempt from federal income tax. The Fund’s secondary objective is the enhancement of portfolio value through selection of tax-exempt bonds and municipal market sectors. The Fund seeks to
achieve its investment objectives by investing in a portfolio of municipal securities, a significant portion of which the Fund’s investment sub-adviser believes are underrated and undervalued, based upon its bottom-up, research-driven investment strategy.
Investment Policies
Under normal circumstances, the Fund will invest at least 80% of its Assets (as defined below) in municipal securities, the income from which is exempt from regular
federal income taxes.
“Assets” mean the net assets of the Fund plus the amount of any borrowings for investment purposes. “Managed Assets” mean
the total assets of the Fund, minus the sum of its accrued liabilities (other than Fund liabilities incurred for the express purpose of creating leverage). Total assets for this purpose shall include assets attributable to the Fund’s use of
leverage (whether or not those assets are reflected in the Fund’s financial statements for purposes of generally accepted accounting principles), and derivatives will be valued at their market value.
Under normal circumstances:
| |
● |
|
The Fund may invest up to 20% of its Managed Assets in municipal securities that pay interest that is taxable under the
federal alternative minimum tax. |
| |
● |
|
The Fund will invest at least 80% of its Managed Assets in investment grade quality municipal securities that, at the time
of investment, are rated within the four highest grades (Baa or BBB or better) by at least one nationally recognized statistical rating organization (“NRSRO”) that rate such securities, or if it is unrated but judged to be of comparable
quality by the Fund’s sub-adviser. A security is considered investment grade if it is rated within the four highest letter grades by at least one NRSRO that rate such securities (even if rated lower by
another), or if it is unrated but judged to be of comparable quality by the Fund’s sub-adviser (such securities are commonly referred to as split-rated securities). |
| |
● |
|
The Fund may invest up to 20% of its Managed Assets in municipal securities that at the time of investment are rated below
investment grade (Ba or BB or lower) by all NRSROs or are unrated but judged to be of comparable quality by the Fund’s sub-adviser; however, the Fund may not invest more than 10% of its Managed Assets in
municipal securities rated below B3/B- by all NRSROs that rate the security or that are unrated but judged to be of comparable quality by the Fund’s sub-adviser.
|
| |
● |
|
The Fund may invest up to 15% of its Managed Assets in inverse floating rate securities. |
| |
● |
|
The Fund will not invest more than 25% of its Managed Assets in municipal securities in any one industry or in any one state
of origin. |
| |
● |
|
The Fund will not invest more than 10% of its Managed Assets in “tobacco settlement bonds.” |
| |
● |
|
The Fund may invest in distressed securities but may not invest in the securities of an issuer which, at the time of
investment, is in default on its obligations to pay principal or interest thereon when due or that is involved in a bankruptcy proceeding (i.e., rated below C-, at the time of investment); provided, however,
that the Fund’s sub-adviser may determine that it is in the best interest of shareholders in pursuing a workout arrangement with issuers of defaulted securities to make loans to the defaulted issuer or
another party, or purchase a debt, equity or other interest from the defaulted issuer or another party, or take other related or similar steps involving the investment of additional monies, but only if that issuer’s securities are already held
by the Fund. |
| |
● |
|
The Fund may not enter into a futures contract or related options or forward contracts if more than 30% of the Fund’s
Managed Assets would be represented by futures contracts or more than 5% of the Fund’s Managed Assets would be committed to initial margin deposits and premiums on futures contracts or related options. |
| |
● |
|
The Fund will generally maintain an investment portfolio with an overall weighted average maturity of greater than 10 years.
|
The foregoing policies apply only at the time of any new investment.
Approving Changes in Investment Policies
The Board of Trustees of the Fund may
change the policies described above without a shareholder vote. However, with respect to the Fund’s policy of investing at least 80% of its Assets in municipal securities, the income from which is exempt from regular federal income taxes, such
policy may not be changed without 60 days’ prior written notice and the approval of the holders of a majority of the outstanding common shares and preferred shares voting together as a single class, and the approval of the holders of a majority
of the outstanding preferred shares, voting separately as a single class. A “majority of the outstanding” shares means (i) 67% or more of the shares present at a meeting, if the holders of more than 50% of the shares are present or
represented by proxy or (ii) more than 50% of the shares, whichever is less.
92
Portfolio Contents
The Fund generally invests in municipal securities.
Municipal securities include municipal bonds, notes, securities issued to finance and refinance public projects, certificates of participation, variable rate demand obligations, lease obligations, municipal notes,
pre-refunded municipal bonds, private activity bonds, securities issued by tender option bond (“TOB”) Trusts, including inverse floating rate securities, and other forms of municipal bonds and
securities, and other related instruments that create exposure to municipal bonds, notes and securities that provide for the payment of interest income that is exempt from regular U.S. federal income tax.
Municipal securities are debt obligations generally issued by states, cities and local authorities and certain possessions and territories of the United States (such as
Puerto Rico and Guam) to finance or refinance public purpose projects such as roads, schools, and water supply systems.
The Fund may invest in municipal securities
that are additionally secured by insurance, bank credit agreements or escrow accounts.
The Fund may invest a significant portion of its Managed Assets in certain
sectors of the municipal securities market, such as hospitals and other health care facilities, charter schools and other private educational facilities, special taxing districts and start-up utility
districts, and private activity bonds including industrial development bonds on behalf of transportation companies such as airline companies, whose credit quality and performance may be more susceptible to economic, business, political, regulatory
and other developments than other sectors of municipal issuers.
The Fund may also invest in municipal securities that pay interest that is taxable under the federal
alternative minimum tax applicable to noncorporate taxpayers (“AMT Bonds”). AMT Bonds may trigger adverse tax consequences for Fund shareholders who are subject to the federal alternative minimum tax.
The Fund may invest in municipal securities that represent lease obligations and certificates of participation in such leases. A municipal lease is an obligation in the
form of a lease or installment purchase that is issued by a state or local government to acquire equipment and facilities. Income from such obligations generally is exempt from state and local taxes in the state of issuance. A certificate of
participation represents an undivided interest in an unmanaged pool of municipal leases, an installment purchase agreement or other instruments. The certificates typically are issued by a municipal agency, a trust or other entity that has received
an assignment of the payments to be made by the state or political subdivision under such leases or installment purchase agreements. Such certificates provide the Fund with the right to a pro rata undivided interest in the underlying municipal
securities. In addition, such participations generally provide the Fund with the right to demand payment, on not more than seven days’ notice, of all or any part of the Fund’s participation interest in the underlying municipal securities,
plus accrued interest.
The Fund may invest in municipal notes. Municipal securities in the form of notes generally are used to provide for short-term capital needs,
in anticipation of an issuer’s receipt of other revenues or financing, and typically have maturities of up to three years. Such instruments may include tax anticipation notes, revenue anticipation notes, bond anticipation notes, tax and revenue
anticipation notes and construction loan notes. Tax anticipation notes are issued to finance the working capital needs of governments. Generally, they are issued in anticipation of various tax revenues, such as income, sales, property, use and
business taxes, and are payable from these specific future taxes. Revenue anticipation notes are issued in expectation of receipt of other kinds of revenue, such as federal revenues available under federal revenue sharing programs. Bond anticipation
notes are issued to provide interim financing until long-term bond financing can be arranged. In most cases, the long-term bonds then provide the funds needed for repayment of the bond anticipation notes. Tax and revenue anticipation notes combine
the funding sources of both tax anticipation notes and revenue anticipation notes. Construction loan notes are sold to provide construction financing. Mortgage notes insured by the Federal Housing Authority secure these notes; however, the proceeds
from the insurance may be less than the economic equivalent of the payment of principal and interest on the mortgage note if there has been a default. The anticipated revenues from taxes, grants or bond financing generally secure the obligations of
an issuer of municipal notes.
The Fund may invest in “tobacco settlement bonds.” Tobacco settlement bonds are municipal securities that are secured or
payable solely from the collateralization of the proceeds from class action or other litigation against the tobacco industry.
The Fund may invest in pre-refunded municipal securities. The principal of and interest on pre-refunded municipal securities are no longer paid from the original revenue source for the
securities. Instead, the source of such payments is typically an escrow fund consisting of U.S. government securities. The assets in the escrow fund are derived from the proceeds of refunding bonds issued by the same issuer as the pre-refunded municipal securities. Issuers of municipal securities use this advance refunding technique to obtain more favorable terms with respect to securities that are not yet subject to call or
redemption by the issuer. For example, advance refunding enables an issuer to refinance debt at lower market interest rates, restructure debt to improve cash flow or eliminate restrictive covenants in the indenture or other governing instrument for the pre-refunded municipal securities. However, except for a change in the revenue source from which principal and interest payments are made,
the pre-refunded municipal securities remain outstanding on their original terms until they mature or are redeemed by the issuer.
The Fund may invest in private activity bonds. Private activity bonds are issued by or on behalf of public authorities to obtain funds to provide privately operated
housing facilities, airport, mass transit or port facilities, sewage disposal, solid waste disposal or hazardous waste treatment or disposal facilities and certain local facilities for water supply, gas or electricity. Other types of private
activity bonds, the proceeds of which are used for the construction, equipment, repair or improvement of privately operated industrial or commercial facilities, may constitute municipal securities, although the current federal tax laws place
substantial limitations on the size of such issues.
The Fund may invest in municipal securities issued by special taxing districts. Special taxing districts are
organized to plan and finance infrastructure developments to induce residential, commercial and industrial growth and redevelopment. The bond financing methods such as tax increment finance, tax assessment, special services district and Mello-Roos
bonds, are generally payable solely from taxes or other revenues attributable to the specific projects financed by the bonds without recourse to the credit or taxing power of related or overlapping municipalities.
93
Shareholder Update (Unaudited) (continued)
The Fund may invest in inverse floating rate securities issued by a TOB trust, the interest rate on which varies inversely with the Securities Industry Financial Markets
Association short-term rate, which resets weekly, or a similar short-term rate, and is reduced by the expenses related to the TOB trust. Typically, inverse floating rate securities represent beneficial interests in a special purpose trust (sometimes
called a TOB trust) formed by a third party sponsor for the purpose of holding municipal bonds. Inverse floating rate securities may increase or decrease in value at a greater rate than the underlying interest rate on the municipal bond held by the
TOB trust, which effectively leverages the Fund’s investment.
The Fund may invest in floating rate securities issued by special purpose trusts. Floating rate
securities may take the form of short-term floating rate securities or the option period may be substantially longer. Generally, the interest rate earned will be based upon the market rates for municipal securities with maturities or remarketing
provisions that are comparable in duration to the periodic interval of the tender option, which may vary from weekly, to monthly, to extended periods of one year or multiple years. Since the option feature has a shorter term than the final maturity
or first call date of the underlying bond deposited in the trust, the Fund as the holder of the floating rate security relies upon the terms of the agreement with the financial institution furnishing the option as well as the credit strength of that
institution. As further assurance of liquidity, the terms of the trust provide for a liquidation of the municipal security deposited in the trust and the application of the proceeds to pay off the floating rate security. The trusts that are
organized to issue both short-term floating rate securities and inverse floaters generally include liquidation triggers to protect the investor in the floating rate security.
The Fund may invest in zero coupon bonds. A zero coupon bond is a bond that typically does not pay interest for the entire life of the obligation or for an initial period
after the issuance of the obligation.
The Fund may buy and sell securities on a when-issued or delayed delivery basis, making payment or taking delivery at a later
date, normally within 15 to 45 days of the trade date.
The Fund may invest in illiquid securities (i.e., securities that are not readily marketable), including, but
not limited to, restricted securities (securities the disposition of which is restricted under the federal securities laws), securities that may be resold only pursuant to Rule 144A under the Securities Act of 1933, as amended (the “1933
Act”), and repurchase agreements with maturities in excess of seven days.
The Fund may enter into certain derivative instruments in pursuit of its investment
objectives, including to seek to enhance return, to hedge certain risks of its investments in municipal securities or as a substitute for a position in the underlying asset. Such instruments include financial futures contracts, swap contracts
(including interest rate swaps, credit default swaps and municipal market data rate locks (“MMD Rate Locks”)), options on financial futures, options on swap contracts or other derivative instruments.
The Fund may purchase and sell MMD Rate Locks. An MMD Rate Lock permits the Fund to lock in a specified municipal interest rate for a portion of its portfolio to preserve
a return on a particular investment or a portion of its portfolio as a duration management technique or to protect against any increase in the price of securities to be purchased at a later date. By using an MMD Rate Lock, the Fund can create a
synthetic long or short position, allowing the Fund to select what the manager believes is an attractive part of the yield curve. The Fund will ordinarily use these transactions as a hedge or for duration or risk management although it is permitted
to enter into them to enhance income or gain or to increase the Fund’s yield, for example, during periods of steep interest rate yield curves (i.e., wide differences between short term and long term interest rates).
The Fund may also invest in securities of other open- or closed-end investment companies (including exchange-traded
funds (“ETFs”)) that invest primarily in municipal securities of the types in which the Fund may invest directly, to the extent permitted by the Investment Company Act of 1940, as amended (the “1940 Act”), the rules and
regulations issued thereunder and applicable exemptive orders issued by the Securities and Exchange Commission (“SEC”).
Use of Leverage
As a fundamental policy, the Fund will not leverage its capital structure by issuing senior securities such as the issuance of preferred shares of beneficial interest
(“Preferred Shares”) or debt instruments. However, the Fund may borrow for temporary or emergency purposes and invest in certain instruments, including inverse floating rate securities that have the economic effect of leverage. The Fund
may source leverage through investments in inverse floating rate securities, which have the economic effect of leverage. The amount of leverage will vary depending on market conditions.
Temporary Defensive Periods
During temporary defensive periods (e.g., times
when, in the Fund’s investment adviser’s and/or the Fund’s sub-adviser’s opinion, temporary imbalances of supply and demand or other temporary dislocations in the tax-exempt bond market adversely affect the price at which long-term or intermediate-term municipal securities are available), and in order to keep the Fund’s cash fully invested, the Fund may
invest up to 100% of its Managed Assets in short-term investments including high quality, short-term debt securities that may be either tax-exempt or taxable. The Fund may not achieve its investment
objectives during such periods.
94
NUVEEN AMT-FREE MUNICIPAL VALUE FUND (NUW)
Investment Objectives
The Fund’s primary investment objective is to
provide current income exempt from regular federal income tax. The Fund’s secondary investment objective is to enhance portfolio value and total return.
Investment Policies
Under normal circumstances, the Fund will invest at least
80% of its Assets (as defined below) in municipal securities and other related investments, the income from which is exempt from regular federal income taxes. Generally, the Fund expects to be fully invested (at least 95% of its assets) in such
municipal securities.
“Assets” mean the net assets of the Fund plus the amount of any borrowings for investment purposes. “Managed Assets” mean
the total assets of the Fund, minus the sum of its accrued liabilities (other than Fund liabilities incurred for the express purpose of creating leverage). Total assets for this purpose shall include assets attributable to the Fund’s use of
leverage (whether or not those assets are reflected in the Fund’s financial statements for purposes of generally accepted accounting principles), and derivatives will be valued at their market value.
Under normal circumstances:
| |
● |
|
The Fund will invest at least 80% of its Managed Assets in investment grade quality municipal securities that, at the time
of investment, are rated within the four highest grades (Baa or BBB or better) by at least one NRSRO that rate such securities, or if it is unrated but judged to be of comparable quality by the Fund’s
sub-adviser. A security is considered investment grade if it is rated within the four highest letter grades by at least one NRSRO that rate such securities (even if rated lower by another), or if it is unrated
but judged to be of comparable quality by the Fund’s sub-adviser (such securities are commonly referred to as split-rated securities). |
| |
● |
|
The Fund may invest up to 20% of its Managed Assets in municipal securities that at the time of investment are rated below
investment grade (Ba or BB or lower) by all NRSRO or are unrated but judged to be of comparable quality by the Fund’s sub-adviser; however, the Fund may not invest more than 10% of its Managed Assets in
municipal securities rated below B3/B- by all NRSROs that rate the security or that are unrated but judged to be of comparable quality by the Fund’s sub-adviser.
|
| |
● |
|
The Fund will not invest in municipal securities that pay interest that is taxable under the federal alternative minimum tax
applicable to individuals. |
| |
● |
|
The Fund may invest in distressed securities but may not invest in the securities of an issuer which, at the time of
investment, is in default on its obligations to pay principal or interest thereon when due or that is involved in a bankruptcy proceeding (i.e., rated below C-, at the time of investment); provided, however,
that the Fund’s sub-adviser may determine that it is in the best interest of shareholders in pursuing a workout arrangement with issuers of defaulted securities to make loans to the defaulted issuer or
another party, or purchase a debt, equity or other interest from the defaulted issuer or another party, or take other related or similar steps involving the investment of additional monies, but only if that issuer’s securities are already held
by the Fund. |
| |
● |
|
The Fund may invest up to 15% of its Managed Assets in inverse floating rate securities. |
| |
● |
|
The Fund will not invest more than 25% of its Managed Assets in municipal securities in any one industry or in any one state
of origin and no more than 5% of its Managed Assets in any one issuer. |
| |
● |
|
The Fund may not enter into a futures contract or related options or forward contracts if more than 30% of the Fund’s
Managed Assets would be represented by futures contracts or more than 5% of the Fund’s Managed Assets would be committed to initial margin deposits and premiums on futures contracts or related options. |
| |
● |
|
The Fund will generally maintain an investment portfolio with an overall weighted average maturity of greater than 10 years.
|
The foregoing policies apply only at the time of any new investment.
Approving Changes in Investment Policies
The Board of Trustees of the Fund may
change the policies described above without a shareholder vote. However, with respect to the Fund’s policy of investing at least 80% of its Assets in municipal securities and other related investments, the income from which is exempt from
regular federal income taxes, such policy may not be changed without 60 days’ prior written notice and the approval of the holders of a majority of the outstanding common shares and preferred shares voting together as a single class, and the
approval of the holders of a majority of the outstanding preferred shares, voting separately as a single class. A “majority of the outstanding” shares means (i) 67% or more of the shares present at a meeting, if the holders of more than
50% of the shares are present or represented by proxy or (ii) more than 50% of the shares, whichever is less.
95
Shareholder Update (Unaudited) (continued)
Portfolio Contents
The Fund generally invests in municipal securities.
Municipal securities include municipal bonds, notes, securities issued to finance and refinance public projects, certificates of participation, variable rate demand obligations, lease obligations, municipal notes,
pre-refunded municipal bonds, private activity bonds, securities issued by TOB Trusts, including inverse floating rate securities, and other forms of municipal bonds and securities, and other related
instruments that create exposure to municipal bonds, notes and securities that provide for the payment of interest income that is exempt from regular U.S. federal income tax.
Municipal securities are debt obligations generally issued by states, cities and local authorities and certain possessions and territories of the United States (such as
Puerto Rico and Guam) to finance or refinance public purpose projects such as roads, schools, and water supply systems.
The Fund may invest in municipal securities
that are additionally secured by insurance, bank credit agreements or escrow accounts.
The Fund may invest a significant portion of its Managed Assets in certain
sectors of the municipal securities market, such as hospitals and other health care facilities, charter schools and other private educational facilities, special taxing districts and start-up utility
districts, and private activity bonds including industrial development bonds on behalf of transportation companies such as airline companies, whose credit quality and performance may be more susceptible to economic, business, political, regulatory
and other developments than other sectors of municipal issuers.
The Fund may invest in municipal securities that represent lease obligations and certificates of
participation in such leases. A municipal lease is an obligation in the form of a lease or installment purchase that is issued by a state or local government to acquire equipment and facilities. Income from such obligations generally is exempt from
state and local taxes in the state of issuance. A certificate of participation represents an undivided interest in an unmanaged pool of municipal leases, an installment purchase agreement or other instruments. The certificates typically are issued
by a municipal agency, a trust or other entity that has received an assignment of the payments to be made by the state or political subdivision under such leases or installment purchase agreements. Such certificates provide the Fund with the right
to a pro rata undivided interest in the underlying municipal securities. In addition, such participations generally provide the Fund with the right to demand payment, on not more than seven days’ notice, of all or any part of the Fund’s
participation interest in the underlying municipal securities, plus accrued interest.
The Fund may invest in municipal notes. Municipal securities in the form of
notes generally are used to provide for short-term capital needs, in anticipation of an issuer’s receipt of other revenues or financing, and typically have maturities of up to three years. Such instruments may include tax anticipation notes,
revenue anticipation notes, bond anticipation notes, tax and revenue anticipation notes and construction loan notes. Tax anticipation notes are issued to finance the working capital needs of governments. Generally, they are issued in anticipation of
various tax revenues, such as income, sales, property, use and business taxes, and are payable from these specific future taxes. Revenue anticipation notes are issued in expectation of receipt of other kinds of revenue, such as federal revenues
available under federal revenue sharing programs. Bond anticipation notes are issued to provide interim financing until long-term bond financing can be arranged. In most cases, the long-term bonds then provide the funds needed for repayment of the
bond anticipation notes. Tax and revenue anticipation notes combine the funding sources of both tax anticipation notes and revenue anticipation notes. Construction loan notes are sold to provide construction financing. Mortgage notes insured by the
Federal Housing Authority secure these notes; however, the proceeds from the insurance may be less than the economic equivalent of the payment of principal and interest on the mortgage note if there has been a default. The anticipated revenues from
taxes, grants or bond financing generally secure the obligations of an issuer of municipal notes.
The Fund may invest in “tobacco settlement bonds.”
Tobacco settlement bonds are municipal securities that are secured or payable solely from the collateralization of the proceeds from class action or other litigation against the tobacco industry.
The Fund may invest in pre-refunded municipal securities. The principal of and interest
on pre-refunded municipal securities are no longer paid from the original revenue source for the securities. Instead, the source of such payments is typically an escrow fund consisting of U.S.
government securities. The assets in the escrow fund are derived from the proceeds of refunding bonds issued by the same issuer as the pre-refunded municipal securities. Issuers of municipal
securities use this advance refunding technique to obtain more favorable terms with respect to securities that are not yet subject to call or redemption by the issuer. For example, advance refunding enables an issuer to refinance debt at lower
market interest rates, restructure debt to improve cash flow or eliminate restrictive covenants in the indenture or other governing instrument for the pre-refunded municipal securities. However,
except for a change in the revenue source from which principal and interest payments are made, the pre-refunded municipal securities remain outstanding on their original terms until they mature or
are redeemed by the issuer.
The Fund may invest in private activity bonds. Private activity bonds are issued by or on behalf of public authorities to obtain funds to
provide privately operated housing facilities, airport, mass transit or port facilities, sewage disposal, solid waste disposal or hazardous waste treatment or disposal facilities and certain local facilities for water supply, gas or electricity.
Other types of private activity bonds, the proceeds of which are used for the construction, equipment, repair or improvement of privately operated industrial or commercial facilities, may constitute municipal securities, although the current federal
tax laws place substantial limitations on the size of such issues.
The Fund may invest in municipal securities issued by special taxing districts. Special taxing
districts are organized to plan and finance infrastructure developments to induce residential, commercial and industrial growth and redevelopment. The bond financing methods such as tax increment finance, tax assessment, special services district
and Mello-Roos bonds, are generally payable solely from taxes or other revenues attributable to the specific projects financed by the bonds without recourse to the credit or taxing power of related or overlapping municipalities.
The Fund may invest in inverse floating rate securities issued by a TOB trust, the interest rate on which varies inversely with the Securities Industry Financial Markets
Association short-term rate, which resets weekly, or a similar short-term rate, and is reduced by the expenses related to the TOB trust. Typically, inverse floating rate securities represent beneficial interests in a special purpose trust (sometimes
called a TOB trust) formed by a third party sponsor for the purpose of holding municipal bonds. Inverse floating rate securities may increase or decrease in value at a greater rate than the underlying interest rate on the municipal bond held by the
TOB trust, which effectively leverages the Fund’s investment.
96
The Fund may invest in floating rate securities issued by special purpose trusts. Floating rate securities may take the form of short-term floating rate securities or the
option period may be substantially longer. Generally, the interest rate earned will be based upon the market rates for municipal securities with maturities or remarketing provisions that are comparable in duration to the periodic interval of the
tender option, which may vary from weekly, to monthly, to extended periods of one year or multiple years. Since the option feature has a shorter term than the final maturity or first call date of the underlying bond deposited in the trust, the Fund
as the holder of the floating rate security relies upon the terms of the agreement with the financial institution furnishing the option as well as the credit strength of that institution. As further assurance of liquidity, the terms of the trust
provide for a liquidation of the municipal security deposited in the trust and the application of the proceeds to pay off the floating rate security. The trusts that are organized to issue both short-term floating rate securities and
inverse floaters generally include liquidation triggers to protect the investor in the floating rate security.
The Fund may invest in zero coupon bonds. A zero
coupon bond is a bond that typically does not pay interest for the entire life of the obligation or for an initial period after the issuance of the obligation.
The
Fund may buy and sell securities on a when-issued or delayed delivery basis, making payment or taking delivery at a later date, normally within 15 to 45 days of the trade date.
The Fund may invest in illiquid securities (i.e., securities that are not readily marketable), including, but not limited to, restricted securities (securities the
disposition of which is restricted under the federal securities laws), securities that may be resold only pursuant to Rule 144A under the 1933 Act, and repurchase agreements with maturities in excess of seven days.
The Fund may enter into certain derivative instruments in pursuit of its investment objectives, including to seek to enhance return, to hedge certain risks of its
investments in municipal securities or as a substitute for a position in the underlying asset. Such instruments include financial futures contracts, swap contracts (including interest rate swaps, credit default swaps and MMD Rate Locks), options on
financial futures, options on swap contracts or other derivative instruments.
The Fund may purchase and sell MMD Rate Locks. An MMD Rate Lock permits the Fund to
lock in a specified municipal interest rate for a portion of its portfolio to preserve a return on a particular investment or a portion of its portfolio as a duration management technique or to protect against any increase in the price of securities
to be purchased at a later date. By using an MMD Rate Lock, the Fund can create a synthetic long or short position, allowing the Fund to select what the manager believes is an attractive part of the yield curve. The Fund will ordinarily use these
transactions as a hedge or for duration or risk management although it is permitted to enter into them to enhance income or gain or to increase the Fund’s yield, for example, during periods of steep interest rate yield curves (i.e., wide
differences between short term and long term interest rates).
The Fund may also invest in securities of other open-
or closed-end investment companies (including ETFs) that invest primarily in municipal securities of the types in which the Fund may invest directly, to the extent permitted by the 1940 Act, the
rules and regulations issued thereunder and applicable exemptive orders issued by the SEC.
Use of Leverage
As a fundamental policy, the Fund will not leverage its capital structure by issuing senior securities such as Preferred Shares or debt instruments. However, the Fund may
borrow for temporary or emergency purposes and invest in certain instruments, including inverse floating rate securities that have the economic effect of leverage. The Fund may source leverage through investments in inverse floating rate securities,
which have the economic effect of leverage. The amount of leverage will vary depending on market conditions.
Temporary Defensive Periods
During temporary defensive periods (e.g., times when, in the Fund’s investment adviser’s and/or the Fund’s
sub-adviser’s opinion, temporary imbalances of supply and demand or other temporary dislocations in the tax-exempt bond market adversely affect the
price at which long-term or intermediate-term municipal securities are available), and in order to keep the Fund’s cash fully invested, the Fund may up to 100% of its Managed Assets in short-term investments including high quality, short-term
debt securities that may be either tax-exempt or taxable. The Fund may not achieve its investment objectives during such periods.
97
Shareholder Update (Unaudited) (continued)
NUVEEN MUNICIPAL INCOME FUND, INC. (NMI)
Investment Objective
The Fund’s investment objective is a high level of current income exempt from federal income tax, which the Fund seeks to achieve by investing
primarily in a diversified portfolio of tax-exempt municipal obligations.
Investment Policies
Under normal circumstances, the Fund will invest at least 80% of its Assets (as defined below) in municipal securities and other related investments, the income from
which is exempt from regular federal income taxes.
“Assets” mean the net assets of the Fund plus the amount of any borrowings for investment purposes.
“Managed Assets” means the total assets of the Fund, minus the sum of its accrued liabilities (other than Fund liabilities incurred for the express purpose of creating leverage). Total assets for this purpose shall include assets
attributable to the Fund’s use of leverage (whether or not those assets are reflected in the Fund’s financial statements for purposes of generally accepted accounting principles), and derivatives will be valued at their market value.
Under normal circumstances:
| |
● |
|
The Fund may invest up to 20% of its Managed Assets in municipal securities that pay interest that is taxable under the
federal alternative minimum tax. |
| |
● |
|
The Fund may invest up to 75% of its Managed Assets in municipal securities that are rated BBB/Baa or lower by at least one
NRSRO or are unrated but judged to be of comparable quality by the Fund’s sub-adviser. The Fund may not invest more than 10% of its Managed Assets in municipal securities rated below B3/B- by any NRSROs that rate the security or that are unrated but judged to be of comparable quality by the Fund’s sub-adviser. |
| |
● |
|
The Fund may invest in the securities of an issuer which, at the time of investment, is in default on its obligations to pay
principal or interest thereon when due or that is involved in a bankruptcy proceeding (i.e., rated below C- at the time of investment) (“defaulted securities”), and may invest in municipal securities
that are experiencing other financial difficulties at the time of acquisition (such securities are commonly referred to as distressed securities). The Fund’s sub-adviser may determine that it is in the
best interest of shareholders in pursuing a workout arrangement with issuers of defaulted securities to make loans to the defaulted issuer or another party, or purchase a debt, equity or other interest from the defaulted issuer or another party, or
take other related or similar steps involving the investment of additional monies. |
| |
● |
|
The Fund may invest up to 25% of its Managed Assets in municipal securities in any one industry or in any one state of
origin. |
| |
● |
|
The Fund may invest up to 15% of its Managed Assets in inverse floating rate securities. |
| |
● |
|
The Fund may not enter into a futures contract or related options or forward contracts if more than 30% of the Fund’s
Managed Assets would be represented by futures contracts or more than 5% of the Fund’s Managed Assets would be committed to initial margin deposits and premiums on futures contracts or related options. |
| |
● |
|
The Fund will generally maintain an investment portfolio with an overall weighted average maturity of greater than 10 years.
|
The foregoing policies apply only at the time of any new investment. The credit quality policies noted above apply only at the time of the purchase
of a security, and the Fund is not required to dispose of a security in the event Moody’s, S&P or Fitch downgrades its assessment of the credit characteristics of a particular issuer, even if such downgrade causes the portfolio to exceed
the 75% or 10% thresholds noted above. If at any time the Fund exceeds either the 75% or 10% threshold noted above, the Fund’s future investments will be made in a manner that will bring the Fund’s portfolio back into compliance with these
policies.
Approving Changes in Investment Policies
The Board of Trustees
of the Fund may change the policies described above without a shareholder vote. However, with respect to the Fund’s policy of investing at least 80% of its Assets in municipal securities and other related investments, the income from which is
exempt from regular federal income taxes, such policy may not be changed without 60 days’ prior written notice and the approval of the holders of a majority of the outstanding common shares and preferred shares voting together as a single
class, and the approval of the holders of a majority of the outstanding preferred shares, voting separately as a single class. A “majority of the outstanding” shares means (i) 67% or more of the shares present at a meeting, if the holders
of more than 50% of the shares are present or represented by proxy or (ii) more than 50% of the shares, whichever is less.
Portfolio Contents
The Fund generally invests in municipal securities. Municipal securities include municipal bonds, notes, securities issued to finance and refinance public projects,
certificates of participation, variable rate demand obligations, lease obligations, municipal notes, pre-refunded municipal bonds, private activity bonds, securities issued by TOB Trusts, including inverse
floating rate securities, and other forms of municipal bonds and securities, and other related instruments that create exposure to municipal bonds, notes and securities that provide for the payment of interest income that is exempt from regular U.S.
federal income tax.
Municipal securities are debt obligations generally issued by states, cities and local authorities and certain possessions and territories of the
United States (such as Puerto Rico and Guam) to finance or refinance public purpose projects such as roads, schools, and water supply systems.
98
The Fund may invest in municipal securities that are additionally secured by insurance, bank credit agreements or escrow accounts.
The Fund may also invest in AMT Bonds. AMT Bonds may trigger adverse tax consequences for Fund shareholders who are subject to the federal alternative minimum tax.
The Fund may invest a significant portion of its Managed Assets in certain sectors of the municipal securities market, such as hospitals and other health care facilities,
charter schools and other private educational facilities, special taxing districts and start-up utility districts, and private activity bonds including industrial development bonds on behalf of
transportation companies such as airline companies, whose credit quality and performance may be more susceptible to economic, business, political, regulatory and other developments than other sectors of municipal issuers.
The Fund may invest in municipal securities that represent lease obligations and certificates of participation in such leases. A municipal lease is an obligation in the
form of a lease or installment purchase that is issued by a state or local government to acquire equipment and facilities. Income from such obligations generally is exempt from state and local taxes in the state of issuance. A certificate of
participation represents an undivided interest in an unmanaged pool of municipal leases, an installment purchase agreement or other instruments. The certificates typically are issued by a municipal agency, a trust or other entity that has received
an assignment of the payments to be made by the state or political subdivision under such leases or installment purchase agreements. Such certificates provide the Fund with the right to a pro rata undivided interest in the underlying municipal
securities. In addition, such participations generally provide the Fund with the right to demand payment, on not more than seven days’ notice, of all or any part of the Fund’s participation interest in the underlying municipal securities,
plus accrued interest.
The Fund may invest in municipal notes. Municipal securities in the form of notes generally are used to provide for short-term capital needs,
in anticipation of an issuer’s receipt of other revenues or financing, and typically have maturities of up to three years. Such instruments may include tax anticipation notes, revenue anticipation notes, bond anticipation notes, tax and revenue
anticipation notes and construction loan notes. Tax anticipation notes are issued to finance the working capital needs of governments. Generally, they are issued in anticipation of various tax revenues, such as income, sales, property, use and
business taxes, and are payable from these specific future taxes. Revenue anticipation notes are issued in expectation of receipt of other kinds of revenue, such as federal revenues available under federal revenue sharing programs. Bond anticipation
notes are issued to provide interim financing until long-term bond financing can be arranged. In most cases, the long-term bonds then provide the funds needed for repayment of the bond anticipation notes. Tax and revenue anticipation notes combine
the funding sources of both tax anticipation notes and revenue anticipation notes. Construction loan notes are sold to provide construction financing. Mortgage notes insured by the Federal Housing Authority secure these notes; however, the proceeds
from the insurance may be less than the economic equivalent of the payment of principal and interest on the mortgage note if there has been a default. The anticipated revenues from taxes, grants or bond financing generally secure the obligations of
an issuer of municipal notes.
The Fund may invest in “tobacco settlement bonds.” Tobacco settlement bonds are municipal securities that are secured or
payable solely from the collateralization of the proceeds from class action or other litigation against the tobacco industry.
The Fund may invest in pre-refunded municipal securities. The principal of and interest on pre-refunded municipal securities are no longer paid from the original revenue source for the
securities. Instead, the source of such payments is typically an escrow fund consisting of U.S. government securities. The assets in the escrow fund are derived from the proceeds of refunding bonds issued by the same issuer as the pre-refunded municipal securities. Issuers of municipal securities use this advance refunding technique to obtain more favorable terms with respect to securities that are not yet subject to call or
redemption by the issuer. For example, advance refunding enables an issuer to refinance debt at lower market interest rates, restructure debt to improve cash flow or eliminate restrictive covenants in the indenture or other governing instrument for the pre-refunded municipal securities. However, except for a change in the revenue source from which principal and interest payments are made,
the pre-refunded municipal securities remain outstanding on their original terms until they mature or are redeemed by the issuer.
The Fund may invest in private activity bonds. Private activity bonds are issued by or on behalf of public authorities to obtain funds to provide privately operated
housing facilities, airport, mass transit or port facilities, sewage disposal, solid waste disposal or hazardous waste treatment or disposal facilities and certain local facilities for water supply, gas or electricity. Other types of private
activity bonds, the proceeds of which are used for the construction, equipment, repair or improvement of privately operated industrial or commercial facilities, may constitute municipal securities, although the current federal tax laws place
substantial limitations on the size of such issues.
The Fund may invest in municipal securities issued by special taxing districts. Special taxing districts are
organized to plan and finance infrastructure developments to induce residential, commercial and industrial growth and redevelopment. The bond financing methods such as tax increment finance, tax assessment, special services district and Mello-Roos
bonds, are generally payable solely from taxes or other revenues attributable to the specific projects financed by the bonds without recourse to the credit or taxing power of related or overlapping municipalities.
The Fund may invest in inverse floating rate securities issued by a TOB trust, the interest rate on which varies inversely with the Securities Industry Financial Markets
Association short-term rate, which resets weekly, or a similar short-term rate, and is reduced by the expenses related to the TOB trust. Typically, inverse floating rate securities represent beneficial interests in a special purpose trust (sometimes
called a TOB trust) formed by a third party sponsor for the purpose of holding municipal bonds. Inverse floating rate securities may increase or decrease in value at a greater rate than the underlying interest rate on the municipal bond held by the
TOB trust, which effectively leverages the Fund’s investment.
The Fund may invest in floating rate securities issued by special purpose trusts. Floating rate
securities may take the form of short-term floating rate securities or the option period may be substantially longer. Generally, the interest rate earned will be based upon the market rates for municipal securities with maturities or remarketing
provisions that are comparable in duration to the periodic interval of the tender option, which may vary from weekly, to monthly, to extended periods of one year or multiple years. Since the option feature has a shorter term than the final maturity
or first call date of the underlying bond deposited in the trust, the Fund as the holder of the floating rate security relies upon the terms of the agreement with the financial institution furnishing the option as well as the credit strength of that
institution. As further assurance of liquidity, the terms of the trust
99
Shareholder Update (Unaudited) (continued)
provide for a liquidation of the municipal security deposited in the trust and the application of the proceeds to pay off the floating rate security. The trusts that are
organized to issue both short-term floating rate securities and inverse floaters generally include liquidation triggers to protect the investor in the floating rate security.
The Fund may invest in zero coupon bonds. A zero coupon bond is a bond that typically does not pay interest for the entire life of the obligation or for an initial period
after the issuance of the obligation.
The Fund may buy and sell securities on a when-issued or delayed delivery basis, making payment or taking delivery at a later
date, normally within 15 to 45 days of the trade date.
The Fund may invest in illiquid securities (i.e., securities that are not readily marketable), including, but
not limited to, restricted securities (securities the disposition of which is restricted under the federal securities laws), securities that may be resold only pursuant to Rule 144A under the 1933 Act, and repurchase agreements with maturities in
excess of seven days.
The Fund may enter into certain derivative instruments in pursuit of its investment objective, including to seek to enhance return, to hedge
certain risks of its investments in municipal securities or as a substitute for a position in the underlying asset. Such instruments include financial futures contracts, swap contracts (including interest rate swaps, credit default swaps and MMD
Rate Locks), options on financial futures, options on swap contracts, or other derivative instruments.
The Fund may purchase and sell MMD Rate Locks. An MMD Rate
Lock permits the Fund to lock in a specified municipal interest rate for a portion of its portfolio to preserve a return on a particular investment or a portion of its portfolio as a duration management technique or to protect against any increase
in the price of securities to be purchased at a later date. By using an MMD Rate Lock, the Fund can create a synthetic long or short position, allowing the Fund to select what the manager believes is an attractive part of the yield curve. The Fund
will ordinarily use these transactions as a hedge or for duration or risk management although it is permitted to enter into them to enhance income or gain or to increase the Fund’s yield, for example, during periods of steep interest rate yield
curves (i.e., wide differences between short term and long term interest rates).
The Fund may also invest in securities of other open-
or closed-end investment companies (including ETFs) that invest primarily in municipal securities of the types in which the Fund may invest directly, to the extent permitted by the 1940 Act, the
rules and regulations issued thereunder and applicable exemptive orders issued by the SEC.
Use of Leverage
As a fundamental policy, the Fund will not leverage its capital structure by issuing senior securities such as Preferred Shares or debt instruments. However, the Fund may
borrow for temporary or emergency purposes and invest in certain instruments, including inverse floating rate securities that have the economic effect of leverage. The Fund may source leverage through investments in inverse floating rate securities,
which have the economic effect of leverage. The amount of leverage will vary depending on market conditions.
Temporary Defensive Periods
During temporary defensive periods (e.g., times when, in the Fund’s investment adviser’s and/or the Fund’s
sub-adviser’s opinion, temporary imbalances of supply and demand or other temporary dislocations in the tax-exempt bond market adversely affect the
price at which long-term or intermediate-term municipal securities are available), and in order to keep the Fund’s cash fully invested, the Fund may invest up to 100% of its Managed Assets in short-term investments including high quality,
short-term debt securities that may be either tax-exempt or taxable. The Fund may not achieve its investment objectives during such periods.
100
PRINCIPAL RISKS OF THE FUNDS
The factors that are most likely to have a
material effect on a particular Fund’s portfolio as a whole are called “principal risks.” Each Fund is subject to the principal risks indicated below, whether through direct investment or derivative positions. Each Fund may be subject
to additional risks other than those identified and described below because the types of investments made by a Fund can change over time.
|
|
|
|
|
|
|
| Risk |
|
Nuveen Municipal
Value Fund, Inc. (NUV) |
|
Nuveen
AMT-Free
Municipal Value Fund
(NUW) |
|
Nuveen Municipal
Income Fund, Inc. (NMI) |
|
|
|
|
| Portfolio Level Risks |
|
|
|
|
|
|
| Alternative Minimum Tax Risk |
|
X |
|
– |
|
X |
| Below Investment Grade Risk |
|
X |
|
X |
|
X |
| Call Risk |
|
X |
|
X |
|
X |
| Credit Risk |
|
X |
|
X |
|
X |
| Credit Spread Risk |
|
X |
|
X |
|
X |
| Distressed or Defaulted Securities Risk |
|
X |
|
X |
|
X |
| Deflation Risk |
|
X |
|
X |
|
X |
| Derivatives Risk |
|
X |
|
X |
|
X |
| Duration Risk |
|
X |
|
X |
|
X |
| Economic Sector Risk |
|
X |
|
X |
|
X |
| Financial Futures and Options Risk |
|
X |
|
X |
|
X |
| Hedging Risk |
|
X |
|
X |
|
X |
| Illiquid Investments Risk |
|
X |
|
X |
|
X |
| Income Risk |
|
X |
|
X |
|
X |
| Inflation Risk |
|
X |
|
X |
|
X |
| Insurance Risk |
|
X |
|
X |
|
X |
| Interest Rate Risk |
|
X |
|
X |
|
X |
| Inverse Floating Rate Securities Risk |
|
X |
|
X |
|
X |
| Municipal Securities Market Liquidity Risk |
|
X |
|
X |
|
X |
| Municipal Securities Market Risk |
|
X |
|
X |
|
X |
| Other Investment Companies Risk |
|
X |
|
X |
|
X |
| Puerto Rico Municipal Securities Market Risk |
|
X |
|
X |
|
X |
| Reinvestment Risk |
|
X |
|
X |
|
X |
| Special Risks Related to Certain Municipal Obligations |
|
X |
|
X |
|
X |
| Swap Transactions Risk |
|
X |
|
X |
|
X |
| Tax Risk |
|
X |
|
X |
|
X |
| Taxability Risk |
|
X |
|
X |
|
X |
| Tobacco Settlement Bond Risk |
|
X |
|
X |
|
X |
| Unrated Securities Risk |
|
X |
|
X |
|
X |
| Valuation Risk |
|
X |
|
X |
|
X |
| Zero Coupon Bonds Risk |
|
X |
|
X |
|
X |
101
Shareholder Update (Unaudited) (continued)
|
|
|
|
|
|
|
| Risk |
|
Nuveen Municipal
Value Fund, Inc. (NUV) |
|
Nuveen
AMT-Free
Municipal Value Fund
(NUW) |
|
Nuveen Municipal
Income Fund, Inc. (NMI) |
|
|
|
|
| Fund Level and Other Risks |
|
|
|
|
|
|
| Anti-Takeover Provisions |
|
X |
|
X |
|
X |
| Counterparty Risk |
|
X |
|
X |
|
X |
| Cybersecurity Risk |
|
X |
|
X |
|
X |
| Economic and Political Events Risk |
|
X |
|
X |
|
X |
| Fund Tax Risk |
|
X |
|
X |
|
X |
| Global Economic Risk |
|
X |
|
X |
|
X |
| Investment and Market Risk |
|
X |
|
X |
|
X |
| Legislation and Regulatory Risk |
|
X |
|
X |
|
X |
| Leverage Risk |
|
X |
|
X |
|
X |
| Market Discount from Net Asset Value |
|
X |
|
X |
|
X |
| Recent Market Conditions |
|
X |
|
X |
|
X |
102
Portfolio Level Risks:
Alternative Minimum Tax Risk. The
Fund may invest in AMT Bonds. Therefore, a portion of the Fund’s otherwise exempt-interest dividends may be taxable to those shareholders subject to the federal alternative minimum tax.
Below Investment Grade Risk. Investments of below investment grade quality are regarded as having speculative characteristics with respect to the issuer’s
capacity to pay dividends or interest and repay principal, and may be subject to higher price volatility and default risk than investment grade investments of comparable terms and duration. Issuers of lower grade investments may be highly leveraged
and may not have available to them more traditional methods of financing. The prices of these lower grade investments are typically more sensitive to negative developments, such as a decline in the issuer’s revenues or a general economic
downturn. The secondary market for lower rated investments may not be as liquid as the secondary market for more highly rated investments, a factor which may have an adverse effect on the Fund’s ability to dispose of a particular investment. If
a below investment grade security goes into default, or its issuer enters bankruptcy, it might be difficult to sell that security in a timely manner at a reasonable price.
Call Risk. The Fund may invest in municipal securities that are subject to call risk. Such municipal securities may be redeemed at the option of the issuer,
or “called,” before their stated maturity or redemption date. In general, an issuer will call its instruments if they can be refinanced by issuing new instruments that bear a lower interest rate. The Fund is subject to the possibility that
during periods of falling interest rates, an issuer will call its high yielding municipal securities. The Fund would then be forced to invest the unanticipated proceeds at lower interest rates, resulting in a decline in the Fund’s income.
Credit Risk. Issuers of municipal securities in which the Fund may invest may default on their obligations to pay principal or interest when due. This non-payment would result in a reduction of income to the Fund, a reduction in the value of a municipal security experiencing non-payment and potentially a decrease in the net
asset value (“NAV”) of the Fund. To the extent that the credit rating assigned to a municipal security in the Fund’s portfolio is downgraded, the market price and liquidity of such security may be adversely affected.
Credit Spread Risk. Credit spread risk is the risk that credit spreads (i.e., the difference in yield between securities that is due to differences in their
credit quality) may increase when the market believes that municipal securities generally have a greater risk of default. Increasing credit spreads may reduce the market values of the Fund’s securities. Credit spreads often increase more for
lower rated and unrated securities than for investment grade securities. In addition, when credit spreads increase, reductions in market value will generally be greater for longer-maturity securities.
Distressed or Defaulted Securities Risk. Investments in “distressed” securities, meaning those whose issuers are experiencing financial difficulties or
distress at the time of acquisition, present a substantial risk of future default. In the event distressed securities become defaulted securities or the Fund otherwise holds defaulted securities, the Fund may incur losses, including additional
expenses, to the extent it is required to seek recovery upon a default in the payment of principal or interest on those securities. In any reorganization or liquidation proceeding relating to a portfolio security, the Fund may lose its entire
investment or may be required to accept cash or securities with a value less than its original investment. Defaulted or distressed securities may be subject to restrictions on resale.
Deflation Risk. Deflation risk is the risk that prices throughout the economy decline over time. Deflation may have an adverse effect on the creditworthiness of
issuers and may make issuer default more likely, which may result in a decline in the value of the Fund’s portfolio.
Derivatives Risk. The use of
derivatives involves additional risks and transaction costs which could leave the Fund in a worse position than if it had not used these instruments. Derivative instruments can be used to acquire or to transfer the risk and returns of a municipal
security or other asset without buying or selling the municipal security or asset. These instruments may entail investment exposures that are greater than their cost would suggest. As a result, a small investment in derivatives can result in losses
that greatly exceed the original investment. Derivatives can be highly volatile, illiquid and difficult to value. An over-the-counter derivative transaction between the
Fund and a counterparty that is not cleared through a central counterparty also involves the risk that a loss may be sustained as a result of the failure of the counterparty to the contract to make required payments. The payment obligation for a
cleared derivative transaction is guaranteed by a central counterparty, which exposes the Fund to the creditworthiness of the central counterparty. The use of certain derivatives involves leverage, which can cause the Fund’s portfolio to be
more volatile than if the portfolio had not been leveraged. Leverage can significantly magnify the effect of price movements of the reference asset, disproportionately increasing the Fund’s losses and reducing the Fund’s opportunities for
gains when the reference asset changes in unexpected ways. In some instances, such leverage could result in losses that exceed the original amount invested.
It is
possible that regulatory or other developments in the derivatives market, including changes in government regulation, could adversely impact the Fund’s ability successfully use derivative instruments.
Duration Risk. Duration is the sensitivity, expressed in years, of the price of a fixed-income security to changes in the general level of interest rates
(or yields). Securities with longer durations tend to be more sensitive to interest rate (or yield) changes, which typically corresponds to increased volatility and risk, than securities with shorter durations. For example, if a security or
portfolio has a duration of three years and interest rates increase by 1%, then the security or portfolio would decline in value by approximately 3%. Duration differs from maturity in that it considers potential changes to interest rates, and a
security’s coupon payments, yield, price and par value and call features, in addition to the amount of time until the security matures. The duration of a security will be expected to change over time with changes in market factors and time to
maturity.
Economic Sector Risk. The Fund may invest a significant amount of its total assets in municipal securities in the same economic sector. This may
make the Fund more susceptible to adverse economic, political or regulatory occurrences affecting an economic sector making the Fund more vulnerable to unfavorable developments in that sector than funds that invest more broadly. As the percentage of
the Fund’s Managed Assets invested in a particular sector increases, so does the potential for fluctuation in the value of the Fund’s assets. In addition, the Fund may invest a significant portion of its assets in certain sectors of the
municipal securities market, such as health care facilities, private educational facilities, special taxing
103
Shareholder Update (Unaudited) (continued)
districts and start-up utility districts, and private activity bonds including industrial development bonds on behalf of
transportation companies, whose credit quality and performance may be more susceptible to economic, business, political, regulatory and other developments than other sectors of municipal issuers. If the Fund invests a significant portion of its
assets in one or more particular sectors, the Fund’s performance may be subject to additional risk and variability.
Financial Futures and Options
Transactions Risk. The Fund may use certain transactions for hedging the portfolio’s exposure to credit risk and the risk of increases in interest rates, which could result in poorer overall performance for the Fund. There may be an
imperfect correlation between price movements of the futures and options and price movements of the portfolio securities being hedged.
If the Fund engages in futures
transactions or in the writing of options on futures, it will be required to maintain initial margin and maintenance margin and may be required to make daily variation margin payments in accordance with applicable rules of the exchanges and the
Commodity Futures Trading Commission (“CFTC”). If the Fund purchases a financial futures contract or a call option or writes a put option in order to hedge the anticipated purchase of municipal securities, and if the Fund fails to complete
the anticipated purchase transaction, the Fund may have a loss or a gain on the futures or options transaction that will not be offset by price movements in the municipal securities that were the subject of the anticipatory hedge. There can be no
assurance that a liquid market will exist at a time when the Fund seeks to close out a derivatives or futures or a futures option position, and the Fund would remain obligated to meet margin requirements until the position is closed.
Hedging Risk. The Fund’s use of derivatives or other transactions to reduce risk involves costs and will be subject to the investment adviser’s
and/or the sub-adviser’s ability to predict correctly changes in the relationships of such hedge instruments to the Fund’s portfolio holdings or other factors. No assurance can be given that the
investment adviser’s and/or the sub-adviser’s judgment in this respect will be correct, and no assurance can be given that the Fund will enter into hedging or other transactions at times or under
circumstances in which it may be advisable to do so. Hedging activities may reduce the Fund’s opportunities for gain by offsetting the positive effects of favorable price movements and may result in net losses.
Income Risk. The Fund’s income could decline due to falling market interest rates. This is because, in a falling interest rate environment, the Fund generally
will have to invest the proceeds from maturing portfolio securities in lower-yielding securities.
Illiquid Investments Risk. Illiquid investments are
investments that are not readily marketable. These investments may include restricted investments, including Rule 144A securities, which cannot be resold to the public without an effective registration statement under the 1933 Act, or, if they are
unregistered may be sold only in a privately negotiated transaction or pursuant to an available exemption from registration. The Fund may not be able to readily dispose of such investments at prices that approximate those at which the Fund could
sell such investments if they were more widely traded and, as a result of such illiquidity, the Fund may have to sell other investments or engage in borrowing transactions if necessary to raise cash to meet its obligations. Limited liquidity can
also affect the market price of investments, thereby adversely affecting the Fund’s NAV and ability to make dividend distributions. The financial markets in general have in recent years experienced periods of extreme secondary market supply and
demand imbalance, resulting in a loss of liquidity during which market prices were suddenly and substantially below traditional measures of intrinsic value. During such periods, some investments could be sold only at arbitrary prices and with
substantial losses. Periods of such market dislocation may occur again at any time.
Inflation Risk. Inflation risk is the risk that the value of assets or
income from investments will be worth less in the future as inflation decreases the value of money. As inflation increases, the real value of the common shares and distributions can decline. Currently, inflation rates are elevated relative to normal
market conditions and could increase.
Insurance Risk. The Fund may purchase municipal securities that are secured by insurance, bank credit agreements or
escrow accounts. The credit quality of the companies that provide such credit enhancements will affect the value of those securities. Certain significant providers of insurance for municipal securities have incurred significant losses as a result of
exposure to sub-prime mortgages and other lower credit quality investments. As a result, such losses reduced the insurers’ capital and called into question their continued ability to perform their
obligations under such insurance if they are called upon to do so in the future. While an insured municipal security will typically be deemed to have the rating of its insurer, if the insurer of a municipal security suffers a downgrade in its credit
rating or the market discounts the value of the insurance provided by the insurer, the value of the municipal security would more closely, if not entirely, reflect such rating. In such a case, the value of insurance associated with a municipal
security may not add any value. The insurance feature of a municipal security does not guarantee the full payment of principal and interest through the life of an insured obligation, the market value of the insured obligation or the NAV of the
common shares represented by such insured obligation.
Interest Rate Risk. Interest rate risk is the risk that municipal securities in the Fund’s
portfolio will decline in value because of changes in market interest rates. Generally, when market interest rates rise, the market value of such securities will fall, and vice versa. As interest rates decline, issuers of municipal securities may
prepay principal earlier than scheduled, forcing the Fund to reinvest in lower-yielding securities and potentially reducing the Fund’s income. As interest rates increase, slower than expected principal payments may extend the average life of
municipal securities, potentially locking in a below-market interest rate and reducing the Fund’s value. In typical market interest rate environments, the prices of longer-term municipal securities generally fluctuate more than prices of
shorter-term municipal securities as interest rates change.
Inverse Floating Rate Securities Risk. The Fund may invest in inverse floating rate securities. In
general, income on inverse floating rate securities will decrease when short-term interest rates increase and increase when short-term interest rates decrease. Investments in inverse floating rate securities may subject the Fund to the risks of
reduced or eliminated interest payments and losses of principal. In addition, inverse floating rate securities may increase or decrease in value at a greater rate than the underlying interest rate, which effectively leverages the Fund’s
investment. As a result, the market value of such securities generally will be more volatile than that of fixed rate securities.
The Fund may invest in inverse
floating rate securities issued by special purpose trusts that have recourse to the Fund. In such instances, the Fund may be at risk of loss that exceeds its investment in the inverse floating rate securities.
104
The Fund may be required to sell its inverse floating rate securities at less than favorable prices, or liquidate other Fund portfolio holdings in certain circumstances,
including, but not limited to, the following:
| |
· |
|
If the Fund has a need for cash and the securities in a special purpose trust are not actively trading due to adverse market
conditions; |
| |
· |
|
If special purpose trust sponsors (as a collective group or individually) experience financial hardship and consequently
seek to terminate their respective outstanding special purpose trusts; and |
| |
· |
|
If the value of an underlying security declines significantly and if additional collateral has not been posted by the Fund.
|
Municipal Securities Market Liquidity Risk. Inventories of municipal securities held by brokers and dealers have decreased in recent years,
lessening their ability to make a market in these securities. This reduction in market making capacity has the potential to decrease the Fund’s ability to buy or sell municipal securities at attractive prices, and increase municipal security
price volatility and trading costs, particularly during periods of economic or market stress. In addition, recent federal banking regulations may cause certain dealers to reduce their inventories of municipal securities, which may further decrease
the Fund’s ability to buy or sell municipal securities. As a result, the Fund may be forced to accept a lower price to sell a security, to sell other securities to raise cash, or to give up an investment opportunity, any of which could have a
negative effect on performance. If the Fund needed to sell large blocks of municipal securities to raise cash to meet its obligations, those sales could further reduce the municipal securities’ prices and hurt performance.
Municipal Securities Market Risk. The amount of public information available about the municipal securities in the Fund’s portfolio is generally less than
that for corporate equities or bonds, and the investment performance of the Fund may therefore be more dependent on the analytical abilities of the sub-adviser than if the Fund were a stock fund or taxable
bond fund. The secondary market for municipal securities, particularly below investment grade municipal securities, also tends to be less well-developed or liquid than many other securities markets, which may adversely affect the Fund’s ability
to sell its municipal securities at attractive prices.
Other Investment Companies Risk. The Fund may invest in the securities of other
investment companies, including ETFs. Investing in an investment company exposes the Fund to all of the risks of that investment company’s investments. The Fund, as a holder of the securities of other investment companies, will bear its pro
rata portion of the other investment companies’ expenses, including advisory fees. These expenses are in addition to the direct expenses of the Fund’s own operations. As a result, the cost of investing in investment company shares may
exceed the costs of investing directly in its underlying investments. In addition, securities of other investment companies may be leveraged. As a result, the Fund may be indirectly exposed to leverage through an investment in such securities and
therefore magnify the Fund’s leverage risk.
With respect to ETF’s, an ETF that is based on a specific index may not be able to replicate and maintain
exactly the composition and relative weighting of securities in the index. The value of an ETF based on a specific index is subject to change as the values of its respective component assets fluctuate according to market volatility. ETFs typically
rely on a limited pool of authorized participants to create and redeem shares, and an active trading market for ETF shares may not develop or be maintained. The market value of shares of ETFs and closed-end
funds may differ from their NAV.
Puerto Rico Municipal Securities Market Risk. To the extent that the Fund invests a significant portion of its assets in the
securities issued by the Commonwealth of Puerto Rico or its political subdivisions, agencies, instrumentalities, or public corporations (collectively referred to as “Puerto Rico” or the “Commonwealth”), it will be
disproportionally affected by political, social and economic conditions and developments in the Commonwealth. In addition, economic, political or regulatory changes in that territory could adversely affect the value of the Fund’s investment
portfolio.
Puerto Rico currently is experiencing significant fiscal and economic challenges, including substantial debt service obligations, high levels of
unemployment, underfunded public retirement systems, and persistent government budget deficits. These challenges may negatively affect the value of the Fund’s investments in Puerto Rican municipal securities. Several major ratings agencies have
downgraded the general obligation debt of Puerto Rico to below investment grade and continue to maintain a negative outlook for this debt, which increases the likelihood that the rating will be lowered further. Puerto Rico recently defaulted on its
debt by failing to make full payment due on its outstanding bonds, and there can be no assurance that Puerto Rico will be able to satisfy its future debt obligations. Further downgrades or defaults may place additional strain on the Puerto Rico
economy and may negatively affect the value, liquidity, and volatility of the Fund’s investments in Puerto Rican municipal securities. Additionally, numerous issuers have entered Title III of the Puerto Rico Oversite, Management and Economic
Stability Act (“PROMESA”), which is similar to bankruptcy protection, through which the Commonwealth of Puerto Rico can restructure its debt. However, Puerto Rico’s case is the first ever heard under PROMESA and there is no existing
case precedent to guide the proceedings. Accordingly, Puerto Rico’s debt restructuring process could take significantly longer than traditional municipal bankruptcy proceedings. Further, it is not clear whether a debt restructuring process will
ultimately be approved or, if so, the extent to which it will apply to Puerto Rico municipal securities sold by an issuer other than the territory. A debt restructuring could reduce the principal amount due, the interest rate, the maturity, and
other terms of Puerto Rico municipal securities, which could adversely affect the value of Puerto Rican municipal securities. Legislation that would allow Puerto Rico to restructure its municipal debt obligations, thus increasing the risk that
Puerto Rico may never pay off municipal indebtedness, or may pay only a small fraction of the amount owed, could also impact the value of the Fund’s investments in Puerto Rican municipal securities.
These challenges and uncertainties have been exacerbated by multiple hurricanes and the resulting natural disasters that have stuck Puerto Rico since 2017. The full
extent of the natural disasters’ impact on Puerto Rico’s economy and foreign investment in Puerto Rico is difficult to estimate.
Reinvestment Risk.
Reinvestment risk is the risk that income from the Fund’s portfolio will decline if and when the Fund invests the proceeds from matured, traded or called municipal securities at market interest rates that are below the portfolio’s current
earnings rate. A decline in income could affect the common shares’ market price, NAV and/or a common shareholder’s overall returns.
105
Shareholder Update (Unaudited) (continued)
Special Risks Related to Certain Municipal Obligations. Municipal leases and certificates of participation involve special risks not normally associated with
general obligations or revenue bonds. Leases and installment purchase or conditional sale contracts (which normally provide for title to the leased asset to pass eventually to the governmental issuer) have evolved as a means for governmental issuers
to acquire property and equipment without meeting the constitutional and statutory requirements for the issuance of debt. The debt issuance limitations are deemed to be inapplicable because of the inclusion in many leases or contracts of “non-appropriation” clauses that relieve the governmental issuer of any obligation to make future payments under the lease or contract unless money is appropriated for such purpose by the appropriate
legislative body. In addition, such leases or contracts may be subject to the temporary abatement of payments in the event that the governmental issuer is prevented from maintaining occupancy of the leased premises or utilizing the leased equipment.
Although the obligations may be secured by the leased equipment or facilities, the disposition of the property in the event of non-appropriation or foreclosure might prove difficult, time consuming and costly,
and may result in a delay in recovering or the failure to fully recover the Fund’s original investment. In the event of non-appropriation, the issuer would be in default and taking ownership of the assets
may be a remedy available to the Fund, although the Fund does not anticipate that such a remedy would normally be pursued.
Certificates of participation involve the
same risks as the underlying municipal leases. In addition, the Fund may be dependent upon the municipal authority issuing the certificates of participation to exercise remedies with respect to the underlying securities. Certificates of
participation also entail a risk of default or bankruptcy, both of the issuer of the municipal lease and also the municipal agency issuing the certificate of participation.
Swap Transactions Risk. The Fund may enter into debt-related derivative instruments such as credit default swap contracts and interest rate swaps. Like most
derivative instruments, the use of swaps is a highly specialized activity that involves investment techniques and risks different from those associated with ordinary portfolio securities transactions. In addition, the use of swaps requires an
understanding by the adviser and/or the sub-adviser of not only the referenced asset, rate or index, but also of the swap itself. If the investment adviser and/or the
sub-adviser is incorrect in its forecasts of default risks, market spreads or other applicable factors or events, the investment performance of the Fund would diminish compared with what it would have been if
these techniques were not used.
Tax Risk. The value of the Fund’s investments and its NAV may be adversely affected by changes in tax rates, rules and
policies. Because interest income from municipal securities is normally not subject to regular federal income taxation, the attractiveness of municipal securities in relation to other investment alternatives is affected by changes in federal income
tax rates or changes in the tax exempt status of interest income from municipal securities. Additionally, the Fund is not a suitable investment for individual retirement accounts, for other tax exempt or
tax-deferred accounts, for investors who are not sensitive to the federal income tax consequences of their investments.
Taxability Risk. The Fund will invest in municipal securities in reliance at the time of purchase on an opinion of bond counsel to the issuer that the interest
paid on those securities will be excludable from gross income for regular federal income tax purposes, and the sub-adviser will not independently verify that opinion. Subsequent to the Fund’s acquisition
of such a municipal security, however, the security may be determined to pay, or to have paid, taxable income. As a result, the treatment of dividends previously paid or to be paid by the Fund as “exempt-interest dividends” could be
adversely affected, subjecting the Fund’s shareholders to increased federal income tax liabilities. Certain other investments made by the Fund, including derivatives transactions, may result in the receipt of taxable income or gains by the
Fund.
Tobacco Settlement Bond Risk. The Fund may invest in tobacco settlement bonds. Tobacco settlement bonds are municipal securities that are backed solely
by expected revenues to be derived from lawsuits involving tobacco related deaths and illnesses which were settled between certain states and American tobacco companies. Tobacco settlement bonds are secured by an issuing state’s proportionate
share in the Master Settlement Agreement, an agreement between 46 states and nearly all of the U.S. tobacco manufacturers (the “MSA”). Under the terms of the MSA, the actual amount of future settlement payments by tobacco-manufacturers is
dependent on many factors, including, among other things, reduced cigarette consumption. Payments made by tobacco manufacturers could be negatively impacted if the decrease in tobacco consumption is significantly greater than the forecasted decline.
Unrated Securities Risk. The Fund may purchase securities that are not rated by any rating organization. Unrated securities determined by the
Fund’s investment adviser to be of comparable quality to rated investments which the Fund may purchase may pay a higher dividend or interest rate than such rated investments and be subject to a greater risk of illiquidity or price changes. Less
public information is typically available about unrated investments or issuers than rated investments or issuers. Some unrated securities may not have an active trading market or may be difficult to value, which means the Fund might have difficulty
selling them promptly at an acceptable price. To the extent that the Fund invests in unrated securities, the Fund’s ability to achieve its investment objectives will be more dependent on the investment adviser’s credit analysis than would
be the case when the Fund invests in rated securities.
Valuation Risk. The municipal securities in which the Fund invests typically are valued by a pricing
service utilizing a range of market-based inputs and assumptions, including readily available market quotations obtained from broker-dealers making markets in such instruments, cash flows and transactions for comparable instruments. There is no
assurance that the Fund will be able to sell a portfolio security at the price established by the pricing service, which could result in a loss to the Fund. Pricing services generally price municipal securities assuming orderly transactions of an
institutional “round lot” size, but some trades may occur in smaller, “odd lot” sizes, often at lower prices than institutional round lot trades. Different pricing services may incorporate different assumptions and inputs into
their valuation methodologies, potentially resulting in different values for the same securities. As a result, if the Fund were to change pricing services, or if the Fund’s pricing service were to change its valuation methodology, there could
be a material impact, either positive or negative, on the Fund’s NAV.
Zero Coupon Bonds Risk. Because interest on zero coupon bonds is not paid on a
current basis, the values of zero coupon bonds will be more volatile in response to interest rate changes than the values of bonds that distribute income regularly. Although zero coupon bonds generate income for accounting purposes, they do not
produce cash flow, and thus the Fund could be forced to liquidate securities at an inopportune time in order to generate cash to distribute to shareholders as required by tax laws.
Fund Level and Other Risks:
106
Anti-Takeover Provisions. The Fund’s organizational documents include provisions that could limit the ability of other entities or persons to acquire control
of the Fund or convert the Fund to open-end status, which include those commonly known as “Control Share Acquisition” provisions. Although the application of the “Control Share Acquisition”
provisions has currently been suspended, these provisions could have the effect of depriving the common shareholders of opportunities to sell their common shares at a premium over the then-current market price of the common shares.
Counterparty Risk. Changes in the credit quality of the companies that serve as the Fund’s counterparties with respect to derivatives or other transactions
supported by another party’s credit will affect the value of those instruments. Certain entities that have served as counterparties in the markets for these transactions have incurred or may incur in the future significant financial hardships
including bankruptcy and losses as a result of exposure to sub-prime mortgages and other lower-quality credit investments. As a result, such hardships have reduced these entities’ capital and called into
question their continued ability to perform their obligations under such transactions. By using such derivatives or other transactions, the Fund assumes the risk that its counterparties could experience similar financial hardships. In the event of
the insolvency of a counterparty, the Fund may sustain losses or be unable to liquidate a derivatives position.
Cybersecurity Risk. The Fund and its service
providers are susceptible to operational and information security risk resulting from cyber incidents. Cyber incidents refer to both intentional attacks and unintentional events including: processing errors, human errors, technical errors including
computer glitches and system malfunctions, inadequate or failed internal or external processes, market-wide technical-related disruptions, unauthorized access to digital systems (through “hacking” or malicious software coding), computer
viruses, and cyber-attacks which shut down, disable, slow or otherwise disrupt operations, business processes or website access or functionality (including denial of service attacks). Cyber incidents could adversely impact the Fund and cause the
Fund to incur financial loss and expense, as well as face exposure to regulatory penalties, reputational damage, and additional compliance costs associated with corrective measures. In addition, substantial costs may be incurred in order to prevent
any cyber incidents in the future. Furthermore, the Fund cannot control the cybersecurity plans and systems put in place by its service providers or any other third parties whose operations may affect the Fund.
Economic and Political Events Risk. The Fund may be more sensitive to adverse economic, business or political developments if it invests a
substantial portion of its assets in the municipal securities of similar projects (such as those relating to the education, health care, housing, transportation, or utilities industries), industrial development bonds, or in particular types of
municipal securities (such as general obligation bonds, private activity bonds or moral obligation bonds). Such developments may adversely affect a specific industry or local political and economic conditions, and thus may lead to declines in the
creditworthiness and value of such municipal securities.
Fund Tax Risk. The Fund has elected to be treated and intends to qualify each year as a Regulated
Investment Company (“RIC”) under the Internal Revenue Code of 1986, as amended (the “Code”). As a RIC, the Fund is not expected to be subject to U.S. federal income tax to the extent that it distributes its investment company
taxable income and net capital gains. To qualify for the special tax treatment available to a RIC, the Fund must comply with certain investment, distribution, and diversification requirements. Under certain circumstances, the Fund may be forced to
sell certain assets when it is not advantageous in order to meet these requirements, which may reduce the Fund’s overall return. If the Fund fails to meet any of these requirements, subject to the opportunity to cure such failures under
applicable provisions of the Code, the Fund’s income would be subject to a double level of U.S. federal income tax. The Fund’s income, including its net capital gain, would first be subject to U.S. federal income tax at regular corporate
rates, even if such income were distributed to shareholders and, second, all distributions by the Fund from earnings and profits, including distributions of net capital gain (if any), would be taxable to shareholders as dividends.
Global Economic Risk. National and regional economies and financial markets are becoming increasingly interconnected, which increases the possibilities that
conditions in one country, region or market might adversely impact issuers in a different country, region or market. Changes in legal, political, regulatory, tax and economic conditions may cause fluctuations in markets and assets prices around the
world, which could negatively impact the value of the Fund’s investments. Major economic or political disruptions, particularly in large economies like China’s, may have global negative economic and market repercussions. Additionally,
instability in various countries, such as Afghanistan and Syria, war and natural and environmental disasters, and the spread of infectious illnesses or other public health emergencies, terrorist attacks in the United States and around the world,
growing social and political discord in the United States, the European debt crisis, the response of the international community—through economic sanctions and otherwise—to international events, further downgrade of U.S. government
securities, changes in the U.S. president or political shifts in Congress and other similar events may adversely affect the global economy and the markets and issuers in which the Fund invests. Recent examples of such events include Hamas’
attack on Israel in October 2023 and the ensuing conflict, the outbreak of a novel coronavirus known as COVID-19 that was first detected in China in December 2019 and heightened concerns regarding North
Korea’s nuclear weapons and long-range ballistic missile programs. In addition, Russia’s invasion of Ukraine in February 2022 has resulted in sanctions imposed by several nations, such as the United States, United Kingdom, European Union
and Canada. The current sanctions and potential further sanctions may negatively impact certain sectors of Russia’s economy, but also may negatively impact the value of the Fund’s investments that do not have direct exposure to Russia.
These events could reduce consumer demand or economic output, result in market closure, travel restrictions or quarantines, and generally have a significant impact on the global economy. These events could also impair the information technology and
other operational systems upon which the Fund’s service providers, including the Fund’s sub-adviser, rely, and could otherwise disrupt the ability of employees of the Fund’s service providers to
perform essential tasks on behalf of the Fund.
The Fund does not know and cannot predict how long the securities markets may be affected by these events, and the
future impact of these and similar events on the global economy and securities markets is uncertain. The Fund may be adversely affected by abrogation of international agreements and national laws which have created the market instruments in which
the Fund may invest, failure of the designated national and international authorities to enforce compliance with the same laws and agreements, failure of local, national and international organizations to carry out the duties prescribed to them
under the relevant agreements, revisions of these laws and agreements which dilute their effectiveness or conflicting interpretation of provisions of the same laws and agreements.
107
Shareholder Update (Unaudited) (continued)
Governmental and quasi-governmental authorities and regulators throughout the world have in the past responded to major economic disruptions with a variety of significant
fiscal and monetary policy changes, including but not limited to, direct capital infusions into companies, new monetary programs and dramatically lower interest rates. An unexpected or quick reversal of these policies, or the ineffectiveness of
these policies, could increase volatility in securities markets, which could adversely affect the Fund’s investments.
Investment and Market Risk. An
investment in common shares is subject to investment risk, including the possible loss of the entire principal amount that you invest. Common shares frequently trade at a discount to their NAV. An investment in common shares represents an indirect
investment in the securities owned by the Fund. Common shares at any point in time may be worth less than your original investment, even after taking into account the reinvestment of Fund dividends and distributions.
Legislation and Regulatory Risk. At any time after the date of this report, legislation or additional regulations may be enacted that could negatively affect the
assets of the Fund, securities held by the Fund or the issuers of such securities. Fund shareholders may incur increased costs resulting from such legislation or additional regulation. There can be no assurance that future legislation, regulation or
deregulation will not have a material adverse effect on the Fund or will not impact the ability of the Fund to achieve its investment objectives.
Leverage
Risk. The use of leverage creates special risks for common shareholders, including potential interest rate risks and the likelihood of greater volatility of NAV and market price of, and distributions on, the common shares. The use of leverage in
a declining market will likely cause a greater decline in the Fund’s NAV, which may result at a greater decline of the common share price, than if the Fund were not to have used leverage.
The Fund will pay (and common shareholders will bear) any costs and expenses relating to the Fund’s use of leverage, which will result in a reduction in the
Fund’s NAV. The investment adviser may, based on its assessment of market conditions, composition of the Fund’s holdings, increase or decrease the amount of leverage. Such changes may impact the Fund’s distributions and the price of
the common shares in the secondary market. There is no assurance that the Fund’s use of leverage will be successful.
The Fund may seek to refinance its leverage
over time, in the ordinary course, as current forms of leverage mature or it is otherwise desirable to refinance; however, the form that such leverage will take cannot be predicted at this time. If the Fund is unable to replace existing leverage on
comparable terms, its costs of leverage will increase. Accordingly, there is no assurance that the use of leverage may result in a higher yield or return to common shareholders.
The amount of fees paid to the investment adviser and the sub-advisor for investment advisory services will be higher if the Fund
uses leverage because the fees will be calculated based on the Fund’s Managed Assets - this may create an incentive for the investment adviser and the sub-advisor to leverage the Fund or increase the
Fund’s leverage.
Market Discount from Net Asset Value. Shares of closed-end investment companies like the Fund
frequently trade at prices lower than their NAV. This characteristic is a risk separate and distinct from the risk that the Fund’s NAV could decrease as a result of investment activities. Whether investors will realize gains or losses upon the
sale of the common shares will depend not upon the Fund’s NAV but entirely upon whether the market price of the common shares at the time of sale is above or below the investor’s purchase price for the common shares. Furthermore,
management may have difficulty meeting the Fund’s investment objectives and managing its portfolio when the underlying securities are redeemed or sold during periods of market turmoil and as investors’ perceptions regarding closed-end funds or their underlying investments change. Because the market price of the common shares will be determined by factors such as relative supply of and demand for the common shares in the market, general
market and economic circumstances, and other factors beyond the control of the Fund, the Fund cannot predict whether the common shares will trade at, below or above NAV. The common shares are designed primarily for long-term investors, and you
should not view the Fund as a vehicle for short-term trading purposes.
Recent Market Conditions. Periods of unusually high financial market volatility and
restrictive credit conditions, at times limited to a particular sector or geographic area, have occurred in the past and may be expected to recur in the future. Some countries, including the United States, have adopted or have signaled protectionist
trade measures, relaxation of the financial industry regulations that followed the financial crisis, and/or reductions to corporate taxes. The scope of these policy changes is still developing, but the equity and debt markets may react strongly to
expectations of change, which could increase volatility, particularly if a resulting policy runs counter to the market’s expectations. The outcome of such changes cannot be foreseen at the present time. In addition, geopolitical and other
risks, including environmental and public health risks, may add to instability in the world economy and markets generally. As a result of increasingly interconnected global economies and financial markets, the value and liquidity of the Fund’s
investments may be negatively affected by events impacting a country or region, regardless of whether the Fund invests in issuers located in or with significant exposure to such country or region.
Ukraine has experienced ongoing military conflict, most recently in February 2022 when Russia invaded Ukraine; this conflict may expand and military attacks could occur
elsewhere in Europe. Europe has also been struggling with mass migration from the Middle East and Africa. The ultimate effects of these events and other socio-political or geographical issues are not known but could profoundly affect global
economies and markets. Additionally, in October 2023 armed conflict broke out between Israel and the militant group Hamas after Hamas infiltrated Israel’s southern border from the Gaza Strip. Israel has since declared war against Hamas and
it’s possible that this conflict could escalate into a greater regional conflict. The ultimate effects of these events and other socio-political or geographical issues are not known but could profoundly affect global economies and markets.
The ongoing trade war between China and the United States, including the imposition of tariffs by each country on the other country’s products, has created a tense
political environment. These actions may trigger a significant reduction in international trade, the oversupply of certain manufactured goods, substantial price reductions of goods and possible failure of individual companies and/or large segments
of China’s export industry, which could have a negative impact on the Fund’s performance. U.S. companies that source material and goods from China and those that make large amounts of sales in China would be particularly vulnerable to an
escalation of trade tensions. Uncertainty regarding the outcome of the trade
108
tensions and the potential for a trade war could cause the U.S. dollar to decline against safe haven currencies, such as the Japanese yen and the euro. Events such as
these and their consequences are difficult to predict and it is unclear whether further tariffs may be imposed or other escalating actions may be taken in the future.
Recently the U.S. Federal Reserve (the “Fed”) has sharply raised interest rates and has signaled an intention to continue to do so or maintain higher interest
rates until current inflation levels re-align with the Fed’s long-term inflation target. Changing interest rate environments impact the various sectors of the economy in different ways. For example, in
March 2023, the Federal Deposit Insurance Corporation (””FDIC””) was appointed receiver for each of Silicon Valley Bank and Signature Bank, the second- and third-largest bank failures in U.S. history, which failures may be
attributable, in part, to rising interest rates. Bank failures may have a destabilizing impact on the broader banking industry or markets generally.
Reverse
Repurchase Agreement Risk. A reverse repurchase agreement, in economic essence, constitutes a securitized borrowing by the Fund from the security purchaser. The Fund may enter into reverse repurchase agreements for the purpose of creating a
leveraged investment exposure and, as such, their usage involves essentially the same risks associated with a leveraging strategy generally since the proceeds from these agreements may be invested in additional portfolio securities. Reverse
repurchase agreements tend to be short-term in tenor, and there can be no assurances that the purchaser (lender) will commit to extend or “roll” a given agreement upon its agreed-upon repurchase date or an alternative purchaser can be
identified on similar terms. Reverse repurchase agreements also involve the risk that the purchaser fails to return the securities as agreed upon, files for bankruptcy or becomes insolvent. The Fund may be restricted from taking normal portfolio
actions during such time, could be subject to loss to the extent that the proceeds of the agreement are less than the value of securities subject to the agreement and may experience adverse tax consequences.
109
Shareholder Update (Unaudited) (continued)
DIVIDEND REINVESTMENT PLAN
Nuveen
Closed-End Funds Automatic Reinvestment Plan
Your Nuveen Closed-End Fund allows
you to conveniently reinvest distributions in additional Fund shares. By choosing to reinvest, you’ll be able to invest money regularly and automatically, and watch your investment grow through the power of compounding. Just like distributions
in cash, there may be times when income or capital gains taxes may be payable on distributions that are reinvested. It is important to note that an automatic reinvestment plan does not ensure a profit, nor does it protect you against loss in a
declining market.
Easy and convenient
To make recordkeeping easy and
convenient, each month you’ll receive a statement showing your total distributions, the date of investment, the shares acquired and the price per share, and the total number of shares you own.
How shares are purchased
The shares you acquire by reinvesting will either be
purchased on the open market or newly issued by the Fund. If the shares are trading at or above NAV at the time of valuation, the Fund will issue new shares at the greater of the NAV or 95% of the then-current market price. If the shares are trading
at less than NAV, shares for your account will be purchased on the open market. If Computershare Trust Company, N.A. (the “Plan Agent”) begins purchasing Fund shares on the open market while shares are trading below NAV, but the
Fund’s shares subsequently trade at or above their NAV before the Plan Agent is able to complete its purchases, the Plan Agent may cease open-market purchases and may invest the uninvested portion of the distribution in newly-issued Fund shares
at a price equal to the greater of the shares’ NAV or 95% of the shares’ market value on the last business day immediately prior to the purchase date. Distributions received to purchase shares in the open market will normally be invested
shortly after the distribution payment date. No interest will be paid on distributions awaiting reinvestment. Because the market price of the shares may increase before purchases are completed, the average purchase price per share may exceed the
market price at the time of valuation, resulting in the acquisition of fewer shares than if the distribution had been paid in shares issued by the Fund. A pro rata portion of any applicable brokerage commissions on open market purchases will be paid
by Dividend Reinvestment Plan (the “Plan”) participants. These commissions usually will be lower than those charged on individual transactions.
Flexible
You may change your distribution option or withdraw from the Plan at
any time, should your needs or situation change. You can reinvest whether your shares are registered in your name, or in the name of a brokerage firm, bank, or other nominee. Ask your investment advisor if his or her firm will participate on your
behalf. Participants whose shares are registered in the name of one firm may not be able to transfer the shares to another firm and continue to participate in the Plan. The Fund reserves the right to amend or terminate the Plan at any time. Although
the Fund reserves the right to amend the Plan to include a service charge payable by the participants, there is no direct service charge to participants in the Plan at this time.
Call today to start reinvesting distributions
For more information on the
Nuveen Automatic Reinvestment Plan or to enroll in or withdraw from the Plan, speak with your financial professional or call us at (800) 257-8787.
110
CHANGES OCCURRING DURING THE FISCAL YEAR
The following information in this
annual report is a summary of certain changes during the most recent fiscal year. This information may not reflect all of the changes that have occurred since you purchased shares of a Fund.
During the most recent fiscal year, there have been no changes required to be reported in connection with: (i) the Funds’ investment objectives and principal
investment policies that have not been approved by shareholders, (ii) the principal risks of the Fund, (iii) the portfolio managers of the Funds; (iv) a Fund’s charter or by-laws that would
delay or prevent a change of control of the Fund that have not been approved by shareholders except as follows:
Developments Regarding the
Funds’ Control Share By-Law
On October 5, 2020, the Nuveen Municipal Value Fund, Inc., Nuveen AMT-Free Municipal Value Fund and the Nuveen Municipal Income Fund, Inc. (each a “Fund” and collectively the “Funds”) and certain other closed-end funds in
the Nuveen fund complex amended their by-laws. Among other things, the amended by-laws included provisions pursuant to which, in summary, a shareholder who obtains
beneficial ownership of common shares in a Control Share Acquisition (as defined in the by-laws) shall have the same voting rights as other common shareholders only to the extent authorized by the other
disinterested shareholders (the “Control Share By-Law”). On January 14, 2021, a shareholder of certain Nuveen closed-end funds filed a civil complaint in
the U.S. District Court for the Southern District of New York (the “District Court”) against certain Nuveen funds and their trustees, seeking a declaration that such funds’ Control Share By-Laws
violate the 1940 Act, rescission of such fund’s Control Share By-Laws and a permanent injunction against such funds applying the Control Share By-Laws. On
February 18, 2022, the District Court granted judgment in favor of the plaintiff’s claim for rescission of such funds’ Control Share By-Laws and the plaintiff’s declaratory judgment claim,
and declared that such funds’ Control Share By-Laws violate Section 18(i) of the 1940 Act. Following review of the judgment of the District Court, on February 22, 2022, the Board amended the
Funds’ bylaws to provide that the Funds’ Control Share By-Law shall be of no force and effect for so long as the judgment of the District Court is effective and that if the judgment of the District
Court is reversed, overturned, vacated, stayed, or otherwise nullified, the Fund’s Control Share By-Law will be automatically reinstated and apply to any beneficial owner of common shares acquired in a
Control Share Acquisition, regardless of whether such Control Share Acquisition occurs before or after such reinstatement, for the duration of the stay or upon issuance of the mandate reversing, overturning, vacating or otherwise nullifying the
judgment of the District Court. On February 25, 2022, the Board and the Funds appealed the District Court’s decision to the U.S. Court of Appeals for the Second Circuit. On November 30, 2023, the U.S. Court of Appeals for the Second
Circuit upheld the opinion of the District Court.
Principal Risks
The following risk factor was added as a principal risk to the Funds:
Fund Tax
Risk. The Fund has elected to be treated and intends to qualify each year as a Regulated Investment Company (“RIC”) under the Internal Revenue Code of 1986, as amended (the “Code”). As a RIC, the Fund is not expected to be
subject to U.S. federal income tax to the extent that it distributes its investment company taxable income and net capital gains. To qualify for the special tax treatment available to a RIC, the Fund must comply with certain investment,
distribution, and diversification requirements. Under certain circumstances, the Fund may be forced to sell certain assets when it is not advantageous in order to meet these requirements, which may reduce the Fund’s overall return. If the Fund
fails to meet any of these requirements, subject to the opportunity to cure such failures under applicable provisions of the Code, the Fund’s income would be subject to a double level of U.S. federal income tax. The Fund’s income,
including its net capital gain, would first be subject to U.S. federal income tax at regular corporate rates, even if such income were distributed to shareholders and, second, all distributions by the Fund from earnings and profits, including
distributions of net capital gain (if any), would be taxable to shareholders as dividends.
The following principal risks were consolidated into a single risk factor
entitled, “Economic Sector Risk,” and are therefore no longer included as stand-alone principal risks:
Sector and Industry Risk.
Subject to the concentration limits of the Fund’s investment policies and guidelines, a Fund may invest a significant portion of its net assets in certain sectors of the municipal securities market, such as hospitals
and other health care facilities, charter schools and other private educational facilities, special taxing districts and start-up utility districts, and private activity bonds including industrial development
bonds on behalf of transportation companies such as airline companies, whose credit quality and performance may be more susceptible to economic, business, political, regulatory and other developments than other sectors of municipal issuers. If the
Fund invests a significant portion of its net assets in the sectors noted above, the Fund’s performance may be subject to additional risk and variability.
Sector Focus Risk. At times, the Fund may focus its investments (i.e., overweight its investments relative to the overall municipal
securities market) in one or more particular sectors, which may subject the Fund to additional risk and variability. Securities issued in the same sector may be similarly affected by economic or market events, making the Fund more vulnerable to
unfavorable developments in that sector than funds that invest more broadly. As the percentage of the Fund’s Managed Assets invested in a particular sector increases, so does the potential for fluctuation in the NAV of the Fund’s common
shares.
The following principal risk was consolidated into a single risk factor entitled, “Distressed or Defaulted Securities Risk,” and is therefore no
longer included as a stand-alone principal risk:
111
Shareholder Update (Unaudited) (continued)
Distressed Securities Risk. The Fund may invest in low-rated securities or securities unrated but judged by the sub-adviser to be of comparable quality. Some or many of these low-rated securities, although not in default, may be “distressed,” meaning that the issuer is
experiencing financial difficulties or distress at the time of acquisition. Such securities would present a substantial risk of future default which may cause the Fund to incur losses, including additional expenses, to the extent it is required to
seek recovery upon a default in the payment of principal or interest on those securities. In any reorganization or liquidation proceeding relating to a portfolio security, the Fund may lose its entire investment or may be required to accept cash or
securities with a value less than its original investment. Distressed securities may be subject to restrictions on resale.
The following principal risk was removed
as a principal risk of the Funds:
London Inter-Offered Bank Rate (“LIBOR”) Replacement Risk. LIBOR is an index rate that historically has
been widely used in lending transactions and remains a common reference rate for setting the floating interest rate on private loans. The use of the LIBOR will begin to be phased out in the near future, which may adversely affect the Fund’s
investments whose value is tied to LIBOR. While the Secured Overnight Financing Rate (“SOFR”) has been recommended as the replacement rate for LIBOR, and some product markets have adopted the use of SOFR, LIBOR may still be used as a
reference rate until such time that private markets have fully transitioned to using SOFR or other alternative reference rates recommended by applicable market regulators. The transition process away from LIBOR may involve, among other things,
increased volatility or illiquidity in markets for instruments that currently rely on LIBOR. The potential effect of a discontinuation of LIBOR on the Fund’s investments will vary depending on, among other things: (1) existing fallback
provisions that provide a replacement reference rate if LIBOR is no longer available; (2) termination provisions in individual contracts; and (3) how, and when industry participants develop and adopt new reference rates and fallbacks for
both legacy and new products and instruments held by the Fund. Accordingly, it is difficult to predict the full impact of the transition away from LIBOR until it is clearer how the Fund’s products and instruments will be impacted by this
transition.
The following risks were added as principal risks for the below specified Funds:
|
|
|
| |
|
| Principal Risk |
|
Fund(s) |
| Financial Futures and Options Risk |
|
Nuveen Municipal Value Fund, Inc. (NUV); and
Nuveen Municipal Income Fund, Inc. (NMI)
|
| |
|
| Illiquid Investments Risk |
|
NMI |
| |
|
| Insurance Risk |
|
NMI |
| |
|
| Other Investment Companies Risk |
|
Nuveen AMT-Free
Municipal Value Fund (NUW); and NMI |
| |
|
| Swap Transactions Risk |
|
NMI |
Investment Policies
Effective June 22, 2023, the Board of Trustees (the “Board”) of each Fund approved a change in each Fund’s maturity policy. Each Fund’s maturity
policy effective as of June 22, 2023 is presented below:
“Under normal circumstances, the Fund will generally maintain an investment portfolio with an
overall weighted average maturity of greater than 10 years.”
Effective September 29, 2023, the Board of the Nuveen Municipal Income Fund, Inc. (NMI)
approved the following changes to NMI’s investments policies:
|
|
|
| |
|
| Prior Investment Policy |
|
New Investment Policy |
| |
|
| The Fund will invest at least 80% of its Managed Assets in investment grade quality municipal
securities that, at the time of investment, are rated within the four highest |
|
The Fund may invest up to 75% of its Managed Assets in municipal securities that are rated BBB/Baa or lower by at least one NRSRO or are unrated but judged to be of
comparable quality by the fund’s sub-adviser. |
| grades (Baa or BBB or better) by at least one NRSRO that rate such securities, or if it is unrated but judged to be of comparable quality by
the Fund’s sub-adviser. A security is considered investment grade if it is rated within the four highest letter grades by at least one NRSRO that rate such securities (even if rated lower by another), or
if it is unrated but judged to be of comparable quality by the Fund’s sub-adviser (such securities are commonly referred to as split-rated securities). |
|
|
112
|
|
|
| |
|
| The Fund may invest up to 20% of its Managed Assets in municipal securities that at the time of investment are rated below
investment grade (Ba or BB or lower) by all NRSRO or are unrated but judged to be of comparable quality by the Fund’s sub-adviser; however, the Fund may not invest more than 10% of its Managed Assets in
municipal securities rated below B3/B- by all NRSROs that rate the security or that are unrated but judged to be of comparable quality by the Fund’s
sub-adviser. |
|
The Fund may not invest more than 10% of its Managed Assets in municipal securities rated below B3/B- by any NRSROs that rate the security or that are unrated but judged to be of comparable quality by the fund’s sub-adviser. |
| |
|
| The Fund may invest in distressed securities but may not invest in the securities of an issuer
which, at the time of investment, is in default on its obligations to pay principal or interest thereon when due or that is involved in a bankruptcy proceeding (i.e., rated below
|
|
The Fund may invest in the securities of an issuer which, at the time of investment, is in default on its obligations to pay
principal or interest thereon when due or that is involved in a bankruptcy proceeding (i.e., rated below C- at the time of investment) (“defaulted securities”), and may invest in municipal securities
that are experiencing other financial difficulties at the time of acquisition (such securities are commonly referred to as distressed securities). The Fund’s sub-adviser may determine that it is in the
best interest of shareholders in pursuing a workout arrangement with issuers of defaulted securities to make loans to the defaulted issuer or another party, or purchase a debt, equity or other interest from the defaulted issuer or another party, or
take other related or similar steps involving the investment of additional monies. |
| C-, at the time of
investment); provided, however, that the Fund’s sub-adviser may determine that it is in the best interest of shareholders in pursuing a workout arrangement with issuers of defaulted securities to make
loans to the defaulted issuer or another party, or purchase a debt, equity or other interest from the defaulted issuer or another party, or take other related
or similar steps involving the investment of additional monies, but only if that issuer’s securities are already held by the Fund.
|
| |
|
| N/A |
|
In addition, the credit quality policies noted above apply only at the time of the purchase of a security, and the Fund is not required to
dispose of a security in the event Moody’s, S&P or Fitch downgrades its assessment of the credit characteristics of a particular issuer, even if such downgrade causes the portfolio to exceed the 75% or 10% thresholds noted above. If at any
time the Fund exceeds either the 75% or 10% threshold noted above, the Fund’s future investments will be made in a manner that will bring the Fund’s portfolio back into compliance with these policies. |
Portfolio Managers
Nuveen Municipal Value Fund, Inc. (“NUV”) and
Nuveen AMT-Free Municipal Value Fund (“NUW”)
Effective October 13, 2023, Kristen M. DeJong, CFA, was added as a portfolio manager to each of NUV and NUW. The day-to-day operation of each Fund and the execution of its specific investment strategies is the primary responsibility of each of the Fund’s portfolio managers. The biography of Kristen M. DeJong, CFA,
is presented below:
Kristen M. DeJong, CFA, is Managing Director and Portfolio Manager at Nuveen Asset Management, LLC (“Nuveen Asset Management”). She
began her career in the financial services industry in 2005 and joined Nuveen Asset Management in 2008. She served as a research associate in the wealth management services area and then as a senior research analyst for Nuveen Asset
Management’s municipal fixed income team before assuming portfolio management responsibilities in 2021.
Nuveen Municipal Income Fund, Inc.
(“NMI”)
Effective October 13, 2023, Kristen M. DeJong, CFA, and Scott R. Romans, PhD, were named portfolio managers of NMI. Christopher L. Drahn,
CFA, will continue to serve as a portfolio manager for NMI until his retirement on April 1, 2024. The day-to-day operation of NMI and the execution of its
specific investment strategies is the primary responsibility of each of NMI’s portfolio managers. Biographies of Kristen M. DeJong and Scott R. Romans are presented below:
Kristen M. DeJong, CFA, is Managing Director and Portfolio Manager at Nuveen Asset Management. She began her career in the financial services industry in 2005 and joined
Nuveen Asset Management in 2008. She served as a research associate in the wealth management services area and then as a senior research analyst for Nuveen Asset Management’s municipal fixed income team before assuming portfolio management
responsibilities in 2021.
Scott R. Romans, PhD, is Managing Director and Portfolio Manager at Nuveen Asset Management. He began his career in the financial services
industry when he joined Nuveen Asset Management in 2000. He assumed portfolio management responsibilities in 2003.
113
Shareholder Update (Unaudited) (continued)
UPDATED DISCLOSURES FOR THE FUND’S EFFECTIVE SHELF OFFERING REGISTRATION STATEMENT
The following includes additional disclosures for the Fund in this annual report with an effective shelf offering registration statement as of the fiscal year ended
October 31, 2023.
NUVEEN MUNICIPAL INCOME FUND, INC. (NMI)
SUMMARY OF FUND EXPENSES
The purpose of the tables and the examples below are
to help you understand all fees and expenses that you, as a common shareholder, would bear directly or indirectly. The tables show the expenses of the Fund as a percentage of the average net assets applicable to Common Shares and not as a percentage
of total assets or managed assets.
|
|
|
|
|
| Shareholder Transaction Expenses |
|
|
|
| Maximum Sales Charge (as a percentage of offering price) |
|
|
4.00% (1) |
|
|
|
| Dividend Reinvestment Plan Fees (2) |
|
|
$2.50 |
|
| (1) |
A maximum sales charge of 4.00% applies only to offerings pursuant to a syndicated underwriting. The maximum sales charge
for offerings made at-the-market is 1.00%. There is no sales charge for offerings pursuant to a private transaction. |
| (2) |
You will be charged a $2.50 service charge and pay brokerage charges if you direct Computershare Inc. and Computershare
Trust Company, N.A., as agent for the common shareholders, to sell your Common Shares held in a dividend reinvestment account. |
|
|
|
|
|
| Annual Expenses (As a Percentage of Net Assets Attributable to Common Shares) (1) |
|
|
|
| Management Fees |
|
|
0.61% |
|
|
|
| Interest and Other Related Expenses (2) |
|
|
0.00% (3) |
|
|
|
| Other Expenses (4) |
|
|
0.13% |
|
|
|
| Total Annual Expenses |
|
|
0.74% |
|
| (1) |
Stated as percentages of average net assets attributable to Common Shares for the fiscal year ended October 31, 2023.
|
| (2) |
Interest and Other Related Expenses reflect actual expenses and fees incurred by the Fund related to its temporary
committed line of credit for the fiscal year ended October 31, 2023. The Fund will not leverage its capital structure by issuing senior securities such as Preferred Shares or debt instruments. However, the Fund may borrow for temporary or
emergency purposes and invest in certain instruments, including inverse floating rate securities, that have the economic effect of leverage. During the fiscal year ended October 31, 2023, the Fund did not employ leverage through investments in
inverse floating rate securities, but it did incur expenses related to its temporary committed line of credit as described in the Notes to Financial Statements (Note 10 – Borrowing Arrangements, Committed Line of Credit) of this annual report.
“Actual Interest and Other Related Expenses” incurred in the future may be higher or lower. The Fund’s use of leverage will increase the amount of management fees paid to the Fund’s adviser and
sub-advisor(s). |
| (3) |
Rounds to less than 0.01% |
| (4) |
Other Expenses are based on estimated amounts for the current fiscal year. Expenses attributable to the Fund’s
investments, if any, in other investment companies are currently estimated not to exceed 0.01%. |
Examples
The following examples illustrate the expenses, including the applicable transaction fees (referred to as the “Maximum Sales Charge” in the Shareholder
Transaction Expenses table above), if any, that a common shareholder would pay on a $1,000 investment that is held for the time periods provided in the table. Each example assumes that all dividends and other distributions are reinvested in the Fund
and that the Fund’s Annual Expenses, as provided above, remain the same. The examples also assume a 5% annual return. Actual expenses may be greater or less than those assumed. Moreover, the Fund’s actual rate of return may be greater or
less than the hypothetical 5% return shown in the examples.
Example # 1
(At-the-Market Transaction)
The following example assumes a transaction fee of
1.00%, as a percentage of the offering price.
|
|
|
|
|
|
|
|
|
|
|
|
|
|
|
|
|
|
|
|
|
|
|
|
|
|
|
|
|
| |
|
1 Year |
|
|
|
|
|
3 Years |
|
|
|
|
|
5 Years |
|
|
|
|
|
10 Years |
|
| |
|
|
$17 |
|
|
|
|
|
|
|
$33 |
|
|
|
|
|
|
|
$51 |
|
|
|
|
|
|
|
$101 |
|
114
Example # 2 (Underwriting Syndicate Transaction)
The following example assumes
a transaction fee of 4.00%, as a percentage of the offering price.
|
|
|
|
|
|
|
|
|
|
|
|
|
|
|
|
|
|
|
|
|
|
|
|
|
|
|
|
|
| |
|
1 Year |
|
|
|
|
|
3 Years |
|
|
|
|
|
5 Years |
|
|
|
|
|
10 Years |
|
| |
|
|
$47 |
|
|
|
|
|
|
|
$63 |
|
|
|
|
|
|
|
$80 |
|
|
|
|
|
|
|
$128 |
|
Example # 3 (Privately Negotiated Transaction)
The following example assumes there is no transaction fee.
|
|
|
|
|
|
|
|
|
|
|
|
|
|
|
|
|
|
|
|
|
|
|
|
|
|
|
|
|
| |
|
1 Year |
|
|
|
|
|
3 Years |
|
|
|
|
|
5 Years |
|
|
|
|
|
10 Years |
|
| |
|
|
$8 |
|
|
|
|
|
|
|
$24 |
|
|
|
|
|
|
|
$41 |
|
|
|
|
|
|
|
$92 |
|
The examples should not be considered a representation of future expenses. Actual expenses may be greater or less than those shown
above.
TRADING AND NET ASSET VALUE INFORMATION
The following table
shows for the periods indicated: (i) the high and low sales prices for the Common Shares reported as of the end of the day on the NYSE, (ii) the high and low net asset value (NAV) of the Common Shares, and (iii) the high and low of
the premium/(discount) to NAV (expressed as a percentage) of shares of the Common Shares.
|
|
|
|
|
|
|
|
|
|
|
|
|
|
|
|
|
|
|
|
|
|
|
|
|
|
|
|
|
|
|
|
|
|
|
|
|
|
|
|
|
|
|
|
|
|
|
|
|
| |
|
Market Price |
|
|
NAV |
|
|
Premium/(Discount)
to NAV |
|
|
|
|
|
|
|
|
|
|
|
|
|
|
| Fiscal Quarter End |
|
|
|
|
High |
|
|
|
|
|
Low |
|
|
|
|
|
High |
|
|
|
|
|
Low |
|
|
|
|
|
High |
|
|
|
|
|
Low |
|
| |
|
| October 2023 |
|
|
|
|
|
|
$9.75 |
|
|
|
|
|
|
|
$8.33 |
|
|
|
|
|
|
|
$9.84 |
|
|
|
|
|
|
|
$9.16 |
|
|
|
|
|
|
|
(0.91)% |
|
|
|
|
|
|
|
(9.95)% |
|
|
|
|
|
|
|
|
|
|
|
|
|
|
| July 2023 |
|
|
|
|
|
|
$9.99 |
|
|
|
|
|
|
|
$9.13 |
|
|
|
|
|
|
|
$9.90 |
|
|
|
|
|
|
|
$9.67 |
|
|
|
|
|
|
|
1.94% |
|
|
|
|
|
|
|
(7.59)% |
|
|
|
|
|
|
|
|
|
|
|
|
|
|
| April 2023 |
|
|
|
|
|
|
$9.90 |
|
|
|
|
|
|
|
$8.96 |
|
|
|
|
|
|
|
$10.00 |
|
|
|
|
|
|
|
$9.70 |
|
|
|
|
|
|
|
(0.30)% |
|
|
|
|
|
|
|
(8.34)% |
|
|
|
|
|
|
|
|
|
|
|
|
|
|
| January 2023 |
|
|
|
|
|
|
$10.00 |
|
|
|
|
|
|
|
$8.57 |
|
|
|
|
|
|
|
$9.99 |
|
|
|
|
|
|
|
$9.27 |
|
|
|
|
|
|
|
1.23% |
|
|
|
|
|
|
|
(8.47)% |
|
|
|
|
|
|
|
|
|
|
|
|
|
|
| October 2022 |
|
|
|
|
|
|
$9.70 |
|
|
|
|
|
|
|
$8.46 |
|
|
|
|
|
|
|
$10.19 |
|
|
|
|
|
|
|
$9.19 |
|
|
|
|
|
|
|
(4.72)% |
|
|
|
|
|
|
|
(8.82)% |
|
|
|
|
|
|
|
|
|
|
|
|
|
|
| July 2022 |
|
|
|
|
|
|
$9.75 |
|
|
|
|
|
|
|
$9.03 |
|
|
|
|
|
|
|
$10.24 |
|
|
|
|
|
|
|
$9.72 |
|
|
|
|
|
|
|
(4.69)% |
|
|
|
|
|
|
|
(7.80)% |
|
|
|
|
|
|
|
|
|
|
|
|
|
|
| April 2022 |
|
|
|
|
|
|
$10.77 |
|
|
|
|
|
|
|
$9.42 |
|
|
|
|
|
|
|
$11.10 |
|
|
|
|
|
|
|
$10.13 |
|
|
|
|
|
|
|
(2.62)% |
|
|
|
|
|
|
|
(7.13)% |
|
|
|
|
|
|
|
|
|
|
|
|
|
|
| January 2022 |
|
|
|
|
|
|
$12.24 |
|
|
|
|
|
|
|
$10.75 |
|
|
|
|
|
|
|
$11.37 |
|
|
|
|
|
|
|
$11.03 |
|
|
|
|
|
|
|
7.84% |
|
|
|
|
|
|
|
(2.63)% |
|
| |
|
The following table shows, as of October 31, 2023 the Fund’s: (i) NAV per Common Share, (ii) market price,
(iii) percentage of premium/(discount) to NAV per Common Share and, (iv) net assets attributable to Common Shares.
|
|
|
|
|
| October 31, 2023 |
|
|
|
| |
|
| NAV per Common Share |
|
|
$ 9.16 |
|
|
|
| Market Price |
|
|
$ 8.35 |
|
|
|
| Percentage of Premium/(Discount) to NAV per Common Share |
|
|
(8.84)% |
|
|
|
| Net Assets Attributable to Common Shares |
|
|
$ 92,117,408 |
|
| |
|
Shares of closed-end investment companies, including the Fund, may frequently trade at prices
lower than NAV, the Fund’s Board of Trustees (Board) has currently determined that, at least annually, it will consider action that might be taken to reduce or eliminate any material discount from NAV in respect of Common Shares, which may
include the repurchase of such shares in the open market or in private transactions, the making of a tender offer for such shares at NAV, or the conversion of the Fund to an open-end investment company. The
Fund cannot assure you that its Board will decide to take any of these actions, or that share repurchases or tender offers will actually reduce market discount.
115
Shareholder Update (Unaudited) (continued)
UNRESOLVED STAFF COMMENTS
The Fund believes that there are no material
unresolved written comments, received 180 days or more before October 31, 2023, from the Staff of the Securities and Exchange Commission (SEC) regarding any of its periodic or current reports under the Securities Exchange Act or the Investment
Company Act of 1940, or its registration statement.
116
Important Tax Information
(Unaudited)
As required by the Internal Revenue Code and Treasury Regulations, certain tax
information, as detailed below, must be provided to shareholders. Shareholders are advised to consult their tax advisor with respect to the tax implications of their investment. The amounts listed below may differ from the actual amounts reported on
Form 1099-DIV, which will be sent to shareholders shortly after calendar year end.
Long-Term Capital Gains
As of year end, each Fund designates the following distribution amounts, or maximum amount allowable, as being from net long-term capital gains pursuant to
Section 852(b)(3) of the Internal Revenue Code:
|
|
|
|
|
| Fund |
|
Net Long-Term
Capital Gains |
|
| |
|
| NUV |
|
|
$– |
|
|
|
| NUW |
|
|
– |
|
|
|
| NMI |
|
|
– |
|
| |
|
117
Additional Fund Information
(Unaudited)
Board of Directors/Trustees
|
|
|
|
|
|
|
|
|
|
|
| Jack B. Evans |
|
William C. Hunter |
|
Amy B.R. Lancellotta |
|
Joanne T. Medero |
|
Albin F. Moschner |
|
John K. Nelson |
|
|
|
|
|
|
| Matthew Thornton III |
|
Terence J. Toth |
|
Margaret L. Wolff |
|
Robert L. Young |
|
|
|
|
|
|
|
|
|
|
|
|
|
| Investment Adviser |
|
Custodian |
|
Legal Counsel |
|
Independent Registered |
|
Transfer Agent and |
| Nuveen Fund Advisors, LLC 333 West Wacker Drive |
|
State Street Bank & Trust Company |
|
Chapman and Cutler LLP Chicago, IL 60603 |
|
Public Accounting Firm KPMG LLP |
|
Shareholder Services Computershare Trust Company, |
| Chicago, IL 60606 |
|
One Congress Street |
|
|
|
200 East Randolph Street |
|
N.A. |
|
|
Suite 1 |
|
|
|
Chicago, IL 60601 |
|
150 Royall Street |
|
|
Boston, MA 02114-2016 |
|
|
|
|
|
Canton, MA 02021 |
|
|
|
|
|
|
|
|
(800) 257-8787 |
Portfolio of Investments Information Each Fund is required to file its complete schedule of portfolio holdings with the Securities and Exchange Commission (SEC)
for the first and third quarters of each fiscal year as an exhibit to its report on Form N-PORT. You may obtain this information on the SEC’s website at http://www.sec.gov.
Nuveen Funds’ Proxy Voting Information You may obtain (i) information regarding how each fund voted proxies relating to portfolio securities held
during the most recent twelve-month period ended June 30, without charge, upon request, by calling Nuveen toll-free at (800) 257-8787 or on Nuveen’s website at www.nuveen.com and (ii) a
description of the policies and procedures that each fund used to determine how to vote proxies relating to portfolio securities without charge, upon request, by calling Nuveen toll-free at (800) 257-8787. You
may also obtain this information directly from the SEC. Visit the SEC on-line at http://www.sec.gov.
CEO Certification Disclosure Each
Fund’s Chief Executive Officer (CEO) has submitted to the New York Stock Exchange (NYSE) the annual CEO certification as required by Section 303A.12(a) of the NYSE Listed Company Manual. Each Fund has filed with the SEC the certification
of its CEO and Chief Financial Officer required by Section 302 of the Sarbanes-Oxley Act.
Common Share Repurchases
Each Fund intends to repurchase, through its open-market share repurchase program, shares of its own common stock at such times and in such amounts as is deemed advisable. During the period covered by this report, each Fund repurchased shares of
its common stock as shown in the accompanying table. Any future repurchases will be reported to shareholders in the next annual or semi-annual report.
|
|
|
|
|
|
|
|
|
|
|
|
|
|
|
|
|
|
|
|
|
| |
|
NUV |
|
|
|
|
|
NUW |
|
|
|
|
|
NMI |
|
|
|
|
|
|
|
| Common shares repurchased |
|
|
0 |
|
|
|
|
|
|
|
0 |
|
|
|
|
|
|
|
0 |
|
FINRA BrokerCheck: The Financial Industry Regulatory Authority (FINRA) provides information regarding the disciplinary history of
FINRA member firms and associated investment professionals. This information as well as an investor brochure describing FINRA BrokerCheck is available to the public by calling the FINRA BrokerCheck Hotline number at (800) 289-9999 or by visiting www.FINRA.org.
118
Glossary of Terms Used in this Report
(Unaudited)
Average Annual Total Return: This is a commonly used method to express an
investment’s performance over a particular, usually multi-year time period. It expresses the return that would have been necessary each year to equal the investment’s actual cumulative performance (including change in NAV or offer price
and reinvested dividends and capital gains distributions, if any) over the time period being considered.
Duration: Duration is a measure of the expected
period over which a bond’s principal and interest will be paid, and consequently is a measure of the sensitivity of a bond’s or bond fund’s value to changes when market interest rates change. Generally, the longer a bond or
fund’s duration, the more the price of the bond or fund will change as interest rates change.
Gross Domestic Product (GDP): The total market value of
all final goods and services produced in a country/region in a given year, equal to total consumer, investment and government spending, plus the value of exports, minus the value of imports.
Industrial Development Revenue Bond (IDR): A unique type of revenue bond issued by a state or local government agency on behalf of a private sector company and
intended to build or acquire factories or other heavy equipment and tools.
Inverse Floating Rate Securities: Inverse floating rate securities, are the
residual interest in a tender option bond (TOB) trust, sometimes referred to as “inverse floaters”, are created by depositing a municipal bond, typically with a fixed interest rate, into a special purpose trust. This trust, in turn,
(a) issues floating rate certificates typically paying short-term tax-exempt interest rates to third parties in amounts equal to some fraction of the deposited bond’s par amount or market value, and
(b) issues an inverse floating rate certificate (sometimes referred to as an “inverse floater”) to an investor (such as a Fund) interested in gaining investment exposure to a long-term municipal bond. The income received by the holder
of the inverse floater varies inversely with the short-term rate paid to the floating rate certificates’ holders, and in most circumstances the holder of the inverse floater bears substantially all of the underlying bond’s downside
investment risk. The holder of the inverse floater typically also benefits disproportionately from any potential appreciation of the underlying bond’s value. Hence, an inverse floater essentially represents an investment in the underlying bond
on a leveraged basis.
Leverage: Leverage is created whenever a fund has investment exposure (both reward and/or risk) equivalent to more than 100% of the
investment capital.
Net Asset Value (NAV) Per Share: A fund’s Net Assets is equal to its total assets (securities, cash, accrued earnings and
receivables) less its total liabilities. NAV per share is equal to the fund’s Net Assets divided by its number of shares outstanding.
Pre-Refunded Bond/Pre-Refunding: Pre-Refunded Bond/Pre-Refunding, also known as advanced
refundings or refinancings, is a procedure used by state and local governments to refinance municipal bonds to lower interest expenses. The issuer sells new bonds with a lower yield and uses the proceeds to buy U.S. Treasury securities, the interest
from which is used to make payments on the higher-yielding bonds. Because of this collateral, pre-refunding generally raises a bond’s credit rating and thus its value.
Tax Obligation/General Bonds: Bonds backed by the general revenues of an issuer, including taxes, where the issuer has the ability to increase taxes by an
unlimited amount to pay the bonds back.
Tax Obligation/Limited Bonds: Bonds backed by the general revenues of an issuer, including taxes, where the issuer
doesn’t have the ability to increase taxes by an unlimited amount to pay the bonds back.
Total Investment Exposure: Total investment exposure is a
fund’s assets managed by the Adviser that are attributable to financial leverage. For these purposes, financial leverage includes a fund’s use of preferred stock and borrowings and investments in the residual interest certificates (also
called inverse floating rate securities) in tender option bond (TOB) trusts, including the portion of assets held by a TOB trust that has been effectively financed by the trust’s issuance of floating rate securities.
Zero Coupon Bond: A zero coupon bond does not pay a regular interest coupon to its holders during the life of the bond. Income to the holder of the bond comes
from accretion of the difference between the original purchase price of the bond at issuance and the par value of the bond at maturity and is effectively paid at maturity. The market prices of zero coupon bonds generally are more volatile than the
market prices of bonds that pay interest periodically.
119
Annual Investment Management Agreement Approval Process
(Unaudited)
At a meeting held on May 23-25, 2023 (the
“May Meeting”), the Boards of Trustees or Directors, as applicable (collectively, the “Board” and each Trustee or Director, a “Board Member”) of the Funds, which are comprised entirely of Board Members who are not
“interested persons” (as defined under the Investment Company Act of 1940 (the “1940 Act”)) (the “Independent Board Members”), approved, for their respective Fund, the renewal of the management agreement (each, an
“Investment Management Agreement”) with Nuveen Fund Advisors, LLC (the “Adviser”) pursuant to which the Adviser serves as investment adviser to such Fund and the sub-advisory agreement
(each, a “Sub-Advisory Agreement”) with Nuveen Asset Management, LLC (the “Sub-Adviser”) pursuant to which the
Sub-Adviser serves as the sub-adviser to such Fund for an additional one-year term. As the Board is comprised of all Independent
Board Members, the references to the Board and the Independent Board Members are interchangeable.
Following up to an initial
two-year period, the Board considers the renewal of each Investment Management Agreement and Sub-Advisory Agreement on behalf of the applicable Fund on an annual basis.
The Investment Management Agreements and Sub-Advisory Agreements are collectively referred to as the “Advisory Agreements,” and the Adviser and the Sub-Adviser
are collectively, the “Fund Advisers” and each, a “Fund Adviser.”
The Independent Board Members considered the review of the advisory agreements
for the Nuveen funds to be an ongoing process and employed the accumulated information, knowledge and experience the Board Members had gained during their tenure on the boards governing the Nuveen funds and working with the Adviser and the
applicable sub-advisers in their annual review of the advisory agreements. Throughout the year, the Board and its committees meet regularly and, at these meetings, receive regular and/or special reports that
cover an extensive array of topics and information that are relevant to the Board’s annual consideration of the renewal of the advisory agreements for the Nuveen funds. Such information may address, among other things, fund performance and risk
information; the Adviser’s strategic plans; product initiatives for various funds; the review of the funds and investment teams; compliance, regulatory and risk management matters; the trading practices of the various sub-advisers to the Nuveen funds; management of distributions; valuation of securities; fund expenses; securities lending; liquidity management; overall market and regulatory developments; and with respect to closed-end funds, capital management initiatives, institutional ownership, management of leverage financing and the secondary market trading of the closed-end funds and any
actions to address discounts. The Board also seeks to meet periodically with the Nuveen funds’ sub-advisers and/or portfolio teams, when feasible. The presentations, discussions, and meetings throughout
the year also provide a means for the Board to evaluate the level, breadth and quality of services provided by the Adviser and how such services have changed over time in light of new or modified regulatory requirements, changes to market conditions
or other factors.
In connection with its annual consideration of the advisory agreements for the Nuveen funds, the Board, through its independent legal counsel,
requested and received extensive materials and information prepared specifically for its review of such advisory agreements by the Adviser and by Broadridge Financial Solutions, Inc. (“Broadridge”), an independent provider of investment
company data. The materials cover a wide range of topics including, but not limited to, a description of the nature, extent and quality of services provided by the Fund Advisers; a review of product actions advanced in 2022 for the benefit of
particular Nuveen funds and/or the Nuveen fund complex; a review of each sub-adviser to the Nuveen funds and/or the applicable investment team; an analysis of fund performance with a focus on any Nuveen funds
considered performance outliers; an analysis of the fees and expense ratios of the Nuveen funds with a focus on any Nuveen funds considered expense outliers; a review of management fee schedules; a description of portfolio manager compensation; an
overview of the secondary market trading of shares of the Nuveen closed-end funds (including, among other things, an analysis of secondary market performance and commentary regarding the leverage management,
share repurchase and shelf offering programs of Nuveen closed-end funds); a description of the profitability or financial data of Nuveen and the sub-advisers to the
Nuveen funds; and a description of indirect benefits received by the Adviser and the sub-advisers as a result of their relationships with the Nuveen funds. The information prepared specifically for the annual
review supplemented the information provided to the Board and its committees and the evaluations of the Nuveen funds by the Board and its committees during the year. The Board’s review of the advisory agreements for the Nuveen funds is based on
all the information provided to the Board and its committees throughout the year as well as the information prepared specifically with respect to the annual review of such advisory agreements. The performance, fee and expense data and other
information provided by a Fund Adviser, Broadridge or other service providers were not independently verified by the Independent Board Members.
As part of its
review, the Board met on April 11-12, 2023 (the “April Meeting”) to review and discuss, in part, the performance of the Nuveen funds and the Adviser’s evaluation of each sub-adviser to the Nuveen funds and/or its investment teams. At the April Meeting, the Board Members asked questions and requested additional information that was provided for the May Meeting.
The Independent Board Members were advised by independent legal counsel during the annual review process as well as throughout the year, including meeting in executive
sessions with such counsel at which no representatives from the Adviser or the Sub-Adviser were present. In connection with their annual review, the Independent Board Members also received a memorandum from
independent legal counsel outlining their fiduciary duties and legal standards in reviewing the Advisory Agreements, including guidance from court cases evaluating advisory fees.
The Board’s decision to renew the Advisory Agreements was not based on a single identified factor, but rather the decision reflected the comprehensive consideration
of all the information provided to the Board and its committees throughout the year as well as the materials prepared specifically in connection with the renewal process. The contractual arrangements are a result of multiple years of review,
negotiation and information provided in connection with the Board’s annual review of the Nuveen funds’ advisory arrangements and oversight of the Nuveen funds. Each Board Member may have attributed different levels of importance to the
various factors and information considered in connection with the approval process and may place different emphasis on the relevant information year to year in light of, among other things, changing market and economic conditions. A summary of the
principal factors and information, but not all the factors, the Board considered in deciding to renew the Advisory Agreements is set forth below.
120
A. Nature, Extent and Quality of Services
In evaluating the renewal of the
Advisory Agreements, the Independent Board Members received and considered information regarding the nature, extent and quality of the applicable Fund Adviser’s services provided to the respective Fund with particular focus on the services and
enhancements or changes to such services provided during the last year. The Independent Board Members considered the Investment Management Agreements and the Sub-Advisory Agreements separately in the course of
their review. With this approach, they considered the respective roles of the Adviser and the Sub-Adviser in providing services to the Funds.
The Board recognized that the Adviser provides a wide array of management, oversight and administrative services to manage and operate the Nuveen funds and that the scope
and complexity of these services, along with the undertakings required of the Adviser in connection with providing these services, have expanded over time as a result of, among other things, regulatory, market and other developments. The Board noted
the Adviser’s dedication of resources, time, personnel and capital and commitment to continuing to develop improvements and innovations that seek to enhance the Nuveen fund complex and meet the needs of the Nuveen funds in an increasingly
complex regulatory environment. The Board received and reviewed information regarding, among other things, the Adviser’s investment oversight responsibilities, regulatory and compliance services, administrative duties and other services.
The Board considered the breadth and the quality of the services the Adviser and its various teams provide in overseeing the investment management of the Nuveen funds,
including, among other things, overseeing and reviewing the services provided by the various sub-advisers to the Nuveen funds and their investment teams; evaluating fund performance and market conditions;
overseeing operational and investment risks; evaluating investment strategies and recommending any changes thereto; managing liquidity; managing the daily valuation of portfolio securities; overseeing trade execution and securities lending; and
setting and managing distributions consistent with the respective fund’s product design. With respect to closed-end funds, such services also include managing leverage; monitoring asset coverage levels
for leveraged funds and compliance with rating agency criteria; providing capital management and secondary market services (such as implementing common share shelf offerings, capital return programs and common share repurchases); and maintaining a closed-end fund investor relations program. The Board also reviewed the structure of investment personnel compensation of each Fund Adviser and considered whether the structure provides appropriate incentives to
attract and maintain qualified personnel and to act in the best interests of the respective Nuveen fund.
Given the Nuveen funds operate in a
highly regulated industry, the Board further considered the extensive compliance, regulatory and administrative services the Adviser and its various teams provide to manage and operate the Nuveen funds. The Board recognized such services included,
but were not limited to, managing compliance policies; monitoring compliance with applicable policies, laws and regulations; devising internal compliance programs in seeking to enhance compliance with regulatory requirements and creating a framework
to review and assess compliance programs; overseeing sub-adviser compliance testing; preparing compliance training materials; and responding to regulatory requests. The Board reviewed highlights of the various
initiatives Nuveen compliance had taken in 2022 including, among other things, additional due diligence of service providers as their operating environments evolve post-Covid to more hybrid in-person working
arrangements; investments in supporting and expanding international trading capabilities; continuing efforts to enhance policies and controls to address compliance risks including those related to environmental, social and governance
(“ESG”) matters and new regulatory developments or guidance; and establishing and maintaining compliance policies and comprehensive compliance training programs. The Board also considered information regarding the Adviser’s business
continuity, disaster recovery and information security programs and the periodic testing and review of such programs.
In addition to the above functions, the Board
considered the quality and extent of other non-advisory services the Adviser provides including, among other things, various fund administration services (such as preparing, overseeing or assisting with the
preparation of tax and regulatory filings); product management services (such as evaluating and enhancing products and strategies); legal support services; shareholder services and transfer agency function oversight services; and board support and
reporting services. With respect to board support services, the Board reviewed a summary of the annual, quarterly, and special reports the Adviser and/or its affiliates provided to the Board throughout 2022.
The Board further acknowledged various initiatives the Adviser had undertaken or continued in 2022 in seeking to improve the effectiveness of its organization, the Nuveen
funds product line-up as well as particular Nuveen fund(s) through, among other things, rationalizing the product line and gaining efficiencies through mergers, repositionings and liquidations; launching new
funds; reviewing and updating investment policies and benchmarks; reopening certain funds previously closed to new investors; adding or modifying the share classes offered by certain funds; implementing fee waivers and expense cap changes for
certain funds and evaluating and adjusting portfolio management teams as appropriate for various funds; and developing policy positions on a broad range of regulatory proposals that may impact the funds and communicating with lawmakers and other
regulatory authorities to help ensure these positions are represented.
Aside from the services provided, the Board recognized the financial resources of the Adviser
and its affiliates and their willingness to make investments in the technology, personnel and infrastructure to support the Nuveen funds, including maintaining a seed capital budget to support new or existing funds and/or facilitate changes for a
respective fund. The Board noted the benefits to shareholders of investing in a fund that is a part of a large fund complex with a variety of investment disciplines, capabilities, expertise and resources available to navigate and support the Nuveen
funds including during stressed times. The Board recognized the overall reputation and capabilities of the Adviser and its affiliates, the Adviser’s continuing commitment to provide high quality services, its willingness to implement
operational or organizational changes in seeking, among other things, to enhance efficiencies and services to the Nuveen funds and its responsiveness to the Board’s questions and/or concerns raised throughout the year and during the annual
review of advisory agreements. The Board also considered the significant risks borne by the Adviser and its affiliates in connection with their services to the Nuveen funds, including entrepreneurial risks in sponsoring new funds and ongoing risks
with managing the funds such as investment, operational, reputational, regulatory, compliance and litigation risks.
The Board further considered the division of
responsibilities between the Adviser and the Sub-Adviser and recognized that the Sub-Adviser and its investment personnel generally are responsible for the management of
each Fund’s portfolio under the oversight of the Adviser and the Board. The Board considered an analysis of the Sub-Adviser provided by the Adviser which included, among other things, the assets under
management of the applicable investment team and changes thereto, a summary of the applicable investment team and changes to such team, the investment process
121
Annual Investment Management Agreement Approval Process (Unaudited) (continued)
and philosophy of the applicable investment team, the performance of the Nuveen funds sub-advised by the Sub-Adviser over various periods of time and a summary of any significant policy and/or other changes to the Nuveen funds sub-advised by the
Sub-Adviser. The Board further considered at the May Meeting or prior meetings evaluations of the Sub-Adviser’s compliance programs and trade execution. The Board
noted that the Adviser recommended the renewal of the Sub-Advisory Agreements.
Based on its review, the Board determined, in
the exercise of its reasonable business judgment, that it was satisfied with the nature, extent and quality of services provided to the respective Funds under each applicable Advisory Agreement.
B. The Investment Performance of the Funds and Fund Advisers
In evaluating the
quality of the services provided by the Fund Advisers, the Board also considered a variety of investment performance data of the Nuveen funds prepared specifically for the annual review of the advisory agreements as well as the performance data the
Board received throughout the year representing different time periods. In this regard, leading into the May Meeting, the Board reviewed, among other things, Fund performance over the quarter, one-, three- and
five-year periods ending December 31, 2022 and March 31, 2023. In addition, the Board reviewed and discussed performance data at its regularly scheduled quarterly meetings during the year. The Board therefore took into account the
performance data, presentations and discussions (written and oral) that have been provided for the annual review as well as in prior meetings over time in evaluating fund performance, including the Adviser’s analysis of a fund’s
performance with particular focus on performance outliers (both overperformance and underperformance), the factors contributing to performance (including relative to a fund’s benchmark and peers and the impact of market conditions) and any
recommendations or steps that had been taken or were proposed to be taken to address significant performance concerns. In this regard, the Board noted, among other things, that certain Nuveen funds had changes in portfolio managers or other
significant changes to their investment strategies or policies since March 2020, and, as a result, the Board reviewed certain tracking performance data comparing the performance of such funds before and after such changes.
The Board recognized that performance data reflects performance over a specified period which may differ significantly depending on the ending dates selected,
particularly during periods of market volatility. Further, the Board noted that shareholders may evaluate performance based on their own respective holding periods which may differ from the performance periods reviewed by the Board and lead to
differing results.
In its evaluation, the Board reviewed Nuveen fund performance results from different perspectives. In general, subject to certain exceptions, the
Board reviewed both absolute and relative fund performance during the annual review over the various time periods and evaluated performance results in light of a fund’s investment objective(s), strategies and risks. With respect to the relative
performance, the Board considered fund performance in comparison to the performance of peer funds (the “Performance Peer Group”) and recognized and/or customized benchmarks (i.e., generally benchmarks derived from multiple recognized
benchmarks). In reviewing such comparative performance, the Board was cognizant of the inherent limitations of such data which can make meaningful performance comparisons generally difficult. As an illustration, differences in the composition of the
Performance Peer Group, the investment objective(s), strategies and other characteristics of the peers in the Performance Peer Group, the level, type and cost of leverage (if any) of the peers, and the varying sizes of peers all may contribute to
differences in the performance results of a Performance Peer Group compared to the applicable Nuveen fund. With respect to relative performance of a Nuveen fund compared to a benchmark index, differences, among other things, in the investment
objective(s) and strategies of a fund and the benchmark (particularly an actively managed fund that does not directly follow an index) as well as the costs of operating a fund would necessarily contribute to differences in performance results and
limit the value of the comparative performance information. To assist the Board in its review of the comparability of the relative performance, the Adviser has ranked the relevancy of the peer group to the Funds as low, medium or high.
The secondary market trading of shares of the Nuveen closed-end funds also continues to be a priority for the Board given its
importance to shareholders, and therefore the Board and/or its Closed-end Fund committee reviews certain performance data reflecting, among other things, the premiums and discounts at which the shares of the
Nuveen closed-end funds have traded over specified periods throughout the year. In its review, the Board considers, among other things, changes to investment mandates and guidelines, distribution policies,
leverage levels and types; share repurchases and similar capital market actions; and effective communications programs to build greater awareness and deepen understanding of closed-end funds. As applicable,
the Board considered the impact of leverage on a Nuveen fund’s performance. The Board further acknowledged that performance results should include the distribution yields of funds that seek to provide income as part of their investment
objective(s) to shareholders. In this regard, the Board considered that the use of leverage by various funds may have detracted from total return performance of such funds over various periods in current market conditions, but the leverage also was
accretive in helping to provide income.
The Board also evaluated Nuveen fund performance in light of various relevant factors which may include, among other things,
general market conditions, issuer-specific information, asset class information, leverage and fund cash flows. The Board acknowledged that long-term performance could be impacted by even one period of significant outperformance or underperformance
and that a single investment theme could disproportionately affect performance. Further, the Board recognized that the market and economic conditions may significantly impact a fund’s performance, particularly over shorter periods, and such
performance may be more reflective of such economic or market events and not necessarily reflective of management skill. Although the Board reviews short-, intermediate- and longer-term performance data, the Board recognized that longer periods of
performance may reflect full market cycles.
In relation to recent general market conditions, the Board had recognized the general market volatility and
underperformance of the market in 2022 in considering Nuveen fund performance. The Board took into account the Adviser’s assessment of a fund’s performance during the recent period of significant market volatility. In their review from
year to year, the Board Members consider and may place different emphasis on the relevant information in light of changing circumstances in market and economic conditions. In evaluating performance, the Board focused particular attention on funds
with less favorable performance records. However, depending on the facts and circumstances including any differences between the respective fund and its benchmark and/or Performance Peer Group, the Board may be satisfied with a fund’s
performance notwithstanding
122
that its performance may be below that of its benchmark and/or peer group for certain periods. With respect to any funds for which the Board has identified performance
issues, the Board seeks to monitor such funds closely until performance improves, discusses with the Adviser the reasons for such results, considers whether any steps are necessary or appropriate to address such issues, and reviews the results of
any steps undertaken.
The Board’s determinations with respect to each Fund are summarized below.
For Nuveen Municipal Value Fund, Inc., the Board noted that although the Fund’s performance was below the performance of its benchmark for the one-, three- and five-year periods ended December 31, 2022, the Fund ranked in the first quartile of its Performance Peer Group for such periods. In addition, although the Fund’s performance was below the
performance of its benchmark for the one- and three-year periods ended March 31, 2023, the Fund outperformed its benchmark for the five-year period ended March 31, 2023 and ranked in the first
quartile of its Performance Peer Group for the one- and five-year periods ended March 31, 2023 and second quartile for the three-year period ended March 31, 2023. In its review, the Board noted that
the Performance Peer Group was classified as low for relevancy. On the basis of the Board’s ongoing review of investment performance and all relevant factors, including the relative market conditions during certain reporting periods, the
Fund’s investment objective(s) and management’s discussion of performance, the Board concluded that in light of these factors, the Fund’s performance supported renewal of the Advisory Agreements.
For Nuveen AMT-Free Municipal Value Fund, the Board noted that although the Fund’s performance was below the performance of
its benchmark for the one-, three- and five-year periods ended December 31, 2022, the Fund ranked in third quartile of its Performance Peer Group for such periods. Further, although the Fund’s
performance was below the performance of its benchmark for the one-year period ended March 31, 2023, the Fund outperformed its benchmark for the three- and five-year periods ended March 31, 2023 and
ranked in the third quartile of its Performance Peer Group for the one-, three- and five-year periods ended March 31, 2023. In its review, the Board noted that the Performance Peer Group was classified as
low for relevancy. On the basis of the Board’s ongoing review of investment performance and all relevant factors, including the relative market conditions during certain reporting periods, the Fund’s investment objective(s) and
management’s discussion of performance, the Board concluded that in light of these factors, the Fund’s performance supported renewal of the Advisory Agreements.
For Nuveen Municipal Income Fund, Inc., the Board noted that the Fund’s performance was below the performance of its benchmark and the Fund ranked in the fourth
quartile of its Performance Peer Group for the one-, three- and five-year periods ended December 31, 2022 and March 31, 2023. The Board took into account management’s discussion of the
Fund’s performance, including the reasons for the Fund’s challenged performance for certain periods, and the Fund’s more recent improved performance for the quarter ended March 31, 2023. In its review, the Board noted that the
Performance Peer Group was classified as low for relevancy. On the basis of the Board’s ongoing review of investment performance and all relevant factors, including the relative market conditions during certain reporting periods, the
Fund’s investment objective(s) and management’s discussion of performance, the Board concluded that in light of these factors, the Fund’s performance supported renewal of the Advisory Agreements.
C. Fees, Expenses and Profitability
As part of its annual review, the Board generally reviewed, among other things, with respect to the Nuveen closed-end funds, the
contractual management fee and actual management fee (i.e., the management fee after taking into consideration fee waivers and/or expense reimbursements, if any) paid by a fund to the Adviser in light of the nature, extent and quality of the
services provided. The Board also considered the total operating expense ratio of a fund (after any fee waivers and/or expense reimbursements). More specifically, the Independent Board Members reviewed, among other things, each Nuveen closed-end fund’s actual management fee rate (after fee waivers and/or expense reimbursements, if any) and net total expense ratio in relation to those of a comparable universe of funds (the “Peer
Universe”) established by Broadridge. The Independent Board Members reviewed the methodology Broadridge employed to establish its Peer Universe and recognized that differences between the applicable fund and its respective Peer Universe as well
as changes to the composition of the Peer Universe from year to year may limit some of the value of the comparative data. The Independent Board Members take these limitations and differences into account when reviewing comparative peer data. The
Independent Board Members also considered a fund’s operating expense ratio as it more directly reflected the shareholder’s costs in investing in the respective fund.
In their review, the Independent Board Members considered, in particular, each Nuveen fund with a net total expense ratio (excluding investment-related costs of leverage
for closed-end funds) of six basis points or higher compared to that of its peer average (each, an “Expense Outlier Fund”) and an analysis as to the factors contributing to each such fund’s
higher relative net total expense ratio. In addition, although the Board reviewed a fund’s total net expenses both including and excluding investment-related expenses (i.e., leverage costs) for certain of the
closed-end funds, the Board recognized that leverage expenses will vary across funds and in comparison to peers because of differences in the forms and terms of leverage employed by the respective fund.
Accordingly, in reviewing the comparative data between a fund and its peers, the Board generally considered the fund’s net total expense ratio and fees (excluding leverage costs and leveraged assets for the
closed-end funds) to be higher if they were over 10 basis points higher, slightly higher if they were 6 to 10 basis points higher, in line if they were within approximately 5 basis points higher than the peer
average and below if they were below the peer average of the Peer Universe.
The Independent Board Members also considered, in relevant part, a Nuveen fund’s
management fee and net total expense ratio in light of its performance history, including reviewing certain funds identified by the Adviser and/or the Board as having a higher net total expense ratio or management fee compared to their respective
peers coupled with experiencing periods of challenged performance and considering the reasons for such comparative positions. In addition, with respect to closed-end funds that utilize leverage, the
Independent Board Members recognized that certain assets attributable to a fund’s use of leverage may be included in the amount of assets upon which the advisory fee or sub-advisory fee is calculated. The
Independent Board Members acknowledged the fact that a decision to employ leverage or increase a fund’s leverage which has the effect, all other things being equal, of increasing the assets upon which an advisory or sub-advisory fee is based (and, in turn, increasing the Adviser’s and applicable sub-adviser’s management fees), means that the Adviser and applicable sub-adviser may have a conflict of interest in determining
123
Annual Investment Management Agreement Approval Process (Unaudited) (continued)
whether to use or increase leverage. The Independent Board Members recognized, however, that the Adviser and sub-advisers would
seek to manage the potential conflict by recommending to the Board to leverage the applicable fund or increase such leverage when the Adviser and/or sub-adviser, as applicable, has determined that such action
would be in the best interests of the respective fund and its common shareholders and by periodically reviewing with the Board the fund’s performance and the impact of the use of leverage on that performance.
In their review of the fee arrangements for the Nuveen funds, the Independent Board Members also considered the management fee schedules, including the complex-wide and
fund-level breakpoint schedules, as applicable. The Board noted that across the Nuveen fund complex, the complex-wide fee breakpoints reduced fees by approximately $62.4 million and fund-level breakpoints reduced fees by approximately
$76.1 million in 2022.
With respect to the Sub-Adviser, the Board also considered, among other things, the sub-advisory fee schedule paid to the Sub-Adviser in light of the sub-advisory services provided to the respective Fund and comparative
data of the fees the Sub-Adviser charges to other clients, if any. In its review, the Board recognized that the compensation paid to the Sub-Adviser is the
responsibility of the Adviser, not the Funds.
The Independent Board Members noted that each Fund had an actual management fee and a net total expense ratio that were
below the respective peer averages.
Based on its review of the information provided, the Board determined that each Fund’s management fees (as applicable) to a
Fund Adviser were reasonable in light of the nature, extent and quality of services provided to the Fund.
| |
2. |
Comparisons with the Fees of Other Clients |
In evaluating the appropriateness of fees, the Board also considered information regarding the fee rates the respective Fund Advisers charged to certain other types of
clients and the type of services provided to these other clients. With respect to the municipal Nuveen funds, such other clients may include retail and institutional municipal managed accounts sub-advised by
the Sub-Adviser, municipal exchange-traded funds (“ETFs”) sub-advised by the Sub-Adviser that are offered by another
fund complex, municipal managed accounts offered by an unaffiliated adviser and certain municipal private limited partnerships offered by Nuveen. The Board reviewed, among other things, the fee range and average fee of municipal retail advisory
accounts and municipal institutional accounts, the sub-advisory fee the Sub-Adviser received for serving as sub-adviser to
certain municipal ETFs offered outside the Nuveen family and the management fee rates paid by the municipal private limited partnerships operated by Nuveen.
In
considering the comparative fee data, the Board recognized that differences, including but not limited to, the amount, type and level of services provided by the Adviser to the Nuveen funds compared to that provided to other clients as well as
differences in investment policies; eligible portfolio assets and the manner of managing such assets; product structure; investor profiles; account sizes; and regulatory requirements contribute to the variations in the fee schedules. The Board
acknowledged the wide range of services in addition to investment management that the Adviser had provided to the Nuveen funds compared to other types of clients as well as the increased entrepreneurial, legal and regulatory risks that the Adviser
incurs in sponsoring and managing the Nuveen funds. In general, higher fee levels reflect higher levels of service provided by the Adviser, increased investment management complexity, greater product management requirements, and higher levels of
business risk or some combination of these factors. The Board further considered that the Sub-Adviser’s fee is essentially for portfolio management services and therefore more comparable to the fees it
receives for retail wrap accounts and other external sub-advisory mandates. The Board concluded the varying levels of fees were justified given, among other things, the more extensive services, regulatory
requirements and legal liabilities, and the entrepreneurial, legal and regulatory risks incurred in sponsoring and advising a registered investment company compared to that required in advising other types of clients.
| |
3. |
Profitability of Fund Advisers |
In their review, the Independent Board Members considered estimated profitability information of Nuveen as a result of its advisory services to the Nuveen funds as well
as profitability data of other publicly traded asset management firms. Such profitability information included, among other things, gross and net revenue margins (excluding distribution) of Nuveen Investments, Inc. (“Nuveen Investments”)
for services to the Nuveen funds on a pre-tax and after-tax basis for the 2022 and 2021 calendar years as well as the revenues earned (less any expense
reimbursements/fee waivers) and expenses incurred by Nuveen Investments for its advisory activities to the Nuveen funds (excluding distribution and certain other expenses) for the 2022 and 2021 calendar years. The Independent Board Members also
considered a summary of some of the key factors that impacted Nuveen’s profitability in 2022. In addition, the Board reviewed the revenues, expenses and operating margin (pre- and after-tax) the Adviser derived from its ETF product line for the 2022 and 2021 calendar years.
In
developing the profitability data of the Adviser for its advisory services to the Nuveen funds, the Independent Board Members recognized the subjective nature of calculating profitability as the information is not audited and is necessarily
dependent on cost allocation methodologies to allocate expenses throughout the complex and among the various advisory products. Given there is no perfect expense allocation methodology and that other reasonable and valid allocation methodologies
could be employed and could lead to significantly different results, the Board reviewed, among other things, a description of the cost allocation methodologies employed to develop the financial information, a summary of the history of changes to the
methodology over the years from 2010 through 2022, and a historical expense analysis of Nuveen Investments’ revenues, expenses and pre-tax net revenue margins derived from its advisory services to the
Nuveen funds (excluding distribution) for the calendar years from 2017 through 2022. The Board had also appointed four Independent Board Members to serve as the Board’s liaisons, with the assistance of independent counsel, to meet with
representatives of the Adviser and review the development of the profitability data and to report to the full Board.
124
In addition, the Board considered certain comparative operating margin data. In this regard, the Board reviewed the operating margins of Nuveen Investments compared to
the adjusted operating margins of a peer group of asset management firms with publicly available data and the most comparable assets under management (based on asset size and asset composition) to Nuveen. The Board recognized that the operating
margins of the peers were adjusted generally to address that certain services provided by the peers were not provided by Nuveen. The Board also reviewed, among other things, the net revenue margins (pre-tax)
of Nuveen Investments on a company-wide basis and the net revenue margins (pre-tax) of Nuveen Investments derived from its services to the Nuveen funds only (including and excluding distribution) compared to
the adjusted operating margins of the peer group for each calendar year from 2012 to 2022. Although the total company operating margins of Nuveen Investments were in the bottom half of the peer group range for 2022 and 2021, the Independent Board
Members recognized the limitations of the comparative data given that peer data is not generally public and the calculation of profitability is subjective and affected by numerous factors (such as types of funds a peer manages, its business mix, its
cost of capital, the numerous assumptions underlying the methodology used to allocate expenses and other factors) that can have a significant impact on the results.
Aside from Nuveen’s profitability, the Board recognized that the Adviser is a subsidiary of Nuveen, LLC, the investment management arm of Teachers Insurance and
Annuity Association of America (“TIAA”). Accordingly, the Board also reviewed a balance sheet for TIAA reflecting its assets, liabilities and capital and contingency reserves for the 2022 and 2021 calendar years to consider the financial
strength of TIAA. The Board recognized the benefit of an investment adviser and its parent with significant resources, particularly during periods of market volatility. The Board also noted the reinvestments Nuveen, its parent and/or other
affiliates made into its business through, among other things, the investment of seed capital in certain Nuveen funds and continued investments in enhancements to technological capabilities.
In addition to Nuveen, the Independent Board Members considered the profitability of the Sub-Adviser from its relationships with
the respective Nuveen funds. In this regard, the Independent Board Members reviewed, among other things, the Sub-Adviser’s revenues, expenses and net revenue margins
(pre- and after-tax) for its advisory activities to the respective Nuveen funds for the calendar years ended December 31, 2022 and December 31, 2021. The
Independent Board Members also reviewed a profitability analysis reflecting the revenues, expenses and revenue margin (pre- and after-tax) by asset type for the Sub-Adviser for the calendar years ending December 31, 2022 and December 31, 2021.
In evaluating the reasonableness of
the compensation, the Independent Board Members also considered any other ancillary benefits derived by the respective Fund Adviser from its relationship with the Nuveen funds as discussed in further detail below.
Based on a consideration of all the information provided, the Board noted that Nuveen’s and the Sub-Adviser’s level of
profitability was acceptable and not unreasonable in light of the services provided.
D. Economies of Scale and Whether Fee Levels Reflect These Economies of
Scale
The Board considered whether there have been economies of scale with respect to the management of the Nuveen funds, whether these economies of scale have
been appropriately shared with the funds and whether there is potential for realization of further economies of scale. Although the Board recognized that economies of scale are difficult to measure with any precision and certain expenses may not
decline with a rise in assets, the Board considered that Nuveen shares the benefits of economies of scale, if any, in a number of ways including through the use of breakpoints in the management fee schedule, fee waivers and/or expense limitations,
the pricing of funds at scale at inception and investments in Nuveen’s business which can enhance the services provided to the funds for the fees paid. In this regard, the Board recognized that the management fee of the Adviser is generally
comprised of a fund-level component and a complex-level component each with its own breakpoint schedule, subject to certain exceptions. The Board reviewed the fund-level and complex-level fee schedules. With this structure, the Board noted that the
complex-level breakpoint schedule is designed to deliver the benefits of economies of scale to shareholders when the eligible assets in the complex pass certain thresholds even if the assets of a particular fund are unchanged or have declined, and
the fund-level breakpoint schedules are designed to share economies of scale with shareholders if the particular fund grows. The Board noted, however, that although closed-end funds may make additional share
offerings from time to time, the closed-end funds have a more limited ability to increase their assets because the growth of their assets will occur primarily from the appreciation of their investment
portfolios.
As noted above, the Independent Board Members also recognized the continued reinvestment in Nuveen’s business to enhance its capabilities and
services to the benefit of its various clients. The Board understood that many of these investments in the Nuveen business were not specific to individual Nuveen funds but rather incurred across of a variety of products and services pursuant to
which the family of Nuveen funds as a whole may benefit. In addition, the Board also considered that Nuveen has provided, without raising advisory fees to the Nuveen funds, certain additional services, including, but not limited to, services
required by new regulations and regulatory interpretations, and this was also a means of sharing economies of scale with the funds and their shareholders.
Based on
its review, the Board was satisfied that the current fee arrangements together with the reinvestment in Nuveen’s business appropriately shared any economies of scale with shareholders.
E. Indirect Benefits
The Independent Board Members received and considered
information regarding other benefits the respective Fund Adviser or its affiliates may receive as a result of their relationship with the Nuveen funds. The Board acknowledged that an affiliate of the Adviser may receive compensation for serving as a
co-manager in the initial public offerings of new Nuveen closed-end funds (if any) and for serving as an underwriter on shelf offerings of existing Nuveen closed-end funds and reviewed the amounts paid for such services, if any, in 2021 and 2022.
In addition, the Independent Board
Members noted that the various sub-advisers to the Nuveen funds do not generally benefit from soft dollar arrangements with respect to Nuveen fund portfolio transactions.
125
Annual Investment Management Agreement Approval Process (Unaudited) (continued)
Based on its review, the Board concluded that any indirect benefits received by a Fund Adviser as a result of its relationship with the Funds were reasonable in light of
the services provided.
F. Other Considerations
The Independent Board
Members did not identify any single factor discussed previously as all-important or controlling. The Independent Board Members concluded that the terms of each Advisory Agreement were reasonable, that the
respective Fund Adviser’s fees were reasonable in light of the services provided to each Fund and that the Advisory Agreements be renewed for an additional one-year period.
126
Board Members & Officers
(Unaudited)
The management of the Funds, including general supervision of the duties
performed for the Funds by the Adviser, is the responsibility of the Board of Trustees of the Funds. None of the trustees who are not “interested” persons of the Funds (referred to herein as “independent board members”) has ever
been a director or employee of, or consultant to, Nuveen or its affiliates. The names and business addresses of the trustees and officers of the Funds, their principal occupations and other affiliations during the past five years, the number of
portfolios each Trustee oversees and other directorships they hold are set forth below.
|
|
|
|
|
|
|
|
|
|
|
| Name,
Year of Birth & Address |
|
Position(s) Held
with the Funds |
|
Year First
Elected or Appointed
and Term(1) |
|
Principal Occupation(s)
Including other Directorships During Past 5 Years |
|
Number of
Portfolios in Fund
Complex Overseen By
Board Member |
|
|
|
|
| Independent Trustees: |
|
|
|
|
|
|
| |
|
|
|
|
| Terence J. Toth 1959
333 W. Wacker Drive Chicago, IL 60606 |
|
Chair and Board Member |
|
2008
Class II |
|
Formerly, a Co-Founding Partner, Promus Capital (investment advisory firm) (2008-2017); formerly, Director, Quality Control Corporation (manufacturing)
(2012-2021); Chair of the Board of the Kehrein Center for the Arts (philanthropy) (since 2021); member: Catalyst Schools of Chicago Board (since 2008) and Mather Foundation Board (philanthropy) (since 2012), formerly, Chair of its Investment
Committee (2017-2022); formerly, Member, Chicago Fellowship Board (philanthropy) (2005-2016); formerly, Director, Fulcrum IT Services LLC (information technology services firm to government entities) (2010-2019); formerly, Director, LogicMark LLC
(health services) (2012-2016); formerly, Director, Legal & General Investment Management America, Inc. (asset management) (2008-2013); formerly, CEO and President, Northern Trust Global Investments (financial services) (2004-2007);
Executive Vice President, Quantitative Management & Securities Lending (2000-2004); prior thereto, various positions with Northern Trust Company (financial services) (since 1994); formerly, Member, Northern Trust Mutual Funds Board
(2005-2007), Northern Trust Global Investments Board (2004-2007), Northern Trust Japan Board (2004-2007), Northern Trust Securities Inc. Board (2003- 2007) and Northern Trust Hong Kong Board (1997-2004). |
|
|
132 |
|
| |
|
|
|
|
| Jack B. Evans 1948
333 W. Wacker Drive Chicago, IL 60606 |
|
Board Member |
|
1999
Class III |
|
Chairman (since 2019), formerly, President (1996-2019), The Hall-Perrine Foundation, (private philanthropic corporation); Life Trustee of Coe College and the Iowa College Foundation; formerly, Member
and President Pro-Tem of the Board of Regents for the State of Iowa University System (2007- 2013); Director and Chairman (2009-2021), United Fire Group, a publicly held company; Director, Public Member,
American Board of Orthopaedic Surgery (2015-2020); Director (2000-2004), Alliant Energy; Director (1996-2015), The Gazette Company (media and publishing); Director (1997- 2003), Federal Reserve Bank of Chicago; President and Chief Operating Officer
(1972-1995), SCI Financial Group, Inc., (regional financial services firm). |
|
|
132 |
|
| |
|
|
|
|
| William C. Hunter 1948
333 W. Wacker Drive Chicago, IL 60606 |
|
Board Member |
|
2003
Class I |
|
Dean Emeritus, formerly, Dean, Tippie College of Business, University of Iowa (2006-2012); Director of Wellmark, Inc. (since 2009); past Director (2005-2015), and past President (2010- 2014) Beta
Gamma Sigma, Inc., The International Business Honor Society; formerly, Director (2004-2018) of Xerox Corporation; formerly, Dean and Distinguished Professor of Finance, School of Business at the University of Connecticut (2003-2006); previously,
Senior Vice President and Director of Research at the Federal Reserve Bank of Chicago (1995-2003); formerly, Director (1997-2007), Credit Research Center at Georgetown University. |
|
|
132 |
|
127
Board Members & Officers (Unaudited) (continued)
|
|
|
|
|
|
|
|
|
| Name,
Year of Birth & Address |
|
Position(s) Held
with the Funds |
|
Year First
Elected or Appointed
and Term(1) |
|
Principal Occupation(s)
Including other Directorships During Past 5 Years |
|
Number of
Portfolios in Fund
Complex Overseen By
Board Member |
| |
|
|
|
|
| Amy B. R. Lancellotta 1959
333 W. Wacker Drive Chicago, IL 60606 |
|
Board Member |
|
2021
Class II |
|
Formerly, Managing Director, Independent Directors Council (IDC) (supports the fund independent director community and is part of the Investment Company Institute (ICI), which represents regulated
investment companies) (2006-2019); formerly, various positions with ICI (1989-2006); President (since 2023) and Member (since 2020) of the Board of Directors, Jewish Coalition Against Domestic Abuse (JCADA). |
|
132 |
| |
|
|
|
|
| Joanne T. Medero 1954
333 W. Wacker Drive Chicago, IL 60606 |
|
Board Member |
|
2021
Class III |
|
Formerly, Managing Director, Government Relations and Public Policy (2009-2020) and Senior Advisor to the Vice Chairman (2018-2020), BlackRock, Inc. (global investment management firm); formerly,
Managing Director, Global Head of Government Relations and Public Policy, Barclays Group (IBIM) (investment banking, investment management and wealth management businesses) (2006-2009); formerly, Managing Director, Global General Counsel and
Corporate Secretary, Barclays Global Investors (global investment management firm) (1996-2006); formerly, Partner, Orrick, Herrington & Sutcliffe LLP (law firm) (1993-1995); formerly, General Counsel, Commodity Futures Trading Commission
(government agency overseeing U.S. derivatives markets) (1989-1993); formerly, Deputy Associate Director/Associate Director for Legal and Financial Affairs, Office of Presidential Personnel, The White House (1986-1989); Member of the Board of
Directors, Baltic-American Freedom Foundation (seeks to provide opportunities for citizens of the Baltic states to gain education and professional development through exchanges in the U.S.) (since 2019). |
|
132 |
| |
|
|
|
|
| Albin F. Moschner 1952
333 W. Wacker Drive Chicago, IL 60606 |
|
Board Member |
|
2016
Class III |
|
Founder and Chief Executive Officer, Northcroft Partners, LLC, (management consulting) (since 2012); formerly, Chairman (2019), and Director (2012-2019), USA Technologies, Inc., (provider of solutions
and services to facilitate electronic payment transactions); formerly, Director, Wintrust Financial Corporation (1996-2016); previously, held positions at Leap Wireless International, Inc. (consumer wireless services), including Consultant
(2011-2012), Chief Operating Officer (2008-2011), and Chief Marketing Officer (2004-2008); formerly, President, Verizon Card Services division of Verizon Communications, Inc. (2000-2003); formerly, President, One Point Services at One Point
Communications (telecommunication services) (1999-2000); formerly, Vice Chairman of the Board, Diba, Incorporated (internet technology provider) (1996-1997); formerly, various executive positions (1991-1996) including Chief Executive Officer
(1995-1996) of Zenith Electronics Corporation (consumer electronics). |
|
132 |
| |
|
|
|
|
| John K. Nelson 1962
333 W. Wacker Drive Chicago, IL 60606 |
|
Board Member |
|
2013
Class II |
|
Member of Board of Directors of Core12 LLC. (private firm which develops branding, marketing and communications strategies for clients) (since 2008); served The President’s Council of Fordham
University (2010-2019) and previously a Director of the Curran Center for Catholic American Studies (2009-2018); formerly, senior external advisor to the Financial Services practice of Deloitte Consulting LLP. (2012-2014); former Chair of the Board
of Trustees of Marian University (2010-2014 as trustee, 2011-2014 as Chair); formerly Chief Executive Officer of ABN AMRO Bank N.V., North America, and Global Head of the Financial Markets Division (2007-2008), with various executive leadership
roles in ABN AMRO Bank N.V. between 1996 and 2007. |
|
132 |
128
|
|
|
|
|
|
|
|
|
|
|
| Name,
Year of Birth & Address |
|
Position(s) Held
with the Funds |
|
Year First
Elected or Appointed
and Term(1) |
|
Principal Occupation(s)
Including other Directorships During Past 5 Years |
|
Number of
Portfolios in Fund
Complex Overseen By
Board Member |
|
| |
|
|
|
|
| Matthew Thornton III 1958
333 W. Wacker Drive Chicago, IL 60606 |
|
Board Member |
|
2020
Class III |
|
Formerly, Executive Vice President and Chief Operating Officer (2018-2019), FedEx Freight Corporation, a subsidiary of FedEx Corporation (FedEx) (provider of transportation, e-commerce and business services through its portfolio of companies); formerly, Senior Vice President, U.S. Operations (2006-2018), Federal Express Corporation, a subsidiary of FedEx; formerly Member of the Board of
Directors (2012-2018), Safe Kids Worldwide® (a non-profit organization dedicated to preventing childhood injuries). Member of the Board of Directors
(since 2014), The Sherwin-Williams Company (develops, manufactures, distributes and sells paints, coatings and related products); Director (since 2020), Crown Castle International (provider of communications infrastructure). |
|
|
132 |
|
| |
|
|
|
|
| Margaret L. Wolff 1955
333 W. Wacker Drive Chicago, IL 60606 |
|
Board Member |
|
2016
Class I |
|
Formerly, member of the Board of Directors (2013-2017) of Travelers Insurance Company of Canada and The Dominion of Canada General Insurance Company (each, a part of Travelers Canada, the Canadian
operation of The Travelers Companies, Inc.); formerly, Of Counsel, Skadden, Arps, Slate, Meagher & Flom LLP (Mergers & Acquisitions Group) (legal services) (2005- 2014); Member of the Board of Trustees of New York-Presbyterian
Hospital (since 2005); Member (since 2004) formerly, Chair (2015- 2022) of the Board of Trustees of The John A. Hartford Foundation (a philanthropy dedicated to improving the care of older adults); formerly, Member (2005-2015) and Vice Chair
(2011-2015) of the Board of Trustees of Mt. Holyoke College. |
|
|
132 |
|
| |
|
|
|
|
| Robert L. Young 1963
333 W. Wacker Drive Chicago, IL 60606 |
|
Board Member |
|
2017 Class I |
|
Formerly, Chief Operating Officer and Director, J.P. Morgan Investment Management Inc. (financial services) (2010-2016); formerly, President and Principal Executive Officer (2013-2016), and Senior Vice
President and Chief Operating Officer (2005-2010), of J.P. Morgan Funds; formerly, Director and various officer positions for J.P. Morgan Investment Management Inc. (formerly, JPMorgan Funds Management, Inc. and formerly, One Group Administrative
Services) and JPMorgan Distribution Services, Inc. (financial services) (formerly, One Group Dealer Services, Inc.) (1999-2017). |
|
|
132 |
|
|
|
|
|
|
| Name,
Year of Birth & Address |
|
Position(s) Held
with the Funds |
|
Year First
Elected or
Appointed(2) |
|
Principal Occupation(s)
Including other Directorships During Past 5 Years |
|
|
|
|
|
|
|
|
| Officers of the Funds: |
|
|
|
|
|
|
|
|
|
|
| |
|
|
|
| David J. Lamb 1963
333 W. Wacker Drive Chicago, IL 60606 |
|
Chief Administrative Officer |
|
2015 |
|
Managing Director of Nuveen Fund Advisors, LLC (since 2019); Senior Managing Director (since 2021), formerly, Managing Director (2020-2021) of Nuveen Securities, LLC; Senior Managing Director
(since 2021), formerly, Managing Director (2017-2021), Senior Vice President of Nuveen (2006-2017). |
|
| |
|
|
|
| Brett E. Black 1972
333 W. Wacker Drive Chicago, IL 60606 |
|
Vice President and Chief Compliance Officer |
|
2022 |
|
Managing Director, Chief Compliance Officer of Nuveen (since 2022); formerly, Vice President (2014-2022), Chief Compliance Officer and Anti-Money Laundering Compliance Officer (2017-2022),
Deputy Chief Compliance Officer (2014-2017) of BMO Funds, Inc. |
|
129
Board Members & Officers (Unaudited) (continued)
|
|
|
|
|
|
|
|
|
|
|
|
|
|
| Name,
Year of Birth & Address |
|
Position(s) Held
with the Funds |
|
Year First
Elected or Appointed(2) |
|
Principal Occupation(s)
Including other Directorships During Past 5 Years |
|
|
| |
|
|
|
| Mark J. Czarniecki 1979
901 Marquette Avenue Minneapolis, MN 55402 |
|
Vice President and Assistant Secretary |
|
2013 |
|
Managing Director (since 2022), formerly, Vice President (2016-2022), and Assistant Secretary (since 2016) of Nuveen Securities, LLC; Managing Director (since 2022), formerly, Vice President
(2017-2022) and Assistant Secretary (since 2017) of Nuveen Fund Advisors, LLC; Managing Director and Associate General Counsel (since January 2022), formerly, Vice President and Associate General Counsel of Nuveen (2013-2021); Managing Director
(since 2022), formerly, Vice President (2018-2022), Assistant Secretary and Associate General Counsel (since 2018) of Nuveen Asset Management, LLC; Managing Director, Associate General Counsel and Assistant Secretary of Teachers Advisors, LLC and
TIAA-CREF Investment Management, LLC (since 2023). |
| |
|
|
|
| Diana R. Gonzalez 1978
8500 Andrew Carnegie Blvd. Charlotte, NC 28262 |
|
Vice President and Assistant Secretary |
|
2017 |
|
Vice President and Assistant Secretary of Nuveen Fund Advisors, LLC (since 2017); Vice President and Associate General Counsel and Assistant Secretary of Nuveen Asset Management, LLC (since
2022); Vice President, Associate General Counsel and Assistant Secretary of Teachers Advisors, LLC and TIAA-CREF Investment Management, LLC (since 2023); Vice President and Associate General Counsel of Nuveen (since 2017); formerly, Associate
General Counsel of Jackson National Asset Management (2012-2017). |
| |
|
|
|
| Nathaniel T. Jones 1979
333 W. Wacker Drive Chicago, IL 60606 |
|
Vice President and Treasurer |
|
2016 |
|
Senior Managing Director (since 2021), formerly, Managing Director (2017-2021), Senior Vice President (2016-2017) of Nuveen; Managing Director (since 2015) of Nuveen Fund Advisors, LLC;
Chartered Financial Analyst. |
| |
|
|
|
| Brian H. Lawrence 1982 8500 Andrew
Carnegie Blvd. Charlotte, NC 28262 |
|
Vice President and Assistant Secretary |
|
2023 |
|
Vice President and Associate General Counsel of Nuveen (since 2023); Vice President, Associate General Counsel and Assistant Secretary (since 2023) of Teachers Advisors, LLC and TIAA-CREF
Investment Management, LLC; formerly Corporate Counsel of Franklin Templeton (2018-2022). |
| |
|
|
|
| Tina M. Lazar 1961
333 W. Wacker Drive Chicago, IL 60606 |
|
Vice President |
|
2002 |
|
Managing Director (since 2017), formerly, Senior Vice President (2014-2017) of Nuveen Securities, LLC. |
| |
|
|
|
| Brian J. Lockhart 1974
333 W. Wacker Drive Chicago, IL 60606 |
|
Vice President |
|
2019 |
|
Managing Director (since 2019) of Nuveen Fund Advisors, LLC; Senior Managing Director (since 2021), formerly, Managing Director (2017-2021), Vice President (2010-2017) of Nuveen; Head of
Investment Oversight (since 2017), formerly, Team Leader of Manager Oversight (2015-2017); Chartered Financial Analyst and Certified Financial Risk Manager. |
| |
|
|
|
| John M. McCann 1975
8500 Andrew Carnegie Blvd. Charlotte, NC 28262 |
|
Vice President and Assistant Secretary |
|
2022 |
|
Managing Director (since 2021), General Counsel and Secretary (since 2023), formerly, Assistant Secretary (2021-2023), of Nuveen Fund Advisors, LLC; Managing Director, Associate General
Counsel and Assistant Secretary of Nuveen Asset Management, LLC (since 2021); Managing Director (since 2021) and Assistant Secretary (since 2016) of TIAA SMA Strategies LLC; Managing Director (since 2019, formerly, Vice President and Director),
Associate General Counsel and Assistant Secretary of College Retirement Equities Fund, TIAA Separate Account VA-1, TIAA-CREF Funds and TIAA-CREF Life Funds; Managing Director (since 2018), formerly, Vice
President and Director, Associate General Counsel and Assistant Secretary of Teachers Insurance and Annuity Association of America, Teacher Advisors LLC and TIAA-CREF Investment Management, LLC; Managing Director (since 2022), formerly, Vice
President (2017-2022), Associate General Counsel and Assistant Secretary (since 2011) of Nuveen Alternative Advisors LLC; General Counsel and Assistant Secretary of Covariance Capital Management, Inc.
(2014-2017). |
130
|
|
|
|
|
|
|
|
|
|
|
|
|
| Name,
Year of Birth & Address |
|
Position(s) Held
with the Funds |
|
Year First
Elected or Appointed(2) |
|
Principal Occupation(s)
Including other Directorships During Past 5 Years |
| |
|
|
|
| Kevin J. McCarthy 1966 333 W. Wacker
Drive Chicago, IL 60606 |
|
Vice President and Assistant Secretary |
|
2007 |
|
Executive Vice President (since 2022) and Secretary and General Counsel (since 2016) of Nuveen Investments, Inc., formerly, Senior Managing Director (2017- 2022); Executive Vice President
(since 2023) and Assistant Secretary (since 2008) of Nuveen Securities, LLC, formerly Senior Managing Director (2017-2023); Executive Vice President and Assistant Secretary (since 2023) of Nuveen Fund Advisors, LLC, formerly, Senior Managing
Director (2017-2023), Secretary (2016-2023) and Co- General Counsel (2011-2020); Executive Vice President (since 2023) and Secretary (since 2016) of Nuveen Asset Management, LLC, formerly, Senior Managing Director (2017-2023) and Associate General
Counsel (2011-2020); Executive Vice President (since 2021) and Secretary (since 2023) of Teachers Advisors, LLC, formerly, General Counsel and Assistant Secretary (2021-2023); Executive Vice President (since 2017) and Secretary (since 2023) of
TIAA-CREF Investment Management, LLC, formerly General Counsel and Assistant Secretary (2017- 2023); formerly, Vice President (2007-2021) and Secretary (2016-2021), of NWQ Investment Management Company, LLC and Santa Barbara Asset Management, LLC;
Vice President and Secretary of Winslow Capital Management, LLC (since 2010); Executive Vice President (since 2023) and Secretary (since 2016) of Nuveen Alternative Investments, LLC, formerly Senior Managing Director (2017-2023). |
| |
|
|
|
| Jon Scott Meissner 1973 8500 Andrew
Carnegie Blvd. Charlotte, NC 28262 |
|
Vice President and Assistant Secretary |
|
2019 |
|
Managing Director, Mutual Fund Tax and Expense Administration (since 2022), formerly, Managing Director of Mutual Fund Tax and Financial Reporting groups (2017-2022), at Nuveen; Managing
Director of Nuveen Fund Advisors, LLC (since 2019); Managing Director (since 2021), formerly, Senior Director (2016-2021), of Teachers Advisors, LLC and TIAA-CREF Investment Management, LLC; Managing Director, Mutual Fund Tax and Expense
Administration (since 2022), formerly, Senior Director Mutual Fund Taxation (2015-2022), to the TIAA-CREF Funds, the TIAA- CREF Life Funds, the TIAA Separate Account VA-1 and the CREF Accounts; has held
various positions with TIAA since 2004. |
| |
|
|
|
| William A. Siffermann 1975 333 W. Wacker
Drive Chicago, IL 60606 |
|
Vice President |
|
2017 |
|
Managing Director (since 2017), formerly Senior Vice President (2016-2017) of Nuveen. |
| |
|
|
|
| E. Scott Wickerham 1973 8500 Andrew
Carnegie Blvd. Charlotte, NC 28262 |
|
Vice President and Controller |
|
2019 |
|
Senior Managing Director, Head of Public Investment Finance at Nuveen (since 2019), formerly, Managing Director; Senior Managing Director (since 2019) of Nuveen Fund Advisors, LLC; Senior
Managing Director (since 2022) of Nuveen Asset Management, LLC; Senior Managing Director of Teachers Advisors, LLC (since 2021) and TIAA-CREF Investment Management, LLC (since 2016); Principal Financial Officer, Principal Accounting Officer and
Treasurer (since 2017) of the TIAA-CREF Funds, the TIAA-CREF Life Funds, the TIAA Separate Account VA-1 and Principal Financial Officer, Principal Accounting Officer (since 2020) and Treasurer (since 2017) of
the CREF Accounts; has held various positions with TIAA since 2006. |
| |
|
|
|
| Mark L. Winget 1968
333 W. Wacker Drive Chicago, IL 60606 |
|
Vice President and Secretary |
|
2008 |
|
Vice President and Assistant Secretary of Nuveen Securities, LLC (since 2008), and Nuveen Fund Advisors, LLC (since 2019); Vice President, Associate General Counsel and Assistant Secretary of
Teachers Advisors, LLC and TIAA-CREF Investment Management, LLC (since 2023) and Nuveen Asset Management, LLC (since 2020); Vice President (since 2010) and Associate General Counsel (since 2019) of Nuveen. |
| |
|
|
|
| Rachael Zufall 1973
8500 Andrew Carnegie Blvd. Charlotte, NC 28262 |
|
Vice President and Assistant Secretary |
|
2022 |
|
Managing Director and Assistant Secretary (since 2023) of Nuveen Fund Advisors, LLC; Managing Director (since 2017), Associate General Counsel and Assistant Secretary (since 2014) of the CREF
Accounts, TIAA Separate Account VA-1, TIAA- CREF Funds and TIAA-CREF Life Funds; Managing Director (since 2017), Associate General Counsel and Assistant Secretary (since 2011) of Teachers Advisors, LLC and
TIAA-CREF Investment Management, LLC; Managing Director of Nuveen, LLC and of TIAA (since 2017). |
| (1) |
The Board of Trustees is divided into three classes, Class I, Class II, and Class III, with each being
elected to serve until the third succeeding annual shareholders’ meeting subsequent to its election or thereafter in each case when its respective successors are duly elected or appointed, except two board members are elected by the holders of
Preferred Shares, when applicable, to serve until the next annual shareholders’ meeting subsequent to its election or thereafter in each case when its respective successors are duly elected or appointed. The year first elected or appointed
represents the year in which the board member was first elected or appointed to any fund in the Nuveen complex. |
| (2) |
Officers serve indefinite terms until their successor has been duly elected and qualified, their death or their
resignation or removal. The year first elected or appointed represents the year in which the Officer was first elected or appointed to any fund in the Nuveen Complex. |
131

Nuveen:
Serving Investors for Generations
Since 1898, financial advisors and their clients have relied on Nuveen to provide dependable investment solutions through continued adherence
to proven, long-term investing principles. Today, we offer a range of high quality solutions designed to be integral components of a well-diversified core portfolio.
Focused on meeting investor needs.
Nuveen is the investment manager of TIAA. We have grown into one of the world’s premier global asset managers, with specialist knowledge
across all major asset classes and particular strength in solutions that provide income for investors and that draw on our expertise in alternatives and responsible investing. Nuveen is driven not only by the independent investment processes across
the firm, but also the insights, risk management, analytics and other tools and resources that a truly world-class platform provides. As a global asset manager, our mission is to work in partnership with our clients to create solutions which help
them secure their financial future.
Find out how we can help you.
To learn more about how the products and services of Nuveen may be able to help you meet your financial goals, talk to your financial advisor,
or call us at (800) 257-8787. Please read the information provided carefully before you invest. Investors should consider the investment objective and policies, risk considerations, charges and expenses of any
investment carefully. Where applicable, be sure to obtain a prospectus, which contains this and other relevant information. To obtain a prospectus, please contact your securities representative or Nuveen, 333 W. Wacker Dr., Chicago, IL 60606. Please
read the prospectus carefully before you invest or send money.
Learn more about Nuveen Funds at: www.nuveen.com/closed-end-funds
NOT FDIC INSURED MAY LOSE VALUE NO BANK GUARANTEE
|
|
|
| Nuveen Securities, LLC, member FINRA and SIPC | 333 West Wacker Drive | Chicago, IL 60606 | www.nuveen.com |
|
EAN-A-1023P
3241317-INV-Y-12/24 |
As of the end of the period covered by this report, the registrant has adopted a code of ethics that applies to the registrant’s principal executive
officer, principal financial officer, principal accounting officer or controller, or persons performing similar functions. There were no amendments to or waivers from the Code during the period covered by this report. The registrant has posted the
code of ethics on its website at www.nuveen.com/fund-governance. (To view the code, click on Code of Conduct.)
| ITEM 3. |
AUDIT COMMITTEE FINANCIAL EXPERT. |
As of the end of the period covered by this report, the registrant’s Board of
Directors or Trustees (“Board”) determined that the registrant has at least one “audit committee financial expert” (as defined in Item 3 of Form N-CSR) serving on its Audit Committee. The registrant’s audit committee
financial experts are Jack B. Evans, Albin F. Moschner, John K. Nelson and Robert L. Young, who are “independent” for purposes of Item 3 of Form N-CSR.
Mr. Evans was formerly President and Chief Operating Officer of SCI Financial Group, Inc., a full service registered broker-dealer and registered investment
adviser (“SCI”). As part of his role as President and Chief Operating Officer, Mr. Evans actively supervised the Chief Financial Officer (the “CFO”) and actively supervised the CFO’s preparation of financial statements and
other filings with various regulatory authorities. In such capacity, Mr. Evans was actively involved in the preparation of SCI’s financial statements and the resolution of issues raised in connection therewith. Mr. Evans has also served on the
audit committee of various reporting companies. At such companies, Mr. Evans was involved in the oversight of audits, audit plans, and the preparation of financial statements. Mr. Evans also formerly chaired the audit committee of the Federal
Reserve Bank of Chicago.
Mr. Moschner is a consultant in the wireless industry and, in July 2012, founded Northcroft Partners, LLC, a management
consulting firm that provides operational, management and governance solutions. Prior to founding Northcroft Partners, LLC, Mr. Moschner held various positions at Leap Wireless International, Inc., a provider of wireless services, where he was as a
consultant from February 2011 to July 2012, Chief Operating Officer from July 2008 to February 2011, and Chief Marketing Officer from August 2004 to June 2008. Before he joined Leap Wireless International, Inc., Mr. Moschner was President of the
Verizon Card Services division of Verizon Communications, Inc. from 2000 to 2003, and President of One Point Services at One Point Communications from 1999 to 2000. Mr. Moschner also served at Zenith Electronics Corporation as Director, President
and Chief Executive Officer from 1995 to 1996, and as Director, President and Chief Operating Officer from 1994 to 1995.
Mr. Nelson is on the Board of
Directors of Core12, LLC. (since 2008), a private firm which develops branding, marketing, and communications strategies for clients. Mr. Nelson has extensive experience in global banking and markets, having served in several senior executive
positions with ABN AMRO Holdings N.V. and its affiliated entities and predecessors, including LaSalle Bank Corporation from 1996 to 2008, ultimately serving as Chief Executive Officer of ABN AMRO N.V. North America. During his tenure at the bank, he
also served as Global Head of its Financial Markets Division, which encompassed the bank’s Currency, Commodity, Fixed Income, Emerging Markets, and Derivatives businesses. He was a member of the Foreign Exchange Committee of the Federal Reserve
Bank of the United States and during his tenure with ABN AMRO served as the bank’s representative on various committees of The Bank of Canada, European Central Bank, and The Bank of England. Mr. Nelson previously served as a senior, external
advisor to the financial services practice of Deloitte Consulting LLP. (2012-2014).
Mr. Young has more than 30 years of experience in the investment
management industry. From 1997 to 2017, he held various positions with J.P. Morgan Investment Management Inc. (“J.P. Morgan Investment”) and its affiliates (collectively, “J.P. Morgan”). Most recently, he served as Chief
Operating Officer and Director of J.P. Morgan Investment (from 2010 to 2016) and as President and Principal Executive Officer of the J.P. Morgan Funds (from 2013 to 2016). As Chief Operating Officer of J.P. Morgan Investment, Mr. Young led
service, administration and business platform support activities for J.P. Morgan’s domestic retail mutual fund and institutional commingled and separate account businesses, and co-led these activities for J.P. Morgan’s global
retail and institutional investment management businesses. As President of the J.P. Morgan Funds, Mr. Young interacted with various service providers to these funds, facilitated the relationship between such funds and their boards, and was
directly involved in establishing board agendas, addressing regulatory matters, and establishing policies and procedures. Before joining J.P. Morgan, Mr. Young, a former Certified Public Accountant (CPA), was a Senior Manager (Audit) with
Deloitte & Touche LLP (formerly, Touche Ross LLP), where he was employed from 1985 to 1996. During his tenure there, he actively participated in creating, and ultimately led, the firm’s midwestern mutual fund practice.
| ITEM 4. |
PRINCIPAL ACCOUNTANT FEES AND SERVICES. |
Nuveen AMT-Free Municipal Value Fund
The following tables show the amount of fees that KPMG LLP, the Fund’s auditor, billed to the Fund during the Fund’s last two full fiscal years. For
engagements with KPMG LLP the Audit Committee approved in advance all audit services and non-audit services that KPMG LLP provided to the Fund, except for those
non-audit services that were subject to the pre-approval exception under Rule 2-01 of Regulation
S-X (the “pre-approval exception”). The pre-approval exception for services provided directly to the Fund waives the pre-approval requirement for services other than audit, review or attest services if: (A) the aggregate amount of all such services provided constitutes no more than 5% of the total amount of revenues paid by
the Fund to its accountant during the fiscal year in which the services are provided; (B) the Fund did not recognize the services as non-audit services at the time of the engagement; and (C) the
services are promptly brought to the Audit Committee’s attention, and the Committee (or its delegate) approves the services before the audit is completed.
The Audit Committee has delegated certain pre-approval responsibilities to its Chair (or, in his absence, any other
member of the Audit Committee).
SERVICES THAT THE FUND’S AUDITOR BILLED TO THE FUND
|
|
|
|
|
|
|
|
|
|
|
|
|
|
|
|
|
| Fiscal Year Ended |
|
Audit Fees
Billed to Fund 1 |
|
|
Audit-Related Fees
Billed to Fund
2 |
|
|
Tax Fees
Billed to Fund 3 |
|
|
All Other Fees
Billed to Fund 4 |
|
| October 31, 2023 |
|
$ |
28,000 |
|
|
$ |
0 |
|
|
$ |
0 |
|
|
$ |
0 |
|
|
|
|
|
|
|
|
|
|
|
|
|
|
|
|
|
|
|
|
|
|
|
| Percentage approved pursuant to pre-approval
exception |
|
|
0 |
% |
|
|
0 |
% |
|
|
0 |
% |
|
|
0 |
% |
|
|
|
|
|
|
|
|
|
|
|
|
|
|
|
|
|
|
|
|
|
|
| October 31, 2022 |
|
$ |
26,220 |
|
|
$ |
0 |
|
|
$ |
0 |
|
|
$ |
0 |
|
|
|
|
|
|
|
|
|
|
|
|
|
|
|
|
|
|
|
|
|
|
|
| Percentage approved pursuant to pre-approval
exception |
|
|
0 |
% |
|
|
0 |
% |
|
|
0 |
% |
|
|
0 |
% |
|
|
|
|
|
|
|
|
|
|
|
|
|
|
|
|
|
1 “Audit Fees” are the aggregate fees billed for professional services for the audit of the Fund’s annual financial statements and services provided in connection with statutory and
regulatory filings or engagements.
2 “Audit Related Fees” are the aggregate fees billed
for assurance and related services reasonably related to the performance of the audit or review of financial statements that are not reported under “Audit Fees”. These fees include offerings related to the Fund’s common shares and
leverage.
3 “Tax Fees” are the aggregate fees billed for professional services for tax
advice, tax compliance, and tax planning. These fees include: all global withholding tax services; excise and state tax reviews; capital gain, tax equalization and taxable basis calculation performed by the principal accountant.
4 “All Other Fees” are the aggregate fees billed for products and services other than
“Audit Fees”, “Audit-Related Fees” and “Tax Fees”. These fees represent all “Agreed-Upon Procedures” engagements pertaining to the Fund’s use of leverage.
SERVICES THAT THE FUND’S AUDITOR BILLED TO THE
ADVISER AND AFFILIATED FUND SERVICE PROVIDERS
The following tables show the amount of fees billed by KPMG LLP to Nuveen Fund Advisors, LLC (formerly Nuveen Fund Advisors, Inc.) (the “Adviser”),
and any entity controlling, controlled by or under common control with the Adviser that provides ongoing services to the Fund (“Affiliated Fund Service Provider”), for engagements directly related to the Fund’s operations and
financial reporting, during the Fund’s last two full fiscal years.
The tables also show the percentage of fees subject to the pre-approval exception. The pre-approval exception for services provided to the Adviser and any Affiliated Fund Service Provider (other than audit, review or attest services)
waives the pre-approval requirement if: (A) the aggregate amount of all such services provided constitutes no more than 5% of the total amount of revenues paid to KPMG LLP by the Fund, the Adviser and
Affiliated Fund Service Providers during the fiscal year in which the services are provided that would have to be pre-approved by the Audit Committee; (B) the Fund did not recognize the services as non-audit services at the time of the engagement; and (C) the services are promptly brought to the Audit Committee’s attention, and the Committee (or its delegate) approves the services before the
Fund’s audit is completed.
|
|
|
|
|
|
|
|
|
|
|
|
|
| Fiscal Year Ended |
|
Audit-Related Fees
Billed to Adviser and
Affiliated
Fund
Service Providers |
|
|
Tax Fees
Billed to Adviser and
Affiliated Fund
Service Providers |
|
|
All Other Fees
Billed to Adviser and
Affiliated Fund
Service Providers |
|
| October 31, 2023 |
|
$ |
0 |
|
|
$ |
0 |
|
|
$ |
0 |
|
|
|
|
|
|
|
|
|
|
|
|
|
|
|
|
|
|
| Percentage approved pursuant to pre-approval
exception |
|
|
0 |
% |
|
|
0 |
% |
|
|
0 |
% |
|
|
|
|
|
|
|
|
|
|
|
|
|
|
|
|
|
| October 31, 2022 |
|
$ |
0 |
|
|
$ |
0 |
|
|
$ |
0 |
|
|
|
|
|
|
|
|
|
|
|
|
|
|
|
|
|
|
| Percentage approved pursuant to pre-approval
exception |
|
|
0 |
% |
|
|
0 |
% |
|
|
0 |
% |
|
|
|
|
|
|
|
|
|
|
|
|
|
NON-AUDIT SERVICES
The following table shows the amount of fees that KPMG LLP billed during the Fund’s last two full fiscal years for
non-audit services. The Audit Committee is required to pre-approve non-audit services that KPMG LLP provides to the Adviser and
any Affiliated Fund Services Provider, if the engagement related directly to the Fund’s operations and financial reporting (except for those subject to the pre-approval exception described above). The
Audit Committee requested and received information from KPMG LLP about any non-audit services that KPMG LLP rendered during the Fund’s last fiscal year to the Adviser and any Affiliated Fund Service
Provider. The Committee considered this information in evaluating KPMG LLP’s independence.
|
|
|
|
|
|
|
|
|
|
|
|
|
|
|
|
|
| Fiscal Year Ended |
|
Total Non-Audit Fees
Billed to Fund |
|
|
Total Non-Audit Fees
billed to Adviser and
Affiliated
Fund Service
Providers (engagements
related directly to the
operations and financial
reporting of the Fund) |
|
|
Total Non-Audit Fees
billed to Adviser and
Affiliated
Fund Service
Providers (all other
engagements) |
|
|
Total |
|
| October 31, 2023 |
|
$ |
0 |
|
|
$ |
0 |
|
|
$ |
0 |
|
|
$ |
0 |
|
| October 31, 2022 |
|
$ |
0 |
|
|
$ |
0 |
|
|
$ |
0 |
|
|
$ |
0 |
|
“Non-Audit Fees billed to Fund” for both fiscal year ends represent
“Tax Fees” and “All Other Fees” billed to Fund in their respective amounts from the previous table.
Less than 50 percent of the
hours expended on the principal accountant’s engagement to audit the registrant’s financial statements for the most recent fiscal year were attributed to work performed by persons other than the principal accountant’s full-time,
permanent employees.
Audit Committee Pre-Approval Policies and Procedures. Generally, the Audit Committee must
approve (i) all non-audit services to be performed for the Fund by the Fund’s independent accountants and (ii) all audit and non-audit services to be
performed by the Fund’s independent accountants for the Affiliated Fund Service Providers with respect to operations and financial reporting of the Fund. Regarding tax and research projects conducted by the independent accountants for the Fund
and Affiliated Fund Service Providers (with respect to operations and financial reports of the Fund) such engagements will be (i) pre-approved by the Audit Committee if they are expected to be for amounts
greater than $10,000; (ii) reported to the Audit Committee chair for his verbal approval prior to engagement if they are expected to be for amounts under $10,000 but greater than $5,000; and (iii) reported to the Audit Committee at the next
Audit Committee meeting if they are expected to be for an amount under $5,000.
| ITEM 5. |
AUDIT COMMITTEE OF LISTED REGISTRANTS. |
The registrant’s Board has a separately designated Audit Committee established in accordance with Section 3(a)(58)(A) of the Securities Exchange Act
of 1934, as amended (15 U.S.C. 78c(a) (58)(A)). As of the end of the period covered by this report the members of the audit committee are Jack B. Evans, Albin F. Moschner, John K. Nelson, Chair, Margaret L. Wolff, and Robert L. Young.
| ITEM 6. |
SCHEDULE OF INVESTMENTS. |
| a) |
|
See Portfolio of Investments in Item 1. |
| ITEM 7. |
DISCLOSURE OF PROXY VOTING POLICIES AND PROCEDURES FOR CLOSED-END
MANAGEMENT INVESTMENT COMPANIES. |
Nuveen Fund Advisors, LLC is the registrant’s investment adviser
(referred to herein as the “Adviser”). The Adviser is responsible for the on-going monitoring of the Fund’s investment portfolio, managing the Fund’s business affairs and providing certain
clerical, bookkeeping and administrative services. The Adviser has engaged Nuveen Asset Management, LLC (“Sub-Adviser”) as Sub-Adviser to provide discretionary
investment advisory services. As part of these services, the Adviser has delegated to the Sub-Adviser the full responsibility for proxy voting on securities held in the registrant’s portfolio and related
duties in accordance with the Sub-Adviser’s policies and procedures. The Adviser periodically monitors the Sub-Adviser’s voting to ensure that it is carrying
out its duties. The Sub-Adviser’s proxy voting policies and procedures are attached to this filing as an exhibit and incorporated herein by reference.
| ITEM 8. |
PORTFOLIO MANAGERS OF CLOSED-END MANAGEMENT INVESTMENT COMPANIES. |
Nuveen Fund Advisors, LLC is the registrant’s investment adviser (also referred to as the “Adviser”). The Adviser is responsible for the
selection and on-going monitoring of the Fund’s investment portfolio, managing the Fund’s business affairs and providing certain clerical, bookkeeping and administrative services. The Adviser has engaged Nuveen Asset Management, LLC
(“Nuveen Asset Management” or “Sub-Adviser”) as Sub-Adviser to provide discretionary investment advisory services. The following section provides information on the portfolio managers at the Sub-Adviser:
| ITEM 8(a)(1). |
PORTFOLIO MANAGER BIOGRAPHIES |
As of the date of filing this report, the following individuals at the Sub-Adviser (the
“Portfolio Managers”) have primary responsibility for the day-to-day implementation of the registrant’s investment strategies:
Daniel
J. Close, CFA, Managing Director at Nuveen Asset Management, leads the municipal fixed income strategic direction and investment perspectives for Nuveen. He serves as lead portfolio manager for high yield municipal strategies, along with
tax-exempt and taxable municipal strategies that include customized institutional portfolios, open-end funds and closed-end funds. Prior to his current role, Dan helped establish and expand the platform as Head of Taxable Municipals. He is a
portfolio manager of both high yield and investment grade municipal assets, and he has managed dedicated taxable municipal strategies for Nuveen since 2010. After joining Nuveen in 2000, he was a municipal fixed income research analyst covering the
corporate-backed, energy, transportation and utility sectors. Dan began working in the investment industry in 1998 as an analyst at Banc of America Securities. He received his BS in Business from Miami University and his MBA from Northwestern
University’s J. L. Kellogg School of Management. Mr. Close has earned the Chartered Financial Analyst designation and is a member of the CFA Institute and the CFA Society of Chicago.
Kristen M. DeJong, CFA, Managing Director at Nuveen Asset Management, is a portfolio manager responsible for managing taxable municipal fixed income
strategies for customized institutional portfolios and closed-end funds. She began her career in the financial services industry in 2005 and joined Nuveen Asset Management in 2008. Prior to her current role, she served as a research associate at
Nuveen in the wealth management services area and then as a senior research analyst for Nuveen Asset Management’s municipal fixed income team before assuming portfolio management responsibilities in 2021. She received her B.S. in Business from
Miami University. Ms. DeJong holds the Chartered Financial Analyst designation and is a member of the CFA Institute and the CFA Society of Chicago.
| ITEM 8(a)(2). |
OTHER ACCOUNTS MANAGED BY PORTFOLIO MANAGERS |
Other Accounts Managed. In addition to managing the registrant, the Portfolio Managers are also primarily responsible for the day-to-day
portfolio management of the following accounts:
|
|
|
|
|
|
|
|
|
| Portfolio Manager |
|
Type of Account Managed |
|
Number of
Accounts |
|
|
Assets* |
| Daniel J. Close |
|
Registered Investment Company |
|
|
16 |
|
|
$25.03 billion |
|
|
Other Pooled Investment Vehicles |
|
|
2 |
|
|
$482 million |
|
|
Other Accounts |
|
|
60 |
|
|
$16.28 billion |
|
|
|
|
| Kristen M. DeJong |
|
Registered Investment Company |
|
|
20 |
|
|
$17.62 billion |
|
|
Other Pooled Investment Vehicles |
|
|
0 |
|
|
$0 |
|
|
Other Accounts |
|
|
52 |
|
|
$14.53 billion |
| * |
|
Assets are as of October 31, 2023. None of the assets in these accounts are subject to an advisory fee based on performance. |
POTENTIAL MATERIAL CONFLICTS OF INTEREST
Actual or apparent
conflicts of interest may arise when a portfolio manager has day-to-day management responsibilities with respect to more than one account. More specifically, portfolio managers who manage multiple accounts are presented a number of potential
conflicts, including, among others, those discussed below.
The management of multiple accounts may result in a portfolio manager devoting unequal time
and attention to the management of each account. Nuveen Asset Management seeks to manage such competing interests for the time and attention of portfolio managers by having portfolio managers focus on a particular investment discipline. Most
accounts managed by a portfolio manager in a particular investment strategy are managed using the same investment models.
If a portfolio manager
identifies a limited investment opportunity which may be suitable for more than one account, an account may not be able to take full advantage of that opportunity due to an allocation of filled purchase or sale orders across all eligible accounts.
To deal with these situations, Nuveen Asset Management has adopted procedures for allocating limited opportunities across multiple accounts.
With respect
to many of its clients’ accounts, Nuveen Asset Management determines which broker to use to execute transaction orders, consistent with its duty to seek best execution of the transaction. However, with respect to certain other accounts, Nuveen
Asset Management may be limited by the client with respect to the selection of brokers or may be instructed to direct trades through a particular broker. In these cases, Nuveen Asset Management may place separate, non-simultaneous, transactions for
a Fund and other accounts which may temporarily affect the market price of the security or the execution of the transaction, or both, to the detriment of the Fund or the other accounts.
Some clients are subject to different regulations. As a consequence of this difference in regulatory requirements, some clients may not be permitted to engage
in all the investment techniques or transactions or to engage in these transactions to the same extent as the other accounts managed by a portfolio manager. Finally, the appearance of a conflict of interest may arise where Nuveen Asset Management
has an incentive, such as a performance-based management fee, which relates to the management of some accounts, with respect to which a portfolio manager has day-to-day management responsibilities.
Conflicts of interest may also arise when the Sub-Adviser invests one or more of its client accounts in different or multiple parts of the same issuer’s
capital structure, including investments in public versus private securities, debt versus equity, or senior versus junior/subordinated debt, or otherwise where there are different or inconsistent rights or benefits. Decisions or actions such as
investing, trading, proxy voting, exercising, waiving or amending rights or covenants, workout activity, or serving on a board, committee or other involvement in governance may result in conflicts of interest between clients holding different
securities or investments. Generally, individual portfolio managers will seek to act in a manner that they believe serves the best interest of the accounts they manage. In cases where a portfolio manager or team faces a conflict among its client
accounts, it will seek to act in a manner that it believes best reflects its overall fiduciary duty, which may result in relative advantages or disadvantages for particular accounts.
Nuveen Asset Management has adopted certain compliance procedures which are designed to address these types of conflicts common among investment managers.
However, there is no guarantee that such procedures will detect each and every situation in which a conflict arises.
Nuveen Asset Management or its
affiliates, including TIAA, sponsor an array of financial products for retirement and other investment goals, and provide services worldwide to a diverse customer base. Accordingly, from time to time, a Fund may be restricted from purchasing or
selling securities, or from engaging in other investment activities because of regulatory, legal or contractual restrictions that arise due to another client account’s investments and/or the internal policies of Nuveen Asset Management, TIAA or
its affiliates designed to comply with such restrictions. As a result, there may be periods, for example, when Nuveen Asset Management will not initiate or recommend certain types of transactions in certain securities or instruments with respect to
which investment limits have been reached.
The investment activities of Nuveen Asset Management or its affiliates may also limit the investment
strategies and rights of the Funds. For example, in certain circumstances where the Funds invest in securities issued by companies that operate in certain regulated industries, in certain emerging or international markets, or are subject to
corporate or regulatory ownership definitions, or invest in certain futures and derivative transactions, there may be limits on the aggregate amount invested by Nuveen Asset Management or its affiliates for the Funds and other client accounts that
may not be exceeded without the grant of a license or other regulatory or corporate consent. If certain aggregate ownership thresholds are reached or certain transactions undertaken, the ability of Nuveen Asset Management, on behalf of the Funds or
other client accounts, to purchase or dispose of investments or exercise rights or undertake business transactions may be restricted by regulation or otherwise impaired. As a result, Nuveen Asset Management, on behalf of the Funds or other client
accounts, may limit purchases, sell existing investments, or otherwise restrict or limit the exercise of rights (including voting rights) when Nuveen Asset Management, in its sole discretion, deems it appropriate in light of potential regulatory or
other restrictions on ownership or other consequences resulting from reaching investment thresholds.
| ITEM 8(a)(3). |
FUND MANAGER COMPENSATION |
As of the most recently completed fiscal year end, the primary Portfolio Managers’
compensation is as follows:
Portfolio manager compensation consists primarily of base salary and variable components consisting of (i) a cash bonus; (ii)
a long-term performance award; and (iii) participation in a profits interest plan.
Base salary. A portfolio manager’s base salary is
determined based upon an analysis of the portfolio manager’s general performance, experience and market levels of base pay for such position.
Cash bonus. A portfolio manager is eligible to receive an annual cash bonus that is based on three variables: risk-adjusted investment performance
relative to benchmark generally measured over the most recent one, three and five year periods (unless the portfolio manager’s tenure is shorter), ranking versus Morningstar peer funds generally measured over the most recent one, three and five
year periods (unless the portfolio manager’s tenure is shorter), and management and peer reviews.
Long-term performance award. A portfolio
manager is eligible to receive a long-term performance award that vests after three years. The amount of the award when granted is based on the same factors used in determining the cash bonus. The value of the award at the completion of the
three-year vesting period is adjusted based on the risk-adjusted investment performance of Fund(s) managed by the portfolio manager during the vesting period and the performance of the TIAA organization as a whole.
Profits interest plan. Portfolio managers are eligible to receive profits interests in Nuveen Asset Management and its affiliate, Teachers Advisors,
LLC, which vest over time and entitle their holders to a percentage of the firms’ annual profits. Profits interests are allocated to each portfolio manager based on such person’s overall contribution to the firms.
There are generally no differences between the methods used to determine compensation with respect to the Fund and the Other Accounts shown in the table
above.
| ITEM 8(a)(4). |
OWNERSHIP OF NUW SECURITIES AS OF OCTOBER 31, 2023 |
|
|
|
|
|
|
|
|
|
|
|
|
|
|
|
|
|
|
|
|
|
|
|
|
|
|
|
| Name of Portfolio Manager |
|
None |
|
$1-$10,000 |
|
|
$10,001-$50,000 |
|
|
$50,001-$100,000 |
|
|
$100,001-$500,000 |
|
|
$500,001-$1,000,000 |
|
|
Over $1,000,000 |
|
| Daniel J. Close |
|
X |
|
|
|
|
|
|
|
|
|
|
|
|
|
|
|
|
|
|
|
|
|
|
|
|
| Kristen M. DeJong |
|
X |
|
|
|
|
|
|
|
|
|
|
|
|
|
|
|
|
|
|
|
|
|
|
|
|
| ITEM 9. |
PURCHASES OF EQUITY SECURITIES BY CLOSED-END MANAGEMENT INVESTMENT
COMPANY AND AFFILIATED PURCHASERS. |
Not applicable.
| ITEM 10. |
SUBMISSION OF MATTERS TO A VOTE OF SECURITY HOLDERS. |
There have been no material changes to the procedures by which shareholders may recommend nominees to the registrant’s Board implemented after the
registrant last provided disclosure in response to this Item.
| ITEM 11. |
CONTROLS AND PROCEDURES. |
| (a) |
|
The registrant’s principal executive and principal financial officers, or persons performing similar functions, have concluded that the registrant’s disclosure controls and procedures (as defined in Rule 30a-3(c) under the Investment Company Act of 1940, as amended (the “1940 Act”) (17 CFR 270.30a-3(c))) are effective, as of a date within 90 days of the filing date
of this report that includes the disclosure required by this paragraph, based on their evaluation of the controls and procedures required by Rule 30a-3(b) under the 1940 Act (17 CFR 270.30a-3(b)) and Rules 13a-15(b) or 15d-15(b) under the Securities Exchange Act of 1934, as amended (the “Exchange Act”) (17
CFR 240.13a-15(b) or 240.15d-15(b)). |
| (b) |
|
There were no changes in the registrant’s internal control over financial reporting (as defined in Rule 30a-3(d) under the 1940 Act (17 CFR
270.30a-3(d)) that occurred during the period covered by this report that has materially affected, or is reasonably likely to materially affect, the registrant’s internal control over financial reporting.
|
| ITEM 12. |
DISCLOSURE OF SECURITIES LENDING ACTIVITIES FOR CLOSED-END MANAGEMENT
INVESTMENT COMPANIES. |
Not applicable.
File the exhibits listed below as part of this Form.
(a)(1)
Any code of ethics, or amendment thereto, that is the subject of the disclosure required by Item 2, to the extent that the registrant intends to satisfy the Item 2 requirements through filing of an exhibit: Not applicable because the code is posted
on registrant’s website at www.nuveen.com/fund-governance and there were no amendments during the period covered by this report. (To view the code, click on Code of Conduct.)
(a)(2) A separate certification for each principal executive officer and principal financial officer of the registrant as required
by Rule 30a-2(a) under the 1940 Act (17 CFR 270.30a-2(a)) in the exact form set forth below: Ex-99.CERT Attached hereto.
(a)(3) Any written solicitation to purchase securities under Rule 23c-1 under the 1940 Act (17 CFR 270.23c-1) sent or given during the period covered by the report by or on behalf of the registrant to 10 or more persons. Not applicable.
(a)(4) Change in the registrant’s independent public accountant. Not applicable.
(b) If the report is filed under Section
13(a) or 15(d) of the Exchange Act, provide the certifications required by Rule 30a-2(b) under the 1940 Act (17 CFR 270.30a-2(b)); Rule 13a-14
(b) or Rule 15d-14(b) under the Exchange Act (17 CFR 240.13a-14(b) or 240.15d-14(b)), and Section 1350 of Chapter 63
of Title 18 of the United States Code (18 U.S.C. 1350) as an exhibit. A certification furnished pursuant to this paragraph will not be deemed “filed” for purposes of Section 18 of the Exchange Act (15 U.S.C. 78r), or otherwise subject
to the liability of that section. Such certification will not be deemed to be incorporated by reference into any filing under the Securities Act of 1933 or the Exchange Act, except to the extent that the registrant specifically incorporates it by
reference. Ex-99.906 CERT attached hereto.
SIGNATURES
Pursuant to the requirements of the Securities Exchange Act of 1934 and the Investment Company Act of 1940, the registrant has duly caused this report to be
signed on its behalf by the undersigned, thereunto duly authorized.
(Registrant) Nuveen AMT-Free Municipal Value
Fund
|
|
|
| By (Signature and Title) |
|
/s/ David J. Lamb |
|
|
David J. Lamb |
|
|
Chief Administrative Officer |
Date: January 5, 2024
Pursuant to the requirements of the Securities Exchange Act of 1934 and the Investment Company Act of 1940, this report has been signed below by the following
persons on behalf of the registrant and in the capacities and on the dates indicated.
|
|
|
| By (Signature and Title) |
|
/s/ David J. Lamb |
|
|
David J. Lamb |
|
|
Chief Administrative Officer |
|
|
(principal executive officer) |
Date: January 5, 2024
|
|
|
| By (Signature and Title) |
|
/s/ E. Scott Wickerham |
|
|
E. Scott Wickerham |
|
|
Vice President and Funds Controller |
|
|
(principal financial officer) |
Date: January 5, 2024
Exhibit 99. CERT
CERTIFICATION
I, David J. Lamb, certify that:
1. I have reviewed this report on Form N-CSR of Nuveen
AMT-Free Municipal Value Fund;
2. Based on my knowledge, this report does not contain any untrue
statement of a material fact or omit to state a material fact necessary to make the statements made, in light of the circumstances under which such statements were made, not misleading with respect to the period covered by this report;
3. Based on my knowledge, the financial statements, and other financial information included in this report, fairly present in all material
respects the financial condition, results of operations, changes in net assets, and cash flows (if the financial statements are required to include a statement of cash flows) of the registrant as of, and for, the periods presented in this report;
4. The registrant’s other certifying officer and I are responsible for establishing and maintaining disclosure controls and
procedures (as defined in Rule 30a-3(c) under the Investment Company Act of 1940) and internal control over financial reporting (as defined in Rule 30a-3(d) under the
Investment Company Act of 1940) for the registrant and have:
| |
(a) |
|
designed such disclosure controls and procedures, or caused such disclosure controls and procedures to be designed under our supervision, to ensure that material information relating to the registrant, including its
consolidated subsidiaries, is made known to us by others within those entities, particularly during the period in which this report is being prepared; |
| |
(b) |
|
designed such internal control over financial reporting, or caused such internal control over financial reporting to be designed under our supervision, to provide reasonable assurance regarding the reliability of
financial reporting and the preparation of financial statements for external purposes in accordance with generally accepted accounting principles; |
| |
(c) |
|
evaluated the effectiveness of the registrant’s disclosure controls and procedures and presented in this report our conclusions about the effectiveness of the disclosure controls and procedures, as of a date within
90 days prior to the filing date of this report based on such evaluation; and |
| |
(d) |
|
disclosed in this report any change in the registrant’s internal control over financial reporting that occurred during the period covered by this report that has materially affected, or is reasonably likely to
materially affect, the registrant’s internal control over financial reporting; and |
5. The registrant’s other
certifying officer and I have disclosed to the registrant’s auditors and the audit committee of the registrant’s board of directors (or persons performing the equivalent functions):
| |
(a) |
|
all significant deficiencies and material weaknesses in the design or operation of internal control over financial reporting which are reasonably likely to adversely affect the registrant’s ability to record,
process, summarize, and report financial information; and |
| |
(b) |
|
any fraud, whether or not material, that involves management or other employees who have a significant role in the registrant’s internal control over financial reporting. |
|
|
|
| Date: January 5, 2024 |
|
/s/ David J. Lamb |
|
|
David J. Lamb |
|
|
Chief Administrative Officer |
|
|
(principal executive officer) |
CERTIFICATION
I, E. Scott Wickerham, certify that:
1. I have
reviewed this report on Form N-CSR of Nuveen AMT-Free Municipal Value Fund;
2. Based on my knowledge, this report does not contain any untrue statement of a material fact or omit to state a material fact necessary to
make the statements made, in light of the circumstances under which such statements were made, not misleading with respect to the period covered by this report;
3. Based on my knowledge, the financial statements, and other financial information included in this report, fairly present in all material
respects the financial condition, results of operations, changes in net assets, and cash flows (if the financial statements are required to include a statement of cash flows) of the registrant as of, and for, the periods presented in this report;
4. The registrant’s other certifying officer and I are responsible for establishing and maintaining disclosure controls and
procedures (as defined in Rule 30a-3(c) under the Investment Company Act of 1940) and internal control over financial reporting (as defined in Rule 30a-3(d) under the
Investment Company Act of 1940) for the registrant and have:
| |
(a) |
|
designed such disclosure controls and procedures, or caused such disclosure controls and procedures to be designed under our supervision, to ensure that material information relating to the registrant, including its
consolidated subsidiaries, is made known to us by others within those entities, particularly during the period in which this report is being prepared; |
| |
(b) |
|
designed such internal control over financial reporting, or caused such internal control over financial reporting to be designed under our supervision, to provide reasonable assurance regarding the reliability of
financial reporting and the preparation of financial statements for external purposes in accordance with generally accepted accounting principles; |
| |
(c) |
|
evaluated the effectiveness of the registrant’s disclosure controls and procedures and presented in this report our conclusions about the effectiveness of the disclosure controls and procedures, as of a date within
90 days prior to the filing date of this report based on such evaluation; and |
| |
(d) |
|
disclosed in this report any change in the registrant’s internal control over financial reporting that occurred during the period covered by this report that has materially affected, or is reasonably likely to
materially affect, the registrant’s internal control over financial reporting; and |
5. The registrant’s other
certifying officer and I have disclosed to the registrant’s auditors and the audit committee of the registrant’s board of directors (or persons performing the equivalent functions):
| |
(a) |
|
all significant deficiencies and material weaknesses in the design or operation of internal control over financial reporting which are reasonably likely to adversely affect the registrant’s ability to record,
process, summarize, and report financial information; and |
| |
(b) |
|
any fraud, whether or not material, that involves management or other employees who have a significant role in the registrant’s internal control over financial reporting. |
|
|
|
| Date: January 5, 2024 |
|
/s/ E. Scott Wickerham |
|
|
E. Scott Wickerham |
|
|
Vice President and Funds Controller |
|
|
(principal financial officer) |
Exhibit 99.906CERT
Certification Pursuant to 18 U.S.C. 1350, as adopted pursuant to Section 906 of the Sarbanes-Oxley Act of 2002; provided by the Chief Executive Officer
and Chief Financial Officer, based on each such officer’s knowledge and belief.
The undersigned officers of Nuveen
AMT-Free Municipal Value Fund (the “Fund”) certify that, to the best of each such officer’s knowledge and belief:
| |
1. |
|
The Form N-CSR of the Fund for the period ended October 31, 2023 (the “Report”) fully complies with the requirements of Section 13(a) or 15(d) of the
Securities Exchange Act of 1934; and |
| |
2. |
|
The information contained in the Report fairly presents, in all material respects, the financial condition and results of operations of the Fund. |
Date: January 5, 2024
|
| /s/ David J. Lamb |
| David J. Lamb |
| Chief Administrative Officer |
| (principal executive officer) |
|
| /s/ E. Scott Wickerham |
| E. Scott Wickerham |
| Vice President and Funds Controller |
| (principal financial officer) |
|
|
|
|
|
| Nuveen Proxy Voting Policy |
|
|
|
|
|
|
|
| Policy Purpose and Statement |
|
|
|
Applicability |
| Proxy voting is the primary means by which shareholders may influence a publicly
traded company’s governance and operations and thus create the potential for value and positive long-term investment performance. When an SEC registered investment adviser has proxy voting authority, the adviser has a fiduciary duty to vote
proxies in the best interests of its clients and must not subrogate its clients’ interests to its own. In their capacity as fiduciaries and investment advisers, Nuveen Asset Management, LLC (“NAM”), Teachers Advisors, LLC
(“TAL”) and TIAA-CREF Investment Management, LLC (“TCIM”), (each an “Adviser” and, collectively, the “Advisers”), vote proxies for the Portfolio Companies held by their respective clients, including investment
companies and other pooled investment vehicles, institutional and retail separate accounts, and other clients as applicable. The Advisers have adopted this Policy, the Nuveen Proxy Voting Guidelines, and the Nuveen Proxy Voting Conflicts of Interest
Policy for voting the proxies of the Portfolio Companies they manage. The Advisers leverage the expertise and services of an internal group referred to as Nuveen’s Stewardship Group to administer the Advisers’ proxy voting. The Stewardship
Group adheres to the Advisers’ Proxy Voting Guidelines which are reasonably designed to ensure that the Advisers vote client securities in the best interests of the Advisers’ clients. |
|
|
|
This Policy applies to employees of Nuveen acting on behalf of Nuveen Asset
Management, LLC, (“NAM”),Teachers Advisors, LLC, (“TAL”) and TIAA-CREF Investment Management, LLC (“TCIM”), each an “Adviser” and, collectively, referred to as the “Advisers”) |
|
|
|
|
|
|
|
|
|
|
Policy Statement
Proxy voting is a key component of a Portfolio Company’s corporate
governance program and is the primary method for exercising shareholder rights and influencing the Portfolio Company’s behavior. Nuveen makes informed voting decisions in compliance with Rule
206(4)-6 (the “Rule”) of the Investment Advisers Act of 1940, as amended (the “Advisers Act”), and applicable laws and regulations, (e.g., the Employee Retirement Income Security Act
of 1974, “ERISA”). |
|
|
Enforcement
As provided in the TIAA Code of Business Conduct, all employees are expected to comply with applicable laws and regulations, as well as the relevant policies, procedures
and compliance manuals that apply to Nuveen’s business activities. Violation of this Policy may result in disciplinary action up to and including termination of employment.
Terms and Definitions
Advisory
Personnel includes the Adviser’s portfolio managers and research analysts.
Proxy Voting Guidelines (the
“Guidelines”) are a set of pre-determined principles setting forth the manner in which the Advisers intend to vote on specific voting categories, and serve to assist clients, Portfolio Companies,
and other interested parties in understanding how the Advisers intend to vote on proxy-related matters. The Guidelines are not exhaustive and do not necessarily dictate how the Advisers will ultimately vote with respect to any proposal or
resolution. While the Guidelines are developed, maintained, and implemented by the Stewardship Group, and reviewed by the Nuveen Proxy Voting Committee, the portfolio managers of the Advisers maintain the ultimate decision-making authority with
respect to how proxies will be voted.
Portfolio Company includes any publicly traded company held in an account that is managed by an Adviser.
Policy Requirements
Investment advisers,
in accordance with the Rule, are required to (i) adopt and implement written policies and procedures that are reasonably designed to ensure that proxies are voted in the best interest of clients, and address resolution of material conflicts
that may arise, (ii) describe their proxy voting procedures to their clients and provide copies on request, and (iii) disclose to clients how they may obtain information on how the Advisers voted their proxies.
The Nuveen Proxy Voting Committee (the “Committee”), the Advisers, the Stewardship Group and Nuveen Compliance are subject to the respective requirements
outlined below under Roles and Responsibilities.
Although it is the general policy to vote all applicable proxies received in a timely fashion with respect to
securities selected by an Adviser for current clients, the Adviser may refrain from voting in certain circumstances where such voting would be disadvantageous, materially burdensome or impractical, or otherwise inconsistent with the overall best
interest of clients.
Roles and Responsibilities
Nuveen Proxy Voting Committee
The purpose of the
Committee is to establish a governance framework to oversee the proxy voting activities of the Advisers in accordance with the Policy. The Committee’s voting members will be comprised from Research, the Advisers, and Nuveen’s Stewardship
Group. Non-voting members will be comprised from Nuveen Legal, Nuveen Compliance, Nuveen Advisory Product, and Nuveen Investment Risk. The Committee may invite others on a standing, routine and/or or ad hoc
basis to attend Committee meetings. The CCOs of CREF/TC Funds and the Nuveen Funds shall be standing, non-
voting invitees. The Committee has delegated responsibility for the implementation and ongoing administration of the Policy to the Stewardship Group, subject to the Committee’s ultimate
oversight and responsibility as outlined in the Committee’s Proxy Voting Charter.
Advisers
| |
1. |
Advisory Personnel maintain the ultimate decision-making authority with respect to how proxies will be voted, unless
otherwise instructed by a client, and may determine to vote contrary to the Guidelines and/or a vote recommendation of the Stewardship Group if such Advisory Personnel determines it is in the best interest of the Adviser’s clients to do so. The
rationale for all such contrary vote determinations will be documented and maintained. |
| |
2. |
When voting proxies for different groups of client accounts, Advisory Personnel may vote proxies held by the respective
client accounts differently depending on the facts and circumstances specific to such client accounts. The rationale for all such vote determinations will be documented and maintained. |
| |
3. |
Advisory Personnel must comply with the Nuveen Proxy Voting Conflicts of Interest Policy with respect to potential
material conflicts of interest. |
Nuveen Stewardship Group
| |
1. |
Performs day-to-day administration of the
Advisers’ proxy voting processes. |
| |
2. |
Seeks to vote proxies in adherence to the Guidelines, which have been constructed in a manner intended to align with the
best interests of clients. In applying the Guidelines, the Stewardship Group, on behalf of the Advisers, takes into account several factors, including, but not limited to: |
| |
• |
|
Input from Advisory Personnel |
| |
• |
|
Specific Portfolio Company context, including environmental, social and governance practices, and financial performance.
|
| |
3. |
Assists in the development of securities lending recall protocols in cooperation with the Securities Lending Committee.
|
| |
4. |
Performs Form N-PX filings in accordance with regulatory requirements.
|
| |
5. |
Delivers copies of the Advisers’ Policy to clients and prospective clients upon request in a timely manner, as
appropriate. |
| |
6. |
Assists with the disclosure of proxy votes as applicable on corporate websites and elsewhere as required by applicable
regulations. |
| |
7. |
Prepares reports of proxies voted on behalf of the Advisers’ investment company clients to their Boards or
committees thereof, as applicable. |
| |
8. |
Performs an annual vote reconciliation for review by the Committee. |
| |
9. |
Arranges the annual service provider due diligence, including a review of the service provider’s potential conflicts
of interests, and presents the results to the Committee. |
| |
10. |
Facilitates quarterly Committee meetings, including agenda and meeting minute preparation. |
| |
11. |
Complies with the Nuveen Proxy Voting Conflicts of Interest Policy with respect to potential material conflicts of
interest. |
| |
12. |
Creates and retains certain records in accordance with Nuveen’s Record Management program. |
| |
13. |
Oversees the proxy voting service provider with respect to its responsibilities, including making and retaining certain
records as required under applicable regulation. |
Nuveen Compliance
| |
1. |
Seeks to ensure proper disclosure of Advisers’ Policy to clients as required by regulation or otherwise.
|
| |
2. |
Seeks to ensure proper disclosure to clients of how they may obtain information on how the Advisers voted their proxies.
|
3
| |
3. |
Assists the Stewardship Group with arranging the annual service provider due diligence and presenting the results to the
Committee. |
| |
4. |
Monitors for compliance with this Policy and retains records relating to its monitoring activities pursuant to
Nuveen’s Records Management program. |
Nuveen Legal
| |
1. |
Provide legal guidance as requested. |
Governance
Review and
Approval
This Policy will be reviewed at least annually and will be updated sooner if substantive changes are necessary. The Policy Owner, the Committee
and the NEFI Compliance Committee are responsible for the review and approval of this Policy.
Implementation
Nuveen has established the Committee to provide centralized management and oversight of the proxy voting process administered by the Stewardship Group for
the Advisers in accordance with its Proxy Voting Committee Charter and this Policy.
Exceptions
Any request for a proposed exception or variation to this Policy will be submitted to the Committee for approval and reported to the appropriate governance
committee(s), where appropriate.
Related Documents
| |
• |
|
Nuveen Proxy Voting Committee Charter |
| |
• |
|
Nuveen Proxy Voting Guidelines |
| |
• |
|
Nuveen Proxy Voting Conflicts of Interest Policy and Procedures |
| |
• |
|
Nuveen Policy Statement on Responsible Investing |
|
|
|
| |
|
|
|
|
|
| Policy Adoption Date
|
|
February 3, 2020
|
| Effective Date of Current
Policy/Last Date Reviewed |
|
December 18, 2023 |
| Governance
|
|
NEFI Compliance Committee
|
| Policy Owner
|
|
Nuveen Proxy Voting Committee
|
| Policy Leader
|
|
Nuveen Compliance
|
G-3250864P-E1123W
4
Nuveen AMT Free Municipa... (NYSE:NUW)
Historical Stock Chart
From Jun 2024 to Jul 2024

Nuveen AMT Free Municipa... (NYSE:NUW)
Historical Stock Chart
From Jul 2023 to Jul 2024
