PROXY ITEM 1 — PROPOSAL FOR ELECTION OF DIRECTORS
General
We are asking shareholders to elect the ten nominees named in this proxy statement to serve on the board of directors of Koppers Holdings Inc. (the “company,” “Koppers,” “we” or “us”) until the 2025 Annual Meeting of Shareholders or until their successors have been duly elected and qualified.
Each nominee currently serves on our board of directors and has been nominated for election by our nominating and corporate governance committee and approved by our board. The board has nominated Leroy M. Ball, Xudong Feng, Ph.D., Traci L. Jensen, David L. Motley, Albert J. Neupaver, Andrew D. Sandifer, Louis L. Testoni, Stephen R. Tritch, Nishan J. Vartanian and Sonja M. Wilkerson for election.
Each nominee who is elected as a director will hold office for the length of their term or until the director’s death, resignation, incapacity or until the director’s successor shall be elected and shall qualify. Vacancies on the board of directors, including vacancies resulting from an increase in the number of directors, will be filled by a majority vote of the directors then in office, even if less than a quorum.
As set forth in our corporate governance guidelines, all directors, other than our CEO, who are first elected to the board of directors after August 2, 2017, will have a term limit of 15 years, unless the board approves an exception to this limit, which the board has the authority to do on a case-by-case basis. In addition, a director will not be eligible to stand for re-election as a director where he or she has reached the age of 75 before the date of election, unless the board approves an exception to this guideline, which the board has the authority to do on a case-by-case basis.
Vote Required
In any uncontested election of directors, each director will be elected if more votes are cast “for” the director’s election than are cast “against” the director’s election, with abstentions and broker non-votes not being counted as a vote cast either “for” or “against” the director’s election. A plurality standard will apply in any contested election of directors, which is an election in which the number of nominees for director exceeds the number of directors to be elected.
If any incumbent director fails to receive a majority of the votes cast in any uncontested election, the director will be required to tender his or her resignation to the board of directors within ten days following certification of the election results. The nominating and corporate governance committee of the board of directors, or such other committee as the board may designate, will then recommend to the board whether to accept or reject such director’s resignation, or whether other action should be taken. The nominating and corporate governance committee may consider any factors it considers appropriate or relevant in considering whether to accept or reject a director’s resignation, or whether other action should be taken. The board will act on the nominating and corporate governance committee’s recommendation and publicly disclose its decision within 120 days following the date of the certification of the election results. If the tendered resignation is accepted by the board, the board may fill the resulting vacancy or decrease the number of directors comprising the board in accordance with our bylaws.
Your proxy will be voted “FOR” the election of the nominees set forth in the proxy card, unless you vote against, or abstain from voting for or against, one or more of them. If any nominee is unable or unwilling to stand for election, your proxy authorizes us to vote for a replacement nominee if the board names one.
Director Qualifications
There are no specific minimum qualifications a nominee must meet in order to be recommended for the board. However, our nominating and corporate governance committee seeks to establish, as required by the committee’s charter, a board that consists of individuals from diverse educational and professional experiences and backgrounds, that, when taken as a whole, provide meaningful counsel to management. Board candidates are considered based upon various criteria, such as their broad-based business skills and experiences, prominence and reputation in their profession, global business perspective, concern for the long-term interests of our shareholders and personal integrity, values and judgment — all in the context of an assessment of the perceived needs of the board. In addition, directors must have significant time available to devote to board activities and to enhance their knowledge of our business. Although we do not have a formal policy with respect to diversity, our nominating and corporate governance committee considers the diversity of our board as a whole, including the skills, background and experience of our directors.
CORPORATE GOVERNANCE MATTERS
Our full annual disclosure of sustainability performance can be found in our most recent Sustainability Report on the company’s website at www.koppers.com. Our historical Sustainability Reports dating to 2018 are also available on www.koppers.com. Our sustainability reporting referenced in this proxy statement, including, without limitation, our most recent and historical Sustainability Reports, and the information on, or accessible through, our websites are not part of or incorporated by reference into this proxy statement.
Communications with the Board
The board of directors welcomes the input and suggestions of shareholders and other interested parties. Shareholders and other interested parties wishing to contact the chairman of the board, the non-management directors as a group or specified individual directors may do so by sending a written communication to the attention of the chairman of the board, c/o Koppers Holdings Inc., Corporate Secretary’s Office, 436 Seventh Avenue, Pittsburgh, Pennsylvania 15219. Issues or complaints regarding questionable accounting practices, internal accounting controls or auditing matters may be sent in writing to the attention of the audit committee chairman, c/o Koppers Holdings Inc., Corporate Secretary’s Office, 436 Seventh Avenue, Pittsburgh, Pennsylvania 15219. Our corporate secretary will forward all written communications to the director or directors to whom it is addressed. Alternatively, you may place an anonymous, confidential, toll-free call in the United States to our Compliance Line at 800-385-4406.
Nomination Procedures
The nominating and corporate governance committee will consider nominees for director recommended by the committee, other directors, employees and shareholders and evaluate such nominees against the same criteria used to evaluate all candidates for director. Any shareholder wishing to recommend a candidate for director to the nominating and corporate governance committee should submit the recommendation in writing to our corporate secretary at Koppers Holdings Inc., Attention: Corporate Secretary’s Office, 436 Seventh Avenue, Pittsburgh, Pennsylvania 15219.
Pursuant to our bylaws, in order to recommend a nominee for election at our annual meeting a shareholder must provide advance notice of such nomination (1) if the meeting is to be held on a date that is within 30 days before or 30 days after the anniversary date of the prior annual meeting, not less than 120 days nor more than 150 days prior to such annual meeting, or (2) if the meeting is to be held on a date that is not within 30 days before or 30 days after the prior annual meeting, or in the case where an annual meeting was not held in the immediately preceding year, not later than the tenth day following the day on which notice of the date of the annual meeting was mailed or the first public disclosure of the date of such annual meeting was made, whichever occurs first. In the case of a special meeting to elect directors, notice must be received no later than the tenth day following the earlier of the day on which notice was mailed or the first public disclosure of the date of such special meeting. Any such notice must set forth, among other things: (1) the name, age, address and principal occupation of each nominee; (2) a written representation that the shareholder intends to appear in person or by proxy to nominate each nominee; (3) the class and number or amount of securities beneficially owned by each nominee; (4) the number of shares to be voted by the shareholder for each nominee; (5) a description of all arrangements between the shareholder and each nominee and other persons pursuant to which the nomination is to be made; (6) all information about each nominee that would be required to be disclosed in any proxy statement relating to the meeting (including a written consent to serving as director); and (7) a written representation and agreement from each nominee stating that, (i) such nominee has disclosed and will disclose promptly prior to the meeting, and if elected during his or her term, any agreement with any person as to how such nominee will act or vote, (ii) such nominee has disclosed and will disclose promptly prior to the meeting, and if elected during his or her term, any other commitments that could interfere with his or her fiduciary duties, (iii) such nominee has disclosed and will disclose promptly prior to the meeting, and if elected during his or her term, any agreement with any person with respect to direct or indirect compensation or indemnification for services as director, (iv) such nominee agrees, including if elected, that he or she will comply with all applicable corporate governance, conflict of interest, stock ownership, trading, and other policies and guidelines; and (v) such nominee agrees, including if elected, that he or she will serve the entire term until the next meeting of shareholders at which such nominee would face re-election.
As to the shareholder giving notice, any beneficial owner on whose behalf the nomination is made, and any person controlling, controlled by or under common control with such shareholder or beneficial owner, and any person with respect to which such nominating person is acting in concert (and any person controlling, controlled by or under common control with such person) and any beneficial owner of shares held by such nominating person or any other related person, if any, such notice must set forth, among other things: (1) their name and address; (2) class and number of shares beneficially owned and of record and any other positions owned, including derivatives, hedges and any other economic or voting interest in the company; (3) a written representation as to whether hedging or other transactions have been made to mitigate a loss of such person;
EXECUTIVE AND DIRECTOR COMPENSATION
Unvested RSUs and shares owned outright by the executives and/or their spouses count toward meeting the requirements. Unvested PSUs and unexercised stock options do not count toward meeting the stock ownership requirements for our executives.
Three of our NEOs have achieved compliance with the target ownership level and two NEOs continue to comply with the 75 percent retention ratio.
Policy on Derivative Transactions and Restrictions on Hedging Transactions. We maintain a policy that prohibits our employees, officers (including our NEOs) and directors from directly or indirectly engaging in the following types of transactions with respect to our securities: certain forms of hedging or monetization transactions, such as prepaid variable forward contracts, equity swaps, collars and exchange funds, that would allow an employee, officer or director to hedge or offset any decrease in the market value of our securities; short sales; transactions in publicly traded options; pledging our securities as collateral for a loan; or holding our securities in margin accounts or a brokerage account with a “margin feature” (unless the margin feature is not utilized, company securities are otherwise excluded from being pledged or the account holder does not engage in any transaction that results in a lien upon the company securities in the account).
Clawback Policy. As required by the Dodd-Frank Wall Street Reform and Consumer Protection Act of 2010 (Dodd-Frank Act), we maintain a clawback policy, which requires that certain incentive compensation paid to any current or former executive officer, including our NEOs, will be subject to recoupment if (x) the incentive compensation was calculated based on financial statements that were required to be restated due to material noncompliance with financial reporting requirements, without regard to any fault or misconduct, and (y) that noncompliance resulted in overpayment of the incentive compensation within the three fiscal years preceding the fiscal year in which the restatement was required. Incentive compensation subject to the clawback policy consists of compensation that is granted, earned or vested based wholly or in part upon the attainment of a financial reporting measure (as defined in the rules implementing such requirement), including stock price and total shareholder return, on and after October 2, 2023.
Change in Control Agreements. We have entered into separate change in control agreements with all NEOs. Each of these agreements is described in the “Potential Payments upon Termination or Change in Control” section beginning on page 38 below.
Tax Considerations. For federal income tax purposes, cash compensation, such as base salary or annual cash incentive, is includible as ordinary compensation income when earned, unless deferred under a company-sponsored deferral plan. Deferrals under tax-qualified plans, such as a 401(k) plan, do not affect the timing of our tax deduction. Deferrals under non-qualified plans, the adoption of which have been approved by the board of directors, will result in the deferral of our compensation deduction until such time as the cash compensation is paid to the employee.
Section 162(m) of the Internal Revenue Code generally places a $1 million annual deduction limit on compensation paid to “covered employees,” which includes our NEOs. The committee will — consistent with its past practice — design compensation programs that are intended to be in the best long-term interests of the company and our shareholders, with deductibility of compensation being one of several considerations taken into account.
We do not provide our NEOs with a “gross-up” or other reimbursement payment for any tax liability that he or she might owe as a result of the application of Sections 280G, 4999, or 409A of the Internal Revenue Code. Sections 280G and 4999 of the Internal Revenue Code provide that executive officers, directors who hold significant equity interests in the company and certain other service providers may be subject to an excise tax if they receive payments or benefits in connection with a change in control of the company that exceeds certain prescribed limits, and that the company, or a successor, may forfeit a deduction on the amounts subject to this additional tax. Section 409A of the Internal Revenue Code also imposes additional significant taxes on an executive officer, director or other service provider to the company in the event that he or she receives “deferred compensation” that does not meet certain requirements of Section 409A of the Internal Revenue Code.
Accounting Considerations. When reviewing preliminary recommendations and in connection with approving the terms of a given incentive plan period, management and the committee review and consider the accounting implications of a given award, including the estimated expense and impact on EPS. We follow The Financial Accounting Standards Board Accounting Standards Codification Topic 718, or ASC Topic 718, for our stock-based awards. ASC Topic 718 requires companies to measure the compensation expense for all share-based payment awards made to employees and directors, including stock options, RSUs and PSUs, based on the grant date “fair value” of these awards. This calculation is performed for accounting purposes and reported in the compensation tables below for equity awards to our NEOs as required by the applicable SEC rules. ASC Topic 718 also requires companies to recognize the compensation cost of their stock-based compensation awards in their income statements over the period that the recipient of such compensation is required to render service in exchange for the option or other award.
EXECUTIVE AND DIRECTOR COMPENSATION
Potential Payments upon Termination or Change in Control
The following information and related table set forth the details of the payments and benefits that would be provided to each NEO in the event that his or her employment is terminated with us for any reason including resignation, termination without cause, retirement, a constructive termination, a change in control or a change in the NEO’s responsibilities.
Broad-Based Severance Plan
Under our broad-based severance plan, salaried employees, including each of our NEOs, are entitled to one week of cash severance for each year of service if terminated without cause. For this purpose, “cause” means to the maximum extent permitted by applicable law and as determined by us in our sole discretion, a termination: (a) because of “conviction” of, or entering a plea of nolo contendere with respect to, a felony, or any misdemeanor evidencing moral turpitude, deceit, dishonesty, or fraud; (b) for engaging in conduct which constitutes failure to perform employment duties; (c) for unsatisfactory performance of employment duties; (d) for violating a material provision of our Code of Conduct, or our safety, health, environmental, or other policies; or (e) for engaging in any misconduct which we determine, in our sole discretion, has the effect of being injurious to the company.
Change in Control Agreements
We have entered into separate change in control agreements with each of our NEOs. These agreements have an initial two-year term and, thereafter, one-year evergreen terms. Notwithstanding the foregoing, in each case we reserve the right, in our discretion, to terminate the change in control agreement by providing notice of termination at least 90 days prior to the expiration of the then current term.
These agreements are designed to mitigate concerns arising from a change in control, and help to ensure the continued dedicated service of our key employees. Cash payments received under these agreements require a “double trigger”—that is, the occurrence of both a change in control and a qualifying termination of employment. Specifically, the change in control agreements set out benefits that become payable if one of the following events occurs within two years after a change in control has occurred:
| • |
|
the NEO terminates his or her employment upon 30 days written notice after (i) being requested to relocate his or her primary office to a location greater than 50 miles from the then current primary office of the NEO; or (ii) a material reduction in the NEO’s duties, responsibilities or compensation; or |
| • |
|
the NEO’s employment is terminated by the company other than for cause or disability. |
The benefits to which the NEO would be entitled in the event of a termination of the NEO’s employment under the above-specified conditions following a change in control include:
| • |
|
all of the NEO’s accrued salary to the date of termination; |
| • |
|
a pro-rata bonus for the year in which the termination occurs equal to the average of the payments awarded for the previous two years; |
| • |
|
a lump sum payment equal to twice the NEO’s base salary; |
| • |
|
life, disability, accident and group health benefits (or the monetary equivalent of such benefits) for two years or until the NEO receives comparable benefits from a third party; and |
| • |
|
continued indemnification for pre-termination acts and omissions. |
The treatment of equity awards in connection with a change in control is handled in the equity award agreements themselves, described below, not in these agreements.
The payments and benefits to which the NEO would be entitled in the event he or she is terminated after a change in control will also be reduced as necessary to cause the total payments and “parachute payments” (as defined in the tax code) to comply with the limitation set forth in Section 280G of the tax code.
Effect of Termination for Any Reason or Change in Control on Unvested LTIP Awards
As further described in the “Outstanding Equity Awards at Fiscal Year End” table, certain NEOs hold unvested RSUs, unvested PSUs and stock options under the LTIP. Other than in connection with an involuntary termination related to a change in control (as described below), if the employment of any of the NEOs is terminated for any reason (other than retirement, death or permanent disability), the NEO will forfeit any unvested RSUs, PSUs and stock options; the NEO will not forfeit any RSUs, PSUs and stock options already
Pay vs Performance Disclosure - USD ($)
|
12 Months Ended |
Dec. 31, 2023 |
Dec. 31, 2022 |
Dec. 31, 2021 |
Dec. 31, 2020 |
| Pay vs Performance Disclosure |
|
|
|
|
| Pay vs Performance Disclosure, Table |
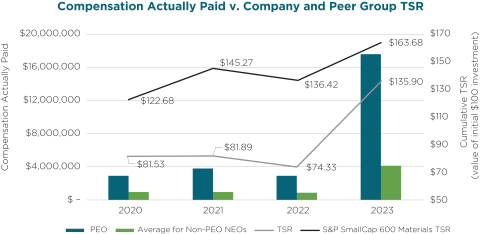
2023 Pay Versus Performance Disclosure Pay Versus Performance Table As required by applicable SEC rules, we are providing the following information about the relationship between the “compensation actually paid” to certain individuals and certain of our financial performance measures. For further information concerning our philosophy and how we align NEO compensation with our performance, refer to the Compensation Discussion and Analysis above.
|
|
|
|
|
|
|
|
|
|
|
|
|
|
|
|
|
|
|
|
|
|
|
|
|
|
|
|
|
|
|
|
|
|
|
Summary Compensation Table Total for PEO (1) |
|
|
Compensation Actually Paid to PEO (2) |
|
|
Average Summary Compensation Table Total for Non-PEO Named Executive Officers (3) |
|
|
Average Compensation Actually Paid to Non-PEO Named Executive Officers (4) |
|
|
Value of Initial Fixed
$100 Investment Based On: |
|
|
Net Income (6)
(In millions) |
|
|
Adjusted EBITDA (7)
(In millions) |
|
| |
Total Shareholder Return (5) |
|
|
Peer Group Total Shareholder Return (5) |
|
|
|
|
$5,960,553 |
|
|
|
$17,568,133 |
|
|
|
$1,579,169 |
|
|
|
$4,141,388 |
|
|
|
$135.90 |
|
|
|
$163.68 |
|
|
|
$ 89.8 |
|
|
|
$256.4 |
|
|
|
|
5,770,002 |
|
|
|
2,902,239 |
|
|
|
1,404,909 |
|
|
|
903,710 |
|
|
|
74.33 |
|
|
|
136.42 |
|
|
|
63.2 |
|
|
|
228.1 |
|
|
|
|
5,196,873 |
|
|
|
3,801,572 |
|
|
|
1,362,868 |
|
|
|
982,151 |
|
|
|
81.89 |
|
|
|
145.27 |
|
|
|
84.9 |
|
|
|
223.5 |
|
|
|
|
4,126,547 |
|
|
|
2,936,710 |
|
|
|
1,191,596 |
|
|
|
971,101 |
|
|
|
81.53 |
|
|
|
122.68 |
|
|
|
121.0 |
|
|
|
211.5 |
|
(1) |
The amounts shown in this column represent the amount of total compensation reported for Leroy M. Ball, our Chief Executive Officer, who is considered our Principal Executive Officer under applicable SEC rules (the “PEO”), for each corresponding year in the “Total” column of the Summary Compensation Table above. |
|
The amounts shown in this column represent the amount of “compensation actually paid” to Mr. Ball, as computed in accordance with Item 402(v) of Regulation S-K. The amounts do not reflect the actual amount of compensation earned by or paid to Mr. Ball during the applicable year. In accordance with the requirements of Item 402(v) of Regulation S-K, the following adjustments were made to Mr. Ball’s total compensation for each year to determine the “compensation actually paid”: |
|
|
|
|
|
|
|
|
|
|
|
|
|
|
|
|
|
|
|
Reported Summary Compensation Table Total for PEO (a) |
|
|
Reported Summary Compensation Table Value of PEO Equity Awards (b) |
|
|
Adjusted Value of Equity Awards (c) |
|
|
Compensation Actually Paid
to PEO |
|
|
|
|
$5,960,553 |
|
|
|
|
|
|
|
$15,179,801 |
|
|
|
$17,568,133 |
|
|
|
|
5,770,002 |
|
|
|
3,745,653 |
|
|
|
877,890 |
|
|
|
2,902,239 |
|
|
|
|
5,196,873 |
|
|
|
3,099,995 |
|
|
|
1,704,694 |
|
|
|
3,801,572 |
|
|
|
|
4,126,547 |
|
|
|
2,060,259 |
|
|
|
870,422 |
|
|
|
2,936,710 |
|
| |
|
This column represents the amount of total compensation reported for Mr. Ball for each corresponding year in the “Total” column of the Summary Compensation Table above. |
| |
|
This column represents the grant date fair value of equity awards reported in the “Stock Awards” and “Option Awards” columns in the Summary Compensation Table above for the applicable year. |
| |
|
This column represents an adjustment to the amounts in the “Stock Awards” and “Option Awards” columns in the Summary Compensation Table for the applicable year (a “Subject Year”). For a Subject Year, the adjusted amount replaces the “Stock Awards” and “Option Awards” columns in the Summary Compensation Table for Mr. Ball to arrive at “compensation actually paid” to Mr. Ball for that Subject Year. The adjusted amount is determined by adding (or subtracting, as applicable) the following for that Subject Year: (i) the year-end fair value of any equity awards granted in the Subject Year that are outstanding and unvested as of the end of the Subject Year; (ii) the amount of change as of the end of the Subject Year (from the end of the prior fiscal year) in the fair value of any awards granted in prior years that are outstanding and unvested as of the end of the Subject Year; (iii) for awards that are granted and vest in the Subject Year, the fair value as of the vesting date; (iv) for awards granted in prior years that vest in the Subject Year, the amount equal to the change as of the vesting date (from the end of the prior fiscal year) in the fair value; (v) for awards granted in prior years that are determined to fail to meet the applicable vesting conditions during the Subject Year, a deduction for the amount equal to the fair value at the end of the prior fiscal year; and (vi) the dollar value of any dividends or other earnings paid on stock or option awards in the Subject Year prior to the vesting date that are not otherwise reflected in the fair value of such award or included in any other component of total compensation for the Subject Year. The valuation assumption for the |
| |
EBITDA PSUs granted during 2023 is 200 percent of fair value as this represents the probable performance as of December 31, 2023 for the period 2023-2025. For stock options, the fair value or change in fair value, as applicable, was determined using a Black-Scholes valuation model. The model references the closing stock price, in addition to the stock option’s strike price, expected life, volatility, expected dividend yield and risk-free rate as of the applicable measurement date. The amounts added or subtracted to determine the adjusted amount are as follows: |
|
|
|
|
|
|
|
|
|
|
|
|
|
|
|
|
|
|
|
|
|
|
|
Year End Fair Value
of Equity Awards
Granted in the Year |
|
|
Year over Year
Change in Fair Value
of Outstanding and
Unvested Equity
Awards at FYE
Granted in Prior Years |
|
|
Change in Fair Value
of Equity Awards
Granted in Prior Years
that Vested in the Year |
|
|
Fair Value at the End
of the Prior Year of
Equity Awards that
Failed to Meet Vesting
Conditions in the Year |
|
|
Adjusted Value of
Equity Awards |
|
2023 |
|
|
$9,733,619 |
|
|
|
$ 5,183,390 |
|
|
|
$ 262,792 |
|
|
|
$ — |
|
|
|
$15,179,801 |
|
2022 |
|
|
2,339,493 |
|
|
|
(949,827 |
) |
|
|
(388,914 |
) |
|
|
(122,862 |
) |
|
|
877,890 |
|
2021 |
|
|
2,825,381 |
|
|
|
(1,255,454 |
) |
|
|
134,767 |
|
|
|
— |
|
|
|
1,704,694 |
|
2020 |
|
|
3,930,775 |
|
|
|
(1,003,142 |
) |
|
|
(1,163,408 |
) |
|
|
(893,803 |
) |
|
|
870,422 |
|
|
The amounts shown in this column represent the average of the amounts reported for our NEOs as a group (excluding Mr. Ball) in the “Total” column of the Summary Compensation Table in each applicable year. Please refer to the Summary Compensation Table above for the applicable year. The names of each of the NEOs (excluding Mr. Ball) included for purposes of calculating the average amounts in each applicable year are as follows: (i) for 2023 and 2022, Jimmi Sue Smith, James A. Sullivan, Stephanie L. Apostolou and Leslie S. Hyde; (ii) for 2021, Michael J. Zugay, James A. Sullivan, Leslie S. Hyde and Stephanie L. Apostolou; and (iii) for 2020, Michael J. Zugay, James A. Sullivan, Leslie S. Hyde, Stephanie L. Apostolou, Steven R. Lacy and Douglas J. Fenwick. |
|
The amounts shown in this column represent the average amount of “compensation actually paid” to the NEOs as a group (excluding Mr. Ball), as computed in accordance with Item 402(v) of Regulation S-K. The dollar amounts do not reflect the actual average amount of compensation earned by or paid to the NEOs as a group (excluding Mr. Ball) during the applicable year. In accordance with the requirements of Item 402(v) of Regulation S-K, the following adjustments were made to average total compensation for the NEOs as a group (excluding Mr. Ball) for each year to determine the compensation actually paid, using the same adjustment methodology described above in Footnote 2(c): |
|
|
|
|
|
|
|
|
|
|
|
|
|
|
|
|
|
|
|
|
|
|
|
Average Reported Summary Compensation Table Total for Non-PEO NEOs (a) |
|
|
Average Reported Summary Compensation Table Value of Non-PEO NEO Equity Awards (b) |
|
|
Average Reported Summary Compensation Table Value of Non-PEO NEO Accumulated Pension Benefit (c) |
|
|
Average Non-PEO NEO Adjusted Value of Equity Awards (d) |
|
|
Average Compensation Actually Paid to Non-PEO NEOs |
|
|
|
|
$1,579,169 |
|
|
|
|
|
|
|
|
|
|
|
$3,251,172 |
|
|
|
$4,141,388 |
|
|
|
|
1,404,909 |
|
|
|
700,122 |
|
|
|
— |
|
|
|
198,923 |
|
|
|
903,710 |
|
|
|
|
1,362,868 |
|
|
|
635,750 |
|
|
|
— |
|
|
|
255,033 |
|
|
|
982,151 |
|
|
|
|
1,191,596 |
|
|
|
436,682 |
|
|
|
6,591 |
|
|
|
222,778 |
|
|
|
971,101 |
|
| |
|
This column represents the average of the amounts reported for our NEOs as a group (excluding Mr. Ball) in the “Total” column of the Summary Compensation Table above in each applicable year. |
| |
|
This column represents the average of the total amounts reported for our NEOs as a group (excluding Mr. Ball) in the “Stock Awards” and “Option Awards” columns in the Summary Compensation Table above in each applicable year. |
| |
|
This column represents the average of the change in pension value amounts reported for our NEOs as a group (excluding Mr. Ball) in the “Change in Pension Value and Nonqualified Deferred Compensation Earnings” column in the Summary Compensation Table above in each applicable year. |
| |
|
This column represents an adjustment to the average of the amounts reported for our NEOs as a group (excluding Mr. Ball) in the “Stock Awards” and “Option Awards” columns in the Summary Compensation Table in each applicable year determined using the same methodology described above in Footnote 2(c). For each year, the adjusted amount replaces the “Stock Awards” and “Option Awards” columns in the Summary Compensation Table for each NEO (excluding Mr. Ball) to arrive at “compensation actually paid” to each NEO |
| |
(excluding Mr. Ball) for that year, which is then averaged to determine the average “compensation actually paid” to the NEOs (excluding Mr. Ball) for that year. The amounts added or subtracted to determine the adjusted average amount are as follows: |
|
|
|
|
|
|
|
|
|
|
|
|
|
|
|
|
|
|
|
|
|
|
|
|
|
|
|
Average
Year End
Fair Value of
Equity Awards
Granted
in the Year |
|
|
Average
Year over
Year Change in
Fair Value of
Outstanding
and Unvested
Equity Awards
at FYE Granted
in Prior Years |
|
|
Average
Fair Value as of
Vesting Date of
Equity Awards
Granted
in the Year
and Vested
in the Year |
|
|
Average
Change in
Fair Value of
Equity Awards
Granted in
Prior Years
that Vested
in the Year |
|
|
Average
Fair Value at
the End of the
Prior Year of
Equity Awards
that Failed to
Meet Vesting
Conditions
in the Year |
|
|
Adjusted
Average Value of
Equity Awards |
|
2023 |
|
|
$2,237,990 |
|
|
|
$ 971,370 |
|
|
|
$ |
|
|
|
$ 41,812 |
|
|
|
$ — |
|
|
|
$3,251,172 |
|
2022 |
|
|
439,530 |
|
|
|
(172,654 |
) |
|
|
— |
|
|
|
(44,192 |
) |
|
|
(23,761 |
) |
|
|
198,923 |
|
2021 |
|
|
464,793 |
|
|
|
(242,260 |
) |
|
|
132,024 |
|
|
|
22,112 |
|
|
|
(121,636 |
) |
|
|
255,033 |
|
2020 |
|
|
698,499 |
|
|
|
(159,014 |
) |
|
|
148,753 |
|
|
|
(219,104 |
) |
|
|
(246,356 |
) |
|
|
222,778 |
|
(5) |
The amounts shown in these columns represent an initial $100 investment in each of our common stock and the S&P SmallCap 600 Materials for the cumulative periods from December 31, 2019 through the end of the applicable fiscal year (assuming reinvestment of the pre-tax value of dividends paid during the relevant period). |
(6) |
The amounts shown in this column represent the amount of net income reflected in our audited financial statements for the applicable year. |
(7) |
The amounts shown in this column represent the amount of our adjusted EBITDA as calculated for performance measurement under our annual incentive plan for the applicable year and to measure performance of the EBITDA PSUs over the relevant three-year measurement period. Adjusted EBITDA, as measured under the annual incentive plan and for the EBITDA PSUs, is defined as earnings before interest, taxes, depreciation and amortization, as adjusted by our management development and compensation committee in its discretion to account for certain items, as set forth on Appendix B hereto. |
|
|
|
|
| Company Selected Measure Name |
Adjusted EBITDA
|
|
|
|
| Named Executive Officers, Footnote |
|
The amounts shown in this column represent the average of the amounts reported for our NEOs as a group (excluding Mr. Ball) in the “Total” column of the Summary Compensation Table in each applicable year. Please refer to the Summary Compensation Table above for the applicable year. The names of each of the NEOs (excluding Mr. Ball) included for purposes of calculating the average amounts in each applicable year are as follows: (i) for 2023 and 2022, Jimmi Sue Smith, James A. Sullivan, Stephanie L. Apostolou and Leslie S. Hyde; (ii) for 2021, Michael J. Zugay, James A. Sullivan, Leslie S. Hyde and Stephanie L. Apostolou; and (iii) for 2020, Michael J. Zugay, James A. Sullivan, Leslie S. Hyde, Stephanie L. Apostolou, Steven R. Lacy and Douglas J. Fenwick. |
|
|
|
|
| Peer Group Issuers, Footnote |
The amounts shown in these columns represent an initial $100 investment in each of our common stock and the S&P SmallCap 600 Materials for the cumulative periods from December 31, 2019 through the end of the applicable fiscal year (assuming reinvestment of the pre-tax value of dividends paid during the relevant period).
|
|
|
|
| PEO Total Compensation Amount |
$ 5,960,553
|
$ 5,770,002
|
$ 5,196,873
|
$ 4,126,547
|
| PEO Actually Paid Compensation Amount |
$ 17,568,133
|
2,902,239
|
3,801,572
|
2,936,710
|
| Adjustment To PEO Compensation, Footnote |
|
The amounts shown in this column represent the amount of “compensation actually paid” to Mr. Ball, as computed in accordance with Item 402(v) of Regulation S-K. The amounts do not reflect the actual amount of compensation earned by or paid to Mr. Ball during the applicable year. In accordance with the requirements of Item 402(v) of Regulation S-K, the following adjustments were made to Mr. Ball’s total compensation for each year to determine the “compensation actually paid”: |
|
|
|
|
|
|
|
|
|
|
|
|
|
|
|
|
|
|
|
Reported Summary Compensation Table Total for PEO (a) |
|
|
Reported Summary Compensation Table Value of PEO Equity Awards (b) |
|
|
Adjusted Value of Equity Awards (c) |
|
|
Compensation Actually Paid
to PEO |
|
|
|
|
$5,960,553 |
|
|
|
|
|
|
|
$15,179,801 |
|
|
|
$17,568,133 |
|
|
|
|
5,770,002 |
|
|
|
3,745,653 |
|
|
|
877,890 |
|
|
|
2,902,239 |
|
|
|
|
5,196,873 |
|
|
|
3,099,995 |
|
|
|
1,704,694 |
|
|
|
3,801,572 |
|
|
|
|
4,126,547 |
|
|
|
2,060,259 |
|
|
|
870,422 |
|
|
|
2,936,710 |
|
| |
|
This column represents the amount of total compensation reported for Mr. Ball for each corresponding year in the “Total” column of the Summary Compensation Table above. |
| |
|
This column represents the grant date fair value of equity awards reported in the “Stock Awards” and “Option Awards” columns in the Summary Compensation Table above for the applicable year. |
| |
|
This column represents an adjustment to the amounts in the “Stock Awards” and “Option Awards” columns in the Summary Compensation Table for the applicable year (a “Subject Year”). For a Subject Year, the adjusted amount replaces the “Stock Awards” and “Option Awards” columns in the Summary Compensation Table for Mr. Ball to arrive at “compensation actually paid” to Mr. Ball for that Subject Year. The adjusted amount is determined by adding (or subtracting, as applicable) the following for that Subject Year: (i) the year-end fair value of any equity awards granted in the Subject Year that are outstanding and unvested as of the end of the Subject Year; (ii) the amount of change as of the end of the Subject Year (from the end of the prior fiscal year) in the fair value of any awards granted in prior years that are outstanding and unvested as of the end of the Subject Year; (iii) for awards that are granted and vest in the Subject Year, the fair value as of the vesting date; (iv) for awards granted in prior years that vest in the Subject Year, the amount equal to the change as of the vesting date (from the end of the prior fiscal year) in the fair value; (v) for awards granted in prior years that are determined to fail to meet the applicable vesting conditions during the Subject Year, a deduction for the amount equal to the fair value at the end of the prior fiscal year; and (vi) the dollar value of any dividends or other earnings paid on stock or option awards in the Subject Year prior to the vesting date that are not otherwise reflected in the fair value of such award or included in any other component of total compensation for the Subject Year. The valuation assumption for the |
| |
EBITDA PSUs granted during 2023 is 200 percent of fair value as this represents the probable performance as of December 31, 2023 for the period 2023-2025. For stock options, the fair value or change in fair value, as applicable, was determined using a Black-Scholes valuation model. The model references the closing stock price, in addition to the stock option’s strike price, expected life, volatility, expected dividend yield and risk-free rate as of the applicable measurement date. The amounts added or subtracted to determine the adjusted amount are as follows: |
|
|
|
|
|
|
|
|
|
|
|
|
|
|
|
|
|
|
|
|
|
|
|
Year End Fair Value
of Equity Awards
Granted in the Year |
|
|
Year over Year
Change in Fair Value
of Outstanding and
Unvested Equity
Awards at FYE
Granted in Prior Years |
|
|
Change in Fair Value
of Equity Awards
Granted in Prior Years
that Vested in the Year |
|
|
Fair Value at the End
of the Prior Year of
Equity Awards that
Failed to Meet Vesting
Conditions in the Year |
|
|
Adjusted Value of
Equity Awards |
|
2023 |
|
|
$9,733,619 |
|
|
|
$ 5,183,390 |
|
|
|
$ 262,792 |
|
|
|
$ — |
|
|
|
$15,179,801 |
|
2022 |
|
|
2,339,493 |
|
|
|
(949,827 |
) |
|
|
(388,914 |
) |
|
|
(122,862 |
) |
|
|
877,890 |
|
2021 |
|
|
2,825,381 |
|
|
|
(1,255,454 |
) |
|
|
134,767 |
|
|
|
— |
|
|
|
1,704,694 |
|
2020 |
|
|
3,930,775 |
|
|
|
(1,003,142 |
) |
|
|
(1,163,408 |
) |
|
|
(893,803 |
) |
|
|
870,422 |
|
|
|
|
|
| Non-PEO NEO Average Total Compensation Amount |
$ 1,579,169
|
1,404,909
|
1,362,868
|
1,191,596
|
| Non-PEO NEO Average Compensation Actually Paid Amount |
$ 4,141,388
|
903,710
|
982,151
|
971,101
|
| Adjustment to Non-PEO NEO Compensation Footnote |
|
The amounts shown in this column represent the average amount of “compensation actually paid” to the NEOs as a group (excluding Mr. Ball), as computed in accordance with Item 402(v) of Regulation S-K. The dollar amounts do not reflect the actual average amount of compensation earned by or paid to the NEOs as a group (excluding Mr. Ball) during the applicable year. In accordance with the requirements of Item 402(v) of Regulation S-K, the following adjustments were made to average total compensation for the NEOs as a group (excluding Mr. Ball) for each year to determine the compensation actually paid, using the same adjustment methodology described above in Footnote 2(c): |
|
|
|
|
|
|
|
|
|
|
|
|
|
|
|
|
|
|
|
|
|
|
|
Average Reported Summary Compensation Table Total for Non-PEO NEOs (a) |
|
|
Average Reported Summary Compensation Table Value of Non-PEO NEO Equity Awards (b) |
|
|
Average Reported Summary Compensation Table Value of Non-PEO NEO Accumulated Pension Benefit (c) |
|
|
Average Non-PEO NEO Adjusted Value of Equity Awards (d) |
|
|
Average Compensation Actually Paid to Non-PEO NEOs |
|
|
|
|
$1,579,169 |
|
|
|
|
|
|
|
|
|
|
|
$3,251,172 |
|
|
|
$4,141,388 |
|
|
|
|
1,404,909 |
|
|
|
700,122 |
|
|
|
— |
|
|
|
198,923 |
|
|
|
903,710 |
|
|
|
|
1,362,868 |
|
|
|
635,750 |
|
|
|
— |
|
|
|
255,033 |
|
|
|
982,151 |
|
|
|
|
1,191,596 |
|
|
|
436,682 |
|
|
|
6,591 |
|
|
|
222,778 |
|
|
|
971,101 |
|
| |
|
This column represents the average of the amounts reported for our NEOs as a group (excluding Mr. Ball) in the “Total” column of the Summary Compensation Table above in each applicable year. |
| |
|
This column represents the average of the total amounts reported for our NEOs as a group (excluding Mr. Ball) in the “Stock Awards” and “Option Awards” columns in the Summary Compensation Table above in each applicable year. |
| |
|
This column represents the average of the change in pension value amounts reported for our NEOs as a group (excluding Mr. Ball) in the “Change in Pension Value and Nonqualified Deferred Compensation Earnings” column in the Summary Compensation Table above in each applicable year. |
| |
|
This column represents an adjustment to the average of the amounts reported for our NEOs as a group (excluding Mr. Ball) in the “Stock Awards” and “Option Awards” columns in the Summary Compensation Table in each applicable year determined using the same methodology described above in Footnote 2(c). For each year, the adjusted amount replaces the “Stock Awards” and “Option Awards” columns in the Summary Compensation Table for each NEO (excluding Mr. Ball) to arrive at “compensation actually paid” to each NEO |
| |
(excluding Mr. Ball) for that year, which is then averaged to determine the average “compensation actually paid” to the NEOs (excluding Mr. Ball) for that year. The amounts added or subtracted to determine the adjusted average amount are as follows: |
|
|
|
|
|
|
|
|
|
|
|
|
|
|
|
|
|
|
|
|
|
|
|
|
|
|
|
Average
Year End
Fair Value of
Equity Awards
Granted
in the Year |
|
|
Average
Year over
Year Change in
Fair Value of
Outstanding
and Unvested
Equity Awards
at FYE Granted
in Prior Years |
|
|
Average
Fair Value as of
Vesting Date of
Equity Awards
Granted
in the Year
and Vested
in the Year |
|
|
Average
Change in
Fair Value of
Equity Awards
Granted in
Prior Years
that Vested
in the Year |
|
|
Average
Fair Value at
the End of the
Prior Year of
Equity Awards
that Failed to
Meet Vesting
Conditions
in the Year |
|
|
Adjusted
Average Value of
Equity Awards |
|
2023 |
|
|
$2,237,990 |
|
|
|
$ 971,370 |
|
|
|
$ |
|
|
|
$ 41,812 |
|
|
|
$ — |
|
|
|
$3,251,172 |
|
2022 |
|
|
439,530 |
|
|
|
(172,654 |
) |
|
|
— |
|
|
|
(44,192 |
) |
|
|
(23,761 |
) |
|
|
198,923 |
|
2021 |
|
|
464,793 |
|
|
|
(242,260 |
) |
|
|
132,024 |
|
|
|
22,112 |
|
|
|
(121,636 |
) |
|
|
255,033 |
|
2020 |
|
|
698,499 |
|
|
|
(159,014 |
) |
|
|
148,753 |
|
|
|
(219,104 |
) |
|
|
(246,356 |
) |
|
|
222,778 |
|
|
|
|
|
| Compensation Actually Paid vs. Total Shareholder Return |
Compensation Actually Paid and Company and Peer Group TSR
|
|
|
|
| Compensation Actually Paid vs. Net Income |
Compensation Actually Paid and Net Income
|
|
|
|
| Compensation Actually Paid vs. Company Selected Measure |
Compensation Actually Paid and Adjusted EBITDA
|
|
|
|
| Total Shareholder Return Vs Peer Group |
Compensation Actually Paid and Company and Peer Group TSR
|
|
|
|
| Tabular List, Table |
Financial Performance Measures As described in greater detail in the Compensation Discussion and Analysis section above, our executive compensation program reflects a philosophy. The metrics that we use for both our long-term and short-term incentive awards are selected based on an objective of incentivizing our NEOs to increase the value of our enterprise for our shareholders. The most important financial performance measures that we used to link 2023 executive compensation actually paid to our NEOs to our performance are as follows:
|
|
|
| |
|
Most Important Financial Performance Measures |
|
Adjusted EBITDA Total Shareholder Return Operating Cash Flow |
|
|
|
|
| Total Shareholder Return Amount |
$ 135.9
|
74.33
|
81.89
|
81.53
|
| Peer Group Total Shareholder Return Amount |
163.68
|
136.42
|
145.27
|
122.68
|
| Net Income (Loss) |
$ 89,800,000
|
$ 63,200,000
|
$ 84,900,000
|
$ 121,000,000
|
| Company Selected Measure Amount |
256,400,000
|
228,100,000
|
223,500,000
|
211,500,000
|
| PEO Name |
Leroy M. Ball
|
|
|
|
| Measure:: 1 |
|
|
|
|
| Pay vs Performance Disclosure |
|
|
|
|
| Name |
Adjusted EBITDA
|
|
|
|
| Measure:: 2 |
|
|
|
|
| Pay vs Performance Disclosure |
|
|
|
|
| Name |
Total Shareholder Return
|
|
|
|
| Measure:: 3 |
|
|
|
|
| Pay vs Performance Disclosure |
|
|
|
|
| Name |
Operating Cash Flow
|
|
|
|
| PEO | Reported Summary Compensation Table Value Of Equity Awards [Member] |
|
|
|
|
| Pay vs Performance Disclosure |
|
|
|
|
| Adjustment to Compensation, Amount |
$ (3,572,221)
|
$ (3,745,653)
|
$ (3,099,995)
|
$ (2,060,259)
|
| PEO | Adjusted Value of Equity Awards [Member] |
|
|
|
|
| Pay vs Performance Disclosure |
|
|
|
|
| Adjustment to Compensation, Amount |
15,179,801
|
877,890
|
1,704,694
|
870,422
|
| PEO | Year End Fair Value of Equity Awards Granted in the Year [Member] |
|
|
|
|
| Pay vs Performance Disclosure |
|
|
|
|
| Adjustment to Compensation, Amount |
9,733,619
|
2,339,493
|
2,825,381
|
3,930,775
|
| PEO | Year over Year Change in Fair Value of Outstanding and Unvested Equity Awards at FYE Granted in Prior Years [Member] |
|
|
|
|
| Pay vs Performance Disclosure |
|
|
|
|
| Adjustment to Compensation, Amount |
5,183,390
|
(949,827)
|
(1,255,454)
|
(1,003,142)
|
| PEO | Change in Fair Value of Equity Awards Granted in Prior Years that Vested in the Year [Member] |
|
|
|
|
| Pay vs Performance Disclosure |
|
|
|
|
| Adjustment to Compensation, Amount |
262,792
|
(388,914)
|
134,767
|
(1,163,408)
|
| PEO | Fair Value at the End of the Prior Year of Equity Awards that Failed to Meet Vesting Conditions in the Year [Member] |
|
|
|
|
| Pay vs Performance Disclosure |
|
|
|
|
| Adjustment to Compensation, Amount |
0
|
(122,862)
|
0
|
(893,803)
|
| Non-PEO NEO | Reported Summary Compensation Table Value Of Equity Awards [Member] |
|
|
|
|
| Pay vs Performance Disclosure |
|
|
|
|
| Adjustment to Compensation, Amount |
(684,135)
|
(700,122)
|
(635,750)
|
(436,682)
|
| Non-PEO NEO | Reported Summary Compensation Table Value of Accumulated Pension Benefit [Member] |
|
|
|
|
| Pay vs Performance Disclosure |
|
|
|
|
| Adjustment to Compensation, Amount |
(4,818)
|
0
|
0
|
(6,591)
|
| Non-PEO NEO | Adjusted Value of Equity Awards [Member] |
|
|
|
|
| Pay vs Performance Disclosure |
|
|
|
|
| Adjustment to Compensation, Amount |
3,251,172
|
198,923
|
255,033
|
222,778
|
| Non-PEO NEO | Year End Fair Value of Equity Awards Granted in the Year [Member] |
|
|
|
|
| Pay vs Performance Disclosure |
|
|
|
|
| Adjustment to Compensation, Amount |
2,237,990
|
439,530
|
464,793
|
698,499
|
| Non-PEO NEO | Year over Year Change in Fair Value of Outstanding and Unvested Equity Awards at FYE Granted in Prior Years [Member] |
|
|
|
|
| Pay vs Performance Disclosure |
|
|
|
|
| Adjustment to Compensation, Amount |
971,370
|
(172,654)
|
(242,260)
|
(159,014)
|
| Non-PEO NEO | Fair Value as of Vesting Date of Equity Awards Granted in the Year and Vested in the Year [Member] |
|
|
|
|
| Pay vs Performance Disclosure |
|
|
|
|
| Adjustment to Compensation, Amount |
0
|
0
|
132,024
|
148,753
|
| Non-PEO NEO | Change in Fair Value of Equity Awards Granted in Prior Years that Vested in the Year [Member] |
|
|
|
|
| Pay vs Performance Disclosure |
|
|
|
|
| Adjustment to Compensation, Amount |
41,812
|
(44,192)
|
22,112
|
(219,104)
|
| Non-PEO NEO | Fair Value at the End of the Prior Year of Equity Awards that Failed to Meet Vesting Conditions in the Year [Member] |
|
|
|
|
| Pay vs Performance Disclosure |
|
|
|
|
| Adjustment to Compensation, Amount |
$ 0
|
$ (23,761)
|
$ (121,636)
|
$ (246,356)
|