Board Diversity
At the direction of and in coordination with the Board of Directors, the Company has made, and continues to make, significant progress expanding the diversity of its workforce, vendors and suppliers to align more closely with the communities that we serve, as well as establishing diversity goals among our management and associates.
The Board believes that the best decisions are reached after consideration and input is provided from members having a broad array of backgrounds, perspectives, talent and experiences. The Board further believes that its membership should reflect the communities, businesses and consumers served by Lakeland.
While our Board’s commitment to diversity has been demonstrated through these actions, the Board recognized the need to formalize its approach for Board diversity. Last year, the Board directed its Nominating and Corporate Governance Committee to establish a diversity definition, goals and timeframe for increased Board member diversity, which would be informed by and aligned with an updated skills assessment, as well as the practices of peers, the rules being promulgated by the stock exchanges, as well as evolving guidance and stakeholder expectations on Environmental, Social and Governance (“ESG”) practices. To comprehensively assess and address actual or perceived ESG disclosure gaps and ESG expectations of all of its stakeholders, Lakeland engaged Nasdaq’s ESG consulting team. As part of this process, Lakeland has adopted the diversity definition within Nasdaq Listing Rule 5605(f) which, in relevant part, defines diverse board members as individuals who self-identify either as female or as either an underrepresented minority or LGBTQ+. An underrepresented minority is further defined as an individual who self-identifies in one or more of the following groups: Black or African American, Hispanic or Latinx, Asian, Native American or Alaska Native, Native Hawaiian or Pacific Islander or two or more races of ethnicities.
As Lakeland already has had a gender diverse Board for over two decades, Lakeland’s Board had prepared, as part of its strategic planning in September 2021, to expand its diversity by 2023, well in advance of the Nasdaq Listing Rule 5605(f)’s August 2025 compliance date, and had directed its Nominating and Corporate Governance Committee to undertake a director search to meet this goal during the second quarter of 2022. The merger with Provident, which was then under consideration, presented Lakeland’s Board with an opportunity to achieve and expand upon its diversity goals in the context of the then planned combination of the two Boards to be completed prior to the close of the merger transaction, originally targeted for early in the second quarter of 2023. See “Nominating and Corporate Governance Committee Matters - Qualifications.”
Compliance with Regulatory Requirements
The Nominating and Corporate Governance Committee considers regulatory requirements affecting directors, including potential competitive restrictions, as well as the other positions the director has held, including other board memberships. No member of the Company’s Board may serve on the board of another financial institution, bank or savings and loan holding company in the Company’s market area.
Shareholder Candidates
The charter of the Nominating and Corporate Governance Committee provides that there will be no differences in the manner in which the Nominating and Corporate Governance Committee evaluates nominees recommended by shareholders and nominees recommended by the Committee or by management, except that no specific process shall be mandated with respect to the nomination of any individuals who have previously served on the Board.
Age Limits
The Company maintains a mandatory retirement age for its directors, which requires that any director who turns 72 during their term must retire at the next Annual Meeting of Shareholders.
Anti-Pledging Policy and Anti-Hedging Policy
In March 2013, Lakeland’s Board adopted an anti-pledging policy that prohibits future pledging of Lakeland common stock by Lakeland’s executive officers and directors. The policy does not require pre-existing pledges to be unwound. Hedging transactions involving the Company’s securities by directors, officers and employees are also prohibited.
-5-
Qualifications of our Executive Officers
In addition to Mr. Shara, whose qualifications are listed above, the Company’s Executive Officers are:
Thomas F. Splaine, 58, a Certified Public Accountant, has been Executive Vice President and Chief Financial Officer of the Company and the Bank since March 2017. He joined Lakeland in 2016 as First Senior Vice President and Chief Accounting Officer of the Company and the Bank. Prior to joining Lakeland, Mr. Splaine had been employed at Investors Bancorp, Inc. since 2004 and served in roles as Senior Vice President—Chief Financial Officer, Financial Planning and Analysis and Investor Relations of Investors Bancorp, Inc.
Ronald E. Schwarz, 68, has served as Senior Executive Vice President and Chief Operating Officer of the Company and the Bank since 2017. Since joining the Company in 2009, Mr. Schwarz has served as Senior Executive Vice President and Chief Revenue Officer of the Company and the Bank and Executive Vice President and Chief Retail Officer of the Company and the Bank.
Timothy J. Matteson, Esq., 54, has served as Executive Vice President, Chief Administrative Officer, General Counsel and Corporate Secretary of the Company since 2017. In 2012, Mr. Matteson was named Executive Vice President, General Counsel and Corporate Secretary of the Company. He joined the Company in 2008 as Senior Vice President and General Counsel.
James M. Nigro, 56, joined Lakeland in 2016 and serves as Executive Vice President, Chief Risk Officer of the Company. Previously, Mr. Nigro was Senior Vice President and Credit Risk Manager of The Provident Bank from 2013 to 2016.
Paul Ho Sing Loy, 62, is Executive Vice President and Chief Information Officer of the Company since 2019 and, of the Bank, since 2017. Previously Mr. Ho Sing Loy served as Senior Vice President and Director of Business Solutions of Associated Bank since 2012.
Ellen Lalwani, 60, has served as Executive Vice President and Chief Banking Officer of the Company and the Bank since 2020. Employed by the Bank since 2008, Ms. Lalwani has served as Executive Vice President and Chief Retail Officer of the Company and the Bank and Senior Vice President and Director of Retail Sales of the Bank.
John F. Rath, III, 65, has served as Executive Vice President and Chief Lending Officer of the Company and the Bank since 2018. Mr. Rath has been with the Bank since 2015, having served as First Senior Vice President, Commercial and Industrial Lending Group Manager and Senior Vice President, Commercial and Industrial Lending, Hudson Valley, New York.
Board Meetings - Independence
|
|
|
| Chair: |
|
Mary Ann Deacon |
|
|
| Meetings: |
|
13 meetings held in 2022 |
The full Board holds 10 regular meetings each year, supplemented by calls and special meetings as needed. The Board also holds an annual strategy session and conducts annual self-evaluations.
Independence: The Board has determined that the following current members of the Board satisfy the NASDAQ definition of independence: Bruce D. Bohuny, Mary Ann Deacon, Brian Flynn, Mark J. Fredericks, Brian A. Gragnolati, James E. Hanson II, Janeth C. Hendershot, Lawrence R. Inserra, Jr., Robert E. McCracken and Robert B. Nicholson, III. The Board has determined that Thomas J. Shara, as an executive and employee of the Company, is not independent.
In addition, the Board has determined that all of the members of the Audit Committee meet the definition of independence imposed by the Nasdaq Marketplace Rules and SEC Rule 10A-3 with respect to members of the Audit Committee.
Board Leadership Structure and Role in Risk Oversight
The Company currently has, and historically has had, a Board Chair separate from the Chief Executive Officer. The Board believes it is important to have an independent director in a Board leadership position at all times in order to provide leadership for the Board. Having an independent Board Chair enables non-management
-12-
Associate retention helps us operate efficiently and achieve our business objectives. We provide competitive wages, annual bonuses, stock awards, a 401(k) Plan with an employer matching contribution, healthcare and insurance benefits, health savings, flexible spending accounts, paid time off, family leave and an employee assistance program. At December 31, 2022, approximately 31% of our team had been with us for 10 years or more.
Diversity, Equity and Inclusion
We know that Lakeland’s continued success is dependent on having a workforce that reflects and represents our communities’ diverse backgrounds, experiences and perspectives.
In 2020, we appointed our first Chief Diversity Officer, with a mandate to focus on and expand workforce, vendor/supplier and leadership diversity, among other vital issues. We sponsor Share Your Voice “listening” roundtables for associates, with the assistance of outside experts, and launched a Cultural Connections newsletter. A Diversity Task Force was created to provide associates further opportunities for input into relevant issues, access to information and assistance on topics ranging from diversity to wellness, parenting and other personal issues and concerns.
To further expand diversity in our workforce, we partnered on recruitment efforts with organizations such as the African American, Hispanic and New Jersey LGBT chambers of commerce, which have led to an increase in hiring diverse talent. The fourth class of our LEAD Program graduated in 2022; the program continues to be an important tool for fostering the leadership abilities and management potential of diverse members of our team.
A survey of Lakeland associates in 2022 found that 93% believe we are committed to diversity and 93% agree we are making progress with our initiatives. We are encouraged by these findings and committed to moving our efforts forward.
A leader in gender diversity, Lakeland’s Board of Directors has had female representation for over two decades and female Board leadership, through our current Board Chair, Mary Ann Deacon, for over a decade. At December 31, 2022, the Company employed 910 associates, including 51 part-time associates, of which approximately 68% are women.
Lakeland’s Board of Directors believes that the best decisions are reached after consideration and input is provided from members having a broad array of backgrounds, perspectives, talent and experience. With this guidance, Lakeland’s Board directed its Nominating and Corporate Governance Committee to establish a diversity definition, goals and timeframe for increased Board member diversity, which would be informed by and aligned with an updated skills assessment, and stakeholder expectations. Having now adopted the diversity definition within Nasdaq Listing Rule 5605(f), Lakeland’s Board plans to achieve its diversity goals through the pending merger with Provident and the director selection process planned for combining both company’s Boards in advance of the Nasdaq Listing Rule 5605(f)’s August 2025 compliance date.
Community Reinvestment Act Rating
Lakeland is extremely proud of our “Outstanding” Community Reinvestment Act rating received from the Federal Deposit Insurance Corporation (“FDIC”) in October 2020, a rating that we have maintained since 2005.
The Community Reinvestment Act is intended to encourage depository institutions to help meet the credit needs of the communities in which they operate, including low- and moderate-income neighborhoods, consistent with safe and sound banking operations. The rating is based upon an assessment of three categories: lending, investment, and services. Included in the assessment are bank practices such as mortgage lending, small business lending, community development lending, investments and services to communities, along with associate community involvement. This rating is considered when regulators review institutions’ applications for deposit facilities and mergers and acquisitions.
-14-
Relationship with Independent Accountants
KPMG, which became the independent accountants of the Company beginning with the financial statements for the year ended December 31, 2013, was engaged as the Company’s independent accountants for 2023. See Proposal 3. It is anticipated that a representative of KPMG will be present at the Annual Meeting and will be available to answer questions.
Compensation Committee Matters
The Board has determined that each member of the Compensation Committee is independent as defined in the Nasdaq corporate governance listing rules and SEC Rule 10C-1. The Compensation Committee’s Charter is posted on the Investor Relations page of the Company’s website, https://investorrelations.lakelandbank.com/corporate-governance.
Authority, Processes and Procedures. Our Compensation Committee is responsible for administering our employee benefit plans, for establishing and recommending to the Board the compensation of our President and Chief Executive Officer (CEO) and for reviewing and recommending to the Board for approval the compensation programs covering our other executive officers. Our Compensation Committee also establishes policies and monitors compensation for our employees in general. While the Compensation Committee may, and does in fact, delegate authority with respect to the compensation of employees in general, the Compensation Committee retains overall supervisory responsibility for employee compensation. With respect to executive compensation, the Compensation Committee receives recommendations and information from senior staff members. Mr. Shara (our President and CEO) participated in Committee deliberations regarding the compensation of other executive officers, but did not participate in deliberations regarding his own compensation. The CEO; Chief Operating Officer (COO); Chief Administrative Officer, General Counsel and Corporate Secretary; and Chief Human Resources Officer assist the Compensation Committee in recommending agenda items for its meetings and by gathering and producing information for these meetings. As requested by the Compensation Committee, the CEO and COO participate in Committee meetings to discuss executive compensation, evaluate the performance of both the Company and individual executives, and provide pertinent financial or operational information. The Compensation Committee also has the authority to hire compensation consultants and other professionals to assist it in carrying out its duties.
Consultants. During our fiscal year ended December 31, 2022, the Compensation Committee retained the services of Aon Human Capital Solutions (formerly known as McLagan), a division of Aon PLC (“Aon”), to provide independent executive compensation advice and market compensation information. See “Executive Compensation - Compensation Discussion and Analysis” for a description of the services provided by Aon during 2022.
Compensation Committee Interlocks and Insider Participation
No member of the Compensation Committee is or has been an officer or employee of the Company. In addition, no executive officer of the Company served on the board of directors of any entity whose executive officers included a director of the Company.
Directors’ Compensation
During 2022, each non-employee director received: (i) a $40,000 per annum retainer, payable in quarterly increments of $10,000 each; (ii) $3,000 per Board meeting attended; (iii) $30,000 in restricted stock granted at the beginning of the year with a vesting period of one year, except Ms. Deacon who received $50,000 in restricted stock (having opted to receive $20,000 of the $100,000 Chair stipend in the form of restricted stock, rather than receiving the full amount in cash); and (iv) a $5,000 annual fee for the chairs of the Directors’ Loan Review Committee, Policy Committee and Risk Committee and a $7,500 annual fee for the chair of the Audit Committee, Nominating and Corporate Governance Committee and the Compensation Committee. No fees were paid to non-chair Board committee members for committee service.
Additionally, the Board liaisons to the Executive Loan Committee, a management committee, each received $5,000 annual stipends for such service.
-20-
OTHER MATTERS
Management is not aware of any other business to be brought up at the meeting for action by shareholders at such meeting other than the matters described in the notice. However, the enclosed proxy will confer discretionary authority with respect to matters which are not known to management at the time of printing hereof and which may come properly before the meeting.
SHAREHOLDER PROPOSALS
Lakeland does not anticipate holding a 2024 annual meeting of Lakeland shareholders if the previously announced merger between Lakeland and Provident is completed as currently anticipated. In the event that the merger is not completed within the expected time frame or at all, Lakeland may hold an annual meeting in 2024.
In order for a shareholder proposal for the Lakeland 2024 annual meeting to be eligible for inclusion in Lakeland’s proxy statement pursuant to SEC Rule 14a-8, Lakeland must have received the proposal and supporting statements at its principal executive offices no later than July 30, 2024, unless the date of Lakeland’s 2023 annual meeting is changed by more than thirty (30) days from December 28, 2024, the one (1)-year anniversary of Lakeland’s 2023 annual meeting of shareholders, in which case the proposal must be received a reasonable time before Lakeland begins to print and send its proxy materials. A Lakeland shareholder must provide its proposal to Lakeland in writing, and it must comply with the requirements of SEC Rule 14a-8. Any such proposals should be sent to the attention of the Corporate Secretary of Lakeland at Lakeland Bancorp, Inc., 250 Oak Ridge Road, Oak Ridge, New Jersey 07438.
Pursuant to the Lakeland bylaws, any shareholder wishing to nominate a candidate for director or propose other business at an annual meeting must send written notice to Lakeland’s Corporate Secretary not less than ninety (90) days and not more than one hundred and twenty (120) days prior to the first anniversary of the preceding year’s annual meeting, and the notice must provide certain other information specified in the Lakeland bylaws. As a result, any notice given by or on behalf of a shareholder must be received no earlier than August 30, 2024 and no later than September 29, 2024. However, if the date of the annual meeting is advanced more than thirty (30) days prior to or delayed by more than sixty (60) days after December 28, 2024, the one (1)-year anniversary of Lakeland’s 2023 annual meeting of shareholders, notice of nomination must be so delivered not earlier than one hundred and twenty (120) days prior to such annual meeting and not later than ninety (90) days prior to such annual meeting or the close of business on the tenth (10th) day following the day on which public announcement of the date of such meeting is first made.
In addition to the notice and information requirements contained in the Lakeland bylaws, to comply with the SEC universal proxy rules, shareholders who, in connection with the Lakeland 2023 annual meeting, if held, intend to solicit proxies in support of director nominees other than Lakeland’s nominees must provide notice to Lakeland that sets forth the information required by the SEC’s Rule 14a-19 no later than October 29, 2024, unless the date of the Lakeland 2024 annual meeting has changed by more than thirty (30) calendar days from December 28, 2024, the one (1)-year anniversary of Lakeland’s 2023 annual meeting of shareholders, in which case such notice must be provided by the later of sixty (60) calendar days prior to the date of the 2024 annual meeting or the tenth (10th) calendar day following the day on which public announcement of the date of the annual meeting is first made by Lakeland.
For a description of procedures for nominations to be submitted by shareholders, see “Nominating and Corporate Governance Committee Matters.”
A copy of Lakeland Bancorp, Inc.’s Annual Report for the year ended December 31, 2022, including financial statements, accompanies this proxy statement. The annual report is not to be regarded as proxy soliciting material or as a communication by means of which any solicitation is to be made.
A copy of Lakeland Bancorp, Inc.’s Annual Report on Form 10-K, as amended, for the year ended December 31, 2022, filed with the Securities and Exchange Commission, is available (excluding exhibits) on our Company’s website https://investorrelations.lakelandbank.com/documents or, without charge, upon written request made to investorrelations@lakelandbank.com.
-62-
Pay vs Performance Disclosure - USD ($)
|
12 Months Ended |
Dec. 31, 2022 |
Dec. 31, 2021 |
Dec. 31, 2020 |
| Pay vs Performance Disclosure |
|
|
|
| Pay vs Performance Disclosure, Table |
Pay Versus Performance Disclosure In accordance with rules adopted by the Securities and Exchange Commission pursuant to the Dodd-Frank Wall Street Reform and Consumer Protection Act of 2010, we provide the following disclosure regarding executive compensation for our principal executive officer (“PEO”) and Non-PEO NEOs and Company performance for the fiscal years listed below. The Compensation Committee did not consider the pay versus performance disclosure below in making its pay decisions for any of the years shown.
|
|
|
|
|
|
|
|
|
|
|
|
|
|
|
|
|
|
|
|
|
|
|
|
|
|
|
|
|
|
|
|
|
|
|
Summary Compensation
Table Total for Thomas J.
|
|
|
Compensation Actually
Paid to Thomas J.
|
|
|
Average Summary Compensation Table Total for Non-PEO NEOs 1
|
|
|
Average Compensation Actually Paid to Non-PEO NEOs 1,2,3
|
|
|
$100 Investment based on: 4 |
|
|
|
|
|
Adjusted Pre- Tax Net Income 5
|
|
| |
|
|
|
|
|
2022 |
|
|
3,097,917 |
|
|
|
2,765,549 |
|
|
|
1,117,397 |
|
|
|
1,081,400 |
|
|
|
112.82 |
|
|
|
103.58 |
|
|
|
107.4 |
|
|
|
153.83 |
|
2021 |
|
|
3,487,152 |
|
|
|
4,720,973 |
|
|
|
1,141,270 |
|
|
|
1,528,846 |
|
|
|
117.63 |
|
|
|
116.16 |
|
|
|
95.0 |
|
|
|
111.43 |
|
2020 |
|
|
2,459,101 |
|
|
|
2,022,640 |
|
|
|
772,516 |
|
|
|
641,478 |
|
|
|
76.24 |
|
|
|
81.55 |
|
|
|
57.5 |
|
|
|
78.25 |
|
| (1) |
Thomas J. Shara was our PEO for each year presented. The individuals comprising the Non-PEO NEOs for each year presented are listed below. |
|
|
|
| Thomas F. Splaine |
|
| Ronald E. Schwarz |
|
| Timothy J. Matteson |
|
| James M. Nigro |
| (2) |
The amounts shown for Compensation Actually Paid have been calculated in accordance with Item 402(v) of Regulation S-K and do not reflect compensation actually earned, realized, or received by the Company’s NEOs. These amounts reflect the Summary Compensation Table Total with certain adjustments as described in footnote 3 below. |
| (3) |
Compensation Actually Paid reflects the exclusions and inclusions of certain amounts for the PEO and the Non-PEO NEOs as set forth below. Equity values are calculated in accordance with FASB ASC Topic 718. Amounts in the Exclusion of Stock Awards column are the totals from the Stock Awards column set forth in the Summary Compensation Table. Amounts in the Exclusion of Change in Pension Value column reflect the amounts attributable to the Change in Pension Value reported in the Summary Compensation Table. Amounts in the Inclusion of Pension Service Cost are based on the service cost for services rendered during the listed year. |
|
|
|
|
|
|
|
|
|
|
|
|
|
|
|
|
|
|
|
|
|
|
|
|
|
|
|
Summary Compensation
Table Total for Thomas
|
|
|
Exclusion of Change
in Pension Value for
Thomas J. Shara
|
|
|
Exclusion of Stock
Awards for Thomas J.
|
|
|
Inclusion of Pension
Service Cost for Thomas
|
|
|
Inclusion of Equity
Values for Thomas J.
|
|
|
Compensation Actually
Paid to Thomas J. Shara
($) |
|
2022 |
|
|
3,097,917 |
|
|
|
— |
|
|
|
(1,018,100 |
) |
|
|
(211,061 |
) |
|
|
895,793 |
|
|
|
2,765,549 |
|
2021 |
|
|
3,487,152 |
|
|
|
(194,721 |
) |
|
|
(1,376,018 |
) |
|
|
162,232 |
|
|
|
2,642,328 |
|
|
|
4,720,973 |
|
2020 |
|
|
2,459,101 |
|
|
|
(231,767 |
) |
|
|
(591,199 |
) |
|
|
211,516 |
|
|
|
174,989 |
|
|
|
2,022,640 |
|
|
|
|
|
|
|
|
|
|
|
|
|
|
|
|
|
|
|
|
|
|
|
|
|
|
|
|
Average Summary Compensation Table Total for Non-PEO NEOs
|
|
|
Average Exclusion of Change in Pension Value for Non-PEO NEOs
|
|
|
Average Exclusion of
Stock Awards for Non-
|
|
|
Average Inclusion of Pension Service Cost for Non-PEO NEOs
|
|
|
Average Inclusion of
Equity Values for Non-
|
|
|
Average Compensation
Actually Paid to Non-
|
|
| 2022 |
|
|
1,117,397 |
|
|
|
— |
|
|
|
(328,757 |
) |
|
|
— |
|
|
|
292,760 |
|
|
|
1,081,400 |
|
| 2021 |
|
|
1,141,270 |
|
|
|
— |
|
|
|
(426,060 |
) |
|
|
— |
|
|
|
813,636 |
|
|
|
1,528,846 |
|
| 2020 |
|
|
772,516 |
|
|
|
— |
|
|
|
(200,630 |
) |
|
|
— |
|
|
|
69,592 |
|
|
|
641,478 |
| The amounts in the Inclusion of Equity Values in the tables above are derived from the amounts set forth in the following tables:
|
|
|
|
|
|
|
|
|
|
|
|
|
Year-End Fair Value of Equity Awards Granted During Year That Remained Unvested as of Last Day of Year for Thomas J. Shara |
|
|
|
Vesting-Date Fair
Value of Equity
Awards Granted
During Year that
Vested During Year
for Thomas J. Shara
($) |
|
Change in Fair Value
from Last Day of
Prior Year to Vesting
Date of Unvested
Equity Awards that
Vested During Year |
|
Total - Inclusion of
Equity Values for
Thomas J. Shara
($) |
2022 |
|
1,016,692 |
|
(78,197) |
|
— |
|
(42,702) |
|
895,793 |
2021 |
|
2,184,103 |
|
370,285 |
|
— |
|
87,940 |
|
2,642,328 |
2020 |
|
430,952 |
|
(207,562) |
|
— |
|
(48,401) |
|
174,989 |
|
|
|
|
|
|
|
|
|
|
|
|
|
|
|
|
|
|
|
|
|
|
|
Average Year-End Fair Value of Equity Awards Granted During Year That Remained Unvested as of Last Day of Year for Non-PEO NEOs
|
|
|
Average Change in Fair Value from Last Day of Prior Year to Last Day of Year of Unvested Equity Awards for Non-PEO NEOs
|
|
|
Average Vesting- Date Fair Value of Equity Awards Granted During Year that Vested During Year for Non-PEO NEOs
|
|
|
Average Change in
Fair Value from Last
Day of Prior Year to
Vesting Date of
Unvested Equity
Awards that Vested
During Year for Non-
|
|
|
Total - Average Inclusion of Equity Values for Non-PEO NEOs
|
|
2022 |
|
|
219,820 |
|
|
|
(13,458 |
) |
|
|
108,875 |
|
|
|
(22,477 |
) |
|
|
292,760 |
|
2021 |
|
|
525,156 |
|
|
|
129,456 |
|
|
|
133,422 |
|
|
|
25,602 |
|
|
|
813,636 |
|
2020 |
|
|
145,839 |
|
|
|
(67,185 |
) |
|
|
— |
|
|
|
(9,062 |
) |
|
|
69,592 |
| 1. The Peer Group TSR set forth in this table utilizes the peer companies used for compensation benchmarking purposes, which are summarized in our Compensation Discussion & Analysis section of the proxy statement, for the years reflected in the table above. The comparison assumes $100 was invested for the period starting December 31, 2019, through the end of the listed year in the Company and in the compensation benchmarking peers, respectively. Historical stock performance is not necessarily indicative of future stock performance. The following table shows the peer groups in each year.
|
|
|
|
|
|
|
|
|
|
|
|
|
| Bridge Bancorp, Inc. |
|
Columbia Financial, Inc. |
|
Columbia Financial, Inc. |
|
|
|
| Bryn Mawr Bank Corporation |
|
Community Bank System, Inc. |
|
Community Bank System, Inc. |
|
|
|
| CNB Financial Corporation |
|
ConnectOne Bancorp, Inc. |
|
ConnectOne Bancorp, Inc. |
|
|
|
| Columbia Financial, Inc. |
|
Customers Bancorp, Inc. |
|
Customers Bancorp, Inc. |
|
|
|
| ConnectOne Bancorp, Inc. |
|
Dime Community Bancshares, Inc. |
|
Dime Community Bancshares, Inc. |
|
|
|
| Customers Bancorp, Inc. |
|
Eagle Bancorp, Inc. |
|
Eagle Bancorp, Inc. |
|
|
|
| Financial Institutions, Inc. |
|
First Commonwealth Financial Corporation |
|
First Commonwealth Financial Corporation |
|
|
|
| First Commonwealth Financial Corporation |
|
Flushing Financial Corporation |
|
Flushing Financial Corporation |
|
|
|
| The First of Long Island Corporation |
|
Kearny Financial Corp. |
|
Kearny Financial Corp. |
|
|
|
| Flushing Financial Corporation |
|
NBT Bancorp Inc. |
|
NBT Bancorp Inc. |
|
|
|
| Kearny Financial Corp. |
|
Northfield Bancorp, Inc. (Staten Island, NY) |
|
Northfield Bancorp, Inc. (Staten Island, NY) |
|
|
|
| NBT Bancorp Inc. |
|
Northwest Bancshares, Inc. |
|
Northwest Bancshares, Inc. |
|
|
|
| Northfield Bancorp, Inc. (Staten Island, NY) |
|
OceanFirst Financial Corp. |
|
OceanFirst Financial Corp. |
|
|
|
| Northwest Bancshares, Inc. |
|
Peapack-Gladstone Financial Corporation |
|
Peapack-Gladstone Financial Corporation |
|
|
|
| OceanFirst Financial Corp. |
|
Provident Financial Services, Inc. |
|
Provident Financial Services, Inc. |
|
|
|
| Peapack-Gladstone Financial Corporation |
|
S&T Bancorp, Inc. |
|
S&T Bancorp, Inc. |
|
|
|
| Provident Financial Services, Inc. |
|
Sandy Spring Bancorp, Inc. |
|
Sandy Spring Bancorp, Inc. |
|
|
|
| S&T Bancorp, Inc. |
|
Tompkins Financial Corporation |
|
Tompkins Financial Corporation |
|
|
|
| Sandy Spring Bancorp, Inc. |
|
Univest Financial Corporation |
|
Univest Financial Corporation |
|
|
|
| Tompkins Financial Corporation |
|
Washington Trust Bancorp, Inc. |
|
Washington Trust Bancorp, Inc. |
|
|
|
| Univest Financial Corporation |
|
WSFS Financial Corporation |
|
WSFS Financial Corporation |
|
|
|
| WSFS Financial Corporation |
|
|
|
| 2. We determined adjusted pre-tax net income to be the most important financial performance measure used to link Company performance to Compensation Actually Paid to our PEO and Non-PEO NEOs in 2022. Adjusted pre-tax net income is a non-GAAP financial measure used in our Annual Incentive Plan (AIP), and the Compensation Committee’s adjustments to this measure are described in the Compensation Discussion and Analysis of our proxy statements for each of our two most recent fiscal years. This performance measure may not have been the most important financial performance measure for years 2021 and 2020 and we may determine a different financial performance measure to be the most important financial performance measure in future years . |
|
|
| Company Selected Measure Name |
Adjusted pre-tax net income
|
|
|
| Named Executive Officers, Footnote |
| (1) |
Thomas J. Shara was our PEO for each year presented. The individuals comprising the Non-PEO NEOs for each year presented are listed below. |
|
|
|
| Thomas F. Splaine |
|
| Ronald E. Schwarz |
|
| Timothy J. Matteson |
|
| James M. Nigro |
|
|
|
| Peer Group Issuers, Footnote |
1. The Peer Group TSR set forth in this table utilizes the peer companies used for compensation benchmarking purposes, which are summarized in our Compensation Discussion & Analysis section of the proxy statement, for the years reflected in the table above. The comparison assumes $100 was invested for the period starting December 31, 2019, through the end of the listed year in the Company and in the compensation benchmarking peers, respectively. Historical stock performance is not necessarily indicative of future stock performance. The following table shows the peer groups in each year.
|
|
|
|
|
|
|
|
|
|
|
|
|
| Bridge Bancorp, Inc. |
|
Columbia Financial, Inc. |
|
Columbia Financial, Inc. |
|
|
|
| Bryn Mawr Bank Corporation |
|
Community Bank System, Inc. |
|
Community Bank System, Inc. |
|
|
|
| CNB Financial Corporation |
|
ConnectOne Bancorp, Inc. |
|
ConnectOne Bancorp, Inc. |
|
|
|
| Columbia Financial, Inc. |
|
Customers Bancorp, Inc. |
|
Customers Bancorp, Inc. |
|
|
|
| ConnectOne Bancorp, Inc. |
|
Dime Community Bancshares, Inc. |
|
Dime Community Bancshares, Inc. |
|
|
|
| Customers Bancorp, Inc. |
|
Eagle Bancorp, Inc. |
|
Eagle Bancorp, Inc. |
|
|
|
| Financial Institutions, Inc. |
|
First Commonwealth Financial Corporation |
|
First Commonwealth Financial Corporation |
|
|
|
| First Commonwealth Financial Corporation |
|
Flushing Financial Corporation |
|
Flushing Financial Corporation |
|
|
|
| The First of Long Island Corporation |
|
Kearny Financial Corp. |
|
Kearny Financial Corp. |
|
|
|
| Flushing Financial Corporation |
|
NBT Bancorp Inc. |
|
NBT Bancorp Inc. |
|
|
|
| Kearny Financial Corp. |
|
Northfield Bancorp, Inc. (Staten Island, NY) |
|
Northfield Bancorp, Inc. (Staten Island, NY) |
|
|
|
| NBT Bancorp Inc. |
|
Northwest Bancshares, Inc. |
|
Northwest Bancshares, Inc. |
|
|
|
| Northfield Bancorp, Inc. (Staten Island, NY) |
|
OceanFirst Financial Corp. |
|
OceanFirst Financial Corp. |
|
|
|
| Northwest Bancshares, Inc. |
|
Peapack-Gladstone Financial Corporation |
|
Peapack-Gladstone Financial Corporation |
|
|
|
| OceanFirst Financial Corp. |
|
Provident Financial Services, Inc. |
|
Provident Financial Services, Inc. |
|
|
|
| Peapack-Gladstone Financial Corporation |
|
S&T Bancorp, Inc. |
|
S&T Bancorp, Inc. |
|
|
|
| Provident Financial Services, Inc. |
|
Sandy Spring Bancorp, Inc. |
|
Sandy Spring Bancorp, Inc. |
|
|
|
| S&T Bancorp, Inc. |
|
Tompkins Financial Corporation |
|
Tompkins Financial Corporation |
|
|
|
| Sandy Spring Bancorp, Inc. |
|
Univest Financial Corporation |
|
Univest Financial Corporation |
|
|
|
| Tompkins Financial Corporation |
|
Washington Trust Bancorp, Inc. |
|
Washington Trust Bancorp, Inc. |
|
|
|
| Univest Financial Corporation |
|
WSFS Financial Corporation |
|
WSFS Financial Corporation |
|
|
|
| WSFS Financial Corporation |
|
|
|
|
|
|
|
| PEO Total Compensation Amount |
$ 3,097,917
|
$ 3,487,152
|
$ 2,459,101
|
| PEO Actually Paid Compensation Amount |
$ 2,765,549
|
4,720,973
|
2,022,640
|
| Adjustment To PEO Compensation, Footnote |
| (3) |
Compensation Actually Paid reflects the exclusions and inclusions of certain amounts for the PEO and the Non-PEO NEOs as set forth below. Equity values are calculated in accordance with FASB ASC Topic 718. Amounts in the Exclusion of Stock Awards column are the totals from the Stock Awards column set forth in the Summary Compensation Table. Amounts in the Exclusion of Change in Pension Value column reflect the amounts attributable to the Change in Pension Value reported in the Summary Compensation Table. Amounts in the Inclusion of Pension Service Cost are based on the service cost for services rendered during the listed year. |
|
|
|
|
|
|
|
|
|
|
|
|
|
|
|
|
|
|
|
|
|
|
|
|
|
|
|
Summary Compensation
Table Total for Thomas
|
|
|
Exclusion of Change
in Pension Value for
Thomas J. Shara
|
|
|
Exclusion of Stock
Awards for Thomas J.
|
|
|
Inclusion of Pension
Service Cost for Thomas
|
|
|
Inclusion of Equity
Values for Thomas J.
|
|
|
Compensation Actually
Paid to Thomas J. Shara
($) |
|
2022 |
|
|
3,097,917 |
|
|
|
— |
|
|
|
(1,018,100 |
) |
|
|
(211,061 |
) |
|
|
895,793 |
|
|
|
2,765,549 |
|
2021 |
|
|
3,487,152 |
|
|
|
(194,721 |
) |
|
|
(1,376,018 |
) |
|
|
162,232 |
|
|
|
2,642,328 |
|
|
|
4,720,973 |
|
2020 |
|
|
2,459,101 |
|
|
|
(231,767 |
) |
|
|
(591,199 |
) |
|
|
211,516 |
|
|
|
174,989 |
|
|
|
2,022,640 |
| The amounts in the Inclusion of Equity Values in the tables above are derived from the amounts set forth in the following tables:
|
|
|
|
|
|
|
|
|
|
|
|
|
Year-End Fair Value of Equity Awards Granted During Year That Remained Unvested as of Last Day of Year for Thomas J. Shara |
|
|
|
Vesting-Date Fair
Value of Equity
Awards Granted
During Year that
Vested During Year
for Thomas J. Shara
($) |
|
Change in Fair Value
from Last Day of
Prior Year to Vesting
Date of Unvested
Equity Awards that
Vested During Year |
|
Total - Inclusion of
Equity Values for
Thomas J. Shara
($) |
2022 |
|
1,016,692 |
|
(78,197) |
|
— |
|
(42,702) |
|
895,793 |
2021 |
|
2,184,103 |
|
370,285 |
|
— |
|
87,940 |
|
2,642,328 |
2020 |
|
430,952 |
|
(207,562) |
|
— |
|
(48,401) |
|
174,989 |
|
|
|
| Non-PEO NEO Average Total Compensation Amount |
$ 1,117,397
|
1,141,270
|
772,516
|
| Non-PEO NEO Average Compensation Actually Paid Amount |
$ 1,081,400
|
1,528,846
|
641,478
|
| Adjustment to Non-PEO NEO Compensation Footnote |
| (3) |
Compensation Actually Paid reflects the exclusions and inclusions of certain amounts for the PEO and the Non-PEO NEOs as set forth below. Equity values are calculated in accordance with FASB ASC Topic 718. Amounts in the Exclusion of Stock Awards column are the totals from the Stock Awards column set forth in the Summary Compensation Table. Amounts in the Exclusion of Change in Pension Value column reflect the amounts attributable to the Change in Pension Value reported in the Summary Compensation Table. Amounts in the Inclusion of Pension Service Cost are based on the service cost for services rendered during the listed year. |
|
|
|
|
|
|
|
|
|
|
|
|
|
|
|
|
|
|
|
|
|
|
|
|
|
|
|
Average Summary Compensation Table Total for Non-PEO NEOs
|
|
|
Average Exclusion of Change in Pension Value for Non-PEO NEOs
|
|
|
Average Exclusion of
Stock Awards for Non-
|
|
|
Average Inclusion of Pension Service Cost for Non-PEO NEOs
|
|
|
Average Inclusion of
Equity Values for Non-
|
|
|
Average Compensation
Actually Paid to Non-
|
|
| 2022 |
|
|
1,117,397 |
|
|
|
— |
|
|
|
(328,757 |
) |
|
|
— |
|
|
|
292,760 |
|
|
|
1,081,400 |
|
| 2021 |
|
|
1,141,270 |
|
|
|
— |
|
|
|
(426,060 |
) |
|
|
— |
|
|
|
813,636 |
|
|
|
1,528,846 |
|
| 2020 |
|
|
772,516 |
|
|
|
— |
|
|
|
(200,630 |
) |
|
|
— |
|
|
|
69,592 |
|
|
|
641,478 |
| The amounts in the Inclusion of Equity Values in the tables above are derived from the amounts set forth in the following tables:
|
|
|
|
|
|
|
|
|
|
|
|
|
|
|
|
|
|
|
|
|
|
|
Average Year-End Fair Value of Equity Awards Granted During Year That Remained Unvested as of Last Day of Year for Non-PEO NEOs
|
|
|
Average Change in Fair Value from Last Day of Prior Year to Last Day of Year of Unvested Equity Awards for Non-PEO NEOs
|
|
|
Average Vesting- Date Fair Value of Equity Awards Granted During Year that Vested During Year for Non-PEO NEOs
|
|
|
Average Change in
Fair Value from Last
Day of Prior Year to
Vesting Date of
Unvested Equity
Awards that Vested
During Year for Non-
|
|
|
Total - Average Inclusion of Equity Values for Non-PEO NEOs
|
|
2022 |
|
|
219,820 |
|
|
|
(13,458 |
) |
|
|
108,875 |
|
|
|
(22,477 |
) |
|
|
292,760 |
|
2021 |
|
|
525,156 |
|
|
|
129,456 |
|
|
|
133,422 |
|
|
|
25,602 |
|
|
|
813,636 |
|
2020 |
|
|
145,839 |
|
|
|
(67,185 |
) |
|
|
— |
|
|
|
(9,062 |
) |
|
|
69,592 |
|
|
|
|
| Compensation Actually Paid vs. Total Shareholder Return |
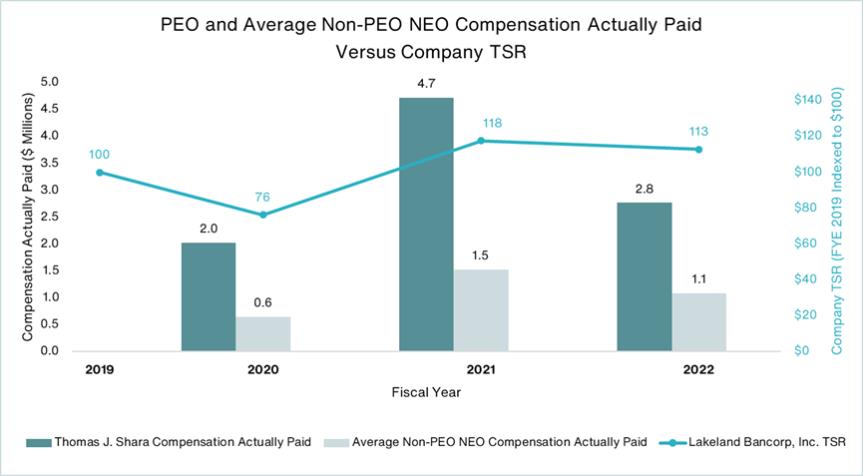
Relationship Between PEO and Non-PEO NEO Compensation Actually Paid and Company Total Shareholder Return (“TSR”) The following chart sets forth the relationship between Compensation Actually Paid to our PEO, the average of Compensation Actually Paid to our Non-PEO NEOs, and the Company’s cumulative TSR over the three most recently completed fiscal years.
|
|
|
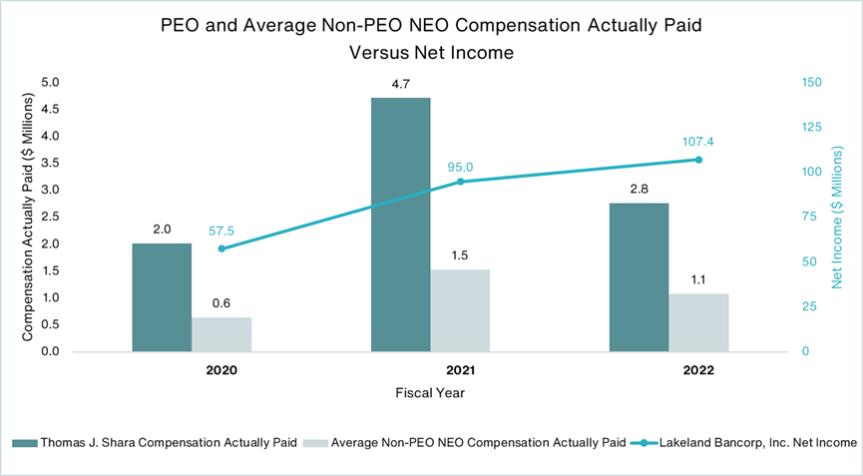
| Compensation Actually Paid vs. Net Income |
Relationship Between PEO and Non-PEO NEO Compensation Actually Paid and Net Income The following chart sets forth the relationship between Compensation Actually Paid to our PEO, the average of Compensation Actually Paid to our Non-PEO NEOs, and our Net Income during the three most recently completed fiscal years.
|
|
|
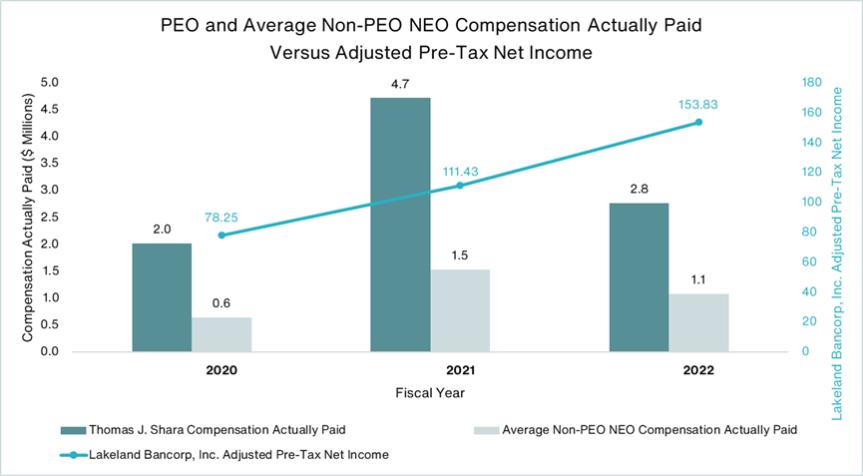
| Compensation Actually Paid vs. Company Selected Measure |
Relationship Between PEO and Non-PEO NEO Compensation Actually Paid and Adjusted Pre-Tax Net Income The following chart sets forth the relationship between Compensation Actually Paid to our PEO, the average of Compensation Actually Paid to our Non-PEO NEOs, and our Adjusted Pre-Tax Net Income during the three most recently completed fiscal years.
|
|
|
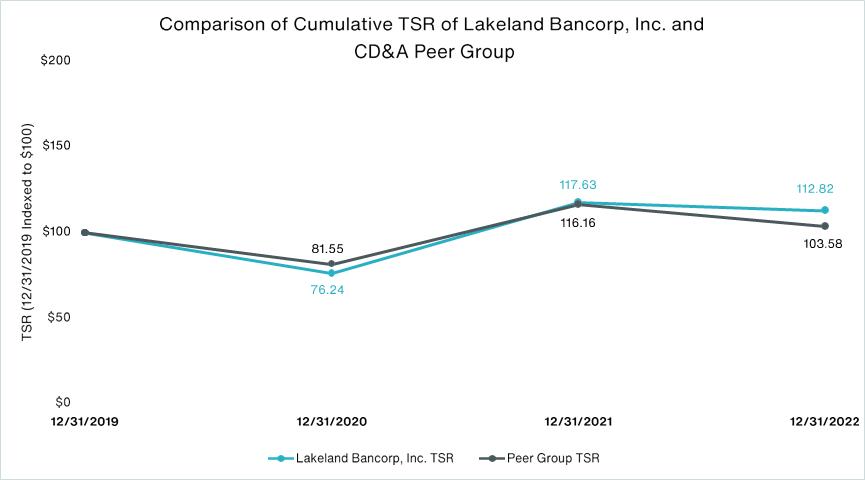
| Total Shareholder Return Vs Peer Group |
Relationship Between Company TSR and Peer Group TSR The following chart compares our cumulative TSR over the three most recently completed fiscal years to that of the peer group over the same period.
|
|
|
| Tabular List, Table |
Tabular List of Most Important Financial Performance Measures The following table presents the financial performance measures that the Company considers to have been the most important in linking Compensation Actually Paid to our PEO and other NEOs for 2022 to Company performance. The measures in this table are not ranked. Pre-tax Net Income Efficiency Ratio Relative Return on Average Equity Relative Total Shareholder Return
|
|
|
| Total Shareholder Return Amount |
$ 112.82
|
117.63
|
76.24
|
| Peer Group Total Shareholder Return Amount |
103.58
|
116.16
|
81.55
|
| Net Income (Loss) |
$ 107,400,000
|
$ 95,000,000
|
$ 57,500,000
|
| Company Selected Measure Amount |
153,830,000
|
111,430,000
|
78,250,000
|
| PEO Name |
Thomas J. Shara
|
|
|
| Measure:: 1 |
|
|
|
| Pay vs Performance Disclosure |
|
|
|
| Name |
Pre-tax Net Income
|
|
|
| Non-GAAP Measure Description |
2. We determined adjusted pre-tax net income to be the most important financial performance measure used to link Company performance to Compensation Actually Paid to our PEO and Non-PEO NEOs in 2022. Adjusted pre-tax net income is a non-GAAP financial measure used in our Annual Incentive Plan (AIP), and the Compensation Committee’s adjustments to this measure are described in the Compensation Discussion and Analysis of our proxy statements for each of our two most recent fiscal years. This performance measure may not have been the most important financial performance measure for years 2021 and 2020 and we may determine a different financial performance measure to be the most important financial performance measure in future years .
|
|
|
| Measure:: 2 |
|
|
|
| Pay vs Performance Disclosure |
|
|
|
| Name |
Efficiency Ratio
|
|
|
| Measure:: 3 |
|
|
|
| Pay vs Performance Disclosure |
|
|
|
| Name |
Relative Return on Average Equity
|
|
|
| Measure:: 4 |
|
|
|
| Pay vs Performance Disclosure |
|
|
|
| Name |
Relative Total Shareholder Return
|
|
|
| PEO | Exclusion of Change in Pension Value [Member] |
|
|
|
| Pay vs Performance Disclosure |
|
|
|
| Adjustment to Compensation, Amount |
|
$ (194,721)
|
$ (231,767)
|
| PEO | Exclusion of Stock Awards [Member] |
|
|
|
| Pay vs Performance Disclosure |
|
|
|
| Adjustment to Compensation, Amount |
$ (1,018,100)
|
(1,376,018)
|
(591,199)
|
| PEO | Inclusion of Pension Service Cost [Member] |
|
|
|
| Pay vs Performance Disclosure |
|
|
|
| Adjustment to Compensation, Amount |
(211,061)
|
162,232
|
211,516
|
| PEO | Inclusion of Equity Values [Member] |
|
|
|
| Pay vs Performance Disclosure |
|
|
|
| Adjustment to Compensation, Amount |
895,793
|
2,642,328
|
174,989
|
| PEO | Fair Value of Equity Awards Granted During Year That Remained Unvested [Member] |
|
|
|
| Pay vs Performance Disclosure |
|
|
|
| Adjustment to Compensation, Amount |
1,016,692
|
2,184,103
|
430,952
|
| PEO | Change in Fair Value from Last Day of Prior Year to Last Day of Year of Unvested Equity Awards [Member] |
|
|
|
| Pay vs Performance Disclosure |
|
|
|
| Adjustment to Compensation, Amount |
(78,197)
|
370,285
|
(207,562)
|
| PEO | Change in Fair Value from Last Day of Prior Year to Vesting Date of Unvested Equity Awards that Vested [Member] |
|
|
|
| Pay vs Performance Disclosure |
|
|
|
| Adjustment to Compensation, Amount |
(42,702)
|
87,940
|
(48,401)
|
| Non-PEO NEO | Exclusion of Stock Awards [Member] |
|
|
|
| Pay vs Performance Disclosure |
|
|
|
| Adjustment to Compensation, Amount |
(328,757)
|
(426,060)
|
(200,630)
|
| Non-PEO NEO | Inclusion of Equity Values [Member] |
|
|
|
| Pay vs Performance Disclosure |
|
|
|
| Adjustment to Compensation, Amount |
292,760
|
813,636
|
69,592
|
| Non-PEO NEO | Fair Value of Equity Awards Granted During Year That Remained Unvested [Member] |
|
|
|
| Pay vs Performance Disclosure |
|
|
|
| Adjustment to Compensation, Amount |
219,820
|
525,156
|
145,839
|
| Non-PEO NEO | Change in Fair Value from Last Day of Prior Year to Last Day of Year of Unvested Equity Awards [Member] |
|
|
|
| Pay vs Performance Disclosure |
|
|
|
| Adjustment to Compensation, Amount |
(13,458)
|
129,456
|
(67,185)
|
| Non-PEO NEO | Vesting Date Fair Value of Equity Awards Granted [Member] |
|
|
|
| Pay vs Performance Disclosure |
|
|
|
| Adjustment to Compensation, Amount |
108,875
|
133,422
|
|
| Non-PEO NEO | Change in Fair Value from Last Day of Prior Year to Vesting Date of Unvested Equity Awards that Vested [Member] |
|
|
|
| Pay vs Performance Disclosure |
|
|
|
| Adjustment to Compensation, Amount |
$ (22,477)
|
$ 25,602
|
$ (9,062)
|