Shiba Inu Continues To Hold Gains While Market Plummets
November 02 2022 - 8:38PM
NEWSBTC
Shiba has piggybacked on the recent meme coin surge to keep 13%
gains last week. The entire meme coin category enjoyed an upswing
in the last seven days thanks to Elon Musk’s Twitter takeover. The
main attention was on Dogecoin due to speculations of the
billionaire adding it as a payment option on the social media
platform. However, the Shiba army saw it as an opportunity to push
their token to the green zone. October 28 saw Shiba Inu break out
of its bullish pennant structure, attracting fresh buyers. This
bullish volatile break propelled Shiba towards its high liquidity
zone at the Point of Control (POC) in the $0.00001204-area. The
breakout has also helped the token register substantial gains on
the day. At press time, Shiba is trading at $0.00001204. Related
Reading: Bitcoin Bullish Signal: Whales With 1k-10k BTC Have Been
Accumulating Shiba’s Relationship With Dogecoin The value of Shiba
Inu has often increased simultaneously with that of Dogecoin.
Unless there is a sudden shift in the price of meme coins, this
pattern will likely persist, at least temporarily. On Halloween,
Musk posted a photo of a Shiba Inu dog wearing a Twitter outfit and
holding a Twitter pumpkin. He then added a wink emoji as a caption.
As expected, the value of Musk’s favorite cryptocurrency, Dogecoin,
increased, pulling Shiba Inu along. In the minutes following his
post, DOGE decreased by 3.02%. Shiba Inu also saw a significant
increase, but not as large as DOGE. It rose by almost 5% to a new
local high of $0.0000132. After the initial excitement subsided,
the Shiba Inu is now held a 5.17%, trading at $0.0000128. But as of
writing, Shiba Inu has shed all that gain and now trades at
$0.0000120, over 5%% loss. SHIB’s 20 EMA Become Strong Support
After Breakthrough. Shiba Inu concluded a compression period when
it surged above the $0.0000101 level. Buyers drove a volatile break
above the 20 EMA (cyan), the 50 EMA (blue), and the 200 EMA
(green). This latest upswing in SHIB has drawn a bullish pattern on
the 4-hour time frame. The pattern broke out after a robust
rejection of lower prices at the 20 EMA, accelerating buying
pressure. As the 20/50/200 EMAs all pointed north following the
golden cross, buyers could try controlling the short-term trend. A
rejection from the $0.000013 area might put an end to the run of
positive candlesticks. With that in mind, the price of $0.0000123
may serve as the first significant support level that bears try to
break. The token might see short-term gains if it closed above the
$0.0133 level immediately or eventually. As a result, SHIB may see
a bearish invalidation and try to revisit the $0.0000141 resistance
level. Related Reading: Brace For Impact, Bitcoin Price Holds At
$20,400 Ahead Of FOMC The Relative Strength Index (RSI) also rose
over 50, indicating robust purchasing power. The latest string of
green candlesticks also had large volumes that indicated an
underlying optimistic attitude. Buyers can measure the likelihood
of a bullish invalidation by watching for a big reversal on the
relative strength index. Featured image from Pixabay and chart from
TradingView.com
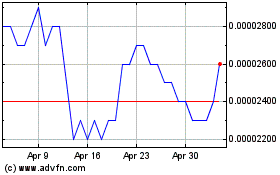
SHIBA INU (COIN:SHIBUSD)
Historical Stock Chart
From Mar 2024 to Apr 2024

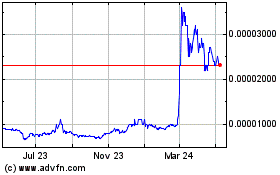
SHIBA INU (COIN:SHIBUSD)
Historical Stock Chart
From Apr 2023 to Apr 2024
