UNITED STATES
SECURITIES AND EXCHANGE COMMISSION
Washington, D.C. 20549
Form 6-K
REPORT OF FOREIGN PRIVATE ISSUER PURSUANT TO RULE 13a-16 OR 15d-16 UNDER THE SECURITIES EXCHANGE ACT OF 1934
For the month of February 2024
Commission File Number: 001-14642
ING Groep N.V.
(Translation of registrant's name into English)
Bijlmerdreef 106
1102 CT Amsterdam
The Netherlands
(Address of principal executive office)
Indicate by check mark whether the registrant files or will file annual reports under cover of Form 20-F or Form 40-F.
Form 20-F [ X ] Form 40-F [ ]
On February 1, 2024, the Registrant issued a press release, a copy of which is attached hereto as Exhibit 99.1 and is incorporated herein by reference.
(c) Exhibit 99.1. Press release dated February 1, 2024
SIGNATURES
Pursuant to the requirements of the Securities Exchange Act of 1934, the registrant has duly caused this report to be signed on its behalf by the undersigned, thereunto duly authorized.
| | | ING Groep N.V. |
| | | (Registrant) |
| | | |
| | | |
| Date: February 1, 2024 | | /s/ Raymond Vermeulen |
| | | Raymond Vermeulen |
| | | Head of External Communications & Media Relations |
| | | |
Exhibit 99.1
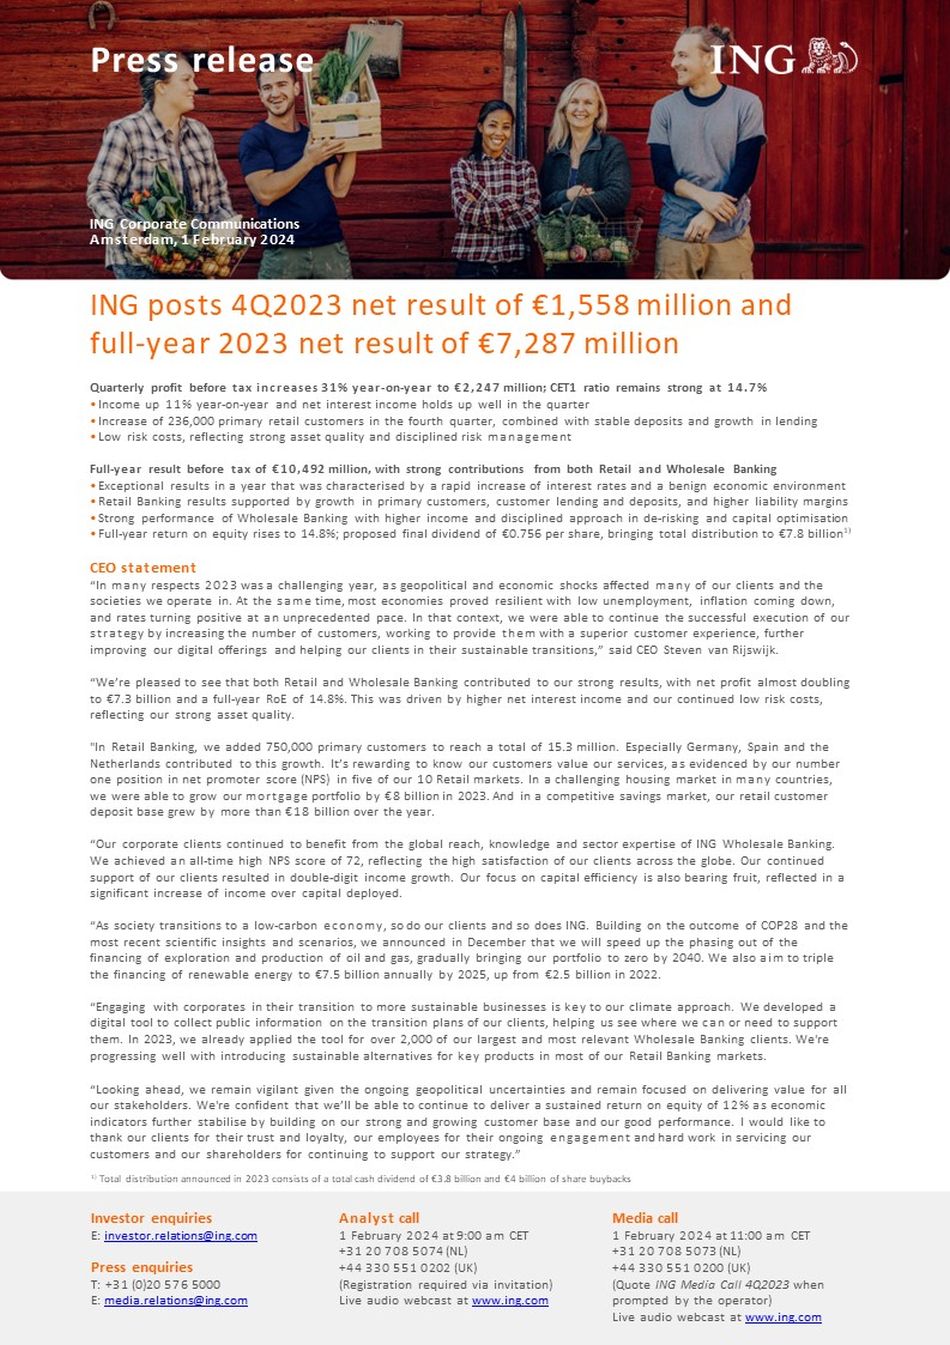
Press release ING Corporate Communications Amsterdam, 1 February 2024 ING posts 4Q2023 net result of €1,558 million and full - year 2023 net result of €7,287 million Quarterly profit before tax increases 31% year - on - year to €2,247 million; CET1 ratio remains strong at 14.7% • Income up 11% year - on - year and net interest income holds up well in the quarter • Increase of 236,000 primary retail customers in the fourth quarter, combined with stable deposits and growth in lending • Low risk costs, reflecting strong asset quality and disciplined risk management Full - year result before tax of €10,492 million, with strong contributions from both Retail and Wholesale Banking • Exceptional results in a year that was characterised by a rapid increase of interest rates and a benign economic environment • Retail Banking results supported by growth in primary customers, customer lending and deposits, and higher liability margins • Strong performance of Wholesale Banking with higher income and disciplined approach in de - risking and capital optimisation • Full - year return on equity rises to 14.8%; proposed final dividend of €0.756 per share, bringing total distribution to €7.8 billion 1) CEO statement “In many respects 2023 was a challenging year, as geopolitical and economic shocks affected many of our clients and the societies we operate in. At the same time, most economies proved resilient with low unemployment, inflation coming down, and rates turning positive at an unprecedented pace. In that context, we were able to continue the successful execution of our strategy by increasing the number of customers, working to provide them with a superior customer experience, further improving our digital offerings and helping our clients in their sustainable transitions,” said CEO Steven van Rijswijk. “We’re pleased to see that both Retail and Wholesale Banking contributed to our strong results, with net profit almost doubling to €7.3 billion and a full - year RoE of 14.8%. This was driven by higher net interest income and our continued low risk costs, reflecting our strong asset quality. "In Retail Banking, we added 750,000 primary customers to reach a total of 15.3 million. Especially Germany, Spain and the Netherlands contributed to this growth. It’s rewarding to know our customers value our services, as evidenced by our number one position in net promoter score (NPS) in five of our 10 Retail markets. In a challenging housing market in many countries, we were able to grow our mortgage portfolio by €8 billion in 2023. And in a competitive savings market, our retail customer deposit base grew by more than €18 billion over the year. “Our corporate clients continued to benefit from the global reach, knowledge and sector expertise of ING Wholesale Banking. We achieved an all - time high NPS score of 72, reflecting the high satisfaction of our clients across the globe. Our continued support of our clients resulted in double - digit income growth. Our focus on capital efficiency is also bearing fruit, reflected in a significant increase of income over capital deployed. “As society transitions to a low - carbon economy, so do our clients and so does ING. Building on the outcome of COP28 and the most recent scientific insights and scenarios, we announced in December that we will speed up the phasing out of the financing of exploration and production of oil and gas, gradually bringing our portfolio to zero by 2040. We also aim to triple the financing of renewable energy to €7.5 billion annually by 2025, up from €2.5 billion in 2022. “Engaging with corporates in their transition to more sustainable businesses is key to our climate approach. We developed a digital tool to collect public information on the transition plans of our clients, helping us see where we can or need to support them. In 2023, we already applied the tool for over 2,000 of our largest and most relevant Wholesale Banking clients. We're progressing well with introducing sustainable alternatives for key products in most of our Retail Banking markets. “Looking ahead, we remain vigilant given the ongoing geopolitical uncertainties and remain focused on delivering value for all our stakeholders. We're confident that we’ll be able to continue to deliver a sustained return on equity of 12% as economic indicators further stabilise by building on our strong and growing customer base and our good performance. I would like to thank our clients for their trust and loyalty, our employees for their ongoing engagement and hard work in servicing our customers and our shareholders for continuing to support our strategy.” 1) Total distribution announced in 2023 consists of a total cash dividend of €3.8 billion and €4 billion of share buybacks Investor enquiries E: investor.relations@ing.com Press enquiries T: +31 (0)20 576 5000 E: media.relations@ing.com Analyst call 1 February 2024 at 9:00 am CET +31 20 708 5074 (NL) +44 330 551 0202 (UK) (Registration required via invitation) Live audio webcast at www.ing.com Media call 1 February 2024 at 11:00 am CET +31 20 708 5073 (NL) +44 330 551 0200 (UK) (Quote ING Media Call 4Q2023 when prompted by the operator) Live audio webcast at www.ing.com

Primary customers 1) 15.3 mln +750,000 vs 4Q2022 Mobile - only customers 62% of total active customers vs 58% in 4Q2022 Net result €1,558 mln +43% vs 4Q2022 Fee income €879 mln - 1% vs 4Q2022 CET1 ratio 14.7% +0.2% vs 4Q2022 Return on equity full - year 14.8% +7.6% vs 2022 Customer experience NPS score: Ranked #1 in 5 of 10 Retail markets Primary customers 1) : +750,000 in 2023 Sustainability Volume mobilised 2) : €115 bln in 2023 vs €101 bln in 2022 ING Press Release 4Q2023 2 Sustainability deals supported by ING: 792 in 2023 vs 491 in 2022 Business Highlights We’re continuously working to provide a superior customer experience that’s easy, instant, personal and relevant. In the Netherlands, the online application process for business loans went live, consisting of an instant offer and decisioning, and digital signing. Instant lending is also available in Romania, Belgium, Türkiye and Poland. Another example is video consulting in Poland, an easy way to get direct access to our knowledge and expertise about mortgages, savings and investments. Since its launch in 2023, it has been well used and highly appreciated by our customers. Similar solutions are already being offered in other Retail countries. In 2023, ING joined the instant payment system in Romania for real - time transfers between local banks. One month after joining, ING reported the highest number of instant payments in Romania. At year - end, 80% of inter - bank transactions were done through this system and 60% of active customers benefited from at least one instant payment. ING continuously invests in security and the fight against fraud. Customers in Belgium can now flag which transactions are fraudulent, making it quicker to process their report. Since the launch, 40% of fraud cases are now reported through the app instead of by phone or email. Within Financial Markets, we rolled out several tech and product improvements to offer a superior customer experience. For currency trading, we’re involved in the first bank - to - bank trade for FX swaps via API, using technology to provide more efficient execution for our clients. In 2023, our primary customer base grew by 750,000 to 15.3 million, with the biggest contributions from Germany, Spain and the Netherlands. We have a number one NPS score in five of our 10 Retail markets. Wholesale Banking achieved an all - time high NPS score of 72 at year - end, driven by high satisfaction with our relationship managers' sector knowledge, pro - activity, clear communication and their understanding of their clients’ needs. 1) Includes private individuals only 2) See our Climate Report for definition We continue to facilitate the transition to a low - carbon economy and support our clients in their transitions. In 2023, we achieved a volume of sustainable finance mobilised 2) of €115 billion versus €101 billion in 2022 and we closed 792 sustainability transactions. We also collaborate with stakeholders in mitigating and adapting to climate change as we can't bring change on our own. Standard setting is a good example, which we've been involved in for shipping, steel and recently for the aluminium sector. Together with the Rocky Mountain Institute, aluminium industry participants and three other banks, we've developed the Sustainable Aluminum Finance Framework. This gives us a common measurement and approach for helping to make the sector more sustainable, which we then use to advise our clients and steer our portfolios. We're increasingly engaging with retail customers to support them in their sustainability ambitions. We offer, for instance, sustainable consumer loans and mortgage extensions, which can be used to improve the energy efficiency of homes. Sustainable mortgages, which provide an incentive to choose more energy - efficient homes, are available in the Netherlands, Germany, Belgium, Italy, Romania and Spain, which - in October - launched its sustainable mortgage proposition. This offers a discount for the most energy - efficient homes. The share of these homes in new origination increased from 2.7% to 4.1% since the launch. Society is transitioning to a low - carbon economy. So are our clients, and so is ING. We finance a lot of sustainable activities, but we still finance more that’s not. Follow our progress on ing.com/climate. We use technology and our insights to create innovative digital tools that help customers improve their financial health. We launched Everyday Roundup in the Netherlands. Customers can choose to round up their payments and automatically move the difference to their savings accounts. This makes saving instant and easy. At year - end, over 1.5 million people used this in the seven countries where it's offered, including 120,000 users in the Netherlands.
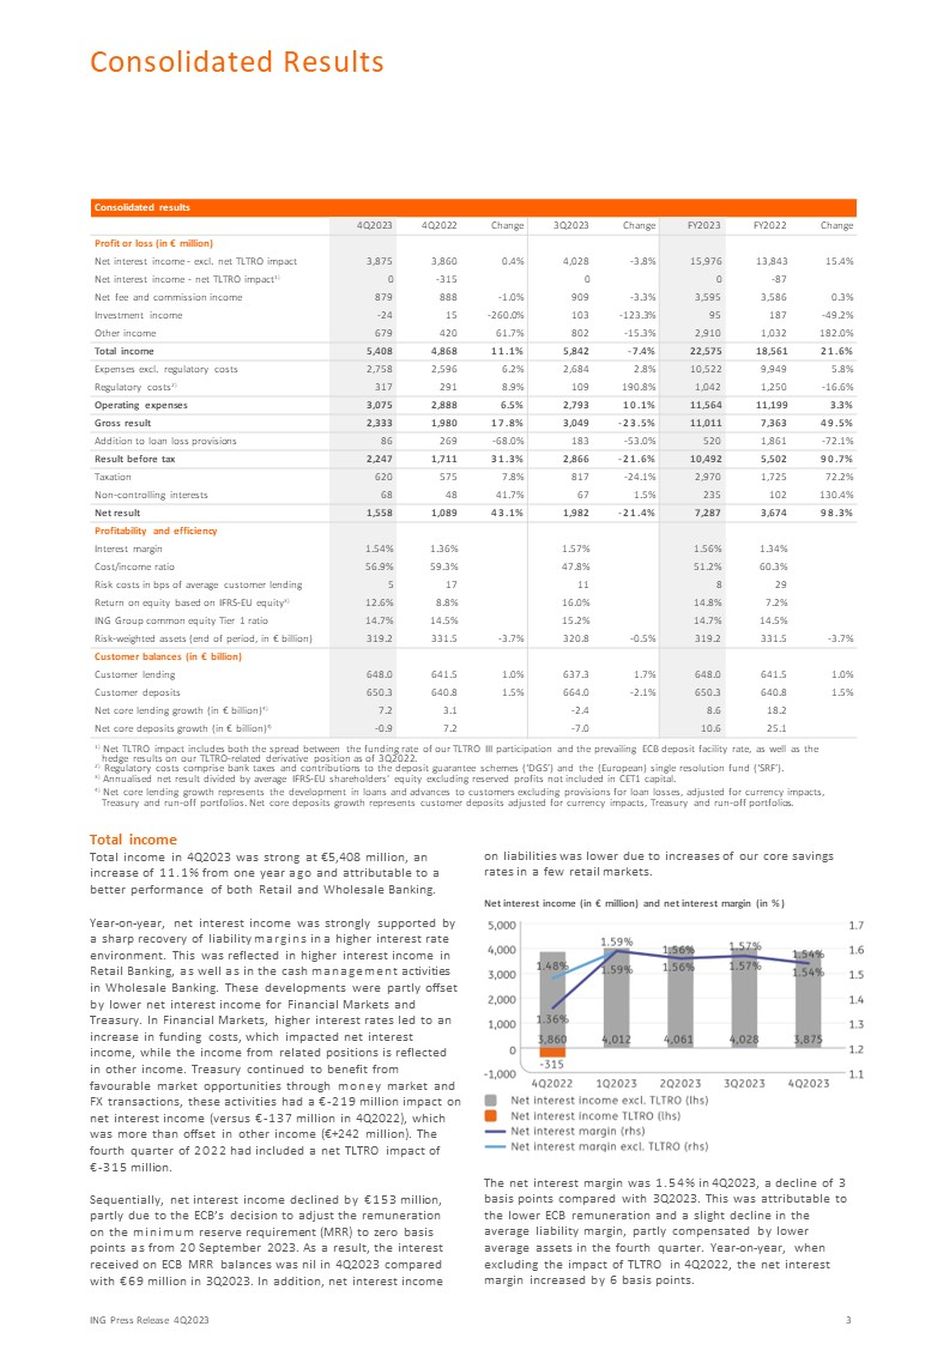
Consolidated results Change FY2022 FY2023 Change 3Q2023 Change 4Q2022 4Q2023 Profit or loss (in € million) 15.4% 13,843 15,976 - 3.8% 4,028 0.4% 3,860 3,875 Net interest income - excl. net TLTRO impact - 87 0 0 - 315 0 Net interest income - net TLTRO impact 1) 0.3% 3,586 3,595 - 3.3% 909 - 1.0% 888 879 Net fee and commission income - 49.2% 187 95 - 123.3% 103 - 260.0% 15 - 24 Investment income 182.0% 1,032 2,910 - 15.3% 802 61.7% 420 679 Other income 21.6% 18,561 22,575 - 7.4% 5,842 11.1% 4,868 5,408 Total income 5.8% 9,949 10,522 2.8% 2,684 6.2% 2,596 2,758 Expenses excl. regulatory costs - 16.6% 1,250 1,042 190.8% 109 8.9% 291 317 Regulatory costs 2) 3.3% 11,199 11,564 10.1% 2,793 6.5% 2,888 3,075 Operating expenses 49.5% 7,363 11,011 - 23.5% 3,049 17.8% 1,980 2,333 Gross result - 72.1% 1,861 520 - 53.0% 183 - 68.0% 269 86 Addition to loan loss provisions 90.7% 5,502 10,492 - 21.6% 2,866 31.3% 1,711 2,247 Result before tax 72.2% 1,725 2,970 - 24.1% 817 7.8% 575 620 Taxation 130.4% 102 235 1.5% 67 41.7% 48 68 Non - controlling interests 98.3% 3,674 7,287 - 21.4% 1,982 43.1% 1,089 1,558 Net result Profitability and efficiency 1.34% 1.56% 1.57% 1.36% 1.54% Interest margin 60.3% 51.2% 47.8% 59.3% 56.9% Cost/income ratio 29 8 11 17 5 Risk costs in bps of average customer lending 7.2% 14.8% 16.0% 8.8% 12.6% Return on equity based on IFRS - EU equity 3) 14.5% 14.7% 15.2% 14.5% 14.7% ING Group common equity Tier 1 ratio - 3.7% 331.5 319.2 - 0.5% 320.8 - 3.7% 331.5 319.2 Risk - weighted assets (end of period, in € billion) Customer balances (in € billion) 1.0% 641.5 648.0 1.7% 637.3 1.0% 641.5 648.0 Customer lending 1.5% 640.8 650.3 - 2.1% 664.0 1.5% 640.8 650.3 Customer deposits 18.2 8.6 - 2.4 3.1 7.2 Net core lending growth (in € billion) 4) 25.1 10.6 - 7.0 7.2 - 0.9 Net core deposits growth (in € billion) 4) hedge results on our TLTRO - related derivative position as of 3Q2022. 1) Net TLTRO impact includes both the spread between the funding rate of our TLTRO III participation and the prevailing ECB deposit facility rate, as well as the 2) Regulatory costs comprise bank taxes and contributions to the deposit guarantee schemes (‘DGS’) and the (European) single resolution fund (‘SRF’). 3) Annualised net result divided by average IFRS - EU shareholders' equity excluding reserved profits not included in CET1 capital. 4) Net core lending growth represents the development in loans and advances to customers excluding provisions for loan losses, adjusted for currency impacts, Treasury and run - off portfolios. Net core deposits growth represents customer deposits adjusted for currency impacts, Treasury and run - off portfolios. Total income Total income in 4Q2023 was strong at €5,408 million, an increase of 11.1% from one year ago and attributable to a better performance of both Retail and Wholesale Banking. Year - on - year, net interest income was strongly supported by a sharp recovery of liability margins in a higher interest rate environment. This was reflected in higher interest income in Retail Banking, as well as in the cash management activities in Wholesale Banking. These developments were partly offset by lower net interest income for Financial Markets and Treasury. In Financial Markets, higher interest rates led to an increase in funding costs, which impacted net interest income, while the income from related positions is reflected in other income. Treasury continued to benefit from favourable market opportunities through money market and FX transactions, these activities had a € - 219 million impact on net interest income (versus € - 137 million in 4Q2022), which was more than offset in other income (€+242 million). The fourth quarter of 2022 had included a net TLTRO impact of € - 315 million. Sequentially, net interest income declined by €153 million, partly due to the ECB’s decision to adjust the remuneration on the minimum reserve requirement (MRR) to zero basis points as from 20 September 2023. As a result, the interest received on ECB MRR balances was nil in 4Q2023 compared with €69 million in 3Q2023. In addition, net interest income on liabilities was lower due to increases of our core savings rates in a few retail markets. Net interest income (in € million) and net interest margin (in %) The net interest margin was 1.54% in 4Q2023, a decline of 3 basis points compared with 3Q2023. This was attributable to the lower ECB remuneration and a slight decline in the average liability margin, partly compensated by lower average assets in the fourth quarter. Year - on - year, when excluding the impact of TLTRO in 4Q2022, the net interest margin increased by 6 basis points. ING Press Release 4Q2023 3 Consolidated Results

In the fourth quarter of 2023, net core lending growth, which is customer lending growth adjusted for currency impacts and excluding movements in Treasury lending and in run - off portfolios, was €7.2 billion. Net core lending growth in Retail Banking was €3.8 billion as we managed to grow our loan book for both residential mortgages (€2.3 billion, primarily in Australia and the Netherlands) and other retail lending (€1.5 billion, mainly in Belgium). Wholesale Banking recorded a net core lending growth of €3.5 billion. On a full - year basis, net core lending increased by €8.6 billion, mainly driven by the growth in mortgages. Our diversified customer deposit base was resilient in the fourth quarter of 2023. Net core deposits growth (which excludes FX impacts and movements in Treasury deposits) of €2.5 billion in Retail Banking was offset by a €3.5 billion seasonal net outflow in Wholesale Banking (mainly related to Bank Mendes Gans). Retail Banking achieved growth in most of its markets, except for Germany, where deposits declined by €2.5 billion. This decline partly reflects a further shift in Germany from deposits to assets under management and follows an exceptional increase in deposits earlier in the year from a successful promotional campaign. For the full - year 2023, net core deposits growth totalled €10.6 billion, driven entirely by Retail Banking and with a particularly strong contribution from Germany, Spain and Poland. Net fee and commission income amounted to €879 million, which is 1.0% lower than in 4Q2022. Fee income for Retail Banking was slightly up, mainly on the back of higher daily banking fees, reflecting an increase in the number of primary customers and updated pricing for payment packages. This was partly offset by lower fee income from mortgage brokerage in Germany. Fee income for Wholesale Banking declined, as 4Q2022 had included several large Lending deals. This was only partly offset by a higher deal flow in Global Capital Markets. Sequentially, fee income declined by 3.3%. This mainly reflects seasonally lower travel - related fee income in Retail Banking, while fee income in Wholesale Banking increased due to a higher deal flow in Global Capital Markets and Corporate Finance. On a full - year basis, net fee and commission income edged up 0.3%. Wholesale Banking achieved 3.5% growth, driven by higher fees from Global Capital Markets. In Retail Banking, fee income declined 1.6%, as growth in daily banking could not fully compensate for lower mortgage brokerage volumes and a lower number of brokerage trades in investment products. Investment income declined to € - 24 million in 4Q2023 compared with €15 million in 4Q2022 due to a lower realised result on debt securities. Sequentially, investment income was lower, as 3Q2023 had included a €98 million annual dividend from our stake in the Bank of Beijing. Other income rose 61.7% compared with 4Q2022, which had included a €67 million gain from a legacy entity in Retail Belgium. The strong year - on - year increase was mainly driven by Treasury (partly offset in net interest income) and Wholesale Banking Lending (which had been impacted by negative fair value adjustments and secondary sales discounts in 4Q2022). Sequentially, other income decreased 15.3%, mainly due to lower trading results and additions to reserves in Financial Markets in this quarter, while 3Q2023 had included a €61 million gain from the release of reserves. Operating expenses Total operating expenses were € 3 , 075 million, including € 317 million of regulatory costs and € 114 million of incidental cost items . Expenses excluding regulatory costs and incidental items were €2,644 million and rose 5.1% year - on - year. This was primarily attributable to the impact of high inflation on staff expenses, driven by CLA increases and indexation, and an increase in FTEs. These factors were partly offset by savings from exiting the French and Philippine retail markets, as well as by positive FX impacts. Operating expenses (in € million) Quarter - on - quarter, expenses excluding regulatory costs and incidental items increased 3.2%. This was mainly due to higher staff and marketing expenses, and movements in provisions. ING Press Release 4Q2023 4 Regulatory costs in 4Q2023 were €317 million. Compared with 4Q2022, regulatory costs rose by €26 million, including a higher annual Dutch bank tax, which is always fully recorded in the fourth quarter. Incidental expense items in 4Q2023 amounted to €114 million, reflecting €95 million of restructuring costs and impairments (of which €78 million for Retail Banking and €17 million for Wholesale Banking), €7 million of allowances to employees in Germany to help them cover their increased energy costs and €12 million of hyperinflation accounting impacts on expenses in Türkiye (due to the accounting requirements of IAS 29). The €114 million of incidental item costs in 4Q2023 compares with €82 million of incidental items in 4Q2022 and €122 million in 3Q2023. Addition to loan loss provisions Net additions to loan loss provisions amounted to €86 million. This is equivalent to five basis points of average customer lending and remains significantly below the through - the - cycle average. Stage 3 risk costs were €156 million, down from €238 million in the previous quarter, almost fully due to a decline in Stage 3 individual risk costs. This was the result of relatively low provisions for new defaults and significant releases of existing provisions due to repayments and recoveries. Stage 3 collective risk costs decreased slightly, as the impact of model changes (mainly for mortgages) was more than offset by releases following an update of the macroeconomic indicators (including the expectation of higher house prices) and releases of event - driven overlays. Consolidated Results

Total Stage 1 and 2 risk costs were € - 70 million versus € - 54 million in 3Q2023. They were largely driven by the update of the macroeconomic model and a €19 million net release of Stage 2 provisions for our Russia - related portfolio, mainly due to a further reduction of our exposure. Addition to loan loss provisions (in € million) Risk costs for Retail Banking were €86 million, down from €166 million in 3Q2023, including limited net additions in Belgium, Germany and Poland (the latter due to a €21 million addition for adjustments to CHF - indexed mortgages). Retail Netherlands showed releases in risk costs, which were partly offset by a methodology update. Wholesale Banking recorded a €1 million release in risk costs (versus a €15 million addition in the prior quarter), with limited risk costs in Stage 3 and a net release in Stages 1 and 2, which included the impact of a further reduction of our Russia - related exposure and an update of the macroeconomic indicators. Net result ING’s net result in 4Q2023 was €1,558 million, up 43.1% on 4Q2022, mainly due to higher income and lower risk costs. The effective tax rate in 4Q2023 was 27.6% compared with 33.6% in 4Q2022 and 28.5% in 3Q2023. The full - year 2023 effective tax rate was 28.3%, down from 31.4% recorded in 2022 which had included non - deductible impairments on TTB (TMBThanachart Bank) and higher non - deductible expenses in various countries. Return on equity ING Group (in %) ING’s strong performance in 2023 was reflected in a return on average IFRS - EU equity of 14.8%, up from 7.2% in 2022. ING’s return on equity is calculated using IFRS - EU shareholders' equity after excluding 'reserved profit not included in CET1 capital', which amounted to €2,504 million at the end of 2023. This reflects 50% of the resilient net profit in 2023, which has been reserved for distribution in line with our 1) The targets, outlook and trends discussed in this 2024 Outlook section are forward - looking statements that are based on management’s current expectations and are subject to change, including as a result of the factors described under the section entitled ‘Important Legal Information’ in this document. ING assumes no obligation to publicly update or revise these forward - looking statements, whether as a result of new information or for any other reason. ING Press Release 4Q2023 5 policy, minus the 2023 interim dividend that was paid in August. Resilient net profit is defined as net profit adjusted for significant items that are not linked to the normal course of business. In line with this definition, and consistent with previous quarters, the impact of hyperinflation accounting has been excluded. Therefore, resilient net profit was €32 million higher than net profit in 4Q2023 and €234 million higher on a full - year basis. Dividend In line with our dividend policy, the Board proposes to pay a final dividend over 2023 of €2.5 billion, subject to the approval by the Annual General Meeting in April 2024. The proposed final dividend over 2023 amounts to €0.756 per ordinary share and will be paid in cash shortly after approval by the Annual General Meeting. This will bring the total cash dividend over 2023 to €3.8 billion, in addition to €4 billion of share buybacks announced in 2023. An interim dividend of €0.35 per ordinary share for the year 2023 was paid in August 2023. 2024 Outlook 1) Based on current assumptions and scenarios, total income in 2024 to remain strong in a positive rate environment albeit somewhat lower than in 2023. Our aim is to increase fee income by 5 - 10%. Based on the current outlook, a total cost growth of around 3% (excluding incidental items) is foreseen. The CET1 ratio is expected to converge towards our ~12.5% target by 2025. Return on equity expected of 12%. Consolidated Results
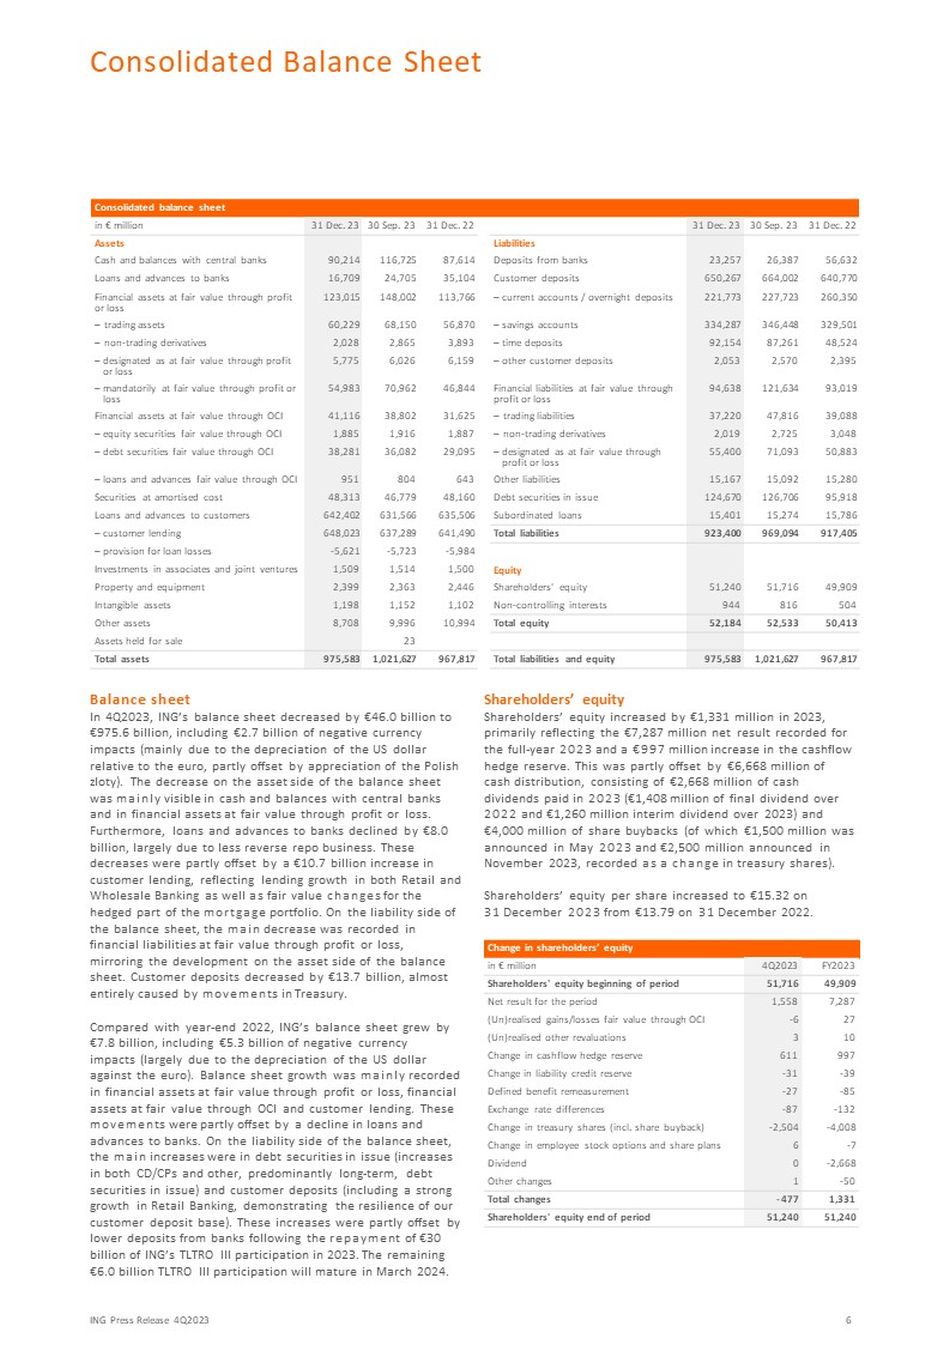
Consolidated balance sheet 31 Dec. 22 30 Sep. 23 31 Dec. 23 in € million Assets 87,614 116,725 90,214 Cash and balances with central banks 35,104 24,705 16,709 Loans and advances to banks 113,766 148,002 123,015 Financial assets at fair value through profit or loss 56,870 68,150 60,229 – trading assets 3,893 2,865 2,028 – non - trading derivatives 6,159 6,026 5,775 – designated as at fair value through profit or loss 46,844 70,962 54,983 – mandatorily at fair value through profit or loss 31,625 38,802 41,116 Financial assets at fair value through OCI 1,887 1,916 1,885 – equity securities fair value through OCI 29,095 36,082 38,281 – debt securities fair value through OCI 643 804 951 – loans and advances fair value through OCI 48,160 46,779 48,313 Securities at amortised cost 635,506 631,566 642,402 Loans and advances to customers 641,490 637,289 648,023 – customer lending - 5,984 - 5,723 - 5,621 – provision for loan losses 1,500 1,514 1,509 Investments in associates and joint ventures 2,446 2,363 2,399 Property and equipment 1,102 1,152 1,198 Intangible assets 10,994 9,996 8,708 Other assets 23 Assets held for sale 967,817 1,021,627 975,583 Total assets 31 Dec. 22 30 Sep. 23 31 Dec. 23 Liabilities 56,632 26,387 23,257 Deposits from banks 640,770 664,002 650,267 Customer deposits 260,350 227,723 221,773 – current accounts / overnight deposits 329,501 346,448 334,287 – savings accounts 48,524 87,261 92,154 – time deposits 2,395 2,570 2,053 – other customer deposits 93,019 121,634 94,638 Financial liabilities at fair value through profit or loss 39,088 47,816 37,220 – trading liabilities 3,048 2,725 2,019 – non - trading derivatives 50,883 71,093 55,400 – designated as at fair value through profit or loss 15,280 15,092 15,167 Other liabilities 95,918 126,706 124,670 Debt securities in issue 15,786 15,274 15,401 Subordinated loans 917,405 969,094 923,400 Total liabilities Equity 49,909 51,716 51,240 Shareholders' equity 504 816 944 Non - controlling interests 50,413 52,533 52,184 Total equity 967,817 1,021,627 975,583 Total liabilities and equity Balance sheet In 4Q2023, ING’s balance sheet decreased by €46.0 billion to €975.6 billion, including €2.7 billion of negative currency impacts (mainly due to the depreciation of the US dollar relative to the euro, partly offset by appreciation of the Polish zloty). The decrease on the asset side of the balance sheet was mainly visible in cash and balances with central banks and in financial assets at fair value through profit or loss. Furthermore, loans and advances to banks declined by €8.0 billion, largely due to less reverse repo business. These decreases were partly offset by a €10.7 billion increase in customer lending, reflecting lending growth in both Retail and Wholesale Banking as well as fair value changes for the hedged part of the mortgage portfolio. On the liability side of the balance sheet, the main decrease was recorded in financial liabilities at fair value through profit or loss, mirroring the development on the asset side of the balance sheet. Customer deposits decreased by €13.7 billion, almost entirely caused by movements in Treasury. Compared with year - end 2022, ING’s balance sheet grew by €7.8 billion, including €5.3 billion of negative currency impacts (largely due to the depreciation of the US dollar against the euro). Balance sheet growth was mainly recorded in financial assets at fair value through profit or loss, financial assets at fair value through OCI and customer lending. These movements were partly offset by a decline in loans and advances to banks. On the liability side of the balance sheet, the main increases were in debt securities in issue (increases in both CD/CPs and other, predominantly long - term, debt securities in issue) and customer deposits (including a strong growth in Retail Banking, demonstrating the resilience of our customer deposit base). These increases were partly offset by lower deposits from banks following the repayment of €30 billion of ING’s TLTRO III participation in 2023. The remaining €6.0 billion TLTRO III participation will mature in March 2024. Shareholders’ equity Shareholders’ equity increased by €1,331 million in 2023, primarily reflecting the €7,287 million net result recorded for the full - year 2023 and a €997 million increase in the cashflow hedge reserve. This was partly offset by €6,668 million of cash distribution, consisting of €2,668 million of cash dividends paid in 2023 (€1,408 million of final dividend over 2022 and €1,260 million interim dividend over 2023) and €4,000 million of share buybacks (of which €1,500 million was announced in May 2023 and €2,500 million announced in November 2023, recorded as a change in treasury shares). Shareholders’ equity per share increased to €15.32 on 31 December 2023 from €13.79 on 31 December 2022. Change in shareholders’ equity ING Press Release 4Q2023 6 FY2023 4Q2023 in € million 49,909 51,716 Shareholders' equity beginning of period 7,287 1,558 Net result for the period 27 - 6 (Un)realised gains/losses fair value through OCI 10 3 (Un)realised other revaluations 997 611 Change in cashflow hedge reserve - 39 - 31 Change in liability credit reserve - 85 - 27 Defined benefit remeasurement - 132 - 87 Exchange rate differences - 4,008 - 2,504 Change in treasury shares (incl. share buyback) - 7 6 Change in employee stock options and share plans - 2,668 0 Dividend - 50 1 Other changes 1,331 - 477 Total changes 51,240 51,240 Shareholders' equity end of period Consolidated Balance Sheet

ING Group: Capital position 30 Sep. 2023 31 Dec. 2023 in € million 51,716 - 1,709 - 1,123 51,240 - 2,504 - 1,880 Shareholders' equity (parent) Reserved profits not included in CET1 capital Other regulatory adjustments 48,885 46,856 Available common equity Tier 1 capital 7,280 54 6,983 59 Additional Tier 1 securities Regulatory adjustments additional Tier 1 56,218 53,898 Available Tier 1 capital 9,123 9,115 Supplementary capital - Tier 2 bonds 41 40 Regulatory adjustments Tier 2 65,383 63,052 Available Total capital 320,797 319,169 Risk - weighted assets 15.2% 14.7% Common equity Tier 1 ratio 17.5% 16.9% Tier 1 ratio 20.4% 19.8% Total capital ratio 5.0% 5.0% Leverage Ratio Capital ratios The CET1 ratio remained strong and ended the year at 14.7%. This compares with 15.2% at the end of 3Q2023. The change during the quarter mainly reflects the €2.5 billion deduction from capital for the ongoing share buyback programme, as announced on 2 November 2023, partly offset by the inclusion of €0.8 billion of the quarterly net profit after dividend reserving and lower RWA. The development of both the Tier 1 and the Total capital ratios mirrors the trend in the CET1 ratio. The leverage ratio remained stable at 5.0%. Risk - weighted assets (RWA) The decrease in total RWA mainly reflects lower credit RWA, which was partly offset by higher operational RWA. ING Group: Composition of RWA ING Press Release 4Q2023 7 30 Sep. 2023 31 Dec. 2023 in € billion 270.8 266.4 Credit RWA 35.0 38.5 Operational RWA 15.0 14.3 Market RWA 320.8 319.2 Total RWA Excluding a €1.0 billion FX impact, credit RWA decreased by €3.5 billion, mainly due to a better profile of the loan book (€ - 1.4 billion) and model changes for Germany (€ - 4.0 billion). These factors were only partly offset by higher lending volumes (€+2.0 billion). Operational RWA rose by € 3 . 5 billion in 4 Q 2023 due to updated assumptions of the AMA model . Market RWA decreased by € 0 . 7 billion . Distribution ING has reserved €795 million of the 4Q2023 net profit for distribution. Resilient net profit in 4Q2023, which is defined as net profit adjusted for significant items not linked to the normal course of business, was €1,590 million. This includes a positive adjustment to the reported net result of €32 million, which is related to hyperinflation accounting according to IAS 29 in the consolidation of our subsidiary in Türkiye. In line with our distribution policy of a 50% pay - out ratio on resilient net profit, the Board proposes to pay a final cash dividend over 2023 of €0.756 per ordinary share. This is subject to the approval by shareholders at the Annual General Meeting in April 2024. The additional distribution of €1.5 billion, as announced on 11 May 2023, was completed in the fourth quarter of 2023. A total of 121.3 million ordinary shares had been repurchased by 13 October 2023. On 2 November 2023, ING announced the start of a share buyback programme under which it plans to repurchase ordinary shares of ING Group for a maximum total amount of €2.5 billion, or a maximum of 300 million shares. This programme is underway and expected to end no later than 19 April 2024. The whole amount has already been deducted from CET1 capital. At the end of 2023, shares for a total consideration of almost €2.0 billion had already been repurchased. CET1 requirement ING targets a CET1 ratio of around 12.5%, which is comfortably above the prevailing CET1 ratio requirement (including buffer requirements) of 10.98%. This requirement remained stable compared with 3Q2023. ING’s fully - loaded CET1 requirement decreased to 10.76% in 4Q2023 (from 10.83% in 3Q2023). This is lower than the prevailing CET1 ratio requirement, mainly as a result of a reduction in the Pillar - 2 - Requirement as announced in 4Q2023 and the 0.50% lower O - SII (Other Systemically Important Institutions) buffer requirement effective as of 31 May 2024. The impact of these factors is partly offset by various countercyclical buffers that will take effect over the coming quarters. The fully - loaded CET1 requirement also reflects the re - activation of the countercyclical buffer in Belgium to 1% from 1 October 2024, which will be phased in over the coming quarters. MREL and TLAC requirements Minimum Required Eligible Liabilities (MREL) and Total Loss Absorbing Capacity (TLAC) requirements apply to ING Group at the consolidated level of the resolution group. The available MREL and TLAC capacity consists of own funds and senior debt instruments issued by ING Group. Capital, Liquidity and Funding
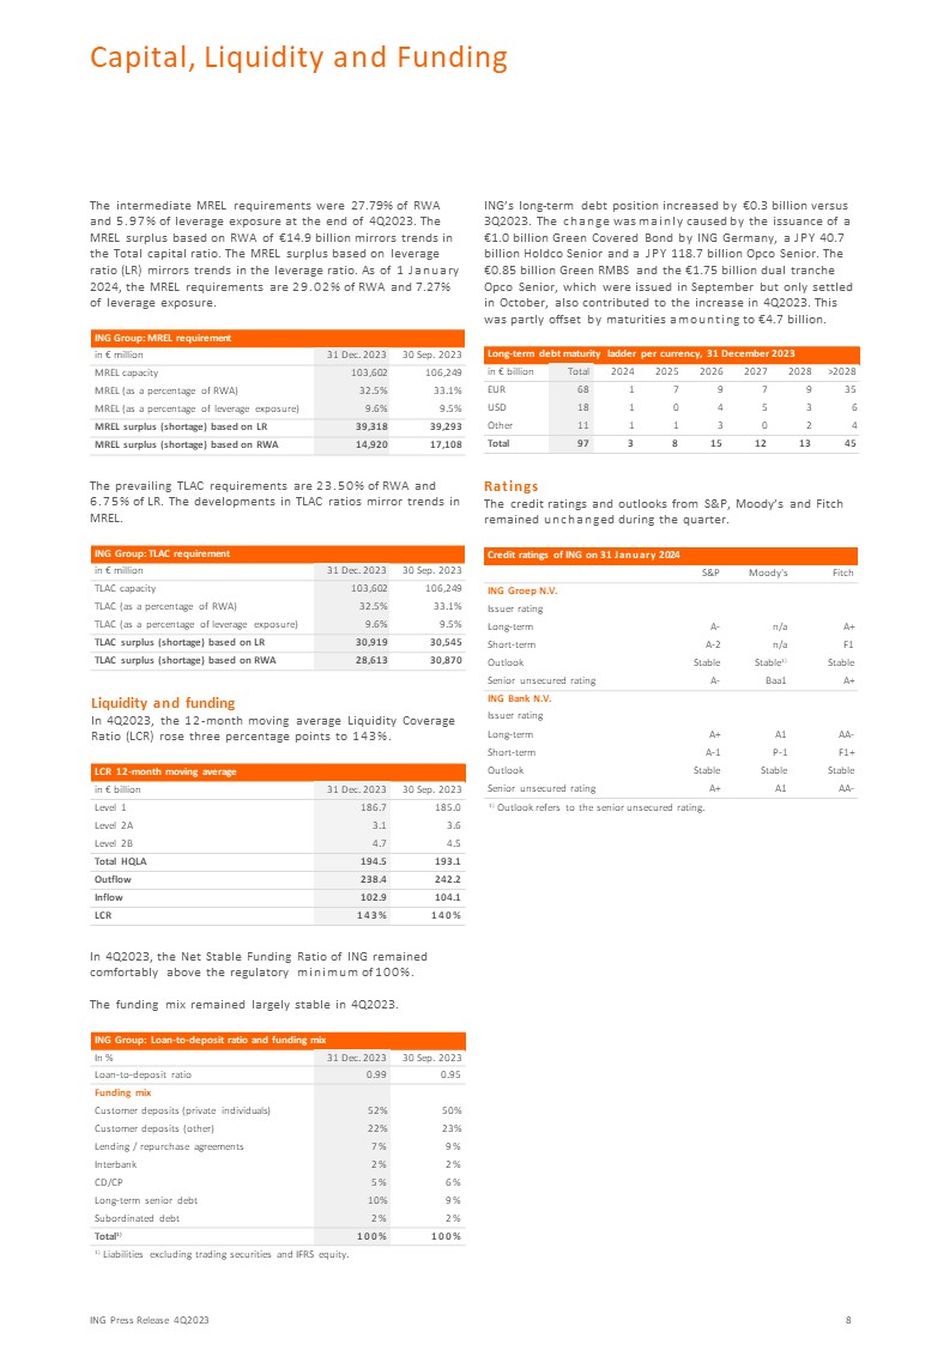
The intermediate MREL requirements were 27.79% of RWA and 5.97% of leverage exposure at the end of 4Q2023. The MREL surplus based on RWA of €14.9 billion mirrors trends in the Total capital ratio. The MREL surplus based on leverage ratio (LR) mirrors trends in the leverage ratio. As of 1 January 2024, the MREL requirements are 29.02% of RWA and 7.27% of leverage exposure. ING Group: MREL requirement 30 Sep. 2023 31 Dec. 2023 in € million 106,249 103,602 MREL capacity 33.1% 32.5% MREL (as a percentage of RWA) 9.5% 9.6% MREL (as a percentage of leverage exposure) 39,293 39,318 MREL surplus (shortage) based on LR 17,108 14,920 MREL surplus (shortage) based on RWA The prevailing TLAC requirements are 23.50% of RWA and 6.75% of LR. The developments in TLAC ratios mirror trends in MREL. ING Group: TLAC requirement 30 Sep. 2023 31 Dec. 2023 in € million 106,249 103,602 TLAC capacity 33.1% 32.5% TLAC (as a percentage of RWA) 9.5% 9.6% TLAC (as a percentage of leverage exposure) 30,545 30,919 TLAC surplus (shortage) based on LR 30,870 28,613 TLAC surplus (shortage) based on RWA 30 Sep. 2023 31 Dec. 2023 in € billion 185.0 186.7 Level 1 3.6 3.1 Level 2A 4.5 4.7 Level 2B 193.1 194.5 Total HQLA 242.2 238.4 Outflow 104.1 102.9 Inflow 140% 143% LCR In 4Q2023, the Net Stable Funding Ratio of ING remained comfortably above the regulatory minimum of 100%. The funding mix remained largely stable in 4Q2023. ING Group: Loan - to - deposit ratio and funding mix 30 Sep. 2023 31 Dec. 2023 In % 0.95 0.99 Loan - to - deposit ratio Funding mix 50% 52% Customer deposits (private individuals) 23% 22% Customer deposits (other) 9% 7% Lending / repurchase agreements 2% 2% Interbank 6% 5% CD/CP 9% 10% Long - term senior debt 2% 2% Subordinated debt 100% 100% Total 1) 1) Liabilities excluding trading securities and IFRS equity. ING’s long - term debt position increased by €0.3 billion versus 3Q2023. The change was mainly caused by the issuance of a €1.0 billion Green Covered Bond by ING Germany, a JPY 40.7 billion Holdco Senior and a JPY 118.7 billion Opco Senior. The €0.85 billion Green RMBS and the €1.75 billion dual tranche Opco Senior, which were issued in September but only settled in October, also contributed to the increase in 4Q2023. This was partly offset by maturities amounting to €4.7 billion. Long - term debt maturity ladder per currency, 31 December 2023 ING Press Release 4Q2023 8 >2028 2028 2027 2026 2025 2024 Total in € billion 35 9 7 9 7 1 68 EUR 6 3 5 4 0 1 18 USD 4 2 0 3 1 1 11 Other 45 13 12 15 8 3 97 Total Ratings The credit ratings and outlooks from S&P, Moody’s and Fitch remained unchanged during the quarter. Credit ratings of ING on 31 January 2024 Fitch Moody's S&P ING Groep N.V. Issuer rating A+ n/a A - Long - term F1 n/a A - 2 Short - term Stable Stable 1) Stable Outlook A+ Baa1 A - Senior unsecured rating ING Bank N.V. Issuer rating AA - A1 A+ Long - term F1+ P - 1 A - 1 Short - term Stable Stable Stable Outlook AA - A1 A+ Senior unsecured rating Liquidity and funding In 4Q2023, the 12 - month moving average Liquidity Coverage Ratio (LCR) rose three percentage points to 143%. LCR 12 - month moving average 1) Outlook refers to the senior unsecured rating. Capital, Liquidity and Funding

ING Press Release 4Q2023 9 ING Group: Total credit outstandings 1) Stage 3 ratio 31 Dec. 30 Sep. 2023 2023 Stage 3 31 Dec. 30 Sep. 2023 2023 Stage 2 ratio 31 Dec. 30 Sep. 2023 2023 Stage 2 31 Dec. 30 Sep. 2023 2023 Credit outstandings 31 Dec. 30 Sep. 2023 2023 in € million 0.9% 0.9% 3,060 3,107 3.5% 6.5% 11,534 21,691 330,024 333,311 Residential mortgages 0.4% 0.5% 513 532 2.0% 9.6% 2,303 11,098 114,454 115,075 of which Netherlands 2.9% 2.9% 1,280 1,276 12.2% 11.9% 5,327 5,198 43,632 43,826 of which Belgium 0.5% 0.5% 447 462 2.1% 2.3% 1,932 2,123 92,377 92,574 of which Germany 1.0% 1.0% 820 838 2.5% 4.0% 1,972 3,271 79,560 81,836 of which Rest of the world 4.5% 4.6% 1,097 1,119 8.4% 11.2% 2,029 2,742 24,116 24,488 Consumer lending 3.1% 3.0% 3,143 3,117 14.0% 13.8% 14,381 14,362 102,581 104,157 Business lending 2.3% 2.1% 857 767 15.3% 15.2% 5,731 5,661 37,453 37,140 of which business lending Netherlands 3.3% 3.2% 1,510 1,522 9.5% 9.5% 4,405 4,562 46,170 47,655 of which business lending Belgium 0.2% 0.3% 214 208 0.6% 1.0% 553 577 85,802 60,143 Other retail banking 1.4% 1.4% 7,514 7,552 5.3% 7.5% 28,497 39,372 542,523 522,099 Retail Banking 2.3% 0.8% 0.0% 0.2% 2.1% 0.8% 0.0% 0.2% 3,899 489 60 3,461 479 60 11.9% 8.9% 8.6% 1.2% 10.8% 8.4% 2.2% 1.3% 20,124 5,349 796 402 17,949 4,886 319 339 169,457 60,347 9,236 32,589 165,584 58,006 14,459 26,503 Lending Daily Banking & Trade Finance Financial Markets Treasury & Other 1.6% 1.5% 4,448 4,000 9.8% 8.9% 26,672 23,492 271,630 264,552 Wholesale Banking 1.5% 1.5% 11,962 11,552 6.8% 8.0% 55,169 62,864 814,152 786,652 Total loan book 1) Lending and money market credit outstandings, including guarantees and letters of credit but excluding undrawn committed exposures (off - balance positions) and Corporate Line. Credit risk management Total credit outstandings decreased in 4Q2023, mainly due to lower cash and balances with central banks. Stage 2 credit outstandings increased, driven by the implementation of an updated methodology for interest - only mortgages in the Netherlands. This was partly offset by repayments and sales in Wholesale Banking. Stage 3 credit outstandings also declined, as a result of repayments and write - offs. The stock of provisions decreased slightly due to lower Stage 1 and Stage 2 provisions. The Stage 3 coverage ratio rose to 33.6% from 32.2% in the previous quarter. The loan portfolio consists predominantly of asset - based and secured loans, including residential mortgages, project - and asset - based finance, and real estate finance, with generally low loan - to - value ratios. ING Group: Stock of provisions 1) Change 30 Sep. 2023 31 Dec. 2023 in € million - 96 612 517 Stage 1 - 12 - month ECL - 24 1,459 1,435 Stage 2 - Lifetime ECL not credit impaired 27 3,849 3,876 Stage 3 - Lifetime ECL credit impaired - 4 15 11 Purchased credit impaired - 96 5,935 5,839 Total 1) At the end of December 2023, the stock of provisions included provisions for loans and advances to customers (€5,621 million), loans and advances to central banks (€5 million), loans and advances to banks (€30 million), financial assets at FVOCI (€21 million), securities at amortised cost (€22 million) and ECL provisions for off - balance - sheet exposures (€142 million) recognised as liabilities. Market risk The average Value - at - Risk (VaR) for the trading portfolio decreased to €17 million from €18 million in 3Q2023. ING Group: Consolidated VaR trading books Quarter - end Average in € million 1 1 Foreign exchange 2 3 Equities 7 13 Interest rate 5 6 Credit spread - 8 - 6 Diversification 8 17 Total VaR Non - financial risk As previously disclosed, after our September 2018 settlement with Dutch authorities concerning Anti - Money Laundering matters, and in the context of significantly increased attention to the prevention of financial economic crime, ING has experienced heightened scrutiny by authorities in various countries. The interactions with such regulatory and judicial authorities have included, and can be expected to continue to include, onsite visits, information requests, investigations and other enquiries. Such interactions, as well as ING’s internal assessments in connection with its global enhancement programme, have in some cases resulted in satisfactory outcomes. Some have also resulted in, and may continue to result in, findings or other conclusions which may require appropriate remedial actions by ING, or may have other consequences. We intend to continue to work in close cooperation with authorities as we work to improve our management of non - financial risks. ING is also aware, including as a result of media reports, that other parties may, among other things, seek to commence legal proceedings against ING in connection with the subject matter of the settlement. Risk Management
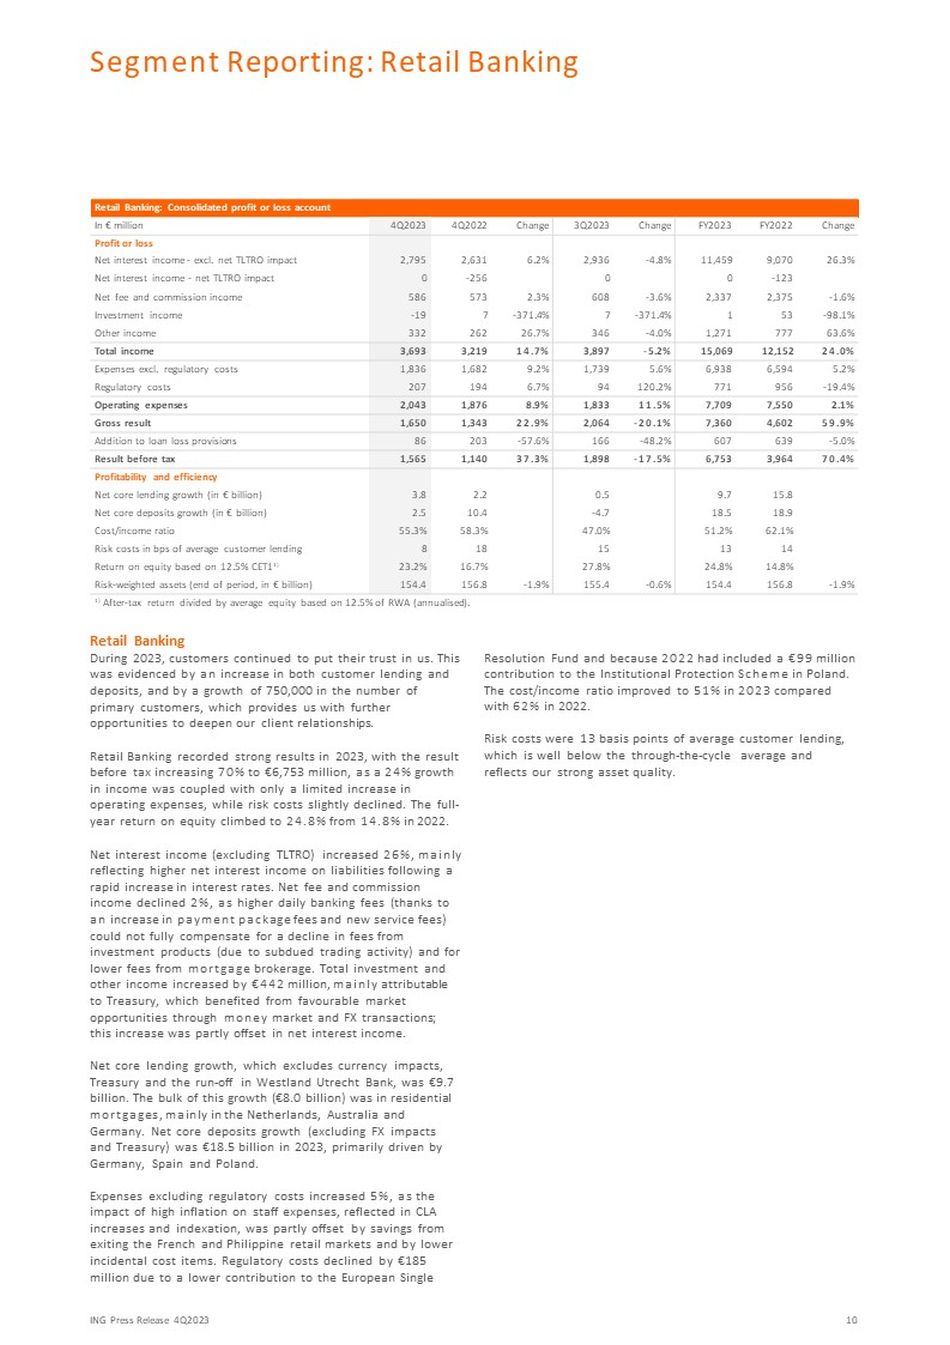
Retail Banking: Consolidated profit or loss account ING Press Release 4Q2023 10 Change FY2022 FY2023 Change 3Q2023 Change 4Q2022 4Q2023 In € million Profit or loss 26.3% 9,070 11,459 - 4.8% 2,936 6.2% 2,631 2,795 Net interest income - excl. net TLTRO impact - 123 0 0 - 256 0 Net interest income - net TLTRO impact - 1.6% 2,375 2,337 - 3.6% 608 2.3% 573 586 Net fee and commission income - 98.1% 53 1 - 371.4% 7 - 371.4% 7 - 19 Investment income 63.6% 777 1,271 - 4.0% 346 26.7% 262 332 Other income 24.0% 12,152 15,069 - 5.2% 3,897 14.7% 3,219 3,693 Total income 5.2% 6,594 6,938 5.6% 1,739 9.2% 1,682 1,836 Expenses excl. regulatory costs - 19.4% 956 771 120.2% 94 6.7% 194 207 Regulatory costs 2.1% 7,550 7,709 11.5% 1,833 8.9% 1,876 2,043 Operating expenses 59.9% 4,602 7,360 - 20.1% 2,064 22.9% 1,343 1,650 Gross result - 5.0% 639 607 - 48.2% 166 - 57.6% 203 86 Addition to loan loss provisions 70.4% 3,964 6,753 - 17.5% 1,898 37.3% 1,140 1,565 Result before tax Profitability and efficiency 15.8 9.7 0.5 2.2 3.8 Net core lending growth (in € billion) 18.9 18.5 - 4.7 10.4 2.5 Net core deposits growth (in € billion) 62.1% 51.2% 47.0% 58.3% 55.3% Cost/income ratio 14 13 15 18 8 Risk costs in bps of average customer lending 14.8% 24.8% 27.8% 16.7% 23.2% Return on equity based on 12.5% CET1 1) - 1.9% 156.8 154.4 - 0.6% 155.4 - 1.9% 156.8 154.4 Risk - weighted assets (end of period, in € billion) 1) After - tax return divided by average equity based on 12.5% of RWA (annualised). Retail Banking During 2023, customers continued to put their trust in us. This was evidenced by an increase in both customer lending and deposits, and by a growth of 750,000 in the number of primary customers, which provides us with further opportunities to deepen our client relationships. Retail Banking recorded strong results in 2023, with the result before tax increasing 70% to €6,753 million, as a 24% growth in income was coupled with only a limited increase in operating expenses, while risk costs slightly declined. The full - year return on equity climbed to 24.8% from 14.8% in 2022. Net interest income (excluding TLTRO) increased 26%, mainly reflecting higher net interest income on liabilities following a rapid increase in interest rates. Net fee and commission income declined 2%, as higher daily banking fees (thanks to an increase in payment package fees and new service fees) could not fully compensate for a decline in fees from investment products (due to subdued trading activity) and for lower fees from mortgage brokerage. Total investment and other income increased by €442 million, mainly attributable to Treasury, which benefited from favourable market opportunities through money market and FX transactions; this increase was partly offset in net interest income. Net core lending growth, which excludes currency impacts, Treasury and the run - off in Westland Utrecht Bank, was €9.7 billion. The bulk of this growth (€8.0 billion) was in residential mortgages, mainly in the Netherlands, Australia and Germany. Net core deposits growth (excluding FX impacts and Treasury) was €18.5 billion in 2023, primarily driven by Germany, Spain and Poland. Expenses excluding regulatory costs increased 5%, as the impact of high inflation on staff expenses, reflected in CLA increases and indexation, was partly offset by savings from exiting the French and Philippine retail markets and by lower incidental cost items. Regulatory costs declined by €185 million due to a lower contribution to the European Single Resolution Fund and because 2022 had included a €99 million contribution to the Institutional Protection Scheme in Poland. The cost/income ratio improved to 51% in 2023 compared with 62% in 2022. Risk costs were 13 basis points of average customer lending, which is well below the through - the - cycle average and reflects our strong asset quality. Segment Reporting: Retail Banking

Retail Banking Market Leaders: Consolidated profit or loss account Banking Belgium Retail Retail Banking Netherlands 3Q2023 4Q2022 4Q2023 3Q2023 4Q2022 4Q2023 In € million Profit or loss 543 453 511 746 804 700 Net interest income - excl. net TLTRO impact 0 - 64 0 0 - 150 0 Net interest income - net TLTRO impact 133 136 129 246 224 242 Net fee and commission income 4 0 1 3 7 1 Investment income 15 79 17 286 126 247 Other income 695 603 658 1,281 1,011 1,190 Total income 437 370 425 489 466 494 Expenses excl. regulatory costs 0 29 30 27 74 72 Regulatory costs 437 400 456 516 541 566 Operating expenses 257 203 202 765 470 624 Gross result 50 22 28 - 1 28 - 35 Addition to loan loss provisions 208 181 174 766 442 660 Result before tax Profitability and efficiency - 1.4 1.7 1.1 0.7 0.4 0.7 Net core lending growth (in € billion) - 2.3 0.7 0.1 - 1.1 2.9 0.4 Net core deposits growth (in € billion) 63.0% 66.3% 69.3% 40.3% 53.5% 47.5% Cost/income ratio 21 10 12 0 7 - 9 Risk costs in bps of average customer lending 14.5% 12.0% 13.2% 35.7% 20.2% 30.7% Return on equity based on 12.5% CET1 1) 33.7 34.8 34.6 51.1 50.6 50.7 Risk - weighted assets (end of period, in € billion) ING Press Release 4Q2023 11 1) After - tax return divided by average equity based on 12.5% of RWA (annualised). Retail Netherlands Net interest income excluding TLTRO impact declined year - on - year due to lower Treasury - related interest income. This mostly reflected activities to benefit from favourable market opportunities through money market and FX transactions, for which negative net interest income was more than compensated in other income. The lower interest income for Treasury was only partly compensated by an increase in liability margins. Sequentially, net interest income decreased, mainly due to a lower remuneration on the ECB minimum reserve requirement and lower interest income from liabilities after a further increase in client savings rates. Fee income rose year - on - year, supported by higher fees for payment packages and growth in assets under management. Sequentially, fee income declined slightly, as the third quarter had included seasonally higher travel - related fees. Other income increased year - on - year, mainly due to higher Treasury - related income (that was partly offset by lower net interest income), but sequentially, other income declined. Net core lending growth was €0.7 billion in 4Q2023, reflecting continued growth in mortgages, while business lending was stable. Net core deposits growth was €0.4 billion. Expenses excluding regulatory costs increased both year - on - year and sequentially, mostly due to higher staff expenses. Regulatory costs increased from 3Q2023, reflecting the annual booking of the Dutch bank tax in the fourth quarter. Risk costs in 4 Q 2023 showed a net release for both business lending and mortgages . In business lending, this was driven by a release in Stage 3 individual risk costs . For mortgages, it reflected the impact of an expected recovery of Dutch house prices, only partly offset by a methodology update . Retail Belgium (including Luxembourg) Net interest income increased year - on - year, driven by higher margins on liabilities. Sequentially, a rise in income from liabilities was more than offset by a decline in Treasury - related interest income, which included a lower remuneration on the ECB minimum reserve requirement. The decline in fee income year - on - year was mainly due to a decrease in commissions on the sale of insurance products and higher commissions paid to agents. Sequentially, fees from daily banking were lower. Other income in 4Q2023 included an €11 million gain on the sale of a participation compared with a €67 million gain from a legacy entity recorded in 4Q2022. Net core lending growth was €1.1 billion, of which €0.9 billion was in business lending and €0.2 billion in residential mortgages. Net core deposits growth was €0.1 billion. The fourth quarter of 2023 included €30 million of incidental costs related to restructuring and a further optimisation of the branch network compared with €46 million of costs for these initiatives in 3Q2023. Excluding these incidental items as well as regulatory costs, expenses increased year - on - year, as the impact of automatic salary indexation was only partly offset by FTE reductions. Sequentially, expenses excluding regulatory costs and incidental items rose 1.0% due to higher marketing expenses. Regulatory costs in 4Q2023 mainly reflected the allocation of the annual Dutch bank tax. Risk costs amounted to €28 million in 4Q2023, including net additions for business lending and consumer lending, while a net release for mortgages was recorded, reflecting an expected rise in house prices. Segment Reporting: Retail Banking

Retail Banking Other Retail Banking Challengers & Growth Markets: Consolidated profit or loss account Retail Banking Germany 3Q2023 4Q2022 4Q2023 3Q2023 4Q2022 4Q2023 In € million Profit or loss 895 806 875 753 568 709 Net interest income - excl. net TLTRO impact 0 0 0 0 - 42 0 Net interest income - net TLTRO impact 136 124 131 93 89 84 Net fee and commission income - 1 - 1 - 4 1 1 - 17 Investment income 53 72 75 - 7 - 14 - 7 Other income 1,082 1,002 1,077 839 603 769 Total income 528 576 608 284 269 309 Expenses excl. regulatory costs 49 67 79 18 24 26 Regulatory costs 577 643 687 303 293 335 Operating expenses 505 359 390 537 310 434 Gross result 72 100 68 46 52 25 Addition to loan loss provisions 433 259 322 491 258 409 Result before tax Profitability and efficiency 0.5 - 0.6 1.6 0.7 0.7 0.3 Net core lending growth (in € billion) 4.5 3.4 4.6 - 5.7 3.3 - 2.5 Net core deposits growth (in € billion) 53.3% 64.1% 63.8% 36.0% 48.6% 43.5% Cost/income ratio 27 37 25 18 21 10 Risk costs in bps of average customer lending 23.4% 14.7% 18.3% 36.3% 19.2% 30.2% Return on equity based on 12.5% CET1 1) 43.6 41.6 45.1 27.1 29.8 24.0 Risk - weighted assets (end of period, in € billion) ING Press Release 4Q2023 12 1) After - tax return divided by average equity based on 12.5% of RWA (annualised). Retail Germany Net interest income increased strongly year - on - year, driven by higher liability volumes at significantly improved margins as well as an increase in lending volumes. Sequentially, net interest income decreased due to a rise in core savings rates and a decline in Treasury - related interest income, which included a lower remuneration on the ECB minimum reserve requirement. Fee income declined compared with both comparable quarters, mainly due to lower fees from mortgage brokerage, which were only partly compensated by higher fees from investment products. Investment and other income decreased, reflecting lower Treasury - related income. Net core lending growth in 4Q2023 was €0.3 billion, driven by mortgages and consumer lending. Net core deposits declined by €2.5 billion in 4Q2023, reflecting intensified competition and a shift to assets under management. On a full - year basis, net core deposits growth was strong at €8.5 billion following successful promotional campaigns to attract new savings and customers earlier in the year. Operating expenses in 4Q2023 included €20 million of incidental items for restructuring costs and staff allowances compared with €10 million of incidental items in 4Q2022. Expenses excluding regulatory costs and incidental items increased from both comparable quarters, predominantly due to higher staff expenses related to annual salary increases and FTE growth, combined with continued investments in business growth. Risk costs were €25 million and primarily related to consumer lending and mortgages. Retail Other Net interest income year - on - year was supported by higher margins on liabilities, most notably in Spain and Poland. This more than compensated for negative currency impacts and tighter lending margins. Sequentially, net interest income declined slightly due to an increase in client rates on liabilities and lower lending margins. Fee income rose year - on - year, mainly driven by higher fees in daily banking, reflecting an increase in the number of primary customers and an updated pricing of payment packages. Other income increased versus both comparable quarters due to higher Treasury - related results. Net core lending growth in 4Q2023 was €1.6 billion, mainly due to higher mortgage volumes in Australia and an increase in other lending in Spain. Net core deposits growth was €4.6 billion, driven largely by net inflows in Spain and Poland. Expenses in 4Q2023 included €36 million of restructuring costs and impairments, mainly for Poland. By comparison, 4Q2022 had included €33 million of incidental items consisting mainly of restructuring costs for France and Türkiye. In addition, 4Q2023 included an €8 million addition to a legal provision compared to a €14 million release in 3Q2023. Expenses – excluding regulatory costs and the aforementioned provisions – rose on both comparable quarters. This was mainly due to inflationary pressure on staff expenses and higher marketing expenses. Year - on - year, the increase in expenses was partly offset by cost savings following the discontinuation of our retail activities in France and the Philippines, as well as by positive FX impacts. Risk costs were €68 million, with net additions mainly in Poland (including a €21 million addition for potential losses on CHF - indexed mortgages) and Spain. Segment Reporting: Retail Banking

Wholesale Banking: Consolidated profit or loss account ING Press Release 4Q2023 13 Change FY2022 FY2023 Change 3Q2023 Change 4Q2022 4Q2023 In € million Profit or loss 2.1% 3,157 3,224 0.1% 804 7.9% 746 805 Lending 29.5% 1,662 2,153 1.7% 527 21.0% 443 536 Daily Banking & Trade Finance 4.4% 1,226 1,280 - 47.5% 375 - 31.4% 287 197 Financial Markets 43.2% 280 401 - 52.1% 119 83.9% 31 57 Treasury & Other 11.6% 6,325 7,057 - 12.6% 1,825 5.8% 1,507 1,595 Total income 7.9% 2,821 3,043 5.4% 759 3.2% 775 800 Expenses excl. regulatory costs - 7.5% 293 271 685.7% 14 12.2% 98 110 Regulatory costs 6.4% 3,114 3,313 17.7% 773 4.4% 872 910 Operating expenses 16.6% 3,211 3,744 - 34.9% 1,052 7.9% 635 685 Gross result - 107.5% 1,220 - 92 - 106.7% 15 - 101.5% 65 - 1 Addition to loan loss provisions 92.7% 1,991 3,836 - 33.8% 1,037 20.4% 570 686 Result before tax Profitability and efficiency 2.4 - 1.2 - 2.8 0.9 3.5 Net core lending growth (in € billion) 6.2 - 7.9 - 2.4 - 3.2 - 3.5 Net core deposits growth (in € billion) 49.2% 47.0% 42.4% 57.9% 57.1% Cost/income ratio 388 462 487 370 425 Income over average risk - weighted assets (in bps) 1) 65 - 5 3 13 0 Risk costs in bps of average customer lending 6.9% 15.4% 16.7% 7.1% 11.4% Return on equity based on 12.5% CET1 2) - 5.7% 159.4 150.3 0.0% 150.2 - 5.7% 159.4 150.3 Risk - weighted assets (end of period, in € billion) 1) Total income divided by average RWA (annualised). 2) After - tax return divided by average equity based on 12.5% of RWA (annualised). In 2023, Wholesale Banking delivered strong performance, achieving a 93% year - on - year increase in pre - tax result, that reached €3,836 million. The full - year return on equity rose to 15.4%, up from 6.9% in 2022. These positive outcomes were driven by double - digit growth in income, significantly lower risk costs and effective capital management. The Income/ RWA ratio improved by 19%, reaching 462 bps, driven by the aforementioned income growth and a €9.1 billion ( - 6%) reduction in risk - weighted assets. Despite a 6% year - on - year increase in expenses attributable to collective labour agreements, higher performance - related payments and strategic investments for business expansion, the cost - income ratio improved to 47%. Risk costs showed a net release, reflecting strong asset quality, with low inflows and continued strong recoveries. The fourth - quarter result before tax was €686 million, up 20% on the previous year. Sequentially, lower income and increased expenses, which included €96 million of seasonally higher regulatory costs and €17 million of incidental items (mainly restructuring costs), led to a decline in the quarterly result before tax. Net core lending growth was €3.5 billion in the fourth quarter, driven by Lending and Trade & Commodity Finance. The development of net core deposits is a combination of seasonal effects and a focus on optimising pricing. Lending income rose year - on - year, while the overall market was impacted by the weaker economic climate and tighter financing conditions. Net interest income rose compared with the prior year, attributable to a higher net interest margin. Other income increased significantly compared with 4Q2022, which had included negative fair value adjustments and discounts on secondary loan sales. Fee income declined due to a lower number of large deals in 4Q2023. The latter also explains the slight decrease in total income compared with 3Q2023. Income from Daily Banking & Trade Finance increased strongly year - on - year, mainly in Payments & Cash Management (PCM), Bank Mendes Gans and Working Capital Solutions, all of which benefited from the higher interest rate environment. In Trade & Commodity Finance and Trade Finance Services, income decreased slightly year - on - year due to lower commodity prices and stagnant markets. Other income in 4Q2023 included a gain on the sale of an equity stake. Sequentially, income increased slightly, supported by Working Capital Solutions and the gain on the equity stake. These impacts were largely offset by lower income in PCM (following client rate increases) and lower demand in Trade & Commodity Finance and in Trade Finance Services. Financial Markets income decreased year - on - year as a change in market sentiment reduced client activity and led to lower trading results. This was slightly compensated by higher Capital Markets issuance income. Sequentially, income declined, mainly because 4Q2023 included a €60 million increase in reserves, while 3Q2023 had included a €61 million reserve release. Apart from this swing in reserves, income was also impacted by a slower client flow and reduced market activity over the fourth quarter. The quarterly income of Treasury & Other rose year - on - year, as 4Q2022 had included a € - 77 million net TLTRO impact. Excluding TLTRO, Treasury & Other income declined both year - on - year and sequentially, reflecting the impact of the lower remuneration on the ECB minimum reserve requirement and a negative impact of revaluations and hedge ineffectiveness in Treasury in 4Q2023. The lower results in Treasury were partly offset by a higher year - on - year valuations result in Corporate Investments and an increase in fee income from Corporate Finance quarter - on - quarter. Segment Reporting: Wholesale Banking

Corporate Line: Consolidated profit or loss account 29 impact 1) IAS Corporate Line excl. IAS 29 impact Line Corporate Total 3Q2023 4Q2022 4Q2023 3Q2023 4Q2022 4Q2023 3Q2023 4Q2022 4Q2023 In € million Profit or loss 15 14 8 88 141 109 103 155 117 Net interest income - excl. net TLTRO impact 0 0 0 0 17 0 0 17 0 Net interest income - net TLTRO impact 3 1 2 4 - 5 - 4 7 - 3 - 2 Net fee and commission income 0 0 0 98 7 0 98 7 0 Investment income - 106 - 32 - 25 18 - 2 31 - 88 - 34 5 Other income - 88 - 17 - 16 208 159 136 120 142 120 Total income 26 9 12 160 131 110 186 140 122 Expenses excl. regulatory costs 0 0 0 1 0 0 1 0 0 Regulatory costs 26 9 12 161 131 110 187 140 122 Operating expenses - 114 - 26 - 28 47 28 26 - 67 2 - 2 Gross result 3 1 2 0 0 0 3 1 2 Addition to loan loss provisions - 117 - 27 - 30 47 28 26 - 70 1 - 4 Result before tax of which: 0 0 0 35 18 65 35 18 65 Income on capital surplus 0 0 0 102 151 106 102 151 106 Foreign currency ratio hedging 0 0 0 - 22 - 31 - 58 - 22 - 31 - 58 Other Group Treasury 0 0 0 115 138 114 115 138 114 Group Treasury 0 0 0 120 22 22 120 22 22 Asian stakes - 117 - 27 - 30 - 188 - 132 - 110 - 305 - 159 - 140 Other Corporate Line - 117 - 27 - 30 47 28 26 - 70 1 - 4 Result before tax 4 7 2 Taxation - 121 - 34 - 32 Net result ING Press Release 4Q2023 14 1) Hyperinflation accounting (IAS 29) has become applicable for ING’s subsidiary in Türkiye since 2Q2022 with retrospective application from 1 January 2022. Total income decreased by €22 million year - on - year. This was mostly due to lower results from foreign currency ratio hedging (reflecting lower interest rate differentials) and €17 million of positive TLTRO impacts in 4Q2022. These factors were partly offset by a higher income on the capital surplus. Sequentially, total income was stable as the dividend from our stake in the Bank of Beijing recorded in 3Q2023 was compensated by a lower IAS 29 impact in 4Q2023 (reflecting a lower level of inflation in Türkiye). Operating expenses declined sharply on both comparable quarters, which included incidental items. In 4Q2022, we recorded €21 million for allowances to staff in the Netherlands to cover increased energy costs, and in 3Q2023 we provisioned €51 million. Excluding these incidental items as well as IAS 29 impacts, expenses were flat at €110 million for all three quarters shown above. Segment Reporting: Corporate Line

Share information 3Q2023 2Q2023 1Q2023 4Q2022 4Q2023 3,619.5 3,619.5 3,619.5 3,726.5 116.9 12.5 1.0 107.4 3,502.6 3,607.0 3,618.5 3,619.1 3,557.9 3,615.2 3,619.1 3,683.7 3,498.2 154.6 3,343.6 3,460.9 Shares (in millions, end of period) Total number of shares - Treasury shares - Shares outstanding Average number of shares 12.55 12.34 10.93 11.39 13.45 12.34 13.49 11.66 12.22 10.81 10.38 8.80 13.53 13.74 11.79 Share price (in euros) End of period High Low 0.56 0.60 0.44 0.30 14.77 14.07 14.28 13.79 - 0.35 - 0.39 6.6 7.7 8.3 11.6 0.85 0.88 0.77 0.83 0.45 15.32 0.756 6.6 0.88 Net result per share (in euros) Shareholders' equity per share (end of period in euros) Dividend per share (in euros) Price/earnings ratio 1) Price/book ratio 1) Four - quarter rolling average. Financial calendar Publication 2023 ING Group Annual Report Annual General Meeting Ex - date for final dividend 2023 (Euronext Amsterdam) 1) Thursday 7 March 2024 Monday 22 April 2024 Wednesday 24 April 2024 Record date for final dividend 2023 entitlement (Euronext Amsterdam) 1) Thursday 25 April 2024 Record date for final dividend 2023 entitlement 1) Thursday 25 April 2024 (NYSE) Publication results 1Q2024 Payment date for final dividend 2023 (Euronext Thursday 2 May 2024 Friday 3 May 2024 Amsterdam) 1) Payment date for final dividend 2023 (NYSE) 1) ING Capital Markets Day Publication results 2Q2024 Ex - date for interim dividend 2024 (Euronext Amsterdam) 1) Friday 10 May 2024 Monday 17 June 2024 Thursday 1 August 2024 Monday 5 August 2024 Record date for interim dividend 2024 entitlement (Euronext Amsterdam) 1) Tuesday 6 August 2024 Record date for interim dividend 2024 entitlement (NYSE) 1) Tuesday 6 August 2024 Payment date for interim dividend 2024 (Euronext Amsterdam) 1) Monday 12 August 2024 Payment date for interim dividend 2024 (NYSE) 1) Monday 19 August 2024 1) Only if any dividend is paid All dates are provisional. ING profile ING is a global financial institution with a strong European base, offering banking services through its operating company ING Bank. The purpose of ING Bank is: empowering people to stay a step ahead in life and in business. ING Bank’s more than 60,000 employees offer retail and wholesale banking services to customers in over 40 countries. ING Group shares are listed on the exchanges of Amsterdam (INGA NA, INGA.AS), Brussels and on the New York Stock Exchange (ADRs: ING US, ING.N). Sustainability is an integral part of ING’s strategy, evidenced by ING’s leading position in sector benchmarks. ING's Environmental, Social and Governance (ESG) rating by MSCI was affirmed 'AA' in July 2023. As of December 2023, Sustainalytics considers ING’s management of ESG material risk to be ‘strong’. ING Group shares are also included in major sustainability and ESG index products of leading providers Euronext, STOXX, Morningstar and FTSE Russell. ING Press Release 4Q2023 15 Further information More on results publications, go to the quarterly results publications page . More on investor information, go to the investor relations section on this site . For news updates, go to the newsroom on this site or via X (@ING_news feed) . For ING photos such as board members, buildings, go to Flickr .

ING Press Release 4Q2023 16 Important legal information Elements of this press release contain or may contain information about ING Groep N.V. and/ or ING Bank N.V. within the meaning of Article 7(1) to (4) of EU Regulation No 596/2014 (‘Market Abuse Regulation’). ING Group’s annual accounts are prepared in accordance with International Financial Reporting Standards as adopted by the European Union (‘IFRS - EU’). In preparing the financial information in this document, except as described otherwise, the same accounting principles are applied as in the 2022 ING Group consolidated annual accounts. The financial statements for 2023 are in progress and may be subject to adjustments from subsequent events. All figures in this document are unaudited. Small differences are possible in the tables due to rounding. Certain of the statements contained herein (including the statements contained in the section entitled ‘2024 Outlook’ in this document) are not historical facts, including, without limitation, certain statements made of future expectations and other forward - looking statements that are based on management’s current views and assumptions and involve known and unknown risks and uncertainties that could cause actual results, performance or events to differ materially from those expressed or implied in such statements. Actual results, performance or events may differ materially from those in such statements due to a number of factors, including, without limitation: (1) changes in general economic conditions and customer behaviour, in particular economic conditions in ING’s core markets, including changes affecting currency exchange rates and the regional and global economic impact of the invasion of Russia into Ukraine and related international response measures (2) ongoing and residual effects of the Covid - 19 pandemic and related response measures on economic conditions in countries in which ING operates (3) changes affecting interest rate levels (4) any default of a major market participant and related market disruption (5) changes in performance of financial markets, including in Europe and developing markets (6) fiscal uncertainty in Europe and the United States (7) discontinuation of or changes in ‘benchmark’ indices (8) inflation and deflation in our principal markets (9) changes in conditions in the credit and capital markets generally, including changes in borrower and counterparty creditworthiness (10) failures of banks falling under the scope of state compensation schemes (11) non - compliance with or changes in laws and regulations, including those concerning financial services, financial economic crimes and tax laws, and the interpretation and application thereof (12) geopolitical risks, political instabilities and policies and actions of governmental and regulatory authorities, including in connection with the invasion of Russia into Ukraine and the related international response measures (13) legal and regulatory risks in certain countries with less developed legal and regulatory frameworks (14) prudential supervision and regulations, including in relation to stress tests and regulatory restrictions on dividends and distributions (also among members of the group) (15) ING’s ability to meet minimum capital and other prudential regulatory requirements (16) changes in regulation of US commodities and derivatives businesses of ING and its customers (17) application of bank recovery and resolution regimes, including write down and conversion powers in relation to our securities (18) outcome of current and future litigation, enforcement proceedings, investigations or other regulatory actions, including claims by customers or stakeholders who feel misled or treated unfairly, and other conduct issues (19) changes in tax laws and regulations and risks of non - compliance or investigation in connection with tax laws, including FATCA (20) operational and IT risks, such as system disruptions or failures, breaches of security, cyber - attacks, human error, changes in operational practices or inadequate controls including in respect of third parties with which we do business (21) risks and challenges related to cybercrime including the effects of cyberattacks and changes in legislation and regulation related to cybersecurity and data privacy (22) changes in general competitive factors, including ability to increase or maintain market share (23) inability to protect our intellectual property and infringement claims by third parties (24) inability of counterparties to meet financial obligations or ability to enforce rights against such counterparties (25) changes in credit ratings (26) business, operational, regulatory, reputation, transition and other risks and challenges in connection with climate change and ESG - related matters, including data gathering and reporting (27) inability to attract and retain key personnel (28) future liabilities under defined benefit retirement plans (29) failure to manage business risks, including in connection with use of models, use of derivatives, or maintaining appropriate policies and guidelines (30) changes in capital and credit markets, including interbank funding, as well as customer deposits, which provide the liquidity and capital required to fund our operations, and (31) the other risks and uncertainties detailed in the most recent annual report of ING Groep N.V. (including the Risk Factors contained therein) and ING’s more recent disclosures, including press releases, which are available on www.ING.com. This document may contain ESG - related material that has been prepared by ING on the basis of publicly available information, internally developed data and other third - party sources believed to be reliable. ING has not sought to independently verify information obtained from public and third - party sources and makes no representations or warranties as to accuracy, completeness, reasonableness or reliability of such information. Materiality, as used in the context of ESG, is distinct from, and should not be confused with, such term as defined in the Market Abuse Regulation or as defined for Securities and Exchange Commission (‘SEC’) reporting purposes. Any issues identified as material for purposes of ESG in this document are therefore not necessarily material as defined in the Market Abuse Regulation or for SEC reporting purposes. In addition, there is currently no single, globally recognized set of accepted definitions in assessing whether activities are “green” or “sustainable.” Without limiting any of the statements contained herein, we make no representation or warranty as to whether any of our securities constitutes a green or sustainable security or conforms to present or future investor expectations or objectives for green or sustainable investing. For information on characteristics of a security, use of proceeds, a description of applicable project(s) and/or any other relevant information, please reference the offering documents for such security. This document may contain inactive textual addresses to internet websites operated by us and third parties. Reference to such websites is made for information purposes only, and information found at such websites is not incorporated by reference into this document. ING does not make any representation or warranty with respect to the accuracy or completeness of, or take any responsibility for, any information found at any websites operated by third parties. ING specifically disclaims any liability with respect to any information found at websites operated by third parties. ING cannot guarantee that websites operated by third parties remain available following the publication of this document, or that any information found at such websites will not change following the filing of this document. Many of those factors are beyond ING’s control. Any forward - looking statements made by or on behalf of ING speak only as of the date they are made, and ING assumes no obligation to publicly update or revise any forward - looking statements, whether as a result of new information or for any other reason. This document does not constitute an offer to sell, or a solicitation of an offer to purchase, any securities in the United States or any other jurisdiction.
Ing Groep NV (PK) (USOTC:INGVF)
Historical Stock Chart
From Apr 2024 to May 2024
 Charts.")
Ing Groep NV (PK) (USOTC:INGVF)
Historical Stock Chart
From May 2023 to May 2024
 Charts.")