UNITED STATES
SECURITIES AND EXCHANGE COMMISSION
Washington, D.C. 20549
Form 6-K
REPORT OF
FOREIGN PRIVATE ISSUER
PURSUANT TO RULE 13a-16 OR
15D-16 UNDER
THE SECURITIES EXCHANGE ACT OF 1934
For the month of January, 2024
Commission File Number: 1-13368
POSCO HOLDINGS INC.
(Translation of registrant’s name into English)
POSCO Center,
440 Teheran-ro, Gangnam-gu, Seoul, Korea, 06194
(Address of principal executive offices)
Indicate by check mark whether the registrant files or will file annual reports under cover of Form 20-F or Form 40-F.
Form 20-F ☒ Form 40-F ☐
Provisional Earnings in Consolidated Financial Statements Base
(In trillions of KRW)
|
|
|
|
|
|
|
|
|
|
|
|
|
| |
|
2023 |
|
2022 |
|
Changes over
2022(%) |
|
2022 |
|
Changes over 2022
(%) |
| |
|
|
|
|
|
|
|
Revenue |
|
Amount |
|
77.1 |
|
84.8 |
|
-9.1% |
|
— |
|
— |
| |
Yearly
Amount |
|
— |
|
— |
|
— |
|
— |
|
— |
| |
|
|
|
|
|
|
|
Operating
Profit |
|
Amount |
|
3.5 |
|
4.9 |
|
-28.6% |
|
— |
|
— |
| |
Yearly
Amount |
|
— |
|
— |
|
— |
|
— |
|
— |
| |
|
|
|
|
|
|
|
Profit
before
Income
Tax |
|
Amount |
|
2.6 |
|
4.0 |
|
-35.0% |
|
— |
|
— |
| |
Yearly
Amount |
|
— |
|
— |
|
— |
|
— |
|
— |
|
Profit |
|
Amount |
|
1.8 |
|
3.6 |
|
-50.0% |
|
— |
|
— |
| |
Yearly
Amount |
|
— |
|
— |
|
— |
|
— |
|
— |
| |
|
|
|
|
|
|
|
Profit
Attributable to
Owners of the
Controlling
Company |
|
Amount |
|
1.7 |
|
3.1 |
|
-45.2% |
|
— |
|
— |
| |
Yearly
Amount |
|
— |
|
— |
|
— |
|
— |
|
— |
| * |
The above earnings information is composed based on K-IFRS (Korean
International Financial ReportingStandards) and the independent auditors’ review is not finished. Therefore, the earnings information may change in the review process. |
Global Eco-friendly Future Materials Provider Earnings Release 2023 January
31, 2024

2 / 18 Disclaimer This presentation was prepared and circulated to release
the information regarding the company’s business performance to shareholders and investors prior to the completion of auditing for the period of the 4th quarter 2023. As figures in this presentation are based on unaudited financial statements,
certain contents may be subject to modification in the course of the auditing process. This presentation contains certain forward-looking statements relating to the business, financial performance and results of the company and/or the industry in
which it operates. The forward-looking statements set forth herein concern future circumstances and that are not historical facts, and are solely based on opinions and forecasts which are uncertain and subject to risks. Therefore, readers of this
presentation shall be aware that forward-looking statements set forth herein may not correspond to the actual business performance of the company due to changes and risks in business environments and conditions. The sole purpose of this presentation
is to assist persons in deciding whether they wish to proceed with certain investments to the Company. The Company does not offer guarantee, expressed or implied, as to the accuracy and completeness of this presentation or of the information
contained herein and does not assume any liability for the information described in this presentation.

3 / 18 Contents Consolidated Business Performance Major Business Activities
Business Performance by Major Areas Appendix

4 / 18 Consolidated Business Performance Revenue and profits shrank due to
declining steel market and key material price falls Income Financial Structure YoY YoY (KRW Billion, %) 18, 000 20. 00% 90, 000 20.00% 84,750 (KRW Billion, %) 76,332 16, 000 80, 000 77,127 △7,623 Revenue 15.00% 13.5% +4.0%p 15. 00% 14, 000 70,
000 EBITDA 12,806 OP Margin 10.00% 9.5% 12.1% 12, 000 10. 00% 60, 000 5.00% 10, 000 50, 000 5.7% △1.1%p +2,557 4.6% 6.5% 8,544 5.0 0% Net Debt Ratio 8,063 0.00% 7,355 8,0 00 40, 000 9,238 Operating Profit △1,189 -5.00% 5,506 6,0 00 0.0
0% 30, 000 3,585 Net Debt -10.00% 4,0 00 20, 000 4,850 -5.00% △1,319 3,531 2,0 00 10, 000 -15.00% 0 -10.00% 0 -20.00% 2021 2022 2023 2021 2022 2023 ※ 2023 Cumulative CAPEX : (Consolidated) KRW 8.6 tril. (Separated) KRW 1.4 tril.
【Before Inter-company Transaction Adjustment】 Revenue Operating Profit Net Income (KRW Billion) 2021 2022 2023 2021 2022 2023 2021 2022 2023 4Q 4Q 4Q Steel 66,737 70,650 63,539 15,419 8,440 3,236 2,557 346 6,647 1,712 1,241 △134
1) 39,920 42,695 38,972 9,376 6,650 2,295 2,083 263 5,181 1,126 1,180 17 POSCO 21,712 23,933 20,494 4,927 1,474 474 194 11 1,177 109 △137 △84 Overseas Steel 54,103 65,901 57,157 14,260 1,214 1,544 1,533 292 646 957 1,078 138 Green
Infrastructure 2) 35,924 41,697 33,133 7,909 789 1,173 1,163 215 534 826 680 73 POSCO International 2) POSCO E&C 8,199 9,435 10,166 2,773 441 309 201 34 288 171 177 41 3) 2,089 3,389 4,822 1,154 113 144 △161 △169 112 109 △223
△256 Green Materials 2) 1,990 3,302 4,760 1,146 122 166 36 △74 134 122 4 △102 POSCO Future M 1) Separated 2) Consolidated, POSCO Energy result included in POSCO International 3) Inventory asset impairment of KRW 131 bil. recorded
in 4Q reflecting the decrease in rices of lithium and other secondary battery materials (2023 annual : KRW 148 bil.)
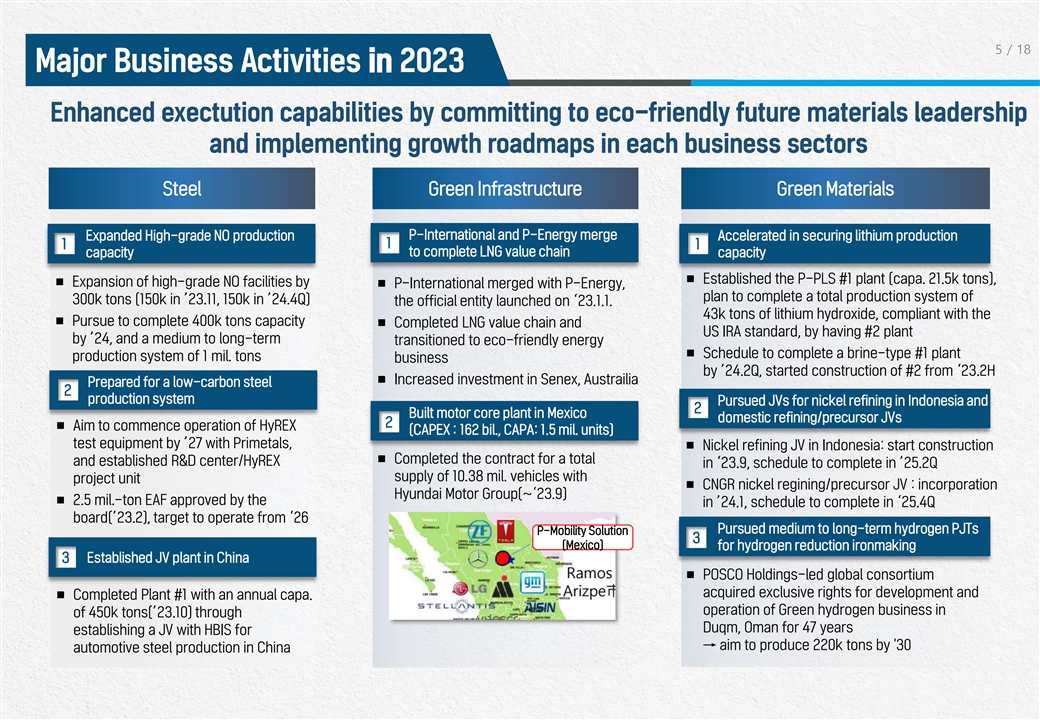
5 / 18 Major Business Activities in 2023 Enhanced exectution capabilities by
committing to eco-friendly future materials leadership and implementing growth roadmaps in each business sectors Steel Green Infrastructure Green Materials P-International and P-Energy merge Expanded High-grade NO production Accelerated in securing
lithium production 1 1 1 to complete LNG value chain capacity capacity n Established the P-PLS #1 plant (capa. 21.5k tons), n Expansion of high-grade NO facilities by n P-International merged with P-Energy, plan to complete a total
production system of 300k tons (150k in ’23.11, 150k in ’24.4Q) the official entity launched on ‘23.1.1. 43k tons of lithium hydroxide, compliant with the n Pursue to complete 400k tons capacity n Completed LNG value
chain and US IRA standard, by having #2 plant by ’24, and a medium to long-term transitioned to eco-friendly energy n Schedule to complete a brine-type #1 plant production system of 1 mil. tons business by ’24.2Q, started
construction of #2 from ‘23.2H n Increased investment in Senex, Austrailia Prepared for a low-carbon steel 2 production system Pursued JVs for nickel refining in Indonesia and 2 Built motor core plant in Mexico domestic refining/precursor
JVs 2 n Aim to commence operation of HyREX (CAPEX : 162 bil., CAPA: 1.5 mil. units) test equipment by ’27 with Primetals, n Nickel refining JV in Indonesia: start construction n Completed the contract for a total and established
R&D center/HyREX in ‘23.9, schedule to complete in ’25.2Q supply of 10.38 mil. vehicles with project unit n CNGR nickel regining/precursor JV : incorporation Hyundai Motor Group(~‘23.9) n 2.5 mil.-ton EAF approved by
the in ’24.1, schedule to complete in ‘25.4Q board(’23.2), target to operate from ‘26 Pursued medium to long-term hydrogen PJTs P-Mobility Solution 3 (Mexico) for hydrogen reduction ironmaking 3 Established JV plant in China
n POSCO Holdings-led global consortium acquired exclusive rights for development and n Completed Plant #1 with an annual capa. operation of Green hydrogen business in of 450k tons(’23.10) through Duqm, Oman for 47 years establishing
a JV with HBIS for → aim to produce 220k tons by '30 automotive steel production in China
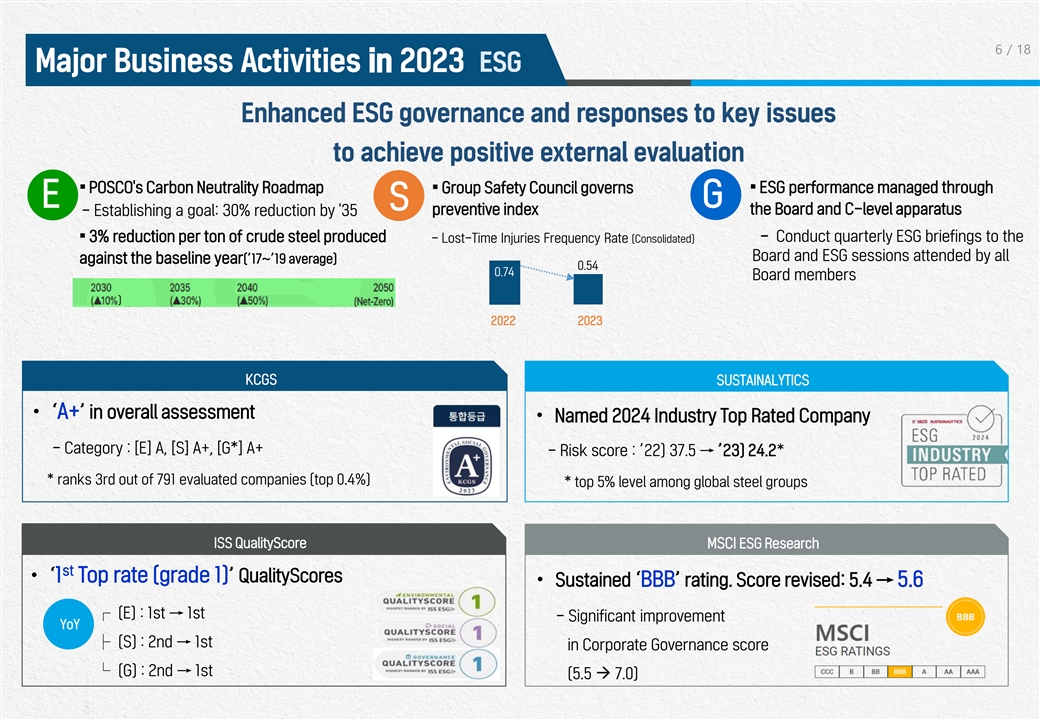
6 / 18 Major Business Activities in 2023 ESG Enhanced ESG governance and
responses to key issues to achieve positive external evaluation ▪ POSCO's Carbon Neutrality Roadmap▪ ESG performance managed through ▪ Group Safety Council governs E G S preventive index the Board and C-level apparatus -
Establishing a goal: 30% reduction by '35 ▪ 3% reduction per ton of crude steel produced - Conduct quarterly ESG briefings to the - Lost-Time Injuries Frequency Rate (Consolidated) Board and ESG sessions attended by all against the baseline
year(’17~’19 average) 0.54 0.74 Board members ) 2022 2023 KCGS SUSTAINALYTICS • ‘A+’ in overall assessment • Named 2024 Industry Top Rated Company - Category : [E] A, [S] A+, [G*] A+ - Risk score : ’22) 37.5
→ ’23) 24.2* * ranks 3rd out of 791 evaluated companies (top 0.4%) * top 5% level among global steel groups ISS QualityScore MSCI ESG Research st • ‘1 Top rate (grade 1)’ QualityScores • Sustained
‘BBB’ rating. Score revised: 5.4 → 5.6 ┌ (E) : 1st → 1st - Significant improvement YoY ├ (S) : 2nd → 1st in Corporate Governance score └ (G) : 2nd → 1st (5.5 à 7.0)

7 / 18 Dividends and Dividend Record Date 2023 total dividend payout set to
KRW 759 billion aligned to the Shareholder Return Policy Dividend reserve: 50-60% of annual free cash flow (FCF) 2023-2025 Shareholder Base dividend: KRW 10,000 per share Return Policy After payment of the base dividend, remaining dividend reserve
is used for (announced in '23.4.27) additional shareholder return '23 Total Dividend : KRW 759 billion (Dividend per share : KRW 10,000) - 1~3Q dividend: KRW 7,500 per share, 4Q year-end dividend: KRW 2,500 per share End-of-Year 1) 2) ※
‘23 FCF, separate : KRW 0.6 tril. * FCF : Operating Cash Flow + Adjustment– Investment 1) Dividends for 2023 Net proceeds from divesting subsidiary stock to subsidiaries of POSCO Holdings 2) Tangible and intangible assets and equity
investments, etc. and Dividend Record '23 Dividend Record Date : '24.2.29 Date - The determination of per-share dividend precedes the record date by one month in line with the new shareholder return program ※ ’24.1Q Dividend record date
: ‘24.3.31. '19 '20 '21 '22 '23 (KRW Billion) Total Dividend Amount 801 620 1,286 910 759 (KRW) Dividend per Share 10,000 8,000 17,000 12,000 10,000 ※ Dividend Payout Ratio 43.7% 38.7% 19.4% 28.9% 44.7%

8 / 18 Business Performance by Major Areas Steel - POSCO ·
Production/Sales · Income - Overseas Steel · PT-KP · PZSS · P-Maharashtra · PY-VINA Green Infrastructure - POSCO International - POSCO E&C Green Materials - POSCO Future M
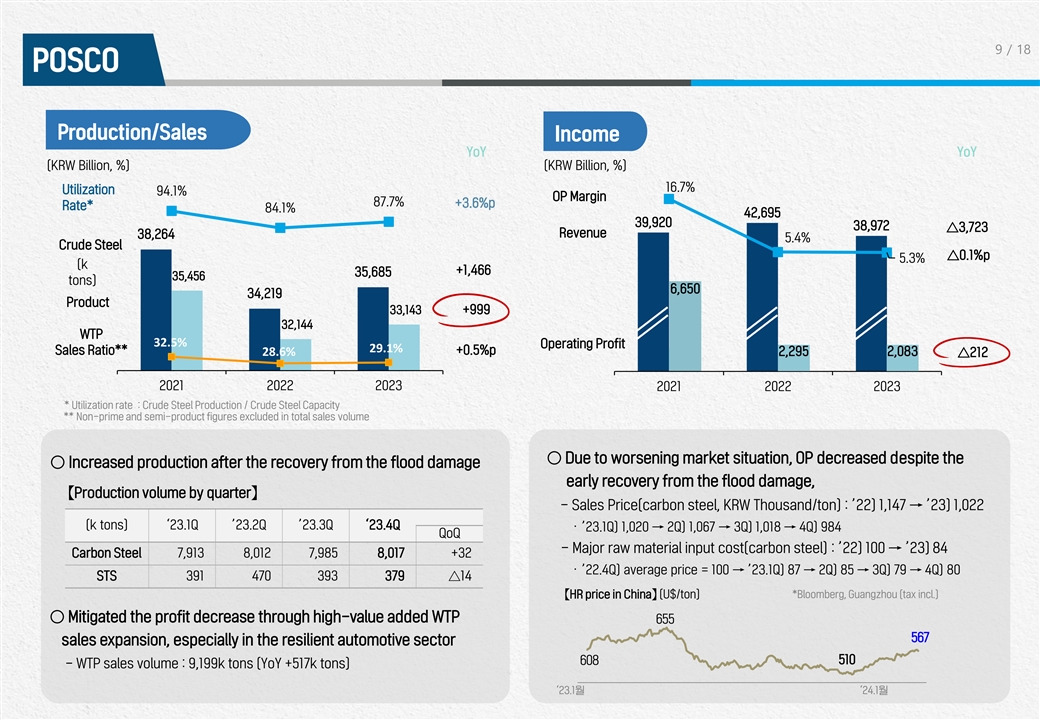
9 / 18 POSCO Production/Sales Income YoY YoY (KRW Billion, %) (KRW Billion,
%) 16.7% Utilization 94.1% 50, 000 OP Margin 87.7% +3.6%p 15. 0% Rate* 84.1% 45, 000 42,695 90. 00% 40, 000 39,920 38,972 10. 0% △3,723 40, 000 80. 00% Revenue 38,264 5.4% Crude Steel 35, 000 70. 00% 38, 000 5.0 % 90% △0.1%p 5.3% 40, 000
(k 30, 000 60. 00% +1,466 35,685 80% 0.0 % 35,456 tons) 36, 000 25, 000 50. 00% 70% 6,650 38, 000 34,219 -5.0% 20, 000 40. 00% Product 60% 34, 000 33,143 +999 30. 00% 15, 000 36, 000 -10.0% 32,144 50% 20. 00% 10, 000 WTP 32, 000 40% 32.5% Operating
Profit -15.0% 29.1% Sales Ratio** 34, 000 10. 00% +0.5%p 5,0 00 28.6% 2,295 2,083 △212 30% 30, 000 0.0 0% 0 -20.0% 20% 32, 000 2021 2022 2023 2021 2022 2023 10% * Utilization rate : Crude Steel Production / Crude Steel Capacity 30, 000 0% **
Non-prime and semi-product figures excluded in total sales volume ○ Due to worsening market situation, OP decreased despite the ○ Increased production after the recovery from the flood damage early recovery from the flood damage,
【Production volume by quarter】 - Sales Price(carbon steel, KRW Thousand/ton) : ’22) 1,147 → ’23) 1,022 (k tons) ‘23.1Q ’23.2Q ’23.3Q ‘23.4Q · ’23.1Q) 1,020 → 2Q) 1,067 →
3Q) 1,018 → 4Q) 984 QoQ - Major raw material input cost(carbon steel) : ’22) 100 → ’23) 84 Carbon Steel 7,913 8,012 7,985 8,017 +32 · ’22.4Q) average price = 100 → ’23.1Q) 87 → 2Q) 85 → 3Q)
79 → 4Q) 80 STS 391 470 393 379 △14 *Bloomberg, Guangzhou (tax incl.) 【HR price in China】 (U$/ton) ○ Mitigated the profit decrease through high-value added WTP 655 567 sales expansion, especially in the resilient
automotive sector 608 510 - WTP sales volume : 9,199k tons (YoY +517k tons) ‘23.1월 ‘24.1월

10 / 18 Overseas Steel Subsidiaries PT. Krakatau POSCO Zhangjiagang STS
(PZSS) Ÿ Despite the sluggish market conditions, the decline in OP mitigated through Ÿ Mitigated the decline in OP through cost optimization despite delayed cost reduction measures and increased domestic sales of HR economic recovery in
China and increased competition from oversupply - Operating Profit : ’23.1Q) 53 → 2Q) 58 → 3Q) 39 → 4Q) 27 - Operating Profit : ’23.1Q) △53 → 2Q) △27 → 3Q) △9 → 4Q) △42 - HR
Domestic share(%) : ’22) 71 → ’23) 82 - Sales Volume(k tons) : ’22) 1,100 → ’23) 1,003 YoY YoY 2,397 2,355 2,328 2,5 00 1 1 +69 3,8 50 0.9 3,275 3,275 0.9 2,0 00 0.8 3,3 50 Revenue △683 0.8 Revenue 2,592 0.7
2,8 50 0.7 1,5 00 0.6 2,3 50 0.6 0.5 0.5 1,8 50 1,0 00 0.4 0.4 1,3 50 0.3 0.3 850 Operating Pro 500fit 0.2 128 503 △44 Operating Profit 0.2 221 177 △71 350 (59) (130) 0.1 0.1 0 0 -150 0 (USD million) (USD million) 2021 2022 2023 2021
2022 2023 POSCO Maharashtra PY VINA • OP improved through cost reduction by diversifying supply chains and • Despite the decline in sales prices due to sluggish market conditions, cutting costs amidst global construction downturn profit
increased from sales expansion in the automotive sector - Operating Profit : ’23.1Q) 12 → 2Q) 27 → 3Q) 8 → 4Q) 28 - Operating Profit : ’23.1Q) 5 → 2Q) 4 → 3Q) 1 → 4Q) 1 - Sales Price(YoY) : △16%
- Sales Volume(k tons) : ’22) 400 → ’23) 381 YoY 1,467 1,479 YoY 414 1,350 1,4 00 357 400 △129 1,2 00 350 303 Revenue △54 Revenue 300 1,0 00 250 800 200 600 150 400 180 75 100 11 +36 180 35 39 5 Operating Profit +6
Operating Profit 200 50 0 0 (USD million) (USD million) 2021 2022 2023 2021 2022 2023

11 / 18 POSCO International Income Major Activities YoY ○ Global
Business (’22) 538 → ’23) 490 (KRW Billion)) (KRW Billion) : Mitigated OP decline through expansion of sales in the +1.1%p 3.5% 60. 00% 2.8% U.S. and Japan, focusing on infrastructure PJTs 13, 500 50. 00% OP Margin 2.2% 41,697
• Steel : Expansion of sales of high-value added steel and products for 11, 500 40. 00% infrastructure PJTs 35,924 33,133 Revenue △8,564 9,5 00 • Agriculture : Decline in the domestic price of Indonesian palm oil(CPO) 30. 00% 7,5
00 *Crude palm oil price(U$/ton): ’22) 877 → ’23) 728 1,173 1,163 △10 20. 00% 5,5 00 • Mobility : Cost increase due to initial operation after completion of the 789 Operating Profit new motor core plant in Pohang 10.
00% 3,5 00 ○ Energy (’22) 635 → ’23) 673 (KRW Billion)) 1,5 00 0.0 0% 2021 2022 2023 : Profits increased by cost cuts from direct LNG imports * POSCO Energy included • E&P : OP decreased due to decreased sales of
Myanmar - OP(KRW Billion) : ‘22) 350.6 → ‘23) 332.3 【Revenue by Business】 2022 2023 YoY Myanmar gas sales(Bcf) 189 178 △11 (KRW Billion) 2021 2022 2023 △ YoY Myanmar OP(KRW Billion) 349.8 344.9 4.9 Senex
Energy sales(Bcf) 17.1 25.4 8.3 Global Business △ 32,462 36,376 28,782 7,594 Senex OP(KRW Billion) 38.9 39.6 0.7 (former Trading) • Power Generation : OP increased by cost cuts from direct LNG imports Energy 3,462 5,321 4,351 △970
- OP(KRW Billion) : ’22) 165.5→ ‘23) 188.0
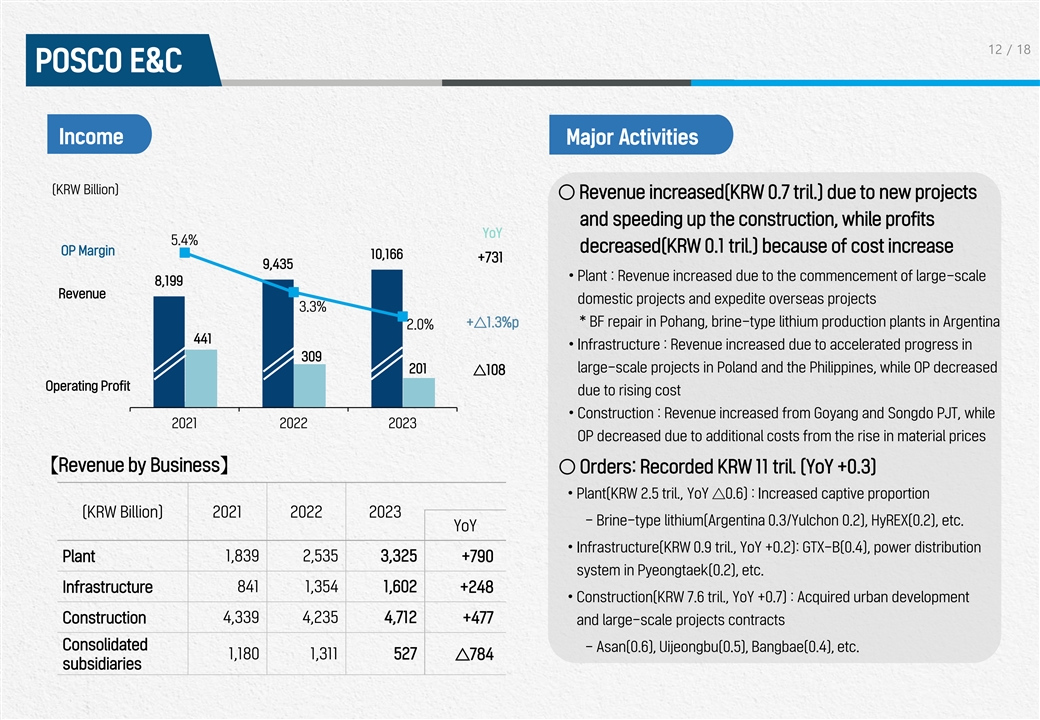
12 / 18 POSCO E&C Income Major Activities (KRW Billion) ○ Revenue
increased(KRW 0.7 tril.) due to new projects 13, 800 7.0 0% and speeding up the construction, while profits YoY 5.4% 11, 800 decreased(KRW 0.1 tril.) because of cost increase OP Margin 10,166 5.0 0% +731 9,435 9,8 00 • Plant : Revenue
increased due to the commencement of large-scale 8,199 Revenue 3.0 0% 7,8 00 domestic projects and expedite overseas projects 3.3% +△1.3%p * BF repair in Pohang, brine-type lithium production plants in Argentina 5,8 00 2.0% 1.0 0% 441 •
Infrastructure : Revenue increased due to accelerated progress in 3,8 00 309 large-scale projects in Poland and the Philippines, while OP decreased 201 -1.00% △108 1,8 00 Operating Profit due to rising cost -200 -3.00% • Construction :
Revenue increased from Goyang and Songdo PJT, while 2021 2022 2023 OP decreased due to additional costs from the rise in material prices 【Revenue by Business】 ○ Orders: Recorded KRW 11 tril. (YoY +0.3) • Plant(KRW 2.5
tril., YoY △0.6) : Increased captive proportion (KRW Billion) 2021 2022 2023 - Brine-type lithium(Argentina 0.3/Yulchon 0.2), HyREX(0.2), etc. YoY • Infrastructure(KRW 0.9 tril., YoY +0.2): GTX-B(0.4), power distribution Plant 1,839
2,535 3,325 +790 system in Pyeongtaek(0.2), etc. Infrastructure 841 1,354 1,602 +248 • Construction(KRW 7.6 tril., YoY +0.7) : Acquired urban development Construction 4,339 4,235 4,712 +477 and large-scale projects contracts Consolidated -
Asan(0.6), Uijeongbu(0.5), Bangbae(0.4), etc. 1,180 1,311 527 △784 subsidiaries
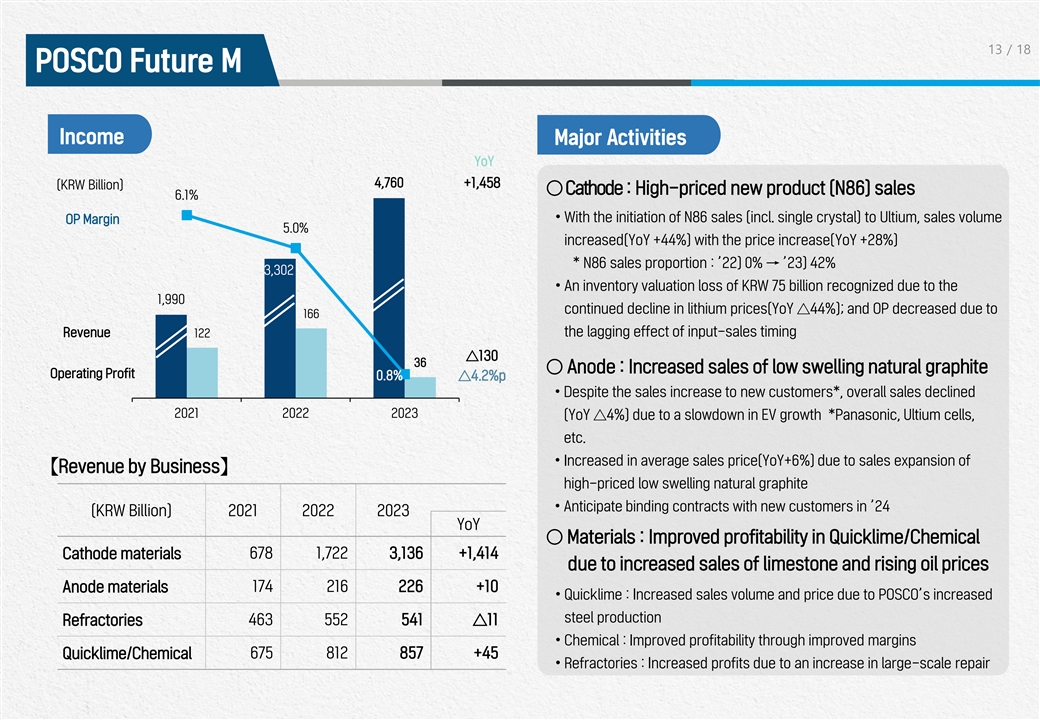
13 / 18 POSCO Future M Income Major Activities YoY 4,760 +1,458 (KRW
Billion) 5,0 00 7.0 0% ○ Cathode : High-priced new product (N86) sales 6.1% 4,5 00 6.0 0% • With the initiation of N86 sales (incl. single crystal) to Ultium, sales volume OP Margin 4,0 00 5.0% increased(YoY +44%) with the price
increase(YoY +28%) 5.0 0% 3,5 00 * N86 sales proportion : ’22) 0% → ’23) 42% 3,0 00 3,302 4.0 0% • An inventory valuation loss of KRW 75 billion recognized due to the 2,5 00 1,990 3.0 0% continued decline in lithium
prices(YoY △44%); and OP decreased due to 2,0 00 166 1,5 00 the lagging effect of input-sales timing Revenue 122 2.0 0% 1,0 00 △130 36 1.0 0% ○ Anode : Increased sales of low swelling natural graphite Operating Profi 500t 0.8%
△4.2%p • Despite the sales increase to new customers*, overall sales declined 0 0.0 0% 2021 2022 2023 (YoY △4%) due to a slowdown in EV growth *Panasonic, Ultium cells, etc. • Increased in average sales price(YoY+6%) due to
sales expansion of 【Revenue by Business】 high-priced low swelling natural graphite • Anticipate binding contracts with new customers in ’24 (KRW Billion) 2021 2022 2023 YoY ○ Materials : Improved profitability in
Quicklime/Chemical Cathode materials 678 1,722 3,136 +1,414 due to increased sales of limestone and rising oil prices Anode materials 174 216 226 +10 • Quicklime : Increased sales volume and price due to POSCO’s increased steel
production Refractories 463 552 541 △11 • Chemical : Improved profitability through improved margins Quicklime/Chemical 675 812 857 +45 • Refractories : Increased profits due to an increase in large-scale repair
14 / 18 Appendix Progress in Battery Materials Business Construction
Summarized Income Statement Summarized Balance Sheet Summarized Cash Flow Statement

15 / 18 Progress in Battery Materials Business Construction Material
Cpmpany PJT ~ '22.E '23. '24 '25 Construction Construction (Plant 1. ’22.10, Phase I of factory/pond Plant electricals Completion Plant 2. ’22.12) of Brine (1Q) (Plant 2. ’23.5) (’24.2Q) P- Plant electricals Argentina
Approval Construction Plant electricals Completion Phase II (Plant 1. ’23.4) (‘22.10) of Brine (’23.6.) (2Q) (‘25.2Q) (UP) Lithium Plant electricals Approval Incorporation Construction Completion Phase II P-Lithium (2Q)
(‘22.10) (’22.12) (’23..6) (‘25.2Q) Brine Solution (DOWN) POSCO type (No.1) Conventional type Completion P- Construction HQ/Sub Center (No.2) (No. 2‘22.8, No.1‘22.11) (’23.11) Lithium Pilbara Completion
(‘23.3) Completion Lithium Ore (2Q) Conventional type POSCO type plant electricals Solution plant electricals (’23.4) (’23.1) Completion Construction of Construction Iron (‘24.1) SNNC Electricity (’22.12) (’22.6)
removal Plant electricals Plant electricals Completion Construction (Extraction Facility) (Leaching Facility) Nickel (1Q) POSCO (’23.3) (’23.6) ('22.10) Refining Nickel Equity Acquisition/ Completion Approval Construction Indonesia
Smelting (2Q) (’23.4) (’23.9) JV (Matte) Approval Incorporation Construction Completion P-CNGR Nickel (‘23.5) (1Q) (2Q) (4Q) Niickel SolutionRefining Plant Completion of Approval Construction P- Completion electricals Downstream
Plant Next (’23.1) (’23.6) Silicon SiOx (3Q) (’23.9) (1Q) Generation Solution
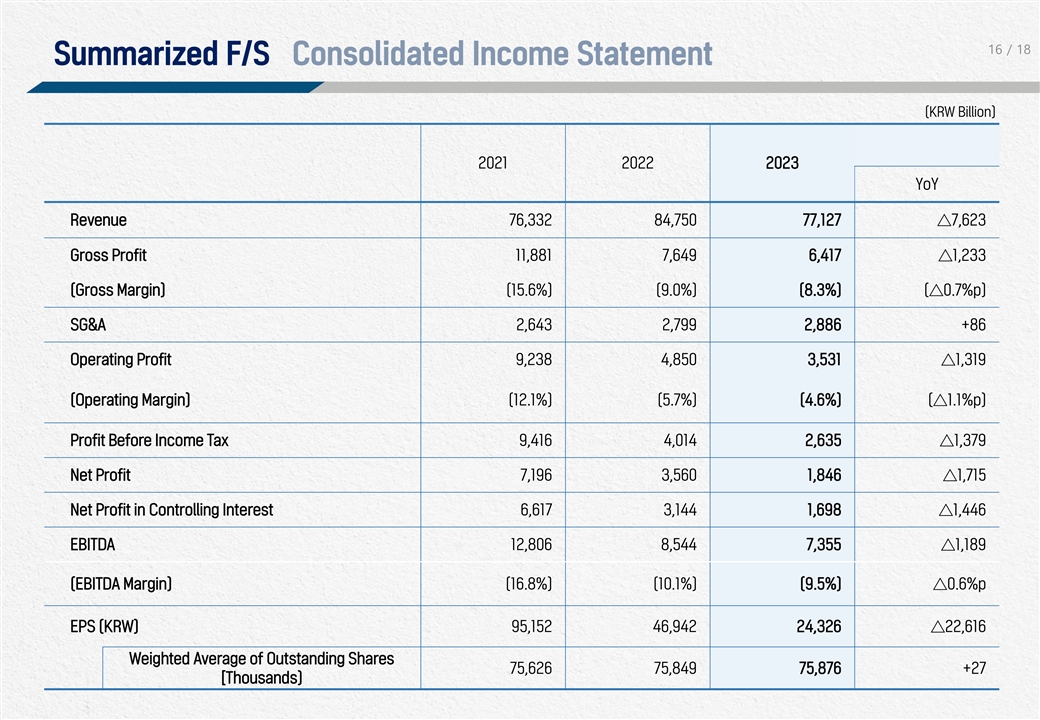
16 / 18 Summarized F/S Consolidated Income Statement (KRW Billion) 2021
2022 2023 YoY Revenue 76,332 84,750 77,127 △7,623 Gross Profit 11,881 7,649 6,417 △1,233 (Gross Margin) (15.6%) (9.0%) (8.3%) (△0.7%p) SG&A 2,643 2,799 2,886 +86 Operating Profit 9,238 4,850 3,531 △1,319 (Operating
Margin) (12.1%) (5.7%) (4.6%) (△1.1%p) Profit Before Income Tax 9,416 4,014 2,635 △1,379 Net Profit 7,196 3,560 1,846 △1,715 Net Profit in Controlling Interest 6,617 3,144 1,698 △1,446 EBITDA 12,806 8,544 7,355 △1,189
(EBITDA Margin) (16.8%) (10.1%) (9.5%) △0.6%p EPS (KRW) 95,152 46,942 24,326 △22,616 Weighted Average of Outstanding Shares 75,626 75,849 75,876 +27 [Thousands)
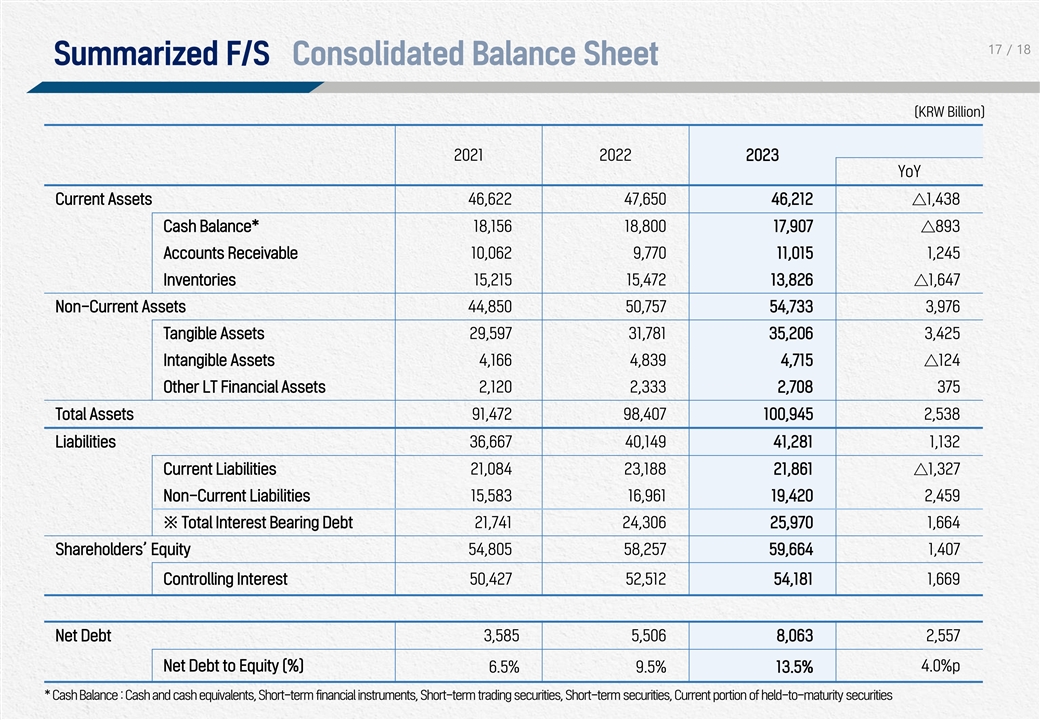
17 / 18 Summarized F/S Consolidated Balance Sheet (KRW Billion) 2021 2022
2023 YoY Current Assets 46,622 47,650 46,212 △1,438 Cash Balance* 18,156 18,800 17,907 △893 Accounts Receivable 10,062 9,770 11,015 1,245 Inventories 15,215 15,472 13,826 △1,647 Non-Current Assets 44,850 50,757 54,733 3,976
Tangible Assets 29,597 31,781 35,206 3,425 Intangible Assets 4,166 4,839 4,715 △124 Other LT Financial Assets 2,120 2,333 2,708 375 Total Assets 91,472 98,407 100,945 2,538 Liabilities 36,667 40,149 41,281 1,132 Current Liabilities 21,084
23,188 21,861 △1,327 Non-Current Liabilities 15,583 16,961 19,420 2,459 ※ Total Interest Bearing Debt 21,741 24,306 25,970 1,664 Shareholders’ Equity 54,805 58,257 59,664 1,407 Controlling Interest 50,427 52,512 54,181 1,669 Net
Debt 3,585 5,506 8,063 2,557 Net Debt to Equity (%) 4.0%p 6.5% 9.5% 13.5% * Cash Balance : Cash and cash equivalents, Short-term financial instruments, Short-term trading securities, Short-term securities, Current portion of held-to-maturity
securities

18 / 18 Summarized F/S Consolidated Cash Flow Statement (KRW Billion) 2022
2023 Ⅰ. Operating Activities 6,187 5,881 1. Net Profit 3,560 1,846 2. Depreciation and Amortization 3,694 3,823 3. Changes in Accounts Receivable, Accounts Payable, etc. △1,067 212 Ⅱ. Investing Activities △4,220 △7,127
1. Financial Instruments Disposition(Acquisition) 2,030 394 2. Tangible Asset Disposition(Acquisition), etc. △6,250 △7,521 Ⅲ. Financing Activities 1,319 △153 1. Increase in Borrowings(Decrease) 2,180 842 2. Dividends Paid,
etc. △861 △995 Ⅳ. Others △9 17 Ⅴ. Net Increase/Decrease in Cash and Cash Equivalents 3,277 △1,382 1. Cash and Cash Equivalents, Beginning of Period 4,776 8,053 2. Cash and Cash Equivalents, End of Period 8,053
6,671
SIGNATURES
Pursuant to the requirements of the Securities Exchange Act of 1934, the registrant has duly caused this report to be signed on its behalf by
the undersigned, thereunto duly authorized.
|
|
|
|
|
|
|
|
|
|
|
POSCO HOLDINGS INC. |
|
|
|
|
(Registrant) |
|
|
|
|
| Date: January 31, 2024 |
|
|
|
By |
|
/s/ Han, Young-Ah |
|
|
|
|
|
|
(Signature) |
|
|
|
|
|
|
Name: Han, Young-Ah |
|
|
|
|
|
|
Title: Senior Vice President |
POSCO (NYSE:PKX)
Historical Stock Chart
From Mar 2024 to Apr 2024

POSCO (NYSE:PKX)
Historical Stock Chart
From Apr 2023 to Apr 2024
