false
0001201792
0001201792
2024-03-05
2024-03-05
iso4217:USD
xbrli:shares
iso4217:USD
xbrli:shares
UNITED STATES
SECURITIES AND EXCHANGE COMMISSION
WASHINGTON, D.C. 20549
FORM 8-K
CURRENT REPORT
Pursuant to Section 13 OR 15(d)
of the Securities Exchange Act of 1934
Date of Report (Date of earliest event reported):
March 5, 2024
American
Public Education, Inc.
(Exact name
of registrant as specified in its charter)
| Delaware |
|
001-33810 |
|
01-0724376 |
|
(State or other jurisdiction
of incorporation) |
|
(Commission
File Number) |
|
(IRS Employer
Identification No.) |
111
W. Congress Street
Charles
Town, West Virginia |
|
25414 |
| (Address of principal executive offices) |
|
(Zip Code) |
Registrant’s telephone number, including
area code: 304-724-3700
Check the appropriate box below if the
Form 8-K filing is intended to simultaneously satisfy the filing obligation of the registrant under any of the following provisions:
| ¨ | Written
communications pursuant to Rule 425 under the Securities Act (17 CFR 230.425) |
| ¨ | Soliciting
material pursuant to Rule 14a-12 under the Exchange Act (17 CFR 240.14a-12) |
| ¨ | Pre-commencement
communications pursuant to Rule 14d-2(b) under the Exchange Act (17 CFR 240.14d-2(b)) |
| ¨ | Pre-commencement
communications pursuant to Rule 13e-4(c) under the Exchange Act (17 CFR 240.13e-4(c)) |
Securities registered pursuant to Section 12(b) of the Act:
| Title of each class |
Trading Symbol(s) |
Name of each exchange on which registered |
| Common
Stock, $0.01 par value per share |
APEI |
Nasdaq
Global Select Market |
Indicate by check mark whether the registrant is an emerging
growth company as defined in Rule 405 of the Securities Act of 1933 (§230.405 of this chapter) or Rule 12b-2 of the Exchange
Act of 1934 (§240.12b-2 of this chapter).
Emerging growth company ¨
If an emerging growth company, indicate
by check mark if the registrant has elected not to use the extended transition period for complying with any new or revised financial
accounting standards provided pursuant to Section 13(a) of the Exchange Act. ¨
Section 2 – Financial Information
Item 2.02 Results of Operations and
Financial Condition.
On March 5, 2024, American Public Education, Inc. (the “Company”)
issued a press release reporting financial results for the three and twelve months ended December 31, 2023. A copy of the Company’s
press release is attached to this report as Exhibit 99.1 and is incorporated in this report by reference. The Company
has scheduled a webcast for 5:00 p.m. ET on March 5, 2024 to discuss its financial results, and slides for that webcast are attached to
this report as Exhibit 99.2 and are incorporated in this report by reference.
Section 9 – Financial Statements and Exhibits
Item 9.01 Financial Statements and
Exhibits.
SIGNATURES
Pursuant to the requirements of the Securities
Exchange Act of 1934, the registrant has duly caused this report to be signed on its behalf by the undersigned hereunto duly authorized.
| |
American Public Education, Inc. |
| |
|
|
|
| |
|
|
|
| Date: March 5, 2024 |
By: |
/s/ Richard W. Sunderland, Jr. |
|
| |
|
Richard W. Sunderland, Jr.,
Executive Vice President and Chief Financial Officer |
| |
|
|
|
|
|
Exhibit 99.1

American Public Education Reports Fourth Quarter
and Full Year 2023 Results
CHARLES TOWN, W.Va., March 5, 2024 /PRNewswire/ -- American
Public Education, Inc. (Nasdaq: APEI) announced financial results for the quarter and year ended December 31, 2023.
Fourth Quarter Highlights:
| · | Consolidated revenue increased 0.2% year-over-year to $152.8 million. |
| · | Net income available to common stockholders was $11.5 million, compared to
a net loss available to common stockholders of $6.6 million in the prior year period. |
| · | Net income per diluted common share was $0.64, compared to a net loss per
diluted common share of $0.35 in the same period of 2022. |
| · | Adjusted EBITDA increased 66.8% year-over-year to $25.7 million. |
| · | APEI maintained a strong liquidity position, with total cash, cash equivalents
and restricted cash increasing $14.9 million or 11.5% year-over-year to approximately $144.3 million. |
“Reflecting on 2023, I’m encouraged by the leadership team
we have assembled, the enrollment momentum we’ve gained, and the strengthening of our business we’ve delivered– all
while extending the reach and impact of our value proposition to our over 107,000 students,” said Angela Selden, President and Chief
Executive Officer of APEI.
“We are Powering Potential and Prosperity for our service minded
students every day. Looking ahead to 2024, our unwavering commitment to academic excellence along with our emphasis on operational
efficiency and innovation will further enhance student outcomes and enable us to efficiently serve even more students and communities,”
added Selden.
Financial Results:
For the three months ended December 31, 2023:
| · | Total consolidated revenue was $152.8
million, an increase of $0.4 million, or 0.2%, compared to $152.4 million for the three months ended December 31, 2022. The increase was
primarily due to a $6.0 million, or 8.1%, increase in revenue in our APUS Segment and a $3.1 million, or 24.9%, increase in revenue in
our HCN Segment, partially offset by an $8.1 million, or 13.4%, decrease in revenue in our Rasmussen University (“RU”) Segment
and a $0.6 million, or 10.3%, decrease in Graduate School USA (“GSUSA”) revenue included in Corporate and Other. The RU Segment
revenue decrease was primarily due to a 9.6% decrease in total student enrollment as compared to the prior year period, partially offset
by increases in the tuition of certain programs implemented in January 2023. The APUS Segment revenue increase was primarily due to a
4.0% increase in net course registrations and tuition and fee increases implemented in the second and third quarters of 2023. The HCN
Segment revenue increase was primarily due to a 19.2% increase in total student enrollment, as well as a 5% tuition increase implemented
during the second quarter, compared to the prior year period. GSUSA revenue decrease was primarily due to a decrease in the number of
training courses completed during the quarter. |
| · | Total costs and expenses were $136.9 million,
a decrease of $15.8 million, or 10.4%, compared to $152.7 million for the three months ended December 31, 2022. The decrease in costs
and expenses was due primarily to decreases in advertising costs, employee compensation, depreciation and amortization costs, and Collegis,
LLC (“Collegis”) transition costs. |
Costs and expenses included a $2.4
million loss on assets held for sale representing real property no longer used by our APUS Segment. In the prior year period, cost and
expenses included a $2.0 million impairment charge of intangible assets in our RU Segment. Costs and expenses as a percentage of revenue
decreased to 89.6% from 100.2% for the three months ended December 31, 2022.
| · | Instructional costs and services expenses
were $70.7 million, a decrease of $2.1 million, or 2.9%, compared to $72.9 million for the three months ended December 31, 2022. The decrease
in instructional costs and services expenses was primarily due to decreases in employee compensation costs in our RU Segment, partially
offset by increases in employee compensation costs in our HCN Segment and Corporate and Other. Instructional costs and services expenses
as a percentage of revenue increased to 46.3% from 47.8% for the three months ended December 31, 2022. |
| · | Selling and promotional expenses were
$26.8 million, a decrease of $11.8 million, or 30.6%, compared to $38.6 million for the three months ended December 31, 2022. The decrease
in selling and promotional expenses was primarily due to decreases in advertising and employee compensation costs in all our segments,
as well as a decrease in Collegis transition costs in our RU Segment. Selling and promotional expenses as a percentage of revenue decreased
to 17.5% from 25.3% for the three months ended December 31, 2022. |
| · | General and administrative expenses were
$31.3 million, an increase of $0.2 million, or 0.5%, compared to $31.2 million for the three months ended December 31, 2022. The increase
in general and administrative expenses was primarily due to an increase in compensation costs in our RU and HCN Segments and Corporate
and Other, partially offset by decreases in employee compensation costs and professional fees and technology costs, primarily in our APUS
Segment. General and administrative expenses as a percentage of revenue increased to 20.5% from 20.4% for the three months ended December
31, 2022. As we continue to evaluate enhancements to our business capabilities, particularly in technology, we expect to incur additional
costs and that our general and administrative expenses will vary from time to time. |
| · | Net interest expense was $0.8 million
and $7.4 million for the three months ended December 31, 2023 and 2022, respectively. The decrease in net interest expense was primarily
due to the decrease in the outstanding balance in our senior secured term loan facility and due to a higher yield on cash balances. |
In December 2022, we made $65.0 million
in prepayments to reduce outstanding debt and as a result, we wrote off a proportionate amount of unamortized debt issuance costs in the
amount of $3.9 million. The write off is recorded in interest expense for the quarter and year ending December 31, 2022.
| · | Net income available to common stockholders
was $11.5 million, compared to net loss available to common stockholders of $6.6 million for the three months ended December 31, 2022.
The increase in net income is a result of changes in revenue and expenses discussed above. |
| · | Net income per diluted common share was
$0.64, compared to a net loss per diluted common share of $0.35 in the same period of 2022. Net income per diluted common share includes
a $2.4 million loss on assets held for sale in the fourth quarter of 2023. |
| · | Adjusted EBITDA was $25.7 million, compared
to $15.4 million for the three months ended December 31, 2022. Adjusted EBITDA excludes non-cash compensation expense, (gain)/loss on
disposals of long-lived assets, and loss on assets held for sale. |
Balance Sheet and Liquidity:
| · | Total cash, cash equivalents, and restricted
cash were $144.3 million and $129.5 million at December 31, 2023 and December 31, 2022, respectively, representing an increase
of $14.9 million, or 11.5%. The increase in cash was primarily due to higher revenue and operating income at APUS, increased payments
received from the Army including payments related to periods prior to 2023, and the timing of other receipts and payments, partially offset
by the change in billing approach for tuition assistance at APUS, our investment in capital expenditures, payment of preferred dividends,
and repurchases of common stock in 2023. |
Registrations and Enrollment:
| | |
2023 | | |
2022 | | |
% Change | |
| American Public University System 1 | |
| | | |
| | | |
| | |
For the three months ended December 31,
Net Course Registrations | |
| 90,700 | | |
| 87,200 | | |
| 4% | |
| | |
| | | |
| | | |
| | |
For the twelve months ended December 31,
Net Course Registrations | |
| 367,600 | | |
| 350,400 | | |
| 5% | |
| | |
| | | |
| | | |
| | |
Rasmussen University 2 | |
| | | |
| | | |
| | |
For the three months ended December 31,
Total Student Enrollment | |
| 14,100 | | |
| 15,600 | | |
| (10)% | |
| | |
| | | |
| | | |
| | |
Hondros College of Nursing 3 | |
| | | |
| | | |
| | |
For the three months ended December 31,
Total Student Enrollment | |
| 3,100 | | |
| 2,600 | | |
| 19% | |
1 APUS Net Course Registrations represents
the approximate aggregate number of courses for which students remain enrolled after the date by which they may drop a course without
financial penalty. Excludes students in doctoral programs.
2 RU Total Student Enrollment represents students in an active status as of the full-term census or billing date
3 HCN Total Student Enrollment represents the approximate number of students enrolled in a course after the date
by which students may drop a course without financial penalty.
First Quarter and Full Year 2024 Outlook:
The following statements are based on APEI's current
expectations. These statements are forward-looking and actual results may differ materially. APEI undertakes no obligation to update publicly
any forward-looking statements for any reason unless required by law. Refer to APEI's earnings conference call and presentation for further
details.
| | |
First Quarter 2024 Guidance | |
| | |
(Approximate) | | |
(% Yr/Yr Change) | |
| | |
| | |
| |
| APUS Net course registrations | |
| 97,000 to 99,000 | | |
| 1% to 3% | |
| | |
| | | |
| | |
| HCN Student enrollment | |
| 3,300 | | |
| 22% | |
| | |
| | | |
| | |
| RU Student enrollment1 | |
| 13,500 | | |
| -6% | |
| - On-ground Healthcare | |
| 6,300 | | |
| -11% | |
| - Online | |
| 7,200 | | |
| 0% | |
| | |
| | | |
| | |
| ($ in millions except EPS) | |
| | | |
| | |
| APEI Consolidated revenue | |
| $151.0 – $153.0 | | |
| 1% to 2% | |
| APEI Net income available to common stockholders | |
| ($4.4) – ($3.0) | | |
| n.m. | |
| APEI Adjusted EBITDA | |
| $8.0 – $10.0 | | |
| 14% to 43% | |
| APEI Diluted EPS | |
| ($0.25) – ($0.17) | | |
| n.m. | |
| | |
Full Year 2024 Guidance | |
| | |
| (Approximate) | | |
| (% Yr/Yr Change) | |
| ($ in millions) | |
| | | |
| | |
| APEI Consolidated Revenue | |
| $610 – $620 | | |
| 2% to 3% | |
| APEI Adjusted EBITDA | |
| $55 – $65 | | |
| -8% to 9% | |
| APEI Capital Expenditure (CapEx) | |
| $17 – $20 | | |
| 22% to 44% | |
| 1. | RU revised its method of presenting student enrollment to distinguish between on-ground healthcare
and online enrollment, aligning with its operational structure. Quarterly historical enrollment data for the previous year under this
new methodology is available in the appendix of our fourth quarter 2023 presentation materials accessible on our website and on Form 8-K
filed today with the SEC. |
Non-GAAP Financial Measures:
This press release contains the non-GAAP financial
measures of EBITDA (earnings before interest, taxes, depreciation, and amortization) and adjusted EBITDA (EBITDA less non-cash expenses
such as stock compensation and non-recurring expenses). APEI believes that the use of these measures is useful because they allow investors
to better evaluate APEI's operating profit and cash generation capabilities.
For the twelve months ended December 31, 2023
and 2022, adjusted EBITDA excludes non-cash compensation expense, (gain)/loss on disposals of long-lived assets, severance expense, loss
on assets held for sale, M&A-related professional fees, transition services costs, adjustment to gain on acquisition, and impairment
of goodwill and intangible assets.
These non-GAAP measures should not be considered
in isolation or as an alternative to measures determined in accordance with generally accepted accounting principles in the United States
(GAAP). The principal limitation of our non-GAAP measures is that they exclude expenses that are required by GAAP to be recorded. In addition,
non-GAAP measures are subject to inherent limitations as they reflect the exercise of judgment by management about which expenses are
excluded.
APEI is presenting EBITDA and adjusted EBITDA
in connection with its GAAP results and urges investors to review the reconciliation of EBITDA and adjusted EBITDA to the comparable GAAP
financial measures that is included in the tables following this press release (under the captions "GAAP Net Income to Adjusted EBITDA,"
and "GAAP Outlook Net Income to Outlook Adjusted EBITDA") and not to rely on any single financial measure to evaluate its business.
Webcast:
A live webcast of the APEI's fourth quarter 2023
earnings conference call will be held today at 5:00 p.m. Eastern Time. This webcast will be open to listeners who log in through the APEI's
investor relations website, www.apei.com. A replay of the live webcast will also be available to listeners through APEI's investor
relations website for one year.
About American Public Education
American Public Education, Inc. (Nasdaq:
APEI), through its institutions American Public University System (APUS), Rasmussen University, Hondros College of
Nursing, and Graduate School USA (GSUSA), provides education that transforms lives, advances careers, and improves communities.
APUS, which operates through American Military
University and American Public University, is the leading educator to active-duty military and veteran students* and serves approximately
90,000 adult learners worldwide via accessible and affordable higher education.
Rasmussen University is a 120-year-old nursing
and health sciences-focused institution that serves approximately 13,500 students across its 22 campuses in six states and online. It
also has schools of Business, Technology, Design, Early Childhood Education and Justice Studies.
Hondros College of Nursing focuses on educating
pre-licensure nursing students at eight campuses (six in Ohio, one in Indiana, and one in Michigan). It is the largest educator of PN
(LPN) nurses in the state of Ohio** and serves approximately 3,300 total students.
Graduate School USA is a leading training provider
to the federal workforce with an extensive portfolio of government agency customers. It serves the federal workforce through customized
contract training (B2G) to federal agencies and through open enrollment (B2C) to government professionals.
Both APUS and Rasmussen are institutionally accredited
by the Higher Learning Commission (HLC), an institutional accreditation agency recognized by the U.S. Department of Education.
Hondros is accredited by the Accrediting Bureau of Health Education Schools (ABHES). GSUSA is accredited by the Accrediting
Council for Continuing Education & Training (ACCET). For additional information, visit www.apei.com.
*Based on FY 2019 Department of Defense tuition assistance data,
as reported by Military Times, and Veterans Administration student enrollment data as of 2023.
**Based on information compiled by the National Council of State
Boards of Nursing and Ohio Board of Nursing.
Forward Looking Statements
Statements made in this press release regarding APEI
or its subsidiaries that are not historical facts are forward-looking statements based on current expectations, assumptions, estimates
and projections about APEI and the industry. In some cases, forward-looking statements can be identified by words such as "anticipate,"
"believe," "seek," "could," "estimate," "expect," "intend," "may,"
"plan," "should," "will," "would," and similar words or their opposites. Forward-looking statements
include, without limitation, statements regarding the Company’s future path, expected growth, registration and enrollments, revenues,
income and adjusted EBITDA and EBITDA, the growth and profitability of Rasmussen University and plans with respect to recent, current
and future initiatives.
Forward-looking statements are subject to risks and uncertainties that
could cause actual results to differ materially from those expressed or implied by such statements. Such risks and uncertainties include,
among others, risks related to: APEI's failure to comply with regulatory and accrediting agency requirements, including the “90/10
Rule”, and to maintain institutional accreditation and the impacts of any actions APEI may take to prevent or correct such failure;
APEI's dependence on the effectiveness of its ability to attract students who persist in its institutions' programs; changing market demands;
declines in enrollments at APEI’s subsidiaries; the enactment of legislation that adversely impacts APEI or its subsidiaries; APEI's
inability to effectively market its institutions' programs; APEI's inability to maintain strong relationships with the military and maintain
course registrations and enrollments from military students; the loss or disruption of APEI's ability to receive funds under tuition assistance
programs or the reduction, elimination, or suspension of tuition assistance; adverse effects of changes APEI makes to improve the student
experience and enhance the ability to identify and enroll students who are likely to succeed; APEI's need to successfully adjust to future
market demands by updating existing programs and developing new programs; APEI's loss of eligibility to participate in Title IV programs
or ability to process Title IV financial aid; economic and market conditions and changes in interest rates; difficulties involving acquisitions;
APEI’s indebtedness and preferred stock; APEI's dependence on and the need to continue to invest in its technology infrastructure,
including with respect to third-party vendors; the inability to recognize the anticipated benefits of APEI's cost savings efforts; APEI’s
ability to manage and limit its exposure to bad debt; and the various risks described in the "Risk Factors" section and elsewhere
in APEI's Annual Report on Form 10-K for the year ended December 31, 2023, and in other filings with the SEC. You should not place
undue reliance on any forward-looking statements. APEI undertakes no obligation to update publicly any forward-looking statements for
any reason, unless required by law, even if new information becomes available or other events occur in the future.
Contacts:
Frank Tutalo.
Director, Public Relations
American Public Education, Inc
ftutalo@apei.com
571-358-3042
| American Public Education, Inc. |
| Consolidated Statement of Income |
| (In thousands, except per share data) |
| | |
Three Months Ended | |
| | |
December 31, | |
| | |
2023 | | |
2022 | |
| | |
(unaudited) | |
| | |
| | |
| |
| Revenues | |
$ | 152,804 | | |
$ | 152,438 | |
| Costs and expenses: | |
| | | |
| | |
| Instructional costs and services | |
| 70,747 | | |
| 72,868 | |
| Selling and promotional | |
| 26,750 | | |
| 38,567 | |
| General and administrative | |
| 31,332 | | |
| 31,173 | |
| Depreciation and amortization | |
| 5,081 | | |
| 7,878 | |
| Impairment of goodwill and intangible assets | |
| - | | |
| 2,000 | |
| Loss on assets held for sale | |
| 2,425 | | |
| - | |
| Loss on disposals of long-lived assets | |
| 537 | | |
| 214 | |
| Total costs and expenses | |
| 136,872 | | |
| 152,700 | |
| Income (loss) from operations before | |
| | | |
| | |
| interest and income taxes | |
| 15,932 | | |
| (262 | ) |
| Interest expense, net | |
| (791 | ) | |
| (7,389 | ) |
| Income (loss) before income taxes | |
| 15,141 | | |
| (7,651 | ) |
| Income tax expense (benefit) | |
| 2,124 | | |
| (1,124 | ) |
| Equity investment loss, net of tax | |
| (3 | ) | |
| (8 | ) |
| Net income (loss) | |
| 13,014 | | |
| (6,535 | ) |
| Preferred stock dividends | |
| 1,539 | | |
| 48 | |
| Net income (loss) available to common stockholders | |
$ | 11,475 | | |
$ | (6,583 | ) |
| | |
| | | |
| | |
| Net income (loss) per common share: | |
| | | |
| | |
| Basic | |
$ | 0.65 | | |
$ | (0.35 | ) |
| Diluted | |
$ | 0.64 | | |
$ | (0.35 | ) |
| | |
| | | |
| | |
| Weighted average number of | |
| | | |
| | |
| common shares: | |
| | | |
| | |
| Basic | |
| 17,762 | | |
| 18,892 | |
| Diluted | |
| 17,896 | | |
| 18,976 | |
| | |
Three Months Ended | |
| Segment Information: | |
December 31, | |
| | |
2023 | | |
2022 | |
| Revenues: | |
| | |
| |
| APUS Segment | |
$ | 79,362 | | |
$ | 73,399 | |
| RU Segment | |
$ | 52,575 | | |
$ | 60,719 | |
| HCN Segment | |
$ | 15,789 | | |
$ | 12,642 | |
| Corporate and other1 | |
$ | 5,078 | | |
$ | 5,678 | |
| Income (loss) from operations before | |
| | | |
| | |
| interest and income taxes: | |
| | | |
| | |
| APUS Segment | |
$ | 26,463 | | |
$ | 19,114 | |
| RU Segment | |
$ | (2,867 | ) | |
$ | (12,996 | ) |
| HCN Segment | |
$ | 783 | | |
$ | (993 | ) |
| Corporate and other | |
$ | (8,447 | ) | |
$ | (5,387 | ) |
| | |
Twelve Months Ended | |
| | |
December 31, | |
| | |
2023 | | |
2022 | |
| | |
(unaudited) | |
| | |
| | |
| |
| Revenues | |
$ | 600,545 | | |
$ | 606,328 | |
| Costs and expenses: | |
| | | |
| | |
| Instructional costs and services | |
| 292,862 | | |
| 288,472 | |
| Selling and promotional | |
| 132,955 | | |
| 154,649 | |
| General and administrative | |
| 128,239 | | |
| 120,352 | |
| Depreciation and amortization | |
| 27,816 | | |
| 32,127 | |
| Impairment of goodwill and intangible assets | |
| 64,000 | | |
| 146,900 | |
| Loss an assets held for sale | |
| 2,425 | | |
| - | |
| Loss on disposals of long-lived assets | |
| 554 | | |
| 1,176 | |
| Total costs and expenses | |
| 648,851 | | |
| 743,676 | |
| (Loss) income from operations before | |
| | | |
| | |
| interest income and income taxes | |
| (48,306 | ) | |
| (137,348 | ) |
| Gain on acquisition | |
| - | | |
| 3,828 | |
| Interest (expense) income | |
| (4,459 | ) | |
| (17,728 | ) |
| (Loss) income before income taxes | |
| (52,765 | ) | |
| (151,248 | ) |
| Income tax (benefit) expense | |
| (10,715 | ) | |
| (36,276 | ) |
| Equity investment loss, net of tax | |
| (5,236 | ) | |
| (21 | ) |
| Net loss | |
| (47,286 | ) | |
| (114,993 | ) |
| Preferred stock dividends | |
| 6,008 | | |
| 48 | |
| Net loss available to common stockholders | |
$ | (53,294 | ) | |
$ | (115,041 | ) |
| | |
| | | |
| | |
| Net loss per common share: | |
| | | |
| | |
| Basic | |
$ | (2.94 | ) | |
$ | (6.10 | ) |
| Diluted | |
$ | (2.93 | ) | |
$ | (6.08 | ) |
| | |
| | | |
| | |
| Weighted average number of | |
| | | |
| | |
| common shares: | |
| | | |
| | |
| Basic | |
| 18,112 | | |
| 18,859 | |
| Diluted | |
| 18,193 | | |
| 18,914 | |
| | |
Twelve Months Ended | |
| Segment Information: | |
December 31, | |
| | |
2023 | | |
2022 | |
| Revenues: | |
| | |
| |
| APUS Segment | |
$ | 303,303 | | |
$ | 285,128 | |
| RU Segment | |
$ | 214,086 | | |
$ | 253,257 | |
| HCN Segment | |
$ | 56,936 | | |
$ | 47,078 | |
| Corporate and other1 | |
$ | 26,220 | | |
$ | 20,865 | |
| (Loss) income from operations before | |
| | | |
| | |
| interest income and income taxes: | |
| | | |
| | |
| APUS Segment | |
$ | 84,426 | | |
$ | 58,452 | |
| RU Segment | |
$ | (103,575 | ) | |
$ | (166,557 | ) |
| HCN Segment | |
$ | (1,396 | ) | |
$ | (4,011 | ) |
| Corporate and other1 | |
$ | (27,761 | ) | |
$ | (25,232 | ) |
1. Corporate and Other includes tuition and contract training revenue earned by GSUSA and the elimination of intersegment revenue for courses taken by employees of one segment at other segments.
GAAP Net Income to Adjusted EBITDA:
The following table sets forth the reconciliation of the Company’s reported GAAP net income to the calculation of adjusted EBITDA for the three months ended December 31, 2023 and 2022:
| | |
Three Months Ended | | |
Twelve Months Ended | |
| | |
December 31, | | |
December 31, | |
| (in thousands, except per share data) | |
2023 | | |
2022 | | |
2023 | | |
2022 | |
| Net loss available to common stockholders | |
$ | 11,475 | | |
$ | (6,583 | ) | |
$ | (53,294 | ) | |
$ | (115,041 | ) |
| Preferred stock dividends | |
| 1,539 | | |
| 48 | | |
| 6,008 | | |
| 48 | |
| Net loss | |
$ | 13,014 | | |
$ | (6,535 | ) | |
$ | (47,286 | ) | |
$ | (114,993 | ) |
| Income tax expense (benefit) | |
| 2,124 | | |
| (1,124 | ) | |
| (10,715 | ) | |
| (36,276 | ) |
| Interest expense | |
| 791 | | |
| 7,389 | | |
| 4,459 | | |
| 17,728 | |
| Equity investment loss, net of tax | |
| 3 | | |
| 8 | | |
| 5,236 | | |
| 21 | |
| Depreciation and amortization | |
| 5,081 | | |
| 7,878 | | |
| 27,816 | | |
| 32,127 | |
| EBITDA | |
| 21,013 | | |
| 7,616 | | |
| (20,490 | ) | |
| (101,393 | ) |
| | |
| | | |
| | | |
| | | |
| | |
| Impairment of goodwill and intangible assets | |
| - | | |
| 2,000 | | |
| 64,000 | | |
| 146,900 | |
| Adjustment to gain on acquisition | |
| - | | |
| - | | |
| - | | |
| (3,828 | ) |
| Stock Compensation | |
| 1,715 | | |
| 1,306 | | |
| 7,740 | | |
| 8,009 | |
| (Gain) loss on disposals of long-lived assets | |
| 537 | | |
| 214 | | |
| 554 | | |
| 1,176 | |
| Loss on assets held for sale | |
| 2,425 | | |
| - | | |
| 2,425 | | |
| - | |
| M&A - related professional | |
| - | | |
| 328 | | |
| - | | |
| 1,930 | |
| Transition services cost | |
| - | | |
| 3,936 | | |
| 2,403 | | |
| 3,936 | |
| Severance expense | |
| - | | |
| - | | |
| 2,959 | | |
| - | |
| Adjusted EBITDA | |
$ | 25,690 | | |
$ | 15,400 | | |
$ | 59,591 | | |
$ | 56,730 | |
GAAP Outlook Net Income to Outlook Adjusted EBITDA:
The following table sets forth the reconciliation of the Company’s outlook GAAP net income to the calculation of outlook adjusted EBITDA for the three months ending March 31, 2024 and twelve months ending December 31, 2024:
| | |
Three Months Ending | | |
Twelve Months Ending | |
| | |
March 31, 2024 | | |
December 31, 2024 | |
| (in thousands, except per share data) | |
Low | | |
High | | |
Low | | |
High | |
| Net income/(loss) available to common stockholders | |
$ | (4,353 | ) | |
$ | (2,953 | ) | |
$ | 4,150 | | |
$ | 11,150 | |
| Preferred dividends | |
| 1,500 | | |
| 1,500 | | |
| 6,000 | | |
| 6,000 | |
| Net Income/(Loss) | |
| (2,853 | ) | |
| (1,453 | ) | |
| 10,150 | | |
| 17,150 | |
| Income tax expense/(benefit) | |
| (1,223 | ) | |
| (623 | ) | |
| 4,350 | | |
| 7,350 | |
| Interest expense | |
| 2,075 | | |
| 2,075 | | |
| 7,700 | | |
| 7,700 | |
| Depreciation and amortization | |
| 5,200 | | |
| 5,200 | | |
| 20,300 | | |
| 20,300 | |
| EBITDA | |
| 3,200 | | |
| 5,200 | | |
| 42,500 | | |
| 52,500 | |
| Stock compensation | |
| 2,000 | | |
| 2,000 | | |
| 7,400 | | |
| 7,400 | |
| Other - Dallas lease buyout | |
| 2,200 | | |
| 2,200 | | |
| 2,200 | | |
| 2,200 | |
| Transition services cost | |
| 600 | | |
| 600 | | |
| 2,900 | | |
| 2,900 | |
| Adjusted EBITDA | |
$ | 8,000 | | |
$ | 10,000 | | |
$ | 55,000 | | |
$ | 65,000 | |
Exhibit 99.2

American Public Education, Inc. Fourth Quarter 2023 Results March 5, 2024 PRESENTED BY Angela Selden President and CEO Richard Sunderland, CPA Executive VP and CFO

Forward Looking Statements Statements made in this presentation regarding American Public Education, Inc . or its subsidiaries (“APEI” or the “Company”) that are not historical facts are forward - looking statements based on current expectations, assumptions, estimates and projections about APEI and the industry . In some cases, forward - looking statements can be identified by words such as “anticipate,” “believe,” “seek,” “could,” “estimate,” “expect,” “intend,” “may,” “plan,” “should,” “will,” “would,” “potentially,” and similar words or their opposites . Forward - looking statements include, without limitation, statements regarding expectations for growth, registration, enrollments, revenues, net income, earnings per share, EBITDA and Adjusted EBITDA, and plans with respect to and future impacts of recent, current and future initiatives . Forward - looking statements are subject to risks and uncertainties that could cause actual results to differ materially from those expressed or implied by such statements . Such risks and uncertainties include, among others, risks related to : failure to comply with regulatory and accrediting agency requirements, including the “ 90 / 10 ” Rule”, or to maintain institutional accreditation and the impacts of any actions the Company may take to prevent or correct such failure, APEI’s dependence on the effectiveness of its ability to attract students who persist in its institutions’ programs, changing market demands, declines in enrollments at the Company’s institutions ; the enactment of legislation that adversely impacts the Company or its subsidiaries, the inability to effectively market the Company’s programs or expand into new markets, the Company’s inability to maintain strong relationships with the military and maintain course registrations and enrollments from military students, the loss or disruption of the Company’s ability to receive funds under tuition assistance programs or the reduction, elimination, or suspension of tuition assistance, adverse effects of changes the Company makes to improve the student experience and enhance the ability to identify and enroll students who are likely to succeed, the inability to adjust to future market demands by updating existing programs and developing new programs, the loss of eligibility to participate in Title IV programs or ability to process Title IV financial aid, economic and market conditions and changes in interest rates, difficulties involving acquisitions, APEI’s indebtedness and preferred stock, dependence on and the need to continue to invest in the Company’s technology infrastructure, including with respect to third - party vendors, inability to recognize the anticipated benefits of the Company’s cost savings efforts, the Company’s ability to manage and limit its exposure to its bad debt, and the risk factors described in the risk factor section and elsewhere in the Company’s most recent annual report on Form 10 - K and quarterly report on Form 10 - Q and in the Company’s other SEC filings . You should not place any undue reliance on any forward - looking statements . The Company undertakes no obligation to update publicly any forward - looking statements for any reason, unless required by law, even if new information becomes available or other events occur in the future .

4Q23 & APEI Executive Summary 3 1) Adjusted EBITDA (earnings before interest, taxes, depreciation, and amortization less non - recurring expenses, such as severance, and non - cash expenses, such as stock compensation) is a non - GAAP financial measure. Refer to appendix for GAAP to non - GAAP reconciliatio n. Key Take - Aways 1Q24 Guidance Summary ▪ APEI Revenue: $ 152.8 million – exceeding high end of fourth quarter guidance and second consecutive quarter of year - over - year growth ▪ Net income available to common stockholders: $11.5 million and net income per diluted common share of $0.64 vs. high end guidance of $2.7 million and $0.15, respectively ▪ Includes a $1.8 million loss (net of tax) on assets held for sale ▪ Excluding non - cash loss on assets held for sale, net income available to common stockholders of $13.3 million and net income per diluted common share of $0.74, both above guidance ranges ▪ APEI Adjusted EBITDA: $25.7 million – exceeds high end of guidance of $16.9 million ▪ Continued revenue growth at APUS, HCN ▪ Full quarter benefit of cost initiatives taken in 3Q23 ▪ Underspending of marketing at APUS ▪ Positive enrollment trends: APUS, HCN, and RU Online ▪ Continued NCLEX - RN improvements at both RU and HCN ▪ 26 of 29 pre - licensure nursing programs at Rasmussen were above the thresholds in 4Q23 ▪ All Hondros PN and RN programs exceeded the thresholds in 4Q23 FY24 Guidance Summary
Education Unit Updates
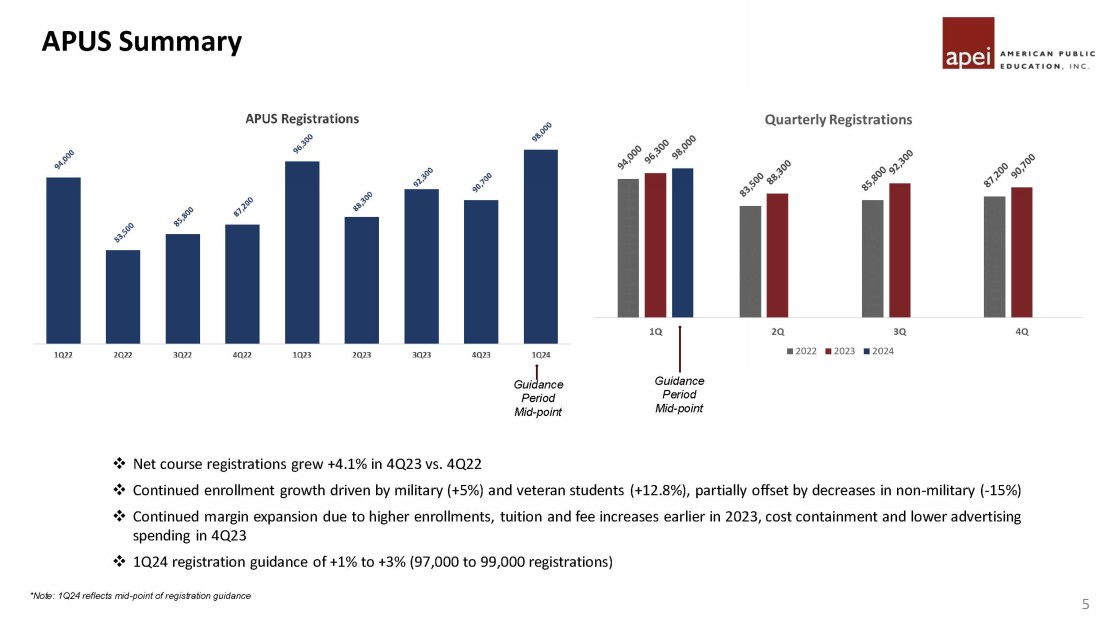
APUS Summary 5 *Note: 1Q24 reflects mid - point of registration guidance Guidance Period Mid - point □ Net course registrations grew +4.1% in 4Q23 vs. 4Q22 □ Continued enrollment growth driven by military (+5%) and veteran students (+12.8%), partially offset by decreases in non - militar y ( - 15%) □ Continued margin expansion due to higher enrollments, tuition and fee increases earlier in 2023, cost containment and lower adve rtising spending in 4Q23 □ 1Q24 registration guidance of +1% to +3% (97,000 to 99,000 registrations) Guidance Period Mid - point
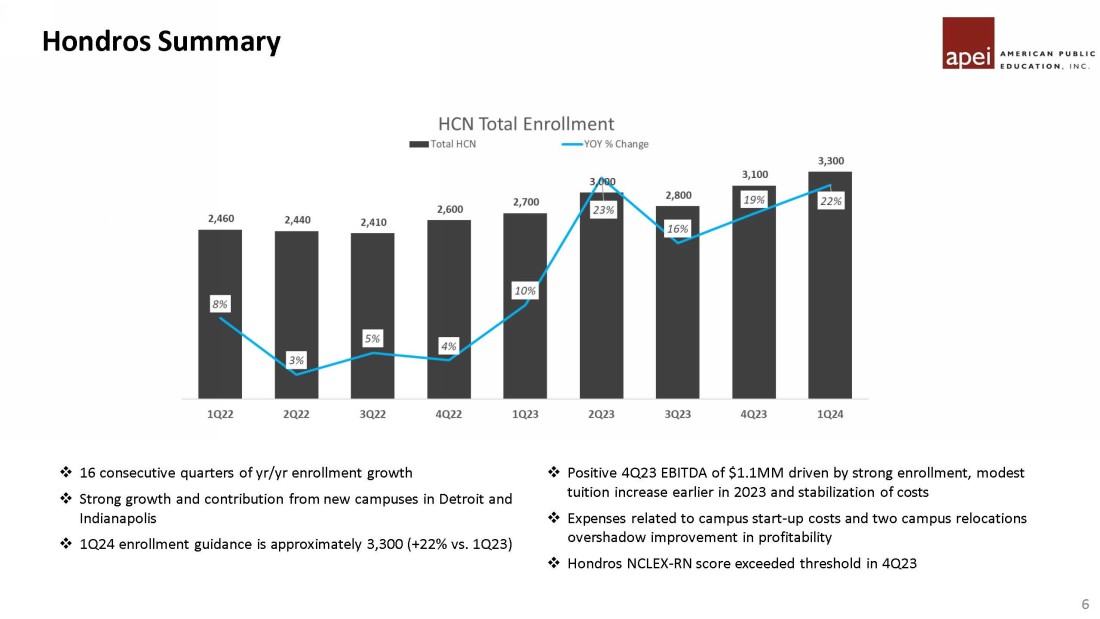
Hondros Summary 6 □ 16 consecutive quarters of yr / yr enrollment growth □ Strong growth and contribution from new campuses in Detroit and Indianapolis □ 1Q24 enrollment guidance is approximately 3,300 (+22% vs. 1Q23) □ Positive 4Q23 EBITDA of $1.1MM driven by strong enrollment, modest tuition increase earlier in 2023 and stabilization of costs □ Expenses related to campus start - up costs and two campus relocations overshadow improvement in profitability □ Hondros NCLEX - RN score exceeded threshold in 4Q23

Rasmussen Summary 7 □ Continued strong growth in BSN enrollments and other on - ground healthcare programs offset by continued declines in ADN program □ Voluntarily closing the Bloomington, MN ADN/RN program – minimal impact on enrollments and revenue □ NCLEX scores continue to improve sequentially □ 26 of 29 programs* (90%) met the applicable state benchmark in 4Q23 □ Full quarter of cost savings helped produce positive EBITDA in 4Q23 □ Overall enrollment growth continues to improve □ Online growth offset by negative ADN enrollments *Note: For all states, except Wisconsin, which hasn’t officially reported, but where we expect our four programs to pass
Financial Results

($ in millions) 4Q22 4Q23 % Change ($ in millions) FY22 FY23 % Change $73.4 $79.4 8% $285.1 $303.3 6% $60.7 $52.6 -13% $253.3 $214.1 -15% $12.6 $15.8 25% $47.1 $56.9 21% $5.7 $5.1 -11% $20.9 $26.2 26% $152.4 $152.8 0% $606.3 $600.5 -1% Revenue Summary by Education Unit 1 Graduate School USA includes nominal amount of corporate revenue eliminations 9 APEI Revenue » Strong quarterly and annual growth at APUS driven by registration increases and select tuition increases » RU revenue declined due primarily to lower ADN nursing enrollments » Record enrollments and modest price increases drove record quarterly and annual revenue at HCN » Strong annual revenue growth at Graduate School impacted by government spending uncertainty in 4Q23 1 1
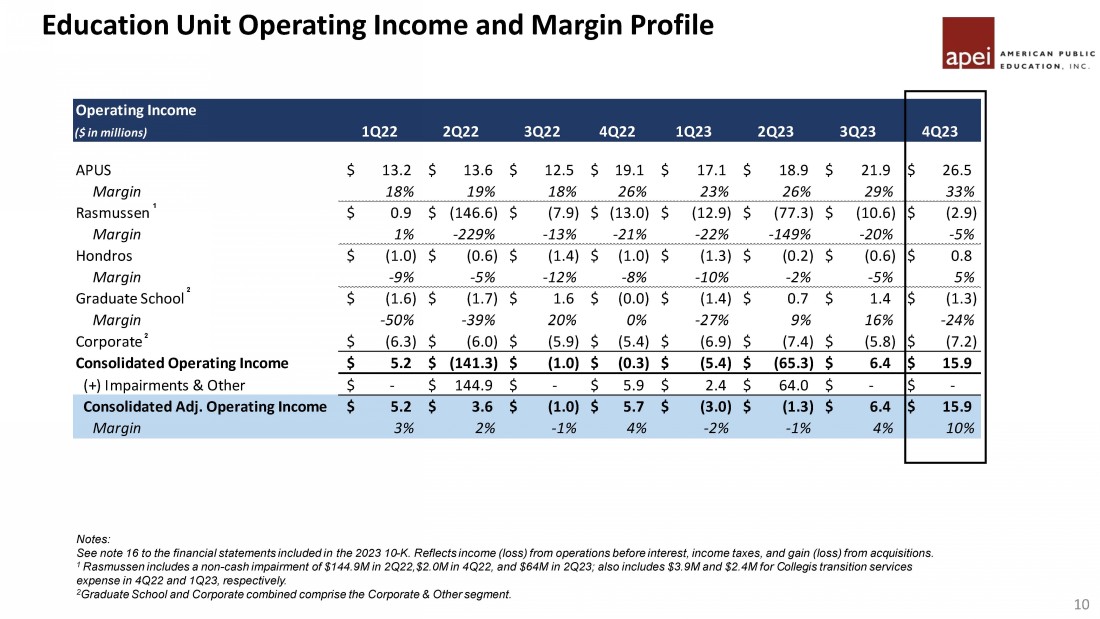
Operating Income ($ in millions) 1Q22 2Q22 3Q22 4Q22 1Q23 2Q23 3Q23 4Q23 APUS 13.2$ 13.6$ 12.5$ 19.1$ 17.1$ 18.9$ 21.9$ 26.5$ Margin 18% 19% 18% 26% 23% 26% 29% 33% Rasmussen 0.9$ (146.6)$ (7.9)$ (13.0)$ (12.9)$ (77.3)$ (10.6)$ (2.9)$ Margin 1% -229% -13% -21% -22% -149% -20% -5% Hondros (1.0)$ (0.6)$ (1.4)$ (1.0)$ (1.3)$ (0.2)$ (0.6)$ 0.8$ Margin -9% -5% -12% -8% -10% -2% -5% 5% Graduate School (1.6)$ (1.7)$ 1.6$ (0.0)$ (1.4)$ 0.7$ 1.4$ (1.3)$ Margin -50% -39% 20% 0% -27% 9% 16% -24% Corporate (6.3)$ (6.0)$ (5.9)$ (5.4)$ (6.9)$ (7.4)$ (5.8)$ (7.2)$ Consolidated Operating Income 5.2$ (141.3)$ (1.0)$ (0.3)$ (5.4)$ (65.3)$ 6.4$ 15.9$ (+) Impairments & Other -$ 144.9$ -$ 5.9$ 2.4$ 64.0$ -$ -$ Consolidated Adj. Operating Income 5.2$ 3.6$ (1.0)$ 5.7$ (3.0)$ (1.3)$ 6.4$ 15.9$ Margin 3% 2% -1% 4% -2% -1% 4% 10% Education Unit Operating Income and Margin Profile 10 Notes: See note 16 to the financial statements included in the 2023 10 - K. Reflects income (loss) from operations before interest, incom e taxes, and gain (loss) from acquisitions. 1 Rasmussen includes a non - cash impairment of $144.9M in 2Q22,$2.0M in 4Q22, and $64M in 2Q23; also includes $3.9M and $2.4M for C ollegis transition services expense in 4Q22 and 1Q23, respectively. 2 Graduate School and Corporate combined comprise the Corporate & Other segment. 1 2 2

Education Unit EBITDA and Margin Profile 11 Continued margin growth to 35% in 4Q23 driven by higher enrollments, select price increases, and lower marketing spend 4Q23 Positive EBITDA driven by slowing enrollment declines and impact of aligning cost structure with lower revenue base Positive EBITDA in 4Q23 due to higher enrollments and revenue, driving 7% margin in 4Q23 Lower 4Q23 revenue and EBITDA driven by impact of US Gov’t.’s continuing resolution Note: See note 16 to the financial statements included in the 2023 10 - K. Reflects income (loss) from operations before interest, incom e taxes, gain (loss) from acquisitions, + depreciation & amortization. Please refer to slide 17 and appendix for GAAP to non - GAAP reconciliation. 1 Rasmussen excludes a non - cash impairment of $144.9M in 2Q22, $2.0M in 4Q22, and $64M in 2Q23. Also excludes $3.9M and $2.4M for Collegis transition services expense in 4Q22 and 1Q23, respectively. 2 Graduate School and Corporate combined comprise the Corporate & Other segment, as discussed in footnote 16 within the 2023 10 - K disclosure. 2 1 2 Segment Summary ($ in millions) 1Q22 2Q22 3Q22 4Q22 1Q23 2Q23 3Q23 4Q23 Revenue $73.1 $69.9 $68.7 $73.4 $74.0 $73.6 $76.4 79.4$ EBITDA $14.9 $15.2 $14.1 $20.6 $18.5 $20.2 $23.3 27.7$ Margin 20% 22% 21% 28% 25% 28% 30% 35% Revenue $67.1 $63.9 $61.5 $60.7 $57.5 $52.0 $52.1 52.6$ EBITDA $7.0 $4.5 ($1.9) ($1.1) ($4.5) ($7.1) ($5.3) 0.4$ Margin 10% 7% -3% -2% -8% -14% -10% 1% Revenue $11.5 $11.5 $11.4 $12.6 $13.1 $14.3 $13.7 15.8$ EBITDA ($0.8) ($0.4) ($1.1) ($0.7) ($1.0) $0.1 ($0.3) 1.1$ Margin -7% -3% -10% -6% -8% 1% -2% 7% Revenue $3.0 $4.3 $7.8 $5.7 $5.1 $7.4 $8.6 5.1$ EBITDA ($1.4) ($1.6) $1.8 $0.1 ($1.3) $0.8 $1.6 (1.1)$ Margin -48% -37% 22% 2% -25% 11% 18% -22% Corporate (6.3)$ (6.0)$ (5.9)$ (5.4)$ (6.9)$ (7.4)$ (5.7)$ (7.1)$ Consolidated Revenue $154.7 $149.6 $149.5 $152.4 $149.7 $147.2 $150.8 152.8$ Consolidated EBITDA $13.3 $11.8 $7.0 $13.6 $4.8 $6.7 $13.4 21.0$ (+) Adjustments 4.1$ 2.8$ 2.5$ 1.9$ 2.2$ 2.1$ 4.7$ 4.7$ Consolidated Adj. EBITDA 17.4$ 14.6$ 9.5$ 15.4$ 7.0$ 8.8$ 18.1$ 25.7$ Margin 11% 10% 6% 10% 5% 6% 12% 17% APEI APUS RU HCN GSUSA
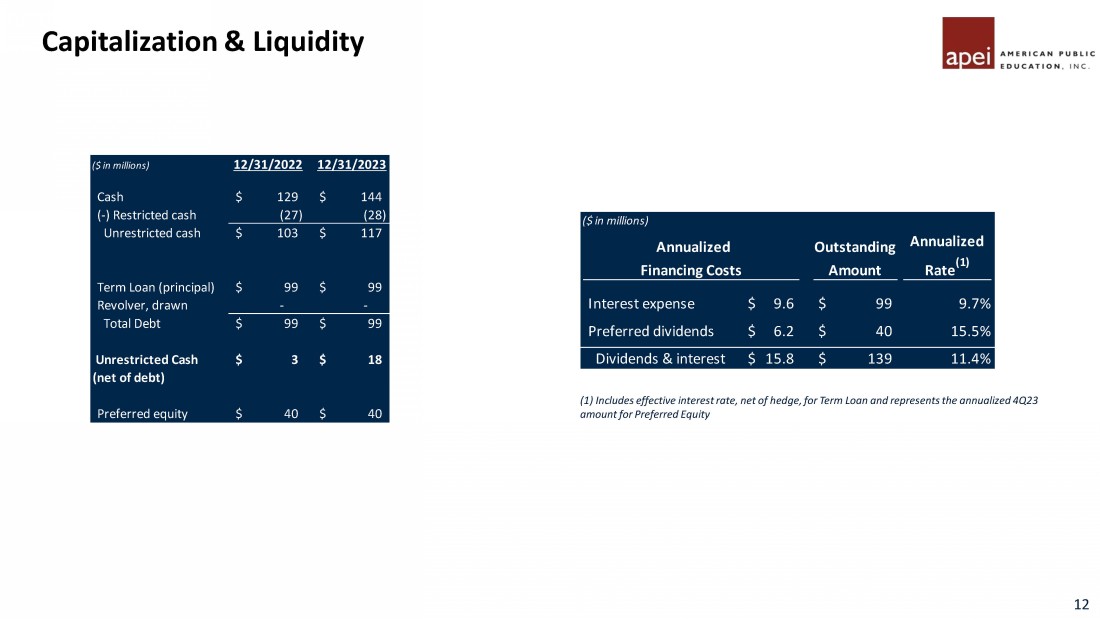
Capitalization & Liquidity 12 (1) Includes effective interest rate, net of hedge, for Term Loan and represents the annualized 4Q23 amount for Preferred Equity ($ in millions) 12/31/2022 12/31/2023 Cash 129$ 144$ (-) Restricted cash (27) (28) Unrestricted cash 103$ 117$ Term Loan (principal) 99$ 99$ Revolver, drawn - - Total Debt 99$ 99$ Unrestricted Cash (net of debt) 3$ 18$ Preferred equity 40$ 40$
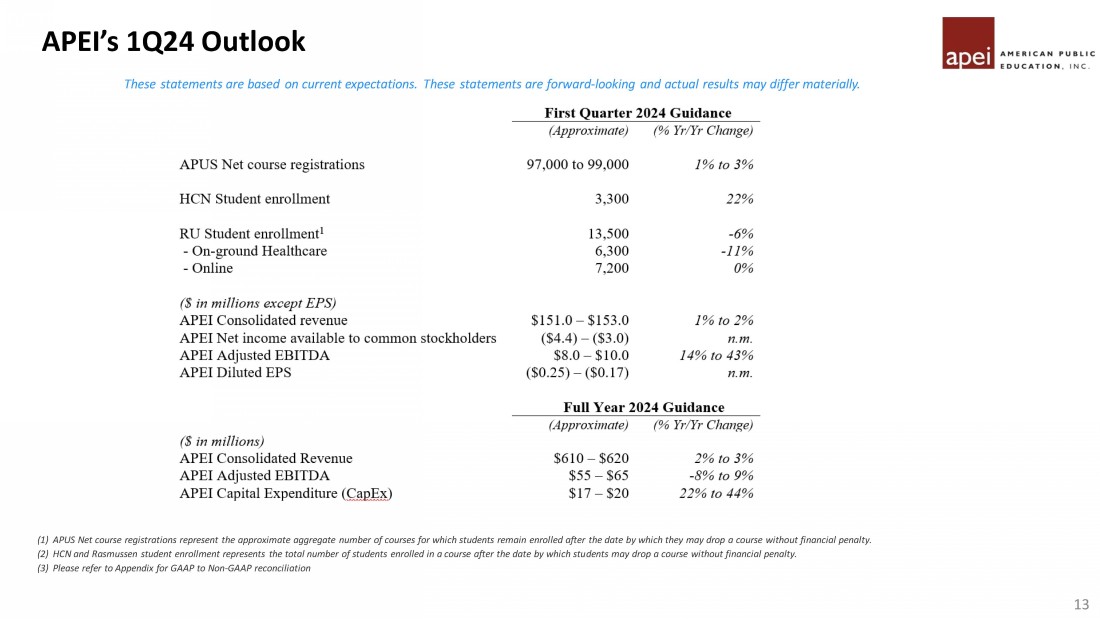
These statements are based on current expectations. These statements are forward - looking and actual results may differ materially. (1) APUS Net course registrations represent the approximate aggregate number of courses for which students remain enrolled after the date by which they may drop a course without financial penalty. (2) HCN and Rasmussen student enrollment represents the total number of students enrolled in a course after the date by which stu den ts may drop a course without financial penalty. (3) Please refer to Appendix for GAAP to Non - GAAP reconciliation APEI’s 1Q24 Outlook 13

Record Nursing Enrollment Hondros , 1Q2024 Recent Achievements 2024 Institution of the Year AMU Recognized by Council of College and Military Educators (CCME) Top 10 Best Online Schools APUS Ranked by DZNet Top 11% on ROI APUS Ranked by Georgetown University Center on Education and Workforce National Center of Academic Excellence in Cyber Defense APUS Designated by NSA 12 New Corporate Relationships at APUS in 2023 96% of respondents say APUS met their expectations in after - program survey 90% (26 of 29 Programs) of on - ground pre - licensure nursing programs met/exceeded state NCLEX exam threshold Rasmussen, 4Q2023 Accreditations include, but are not limited to the following: Expanded Student Services APUS recently added career coaching, AI - driven resume and mental health services 100% (All PN/RN Programs) exceeded state NCLEX thresholds Hondros, 4Q23

Thank You

Rasmussen Enrollment – New Reporting Presentation 16 □ Changing our external reporting of Rasmussen enrollment beginning with 1Q24 to On - Ground and Online enrollments □ This change aligns external reporting to how Rasmussen manages the business internally. □ Primary shifts include moving graduate nursing programs (MSN, FNP and DNP) to the online sub - segment and residential healthcare programs (Surgical Technician, Medical Technician, Medical Assisting) to the On - Ground Healthcare sub - segment New Presentation 1Q22 2Q22 3Q22 4Q22 1Q23 2Q23 3Q23 4Q23 On Ground Healthcare 9,100 8,800 8,200 8,100 7,100 6,800 6,400 6,500 On-line 7,100 7,100 6,800 7,500 7,200 7,100 7,100 7,600 16,200 15,900 15,000 15,600 14,300 13,900 13,500 14,100 Historical Presentation 1Q22 2Q22 3Q22 4Q22 1Q23 2Q23 3Q23 4Q23 Nursing 8,400 8,200 7,700 7,600 6,800 6,400 5,700 5,700 Non-Nursing 7,800 7,700 7,300 8,000 7,500 7,500 7,700 8,400 Total Enrollment 16,200 15,900 15,000 15,600 14,300 13,900 13,500 14,100

Education Unit Overview – Operating Income to EBITDA Reconciliation (1) See note 16 to the financial statements in the 2023 10 - K. Reflects income (loss) from operations before interest, income taxes, and gain / (loss) from acquisition. 17 Corporate + APEI Revenue Full Year Full Year ($ in millions) 1Q22 2Q22 3Q22 4Q22 2022 1Q23 2Q23 3Q23 4Q23 2023 Revenue 73.1 69.9 68.7 73.4 285.1 74.0 73.6 76.4 79.4 303.3 Operating Income (1) 13.2 13.6 12.5 19.1 58.5 17.1 18.9 21.9 26.5 84.4 (+) D&A 1.7 1.6 1.6 1.5 6.4 1.4 1.3 1.3 1.3 5.3 EBITDA 14.9 15.2 14.1 20.6 64.8 18.5 20.2 23.3 27.7 89.7 EBITDA Margin 20.4% 21.8% 20.5% 28.1% 22.7% 25.0% 27.5% 30.4% 35.0% 29.6% Revenue 67.1 63.9 61.5 60.7 253.3 57.5 52.0 52.1 52.6 214.1 Operating Income (1) 0.9 (146.6) (7.9) (13.0) (166.6) (12.9) (77.3) (10.6) (2.9) (103.6) (+) D&A 6.1 6.2 6.0 6.0 24.2 5.9 6.2 5.2 3.3 20.6 (+) Impairment / Other - 144.9 - 5.9 150.8 2.4 64.0 - - 66.4 EBITDA 7.0 4.5 (1.9) (1.1) 8.5 (4.5) (7.1) (5.3) 0.4 (16.5) EBITDA Margin 10.4% 7.1% -3.1% -1.8% 3.4% -7.9% -13.6% -10.3% 0.8% -7.7% Revenue 11.5 11.5 11.4 12.6 47.1 13.1 14.3 13.7 15.8 56.9 Operating Income (1) (1.0) (0.6) (1.4) (1.0) (4.0) (1.3) (0.2) (0.6) 0.8 (1.4) (+) D&A 0.2 0.2 0.2 0.3 1.0 0.3 0.3 0.3 0.3 1.3 EBITDA (0.8) (0.4) (1.1) (0.7) (3.1) (1.0) 0.1 (0.3) 1.1 (0.1) EBITDA Margin -6.7% -3.3% -10.0% -5.8% -6.5% -7.7% 0.6% -2.4% 7.0% -0.3% Revenue 3.0 4.3 7.8 5.7 20.9 5.1 7.4 8.6 5.1 26.2 Operating Income (1) (7.9) (7.7) (4.3) (5.4) (25.2) (8.3) (6.7) (4.3) (8.4) (27.8) (+) D&A 0.1 0.2 0.1 0.1 0.6 0.1 0.1 0.2 0.2 0.7 EBITDA (7.7) (7.6) (4.1) (5.2) (24.6) (8.1) (6.6) (4.2) (8.2) (27.1) Revenue 154.7 149.6 149.5 152.4 606.3 149.7 147.2 150.8 152.8 600.5 Operating Income (1) 5.2 (141.3) (1.0) (0.3) (137.3) (5.4) (65.3) 6.4 15.9 (48.3) (+) D&A 8.1 8.1 8.0 7.9 32.1 7.8 8.0 7.0 5.1 27.8 (+) Impairment / Other - 144.9 - 5.9 150.8 2.4 64.0 - - 66.4 EBITDA 13.3 11.8 7.0 13.6 45.6 4.8 6.7 13.4 21.0 45.9 EBITDA Margin 8.6% 7.9% 4.7% 8.9% 7.5% 3.2% 4.5% 8.9% 13.8% 7.6% (+) Adjustments 4.1 2.8 2.5 1.9 11.1 2.2 2.1 4.7 4.7 13.7 Adjusted EBITDA 17.4 14.5 9.5 15.4 56.7 7.0 8.8 18.1 25.7 59.6 Adjusted EBITDA Margin 11.2% 9.7% 6.3% 10.1% 9.4% 4.7% 6.0% 12.0% 16.8% 9.9%

4Q23 Enrollment and Registration Summary 18 4Q 2023 4Q 2022 % Change APUS Registrations 90,700 87,200 4% Total Rasmussen Enrollment 14,100 15,600 -10% Rasmussen Nursing Enrollment 5,700 7,600 -25% Rasmussen Non-Nursing Enrollment 8,400 8,000 5% HCN Enrollment 3,100 2,600 19%

American Public Education is presenting adjusted EBITDA in connection with its GAAP results and urges investors to review the reconciliation of adjusted net income to the comparable GAAP financial measure that is included in the table below (under the caption “GAAP Net Income to Adjusted EBITDA”) and not to rely on any single financial measure to evaluate its business . Non - GAAP Disclosures 19 GAAP Net Income to Adjusted EBITDA: (in thousands, except per share data) Net loss available to common stockholders $ 11,475 $ (6,583) $ (53,294) $ (115,041) Preferred stock dividends 1,539 48 6,008 48 Net loss $ 13,014 $ (6,535) $ (47,286) $ (114,993) Income tax expense (benefit) 2,124 (1,124) (10,715) (36,276) Interest expense 791 7,389 4,459 17,728 Equity investment loss, net of tax 3 8 5,236 21 Depreciation and amortization 5,081 7,878 27,816 32,127 EBITDA 21,013 7,616 (20,490) (101,393) Impairment of goodwill and intangible assets - 2,000 64,000 146,900 Adjustment to gain on acquisition - 0 - - (3,828) Stock Compensation 1,715 1,306 7,740 8,009 (Gain) loss on disposals of long-lived assets 537 214 554 1,176 Loss on assets held for sale 2,425 - 2,425 - M&A - related professional - 328 - 1,930 Transition services cost - 3,936 2,403 3,936 Severance expense - - 2,959 - Adjusted EBITDA $ 25,690 $ 15,400 $ 59,591 $ 56,730 Twelve Months Ended December 31, 2023 2022 The following table sets forth the reconciliation of the Company’s reported GAAP net income to the calculation of adjusted EBITDA for the three months ended December 31, 2023 and 2022: Three Months Ended December 31, 2023 2022

American Public Education is presenting adjusted EBITDA in connection with its GAAP outlook and urges investors to review the reconciliation of projected adjusted net income to the comparable GAAP financial measure that is included in the table below (under the caption “GAAP Outlook Net Income to Outlook Adjusted EBITDA”) and not to rely on any single financial measure to evaluate its business . Non - GAAP Disclosures (continued) 20 GAAP Outlook Net Income to Outlook Adjusted EBITDA: The following table sets forth the reconciliation of the Company’s outlook GAAP net income to the calculation of outlook adjusted EBITDA for the three months ending March 31, 2024 and twelve months ending December 31, 2024: Three Months Ending Twelve Months Ending March 31, 2024 December 31, 2024 (in thousands, except per share data) Low High Low High Net income/(loss) available to common stockholders $ (4,353) $ (2,953) $ 4,150 $ 11,150 Preferred dividends 1,500 1,500 6,000 6,000 Net Income/(Loss) (2,853) (1,453) 10,150 17,150 Income tax expense/(benefit) (1,223) (623) 4,350 7,350 Interest expense 2,075 2,075 7,700 7,700 Depreciation and amortization 5,200 5,200 20,300 20,300 EBITDA 3,200 5,200 42,500 52,500 Stock compensation 2,000 2,000 7,400 7,400 Other - Dallas lease buyout 2,200 2,200 2,200 2,200 Transition services cost 600 600 2,900 2,900 Adjusted EBITDA $ 8,000 $ 10,000 $ 55,000 $ 65,000
v3.24.0.1
| X |
- DefinitionBoolean flag that is true when the XBRL content amends previously-filed or accepted submission.
| Name: |
dei_AmendmentFlag |
| Namespace Prefix: |
dei_ |
| Data Type: |
xbrli:booleanItemType |
| Balance Type: |
na |
| Period Type: |
duration |
|
| X |
- DefinitionFor the EDGAR submission types of Form 8-K: the date of the report, the date of the earliest event reported; for the EDGAR submission types of Form N-1A: the filing date; for all other submission types: the end of the reporting or transition period. The format of the date is YYYY-MM-DD.
| Name: |
dei_DocumentPeriodEndDate |
| Namespace Prefix: |
dei_ |
| Data Type: |
xbrli:dateItemType |
| Balance Type: |
na |
| Period Type: |
duration |
|
| X |
- DefinitionThe type of document being provided (such as 10-K, 10-Q, 485BPOS, etc). The document type is limited to the same value as the supporting SEC submission type, or the word 'Other'.
| Name: |
dei_DocumentType |
| Namespace Prefix: |
dei_ |
| Data Type: |
dei:submissionTypeItemType |
| Balance Type: |
na |
| Period Type: |
duration |
|
| X |
- DefinitionAddress Line 1 such as Attn, Building Name, Street Name
| Name: |
dei_EntityAddressAddressLine1 |
| Namespace Prefix: |
dei_ |
| Data Type: |
xbrli:normalizedStringItemType |
| Balance Type: |
na |
| Period Type: |
duration |
|
| X |
- Definition
+ References
+ Details
| Name: |
dei_EntityAddressCityOrTown |
| Namespace Prefix: |
dei_ |
| Data Type: |
xbrli:normalizedStringItemType |
| Balance Type: |
na |
| Period Type: |
duration |
|
| X |
- DefinitionCode for the postal or zip code
| Name: |
dei_EntityAddressPostalZipCode |
| Namespace Prefix: |
dei_ |
| Data Type: |
xbrli:normalizedStringItemType |
| Balance Type: |
na |
| Period Type: |
duration |
|
| X |
- DefinitionName of the state or province.
| Name: |
dei_EntityAddressStateOrProvince |
| Namespace Prefix: |
dei_ |
| Data Type: |
dei:stateOrProvinceItemType |
| Balance Type: |
na |
| Period Type: |
duration |
|
| X |
- DefinitionA unique 10-digit SEC-issued value to identify entities that have filed disclosures with the SEC. It is commonly abbreviated as CIK. Reference 1: http://www.xbrl.org/2003/role/presentationRef
-Publisher SEC
-Name Exchange Act
-Number 240
-Section 12
-Subsection b-2
| Name: |
dei_EntityCentralIndexKey |
| Namespace Prefix: |
dei_ |
| Data Type: |
dei:centralIndexKeyItemType |
| Balance Type: |
na |
| Period Type: |
duration |
|
| X |
- DefinitionIndicate if registrant meets the emerging growth company criteria. Reference 1: http://www.xbrl.org/2003/role/presentationRef
-Publisher SEC
-Name Exchange Act
-Number 240
-Section 12
-Subsection b-2
| Name: |
dei_EntityEmergingGrowthCompany |
| Namespace Prefix: |
dei_ |
| Data Type: |
xbrli:booleanItemType |
| Balance Type: |
na |
| Period Type: |
duration |
|
| X |
- DefinitionCommission file number. The field allows up to 17 characters. The prefix may contain 1-3 digits, the sequence number may contain 1-8 digits, the optional suffix may contain 1-4 characters, and the fields are separated with a hyphen.
| Name: |
dei_EntityFileNumber |
| Namespace Prefix: |
dei_ |
| Data Type: |
dei:fileNumberItemType |
| Balance Type: |
na |
| Period Type: |
duration |
|
| X |
- DefinitionTwo-character EDGAR code representing the state or country of incorporation.
| Name: |
dei_EntityIncorporationStateCountryCode |
| Namespace Prefix: |
dei_ |
| Data Type: |
dei:edgarStateCountryItemType |
| Balance Type: |
na |
| Period Type: |
duration |
|
| X |
- DefinitionThe exact name of the entity filing the report as specified in its charter, which is required by forms filed with the SEC. Reference 1: http://www.xbrl.org/2003/role/presentationRef
-Publisher SEC
-Name Exchange Act
-Number 240
-Section 12
-Subsection b-2
| Name: |
dei_EntityRegistrantName |
| Namespace Prefix: |
dei_ |
| Data Type: |
xbrli:normalizedStringItemType |
| Balance Type: |
na |
| Period Type: |
duration |
|
| X |
- DefinitionThe Tax Identification Number (TIN), also known as an Employer Identification Number (EIN), is a unique 9-digit value assigned by the IRS. Reference 1: http://www.xbrl.org/2003/role/presentationRef
-Publisher SEC
-Name Exchange Act
-Number 240
-Section 12
-Subsection b-2
| Name: |
dei_EntityTaxIdentificationNumber |
| Namespace Prefix: |
dei_ |
| Data Type: |
dei:employerIdItemType |
| Balance Type: |
na |
| Period Type: |
duration |
|
| X |
- DefinitionLocal phone number for entity.
| Name: |
dei_LocalPhoneNumber |
| Namespace Prefix: |
dei_ |
| Data Type: |
xbrli:normalizedStringItemType |
| Balance Type: |
na |
| Period Type: |
duration |
|
| X |
- DefinitionBoolean flag that is true when the Form 8-K filing is intended to satisfy the filing obligation of the registrant as pre-commencement communications pursuant to Rule 13e-4(c) under the Exchange Act. Reference 1: http://www.xbrl.org/2003/role/presentationRef
-Publisher SEC
-Name Exchange Act
-Number 240
-Section 13e
-Subsection 4c
| Name: |
dei_PreCommencementIssuerTenderOffer |
| Namespace Prefix: |
dei_ |
| Data Type: |
xbrli:booleanItemType |
| Balance Type: |
na |
| Period Type: |
duration |
|
| X |
- DefinitionBoolean flag that is true when the Form 8-K filing is intended to satisfy the filing obligation of the registrant as pre-commencement communications pursuant to Rule 14d-2(b) under the Exchange Act. Reference 1: http://www.xbrl.org/2003/role/presentationRef
-Publisher SEC
-Name Exchange Act
-Number 240
-Section 14d
-Subsection 2b
| Name: |
dei_PreCommencementTenderOffer |
| Namespace Prefix: |
dei_ |
| Data Type: |
xbrli:booleanItemType |
| Balance Type: |
na |
| Period Type: |
duration |
|
| X |
- DefinitionTitle of a 12(b) registered security. Reference 1: http://www.xbrl.org/2003/role/presentationRef
-Publisher SEC
-Name Exchange Act
-Number 240
-Section 12
-Subsection b
| Name: |
dei_Security12bTitle |
| Namespace Prefix: |
dei_ |
| Data Type: |
dei:securityTitleItemType |
| Balance Type: |
na |
| Period Type: |
duration |
|
| X |
- DefinitionName of the Exchange on which a security is registered. Reference 1: http://www.xbrl.org/2003/role/presentationRef
-Publisher SEC
-Name Exchange Act
-Number 240
-Section 12
-Subsection d1-1
| Name: |
dei_SecurityExchangeName |
| Namespace Prefix: |
dei_ |
| Data Type: |
dei:edgarExchangeCodeItemType |
| Balance Type: |
na |
| Period Type: |
duration |
|
| X |
- DefinitionBoolean flag that is true when the Form 8-K filing is intended to satisfy the filing obligation of the registrant as soliciting material pursuant to Rule 14a-12 under the Exchange Act. Reference 1: http://www.xbrl.org/2003/role/presentationRef
-Publisher SEC
-Name Exchange Act
-Section 14a
-Number 240
-Subsection 12
| Name: |
dei_SolicitingMaterial |
| Namespace Prefix: |
dei_ |
| Data Type: |
xbrli:booleanItemType |
| Balance Type: |
na |
| Period Type: |
duration |
|
| X |
- DefinitionTrading symbol of an instrument as listed on an exchange.
| Name: |
dei_TradingSymbol |
| Namespace Prefix: |
dei_ |
| Data Type: |
dei:tradingSymbolItemType |
| Balance Type: |
na |
| Period Type: |
duration |
|
| X |
- DefinitionBoolean flag that is true when the Form 8-K filing is intended to satisfy the filing obligation of the registrant as written communications pursuant to Rule 425 under the Securities Act. Reference 1: http://www.xbrl.org/2003/role/presentationRef
-Publisher SEC
-Name Securities Act
-Number 230
-Section 425
| Name: |
dei_WrittenCommunications |
| Namespace Prefix: |
dei_ |
| Data Type: |
xbrli:booleanItemType |
| Balance Type: |
na |
| Period Type: |
duration |
|
American Public Education (NASDAQ:APEI)
Historical Stock Chart
From Mar 2024 to Apr 2024

American Public Education (NASDAQ:APEI)
Historical Stock Chart
From Apr 2023 to Apr 2024
