UNITED STATES
SECURITIES AND EXCHANGE COMMISSION
Washington, D.C. 20549
Form 6-K
REPORT OF
FOREIGN PRIVATE ISSUER
PURSUANT TO RULE 13a-16 OR
15D-16 UNDER
THE SECURITIES EXCHANGE ACT OF 1934
For the month of April, 2024
Commission File Number: 1-13368
POSCO HOLDINGS INC.
(Translation of registrant’s name into English)
POSCO Center,
440 Teheran-ro, Gangnam-gu, Seoul, Korea, 06194
(Address of principal executive offices)
Indicate by check mark whether the registrant files or will file annual reports under cover of Form 20-F or Form 40-F.
Form 20-F ☒ Form
40-F ☐
Provisional Earnings in Consolidated Financial Statements Base
(In trillions of KRW)
|
|
|
|
|
|
|
|
|
|
|
|
|
|
|
|
|
|
|
|
|
|
|
| |
|
Q1 2024 |
|
|
Q4 2023 |
|
|
Changes over
Q4 2023(%) |
|
|
Q1 2023 |
|
|
Changes over
Q1 2023 (%) |
|
| Revenue |
|
Amount |
|
|
18.1 |
|
|
|
18.7 |
|
|
|
-3.2 |
% |
|
|
19.4 |
|
|
|
-6.7 |
% |
| |
Yearly
Amount |
|
|
18.1 |
|
|
|
77.1 |
|
|
|
— |
|
|
|
19.4 |
|
|
|
— |
|
Operating
Profit |
|
Amount |
|
|
0.6 |
|
|
|
0.3 |
|
|
|
100.0 |
% |
|
|
0.7 |
|
|
|
-14.3 |
% |
| |
Yearly
Amount |
|
|
0.6 |
|
|
|
3.5 |
|
|
|
— |
|
|
|
0.7 |
|
|
|
— |
|
Profit
before
Income Tax |
|
Amount |
|
|
0.7 |
|
|
|
-0.2 |
|
|
|
turnaround |
|
|
|
1.0 |
|
|
|
-30.0 |
% |
| |
Yearly
Amount |
|
|
0.7 |
|
|
|
2.6 |
|
|
|
— |
|
|
|
1.0 |
|
|
|
— |
|
| Profit |
|
Amount |
|
|
0.6 |
|
|
|
-0.3 |
|
|
|
turnaround |
|
|
|
0.8 |
|
|
|
-25.0 |
% |
| |
Yearly
Amount |
|
|
0.6 |
|
|
|
1.8 |
|
|
|
— |
|
|
|
0.8 |
|
|
|
— |
|
Profit
Attributable to
Owners of the
Controlling
Company |
|
Amount |
|
|
0.5 |
|
|
|
-0.2 |
|
|
|
turnaround |
|
|
|
0.7 |
|
|
|
-28.6 |
% |
| |
Yearly
Amount |
|
|
0.5 |
|
|
|
1.7 |
|
|
|
— |
|
|
|
0.7 |
|
|
|
— |
|
| * |
The above earnings information is composed based
on K-IFRS (Korean International Financial Reporting Standards) and the independent auditors’ review is not finished. Therefore, the earnings information may change in the review process.
|
SIGNATURES
Pursuant to the requirements of the Securities Exchange Act of 1934, the registrant has duly caused this report to be signed on its behalf by
the undersigned, thereunto duly authorized.
|
|
|
|
|
|
|
|
|
|
|
|
|
POSCO HOLDINGS INC. |
|
|
|
|
|
|
(Registrant) |
|
|
|
|
| Date: April 25, 2024 |
|
|
|
By |
|
/s/ Han, Young-Ah |
|
|
|
|
|
|
(Signature) |
|
|
|
|
|
|
Name: Han, Young-Ah |
|
|
|
|
|
|
Title: Senior Vice President |

Exhibit 99.1 POSCO Holdings Q1, 2024 Earnings Release April
25

2 / 19 Disclaimer This presentation was prepared and circulated to
shareholders and investors to release information regarding the company’s business performance prior to completion of auditing for the period pertaining to the 1st quarter of 2024. Given that this presentation is based on unaudited financial
statements, certain figures may be modified in the course of the audit process. This presentation contains certain forward-looking statements relating to the business, financial performance and results of the company and/or the industry in which it
operates. The forward-looking statements set forth herein concern future circumstances that are not historical facts and that are solely based on views and forecasts which are uncertain and subject to risk. Therefore, readers of this presentation
shall be aware that foreward-looking statements set forth herein may not correspond to the actual business performance of the company, resulting from changes and risks in business environment and conditions. The sole purpose of this presentation is
to assist persons in deciding whether they wish to proceed with certain investments to the Company. The Company does not offer guarantee, expressed or implied, as to the accurancy and completeness of this presentation or of the information contained
herein and does not assume any liability for the information described in this presentation.

3 / 19 Contents New Corporate Vision Consolidated Business Performance
Key Business Activities Business Performance by Key Area 2024 Targets Appendix
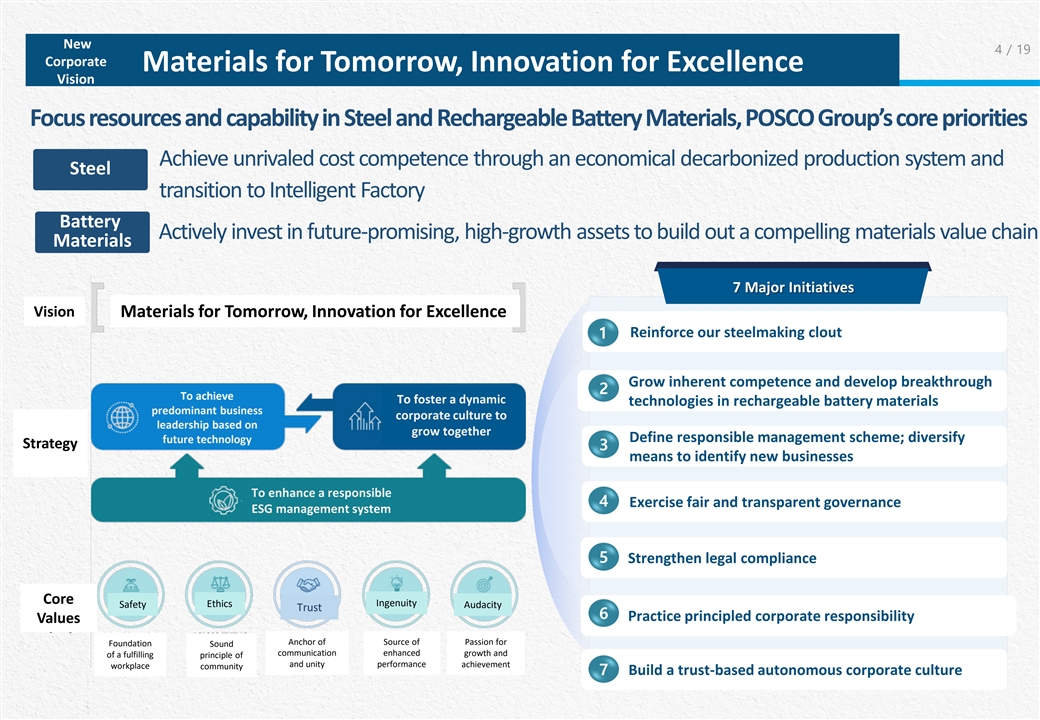
New 4 / 19 Corporate Materials for Tomorrow, Innovation for Excellence
Vision Focus resources and capability in Steel and Rechargeable Battery Materials, POSCO Group’s core priorities Achieve unrivaled cost competence through an economical decarbonized production system and Steel transition to Intelligent Factory
Battery Actively invest in future-promising, high-growth assets to build out a compelling materials value chain Materials 비전 Vision Materials for Tomorrow, Innovation for Excellence 1 2 To achieve To foster a dynamic predominant
business corporate culture to leadership based on grow together 전략 future technology Strategy 3 방향 To enhance a responsible 4 ESG management system 5 Core Ethics Ingenuity Safety Audacity 핵심 Trust 6 Values
가치 Anchor of Source of Passion for Foundation Sound communication enhanced growth and of a fulfilling principle of and unity performance achievement workplace community 7

5 / 19 Rechargeable Battery Materials Business 2024 marks the origin
year of lithium production and our full EV battery materials value chain (FVC) By using the industry slowdown(chasm) to our advantage, acquire promising assets i.e. lithium, next-gen technologies To ensure quality return on our growth strategies,
investment timelines will be reassessed 【 Strengthening Battery Materials Competence】 Capitalize on the chasm to acquire Stake out future markets through Harness Group talent to qualify our minerals assets and to identify M&A
strategic customer alliance and investments, manage construction, projects; introduce CAM into portfolio; speeding up of future materials achieve timely production and adjust business speed (solid electrolytes, lithium metals) strengthen financial
position Jul. ‘23 Value Day (Kt: 1,000 tons) As of Apr. ’24 Speed up stabilization in ‘24 166 → Operate FVC from raw materials to final product 73 9696 96 7171 48 48 2323 23 product intermediate raw mtrl '24 '25 '26 '24 '25
'26 Li • • Ore Li 60 Kt (’26→’27) Refining 15 Kt, reassessment △ △ CAM precursor Ni • • Recycling 10 Kt (’26→ after ’27) Recycling 10 Kt (’26→ after ’27)
△ △ Li Ni 445 Recycling 395 395 345 221 134 215 215 9393 94 114 Spherical Flaky Nat. Graphite Graphite (process/pickle) '24 '25 '26 '24 '25 '26 AAM Art. • Nat. graphite 80 Kt, reassessment △ • Domestic 10 Kt
(’26→’28) △ In Initial • Art. graphite 20 Kt, reassessment △ Investing Silicon production operation • Overseas 40 Kt (’26→’27 w/ partial reassessment) △ • Silicon Anode 7 Kt
(’26→’27) △ Ni volume excludes precursor JV: (’24) 18 Kt, (’25) 31 Kt, (’26) 70 Kt *

6 / 19 Consolidated Business Performance Steel/Green Infrastructure
performance equivalent to previous quarter; Rechargeable Battery Materials impacted by inventory impairment loss reversal Income Financial Structure QoQ QoQ 9,863 (KRW billion, %) 10, 000 50. 00% +1,800 25, 000 (KRW billion, %) 20.00% 9,0 00
△612 15.00% Net Debt 8,063 40. 00% 19,381 7,743 Revenue 8,0 00 20, 000 18,664 18,052 10.00% 7,0 00 30. 00% 5.00% 6,0 00 15, 000 OP Margin +1.6%p 5,0 00 20. 00% Net Debt Ratio 16.3% 0.00% 3.2% +2.8%p 3.6% 13.5% 13.0% 1.6% 4,0 00 10, 000 -5.00%
10. 00% 3,0 00 705 -10.00% 1,628 +283 Operating Profit 1,544 583 2,0 00 5,0 00 0.0 0% 1,262 +279 EBITDA -15.00% 1,0 00 304 (quarter) 0 -10.00% 0 -20.00% '23.1Q '23.4Q '24.1Q '23.1Q '23.4Q '24.1Q ※ Q1 '24 cumulative CAPEX : 【Before
Inter-Company Transaction Adjustment] KRW 1.8 tril. (consolidated), KRW 0.3 tril (separated) Revenue Operating Profit Net Profit (KRWbillion) Q1 ‘23 Q4 ‘23 Q1’24 Q1 ‘23 Q4 ‘23 Q1 ’24 Q1 ‘23 Q4 ‘23 Q1
’24 15,770 15,419 15,442 338 346 339 276 134 210 Steel △ 1) POSCO 9,622 9,376 9,520 251 263 295 230 17 231 Overseas Steel 5,268 4,927 4,942 19 11 4 42 84 68 △ △△ 13,870 14,260 14,153 382 292 340 300 138 304 Green
Infrastructure 2) POSCO International 8,307 7,909 7,761 280 215 266 191 73 183 2) POSCO E&C 2,364 2,773 2,453 55 34 34 65 41 76 3) 1,162 1,154 1,156 10 169 6 48 256 25 Rechargeable BatteryMaterials △ △ 2) POSCO Future M 1,135 1,146
1,138 20 74 38 40 56 57 △ △ 1) Separated 2) Consolidated, POSCO Energy earnings included in POSCO International 3) Rechargeable battery material inventory impairment loss reversal : KRW 66 bil. * Q4 ’23 inventory impairment loss of
KRW 130.5 bil.

7 / 19 Key Business Activities_POSCO Pilbara Lithium Solution Initial
shipment of Korea’s first ore-based lithium hydroxide (LH) Since plant commissioning in March, ramp-up is underway; by year-end, the plant aims to build a 43K ton capacity. With IRA-compliant ‘LH,’ paving the path to a reliable
domestic rechargeable battery materials supply network. P-Future M product certification in progress (goal: completion by Oct.), certification under discussions with 2 battery makers. Dec. '23 '24.4 '24.6 '24.9 Cold/Hot run test Agreement under
discussions Plant 2 facility Phase construction with 3 companies installation completion completion Sales agreement signed with Co. A Electrodialysis (POSCO-type) : product cert. & sales agreement in progress Causticization : 60.8% completed (
’24.4.14) Sept. ’24 completion scheduled

8 / 19 Key Business Activities_POSCO Silicon Solution Ready for launch:
Silicon AAM downstream facility (Young-il Bay Industrial Complex, Pohang) Earlyoperationof550tpadownstreamproductionline;externally-sourcedSiO(intermediate)assistscustomerdemandreadiness
Phase1(550tpa)constructiontobecompletedbySeptember’24;oncePhase1certificationisobtained,4-phaseexpansionplantargets25Ktpaby’30 Apr. ’24 Sep. ’24 Jun. ’23 Jul. ’22 Jan. ’23 Partial All construction Phase 1
Shares Investment: downstream Construction completed acquired Stage 1 approval line completed Post-acquisition, by harnessing Group R&D competence, enhance product performance and efficiency and plant productivity

9 / 19 Performance by Key Area Steel Business - POSCO ·
Production/Sales · Income - Overseas Steel · PT-KP · PZSS · P-Maharashtra · PY-VINA Green Infrastructure Business - POSCO International - POSCO E&C Rechargeable Battery Materials Business - POSCO Future M

10 / 19 POSCO Production/Sales Income QoQ QoQ (KRWbillion, %)
(KRWbillion, %) 88.0% 3.1% 85.6% 12, 000 2.8% +0.3%p 2.6% △2.4%p 11, 000 3.0 % 78.5% OP Margin Utilization 10, 500 80. 00% 11, 000 2.0 % 90% Rate* 10, 40,000 000 70. 00% 80% 1.0 % 9,5 00 10, 000 60. 00% 9,622 9,520 70% Crude steel 38, 000
9,019△358 +144 9,376 0.0 % 9,0 00 Revenue 8,661 50. 60% 00% 8,499 (K tons) 9,0 00 8,330 8,5 00 8,229 -1.0% 36, 000 △101 8,162 50% 40. 00% 8,0 00 Product 40% -2.0% 30.5% 8,0 00 30. 00% 34, 000 28.1% 7,5 00 27.6% 30% -3.0% 20. 00% Premium
Plus 7,0 00 20% Operating +2.4%p +32 295 32, 000 7,0 00 ** 263 10. 00% Sales Ratio 10% -4.0% 6,5 00 Profit 251 30, 000 0% 6,0 00 0.0 0% 6,0 00 -5.0% '23.1Q '23.4Q '24.1Q '23.1Q '23.4Q '24.1Q * Utilization rate : crude steel production / crude steel
capacity ** Non-prime and semi-product figures excluded from total sales volume ○ Despite reduced crude steel output resulting from BF refurb., ○ Despite raw materials cost hike, higher price and reduced cost drive up OP use of
semi-finished inventory helps to keep production and sales at - Sales price (carbon steel): Q4 ‘23) KRW984K/ton → ‘Q1 24) KRW 1,007K/ton (+23) previous quarter performance · Unit price hike and FX impact : +11; change in
product composition: KRW +12K/ton - Major raw material input cost (carbon steel) : Q4 ’23) 100→ Q1 ’24) 102 (+2) 【Sales by Product】 · Raw materials unit price: At baseline of 100 in Q4 ’23, iron ore was 104
and coal108 in Q1 ’24 (K tons) Q1 ’23 Q4 ‘23 Q1 ‘24 QoQ - Base effect of previous quarter collective bargaining manifests in lower costs in labor Carbon steel 7,802 7,945 7,827 △118 and subcontracting expenses STS 360
385 402 +17 【Coking Coal Price】 (U$/ton) *Source: Platts, HCC FOB Austraila ○ Expanded strong-margin automotive steel and CR sales to defend profit 313.5 236 - Premium Plus(previously WTP) sales : 2.513 Mt (+114 Kt, QoQ) 227 May
‘23 Mar.‘24 Apr. ‘24

11 / 19 Steel (overseas) PT. Krakatau POSCO Zhangjiagang STS (PZSS)
Ÿ Despite increased sales volume, higher raw materials price and steel Ÿ Despite lower sales and intense domestic competition, profits beat plate line repair in Q1 drive down profits previous quarter performance by securing low-cost raw
materials - Sales volume (Kt) : Q4 ‘23) 737 → Q1 ‘24) 758 - Sales volume (Kt) : Q4 ‘23) 246 → Q1 ‘24) 237 - Raw materials cost (QoQ) : +6.6% - Raw materials cost (QoQ) : △3% QoQ QoQ 800 1 800 1 719 651 0.9
700 0.9 0.8 +16 Revenue 565 Revenue 700 549 0.8 600 0.7 563 0.7△17 546 600 0.6 500 0.6 0.5 500 0.5 400 0.4 0.4 53 0.3 300 400 0.3 0.2 OP△24 OP 0.2 27 200 300 3 0.1 △42 0.1 △53 △18 +24 100 0 200 0 (USD million) (USD
million) 23.1Q 23.4Q 24.1Q 23.1Q 23.4Q 24.1Q POSCO Maharashtra PY VINA Ÿ Larger orders from end-user customers drive up sales volume and price; • Despite greater sales volume, global steel market slowdown and resulting price drop lead to
weaker revenue and OP against the previous quarter however, soaring scrap price keep OP at level with previous quarter - Domestic sales volume (Kt) : Q4 ‘23) 59.3 → Q1 ‘24) 69.4 (+17%) - Sales volume (Kt) : Q4 ‘23) 371
→ Q1 ‘24) 374 - Sales price (QoQ) : +1.5% - Sales price (QoQ) : △2.3% QoQ QoQ 400 344 335 336 100 △8 350 82 Revenue 90 79 Revenue 76 300 80 +3 250 70 60 200 50 150 40 28 OP 100 30 OP 20 △8 20 12 5 50 - 1 1 10 0 (USD
million) 0 (USD million) 23.1Q 23.4Q 24.1Q 23.1Q 23.4Q 24.1Q

12 / 19 POSCO International Income Highlights QoQ (KRW Billion) ○
Materials, etc.: solid profits supported by strong sales to NA 400 .00% OP Margin 3.4% 3.4% and European eco-friendly industries 13, 500 350 .00% +0.7%p • Increased North American and European steel sales in high- 2.7% 300 .00% 11, 500
strength automotive, API-grade, and for LNG vessels 250 .00% 9,5 00 8,307 Revenue • Despite slower trading of steel and steelmaking raw materials, 7,909 7,761 △148 200 .00% 7,5 00 robust heavy plate and coking coal sales in Europe keep
earnings 150 .00% in line with last quarter 5,5 00 100 .00% - OP (KRW billion)* : Q4 ’23) 63.8 → Q1 ‘24) 81.7 (+15.1) 280 3,5 00 266 +51 50. 00% 215 Operating Profit 1,5 00 0.0 0% ○ Energy: E&P profit decline due to lower
gas sales is cushioned '23.1Q '23.4Q '24.1Q by the power business, resulting in modest earnings gain • E&P: Earnings decline due to decreased gas sales volume and lower cost recovery rate Revenue by Business - OP (KRW billion)* : Q4
’23) 60.3 → Q1 ‘24) 48.2 (△12.1) • Power: Improved earnings by 1) increasing production to meet (KRW Billion) Q1 ‘23 Q4 ‘23 Q1 ‘24 seasonal demand and 2) cutting cost through direct import of QoQ
cheaper LNG (for plants 3 and 4) 1) - OP (KRW billion)* : Q4 ’23) 36.6→ Q1 ‘24) 60.0 (+23.4) Materials, etc. 7,062 6,837 6,785 52 △ 2) Energy 1,245 1,072 976 96 △ *Separated 1) ‘Materials, etc.’ includes
steel, materials for eco-friendly industries, food, and other trading revenues from subsidiaries (consolidated) 2) ‘Energy’ includes revenues from E&P, gas to power (LNG), and LNG terminal businesses
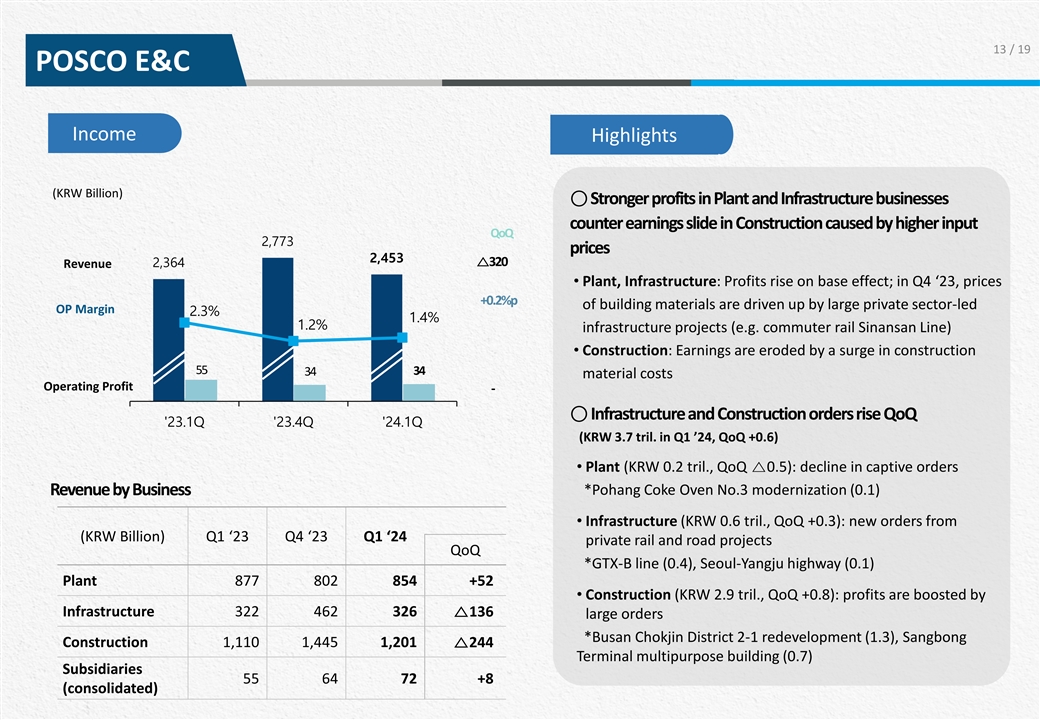
13 / 19 POSCO E&C Income 13. 00% Highlights 4,8 00 11. 00% (KRW
Billion) ○Stronger profits in Plant and Infrastructurebusinesses 3,8 00 9.0 0% counter earnings slide in Construction caused by higher input QoQ 7.0 0% 2,773 prices 2,8 00 2,453 △320 Revenue 2,364 5.0 0% • Plant, Infrastructure:
Profits rise on base effect; in Q4 ‘23, prices +0.2%p 1,8 00 of building materials are driven up by large private sector-led 3.0 0% OP Margin 2.3% 1.4% 1.2% infrastructure projects (e.g. commuter rail Sinansan Line) 1.0 0% •
Construction: Earnings are eroded by a surge in construction 800 55 34 34 -1.00% material costs Operating Profit - -200 -3.00% ○ Infrastructure and Construction orders rise QoQ '23.1Q '23.4Q '24.1Q (KRW 3.7 tril. in Q1 ’24, QoQ +0.6)
• Plant (KRW 0.2 tril., QoQ △0.5): decline in captive orders *Pohang Coke Oven No.3 modernization (0.1) Revenue by Business • Infrastructure (KRW 0.6 tril., QoQ +0.3): new orders from (KRW Billion) Q1 ‘23 Q4 ‘23 Q1
‘24 private rail and road projects QoQ *GTX-B line (0.4), Seoul-Yangju highway (0.1) Plant 877 802 854 +52 • Construction (KRW 2.9 tril., QoQ +0.8): profits are boosted by Infrastructure 322 462 326 △136 large orders *Busan Chokjin
District 2-1 redevelopment (1.3), Sangbong Construction 1,110 1,445 1,201△244 Terminal multipurpose building (0.7) Subsidiaries 55 64 72 +8 (consolidated)

14 / 19 POSCO Future M Income Highlights QoQ (KRW Billion)○ CAM:
Despite price falls, higher sales keep revenue at level with 5 1,146 1,138△8 1,135 Revenue 1,2 00 Q4 ’23. Improved yield and inventory impairment loss reversal 3.3% +9.7%p 3 1,0 00 help to turn a profit. OP Margin 1.8% 800 • CAM
prices slip 21% against previous quarter 1 600 • N86 (Ultium), NCA: yield improvement following installation of single -crystal -1 CAM equipment 400 38 +112 Operating Profit 20 • N65: Inventory release lifts sales; inventory impairment
loss reversal from Q4 200 -3 ‘23 increases profits (+46.4 bil.) 0 -5 '23.1Q '23.4Q '24.1Q -200○ AAM: QoQ OP increased by growing sales to global battery -6.4% -400 -7 makers in addition to existing Korean customers △74 • 9%
surge in sales volume driven by robust shipments to new customers • Unit cost is lowered by economy of scale, and stronger sales improves Revenue by Business profits (KRW Billion) Q1 ‘23 Q4 ‘23 Q1 ‘24 ○ Basic Materials:
Despite enhanced Refractory profits, OP falls QoQ 7% due to lower Quicklime sales and Chemicals price decline CAM 712 740 732 8 △ • Refractory: Pohang BF repairs lift revenues and OP AAM 68 46 49 +3 • Quicklime: Despite price rise,
decreased sales record moderate revenue • Chemicals: Lower MOPS* squeeze price and margin Refractory 144 130 141 +11 Basic mater- *Mean of Platts Singapore (MOPS) denotes the average of Singapore-based oil product price Quicklime &
assessments published by S&P Global Commodity Insights (formerly Platts) ials 211 230 216 14 △ Chemicals

15 / 19 2024 Targets Consolidated Revenue 78 (KRW Trillion) CAPEX 10.8
(KRW Trillion) Note: Capital investment in 2023 totaled KRW 8.6 tril. (76% of the KRW 11.3 tril. budgeted for the year was executed)

16 / 19 Appendix Progress on Battery Materials Plant Construction
Summarized Income Statement Summarized Balance Sheet

17 / 18 Progress on Battery Materials Plant Construction Material
Company Project ~ '22.E '23. '24 '25 Construction commenced Pond & factory Utility installation Phase I Completion construction (Plant 1. Oct.‘22 Plant 1. Plant 2. (Q2) of Brine Plant 2. Dec.‘22) (Q1) Apr. May P- Argentina Phase II
Approval Construction Completion (Oct. ‘22) (Q2) (Jun.) of Brine (UP) Utility Incorpo- Construction Approval Lithium Completion ration installation commenced Phase II (Oct. ‘22) (Q2) P-Lithium (Q2) (Dec.’22) (Jun.) Brine Solution
(DOWN) Civil Plant 1. HQ/Sub Center First shipment engineering Completion Completion Completion P- Completion (Mar.) from Plant 1 (Plant 2. Aug.‘22, (Nov.) (Q2) (Apr.16) (Q3) Lithium Pilbara Plant 1.Nov.‘22) Lithium Ore Utility Utility
Solution (Plant 2. Jan.) installation Civil (Plant 1. Apr.) Completion Utility engineering Fe (Jan.) (Dec.’22) SNNC (Jun. ’22) Removal Civil Utility Utility Completion Completion engineering (Leaching plant) (Extraction plant) Nickel
(Q1) (Q2) POSCO (Oct '22) (Mar.) (Jun.) Refining Nickel Equity acquisition, Completion Approval construction (Q2) (Apr.) Indonesia Smelting commencemenet (Sept.) JV (Matte) Construction P-CNGR Completion Completion Approval Incorporation
commencement Nickel (May) (Q4) (‘26) Nickel (Q1) (Q2) Refining Solution Civil Downstream P- Approval Utility Completion engineering plant Completion Next SiOx (Sept.) (Jan.) (Q3) Silicon (Jun.) (Apr.) Generation AAM Solution

18 / 19 Summarized Consolidated Income Statement (KRW Billion) Q1
‘23 Q4 ‘23 Q1 ‘24 QoQ Revenue 19,381 18,664 18,052 612 △ Gross Profit 1,373 1,099 1,329 +230 (Gross Margin) (7.1%) (5.9%) (7.4%) +1.5%p SG&A 669 794 746 48 △ Operating Profit 705 304 583 279 (Operating Margin)
(3.6%) (1.6%) (3.2%) +1.6%p Profit Before Income Tax 1,001 227 733 +960 △ Net Profit 840 321 619 +940 △ Net Profit attributable to Controlling Interest 726 206 547 +753 △ EBITDA 1,628 1,262 1,544 +282 (EBITDA Margin) (8.4%) (6.8%)
(8.6%) +1.8%p EPS (KRW) 8,589 2,439 6,474 8,913 △ No. of Outstanding Shares (Thousands) 84,571 84,571 84,571 -

19 / 19 Summarized Consolidated Balance Sheet (KRW Billion) Q1
‘23 Q4 ‘23 Q1 ‘24 QoQ Current Assets 50,016 46,212 46,774 +562 Cash Balance* 19,878 17,907 17,883 24 △ Accounts Receivable 11,279 11,015 11,685 +670 Inventories 15,028 13,826 13,975 +149 Non-Current Assets 52,596 54,733
56,494 +1,761 Tangible Assets 32,640 35,206 36,696 +1,490 Intangible Assets 4,907 4,715 4,724 +9 Other LT Financial Assets 2,661 2,708 2,910 +202 Total Assets 102,612 100,945 103,268 +2,323 Liabilities 43,109 41,282 42,870 +1,588 Current Liabilities
22,589 21,862 23,072 +1,210 Non-Current Liabilities 20,520 19,420 19,797 +377 Total Interest Bearing Debt 27,620 25,970 27,745 +1,775 ※ Shareholders’ Equity 59,504 59,664 60,398 +734 Controlling Interest 53,897 54,181 54,803 +622 Net
Debt 7,743 8,063 9,863 +1,800 Net Debt to Equity (%) 13.0% 13.5% 16.3% +2.8%p * Cash balance represents Cash and cash equivalents, Short-term financial instruments, Short-term trading securities, Short-term securities, Current portion of
held-to-maturity securities
POSCO (PK) (USOTC:PKXFF)
Historical Stock Chart
From Apr 2024 to May 2024
 Charts.")
POSCO (PK) (USOTC:PKXFF)
Historical Stock Chart
From May 2023 to May 2024
 Charts.")