Report of Foreign Issuer (6-k)
July 31 2015 - 8:07AM
Edgar (US Regulatory)
UNITED STATES
SECURITIES AND EXCHANGE COMMISSION
Washington, D.C. 20549
FORM 6-K
REPORT OF FOREIGN PRIVATE ISSUER
PURSUANT TO RULE 13a-16 OR 15d-16
UNDER THE SECURITIES EXCHANGE ACT OF 1934
For the date of 31 July 2015
Commission File Number 001-15246
LLOYDS BANKING GROUP plc
(Translation of registrant's name into English)
25 Gresham Street
London
EC2V 7HN
United Kingdom
(Address of principal executive offices)
Indicate by check mark whether the registrant
files or will file annual reports under cover of Form 20-F or Form 40-F.
Form 20-F..X.. Form 40-F.....
Indicate by check mark if the registrant is submitting the Form 6-K in paper as permitted by Regulation S-T Rule 101(b)(1): ___
Indicate by check mark if the registrant
is submitting the Form 6-K in paper as permitted by Regulation S-T Rule 101(b)(7): ____
This report on Form 6-K shall be deemed
incorporated by reference into the Company's Registration Statement on Form F-3 (File No’s. 333-189150; 333-189150-01) and
to be a part thereof from the date on which this report is filed, to the extent not superseded by documents or reports subsequently
filed or furnished.
Lloyds Banking Group plc
Lloyds Banking Group plc hereby incorporates
by reference the following exhibit to this report on Form 6-K into its Registration Statement on Form F-3 (File
No’s. 333-189150; 333-189150-01):
| Exhibit |
|
Document
|
| 12.1 |
|
Statement of Computation of Ratio of Earnings to Fixed Charges and Ratio of Earnings to Combined Fixed Charges and Preference Dividends. |
Signatures
Pursuant to the requirements of the Securities Exchange Act
of 1934, the registrant has duly caused this report to be signed on its behalf by the undersigned, thereunto duly authorized.
| |
LLOYDS BANKING GROUP plc
(Registrant)
|
| |
|
| |
|
| Date: 31 July 2015 |
By: |
/s/ G Culmer |
| |
|
Name: |
George Culmer |
| |
|
Title: |
Chief Financial Officer |
Exhibit 12.1
Ratio of earnings to fixed
charges
The table below shows the ratio
of earnings to fixed charges and ratio of earnings to combined fixed charges plus preference dividends and similar distributions:
| |
|
Year ended |
| Earnings (1) |
Six months ended
30 June
2015 |
31 Dec
2014 |
31 Dec
2013
(4) |
31 Dec
2012
(2) (3)(4)
|
31 Dec
2011
(2)(3) (4) |
31 Dec
2010
(2) (4)
|
| |
£m |
£m |
£m |
£m |
£m |
£m |
| Profit (loss) profit before tax |
1,193 |
1,762 |
415 |
(606) |
(551) |
(2,904) |
| Add: Share of losses / (profits) from joint ventures and associates |
(2) |
(32) |
(43) |
(28) |
(31) |
88 |
| Add: Dividends received from joint ventures and associates |
- |
- |
26 |
13 |
6 |
1 |
| Add: Fixed charges |
4,031 |
9,173 |
14,253 |
16,435 |
14,221 |
17,173 |
| Earnings |
5,222 |
10,903 |
14,651 |
15,814 |
13,645 |
14,358 |
| |
|
|
|
|
|
|
| |
|
|
|
|
|
|
| Fixed charges |
|
|
|
|
|
|
| |
|
|
|
|
|
|
| Interest expensed and capitalised (5) |
3,990 |
9,080 |
14,144 |
16,331 |
14,097 |
17,034 |
| Estimated interest included within rental expense (6) |
41 |
93 |
109 |
104 |
124 |
139 |
| Fixed charges |
4,031 |
9,173 |
14,253 |
16,435 |
14,221 |
17,173 |
| |
|
|
|
|
|
|
| Preference dividends and similar distributions (7) |
197 |
287 |
- |
- |
- |
- |
| |
|
|
|
|
|
|
| Combined fixed charges plus preference dividends and similar distributions |
4,228 |
9,460 |
14,253 |
16,435 |
14,221 |
17,173 |
| |
|
|
|
|
|
|
| Ratios |
|
|
|
|
|
|
| Ratio of earnings to fixed charges |
1.30 |
1.19 |
1.03 |
N/A |
N/A |
N/A |
| Ratio of earnings to combined fixed charges plus preference dividends and similar distributions |
1.24 |
1.15 |
1.03 |
N/A |
N/A |
N/A |
In the year ended 31 December
2012 earnings were inadequate to cover fixed charges by £621 million and to cover combined fixed charges plus preference
dividends and similar distributions by £621 million.
In the year ended 31 December
2011 earnings were inadequate to cover fixed charges by £576 million and to cover combined fixed charges plus preference
dividends and similar distributions by £576 million.
In the year ended 31 December
2010 earnings were inadequate to cover fixed charges by £2,815 million and to cover combined fixed charges plus preference
dividends and similar distributions by £2,815 million.
Notes
| (1) | For the purposes of these ratios, earnings consist of (loss) profit before
tax, less the unremitted income of joint ventures and associates plus fixed charges. Unremitted income is calculated as the share
of profits / losses from joint ventures and associates less dividends received. |
| (2) | (Loss) profit before tax for the years 2010 to 2012 was restated in 2013
for the adoption of IAS 19 (Revised 2011) Employee Benefits. |
| (3) | Loss before tax for 2012 was restated in accordance with the transitional
provisions of IFRS 10 Consolidated Financial Statements in 2013. |
| (4) | During 2013 and earlier years, there were no preference shares accounted
for as equity; all preference shares in those years being accounted for as debt and therefore preference share dividends were already
included within interest costs. As a result, the ratios calculated using fixed charges and combined fixed charges plus preference
dividends and similar distributions were the same in those years. |
| (5) | Interest expensed and capitalised includes the amortisation of debt issuance
costs, discounts and premiums and includes interest expense from the banking book included within “Interest and similar expense”
as well as interest expense from the trading book included within “Other operating income”. |
| (6) | Fixed charges consist of total interest expensed and capitalised plus an
estimate for the proportion of rental expenses deemed to represent interest cost. This has been estimated at 30% of rental expenses,
as a reasonable approximation of the interest factor. |
| (7) | Preference dividends and similar distributions include interest payments
(gross of tax relief received by the Group) on the Additional Tier 1 securities delivered on 7 April 2014, accounted for under
other equity instruments. Interest payments are, however, discretionary and subject to certain restrictions. See Amendment No.
1 to Form F-4 dated 27 March 2014 for further information. |
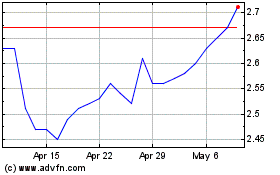
Lloyds Banking (NYSE:LYG)
Historical Stock Chart
From Aug 2024 to Sep 2024

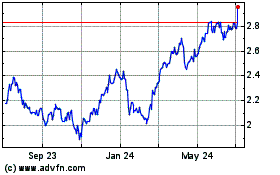
Lloyds Banking (NYSE:LYG)
Historical Stock Chart
From Sep 2023 to Sep 2024
