NuStar Energy Beats on Q1 Earnings, Revs - Analyst Blog
April 24 2014 - 11:00AM
Zacks
San Antonio-based publicly traded
partnership NuStar Energy L.P. (NS) reported
better-than-expected first-quarter results, owing to improved
performance from the pipeline business unit. Decrease in total
operating expenses also favored the results.
The partnership’s first-quarter results were out before the opening
bell on Apr 23, 2014. NuStar closed at $56.95 per unit on that day,
reflecting a marginal increase from the previous day’s closing
price, owing to the favorable results.
NuStar’s earnings per unit (EPU) – from continuing operations –
came in at 40 cents, beating the Zacks Consensus Estimate of 37
cents. The bottom line also increased from the year-ago figure of
10 cents per unit.
Revenues of $849.2 million surpassed the Zacks Consensus Estimate
of $766.0 million. However, the top line was 14.9% below the
year-ago level, mainly due to lower quarterly sales from the
Storage segment.
Quarterly Distribution
NuStar announced quarterly distribution of $1.095 per unit ($4.38
per unit annualized), which remains unchanged from the previous
quarter’s distribution. The distribution is payable on May 12,
2014, to unitholders of record as on May 7, 2014.
Distributable cash flow (DCF) available to limited partners for the
first quarter was $77.9 million or $1.00 per unit (providing 0.91x
distribution coverage), compared with $57.1 million or 73 cents per
unit in the year-earlier quarter.
Segmental Performance
Pipeline: Total quarterly throughput
volumes in the Pipeline segment were 832,389 barrels per day
(Bbl/d) representing a marginal increase of 1.2% from the year-ago
period.
The throughput volumes in the crude oil pipelines increased 2.3%
from the year-ago quarter to 359,418 Bbl/d. Moreover, throughput
revenues rose 10.4% to $103.0 million. The segment’s operating
income increased 32.9% year over year to $53.0 million on an
increase in throughput volumes and a drop in operating expenses.
Storage: Throughput volumes in the
Storage segment improved 22.7% year over year to 821,338 Bbl/d.
However, quarterly revenues were down 6.4% to $132.6 million from
the first quarter of the previous year. The segment reported profit
of $42.0 million, indicating deterioration from $54.0 million in
the year-ago quarter, owing to the segment’s higher operational
costs.
Fuels Marketing: The unit reported an
income of $10.0 million, against the year-ago quarter loss of about
$1.6 million. A decrease in operating expenses led to the
improvement.
Operating Expense
The partnership recorded total
operating costs of $106.1 million, down 6.6% year over year.
Balance Sheet
As of Mar 31, 2014, the partnership had total debt of $2,710.1
million, representing a debt-to-capitalization ratio of 59.5%.
Guidance
NuStar expects its second-quarter 2014 EPU to come in ahead of the
year-ago quarter’s profit. Moreover, the partnership continues to
believe that 2014 operating profits from its pipeline business unit
will register a $40.0 to $60.0 million increase from the 2013
level. Additionally, the adjusted 2014 operating profit from
storage business is likely to be in line with 2013.
In 2014, NuStar plans to invest $350 million to $370 million in
growth projects. The key focus of the investment will be on the
pipeline segment.
Stocks to Consider
NuStar currently carries a Zacks Rank #4 (Sell), implying that it
is expected to underperform the broader U.S. equity market over the
next one to three months.
Meanwhile, one can look at better-ranked players from the same
industry like Energy Transfer Equity LP (ETE),
Boardwalk Pipeline Partners LP (BWP) and
Enterprise Products Partners LP (EPD). Energy
Transfer Equity sports a Zacks Rank #1 (Strong Buy), while
Boardwalk Pipeline Partners and Enterprise Products Partners hold a
Zacks Rank #2 (Buy).
BOARDWALK PIPLN (BWP): Free Stock Analysis Report
ENTERPRISE PROD (EPD): Free Stock Analysis Report
ENERGY TRAN EQT (ETE): Free Stock Analysis Report
NUSTAR ENERGY (NS): Free Stock Analysis Report
To read this article on Zacks.com click here.
Zacks Investment Research
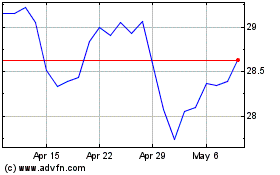
Enterprise Products Part... (NYSE:EPD)
Historical Stock Chart
From Mar 2024 to Apr 2024

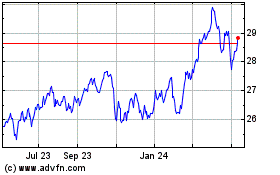
Enterprise Products Part... (NYSE:EPD)
Historical Stock Chart
From Apr 2023 to Apr 2024
