FDA Approves Controversial Changes to Nutrition Facts Panel--2nd Update
May 20 2016 - 10:43AM
Dow Jones News
By Annie Gasparro and Mike Esterl
U.S. food regulators approved the most radical overhaul of
nutrition policy in decades, putting sugar squarely in its
crosshairs in an attempt to change how Americans eat and drink.
The U.S. Food and Drug Administration said a new nutrition-facts
panel that appears on the back of all packaged food and beverages
will list how many grams of sugar have been added by manufacturers
and what percentage of the recommended daily maximum that
represents.
The FDA's decision to break out added sugar from the total sugar
count already on packaging culminates a yearslong push by the Obama
administration into stiff opposition from food and beverage
companies, which say there is no difference between naturally
present sugars and added sugars.
Health officials say added sugars have no nutritional value and
increase overall caloric intake, helping fuel obesity and diabetes
while steering Americans away from nutrient-rich foods. Until now,
nutrition panels have flagged recommended maximums for fats,
sodium, cholesterol and carbohydrates but not for sugar.
First lady Michelle Obama will announce the changes in an annual
nutrition summit in Washington.
The new rules aimed at cracking down on the country's sweet
tooth could cause label shock for many consumers, and it is
expected to deal a big blow to food and beverage makers, especially
those in the soft-drink industry. A 20-ounce bottle of Coca-Cola,
for instance, contains about 130% of the daily recommended maximum
for added sugar.
Despite increasingly branching out into bottled waters and other
zero-calorie offerings, Coca-Cola Co. still derives about 70% of
its sales from carbonated soft drinks like Coke, Sprite and
Fanta.
Government health officials recommend eating no more than 50
grams of added sugars -- or 12.5 teaspoons of granulated sugar -- a
day, based on a 2,000 calorie diet.
However, the FDA estimates Americans on average eat the
equivalent of 20 teaspoons of granulated sugar through added sugars
like honey, high fructose corn syrup and other sweeteners.
One serving of low-fat vanilla yogurt can have three to four
teaspoons of added sugar per serving, in addition to the natural
sugar from the milk. Flavored oatmeal also can have as many as
three teaspoons of added sugar.
Even savory foods have added sugar, like pasta sauce, which
often has 10% of the recommended daily intake per serving.
Still, the government says the biggest sources of added sugars
are the obvious ones: in descending order, soda, energy and sports
drinks, grain-based desserts, sugar-sweetened fruit drinks,
dairy-based desserts and candy.
The spotlight on sugar could damage sales, pushing dozens of
major companies -- including General Mills Inc., PepsiCo Inc.,
Campbell's Soup Co. and Coca-Cola -- to further reformulate
products. Many already are wrestling with falling demand for
processed foods and sugary drinks as consumers shop for fresher,
healthier alternatives.
Soda producers also are being targeted by local politicians.
Philadelphia's mayor has proposed a tax of 3 cents per ounce on
sugar-added drinks, potentially increasing prices by more than
half, and lawmakers in Illinois have resurrected the idea of a soda
tax in their budget talks. In July, San Francisco will begin
requiring advertisements for sugary drinks to be accompanied by
warnings that they contribute to obesity, diabetes and tooth
decay.
The FDA proposed initial changes to the nutrition label in early
2014, sparking thousands of letters from interested parties,
including food and beverage companies. It first proposed including
the recommended maximum daily percentage for added sugars last
summer.
Until now, nutritional labels have remained essentially
unchanged since 1994, except for the addition of heart-risky trans
fats in 2006.
Manufacturers have two years to comply with the new regulation,
though they could still challenge the changes in court. Those with
less than $10 million in annual food sales will have three
years.
Write to Annie Gasparro at annie.gasparro@wsj.com and Mike
Esterl at mike.esterl@wsj.com
(END) Dow Jones Newswires
May 20, 2016 10:28 ET (14:28 GMT)
Copyright (c) 2016 Dow Jones & Company, Inc.
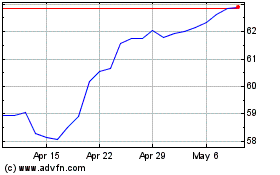
Coca Cola (NYSE:KO)
Historical Stock Chart
From Mar 2024 to Apr 2024

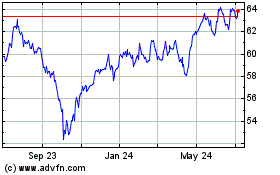
Coca Cola (NYSE:KO)
Historical Stock Chart
From Apr 2023 to Apr 2024
