Tristel PLC Half Yearly Report -4-
February 25 2015 - 2:00AM
UK Regulatory
The financial information relating to the year ended 30 June
2014 does not constitute full financial statements within the
meaning of Section 434 of the Companies Act 2006. This information
is based on the Group's statutory accounts for that period. The
statutory accounts were prepared in accordance with International
Financial Reporting Standards ("IFRS") and received an unqualified
audit report and did not contain statements under Section 498(2) or
(3) of the Companies Act 2006. These financial statements have been
filed with the Registrar of Companies.
3 SEGMENTAL ANALYSIS
The Board considers the Group's revenue lines to be split into
three operating segments, which span the different Group entities.
The operating segments consider the nature of the product sold, the
nature of production, the class of customer and the method of
distribution. The Group's operating segments are identified from
the information which is reported to the chief operating decision
maker.
The first segment concerns the manufacture, development and sale
of infection control and hygiene products which incorporate the
Company's chlorine dioxide chemistry, and are used primarily for
infection control in hospitals ("Human Health"). This segment
generates approximately 86% of Group revenues.
The second segment, which constitutes 5% of the business
activity, relates to manufacture and sale of disinfection and
cleaning products, principally into veterinary and animal welfare
sectors ("Animal Health").
The third segment addresses the pharmaceutical and personal care
manufacturing industries ("Contamination Control"). This activity
has generated 9% of the Group's revenue for the period.
The operation is monitored and measured on the basis of the key
performance indicators of each segment, these being revenue and
gross profit; strategic decisions are made on the basis of revenue
and gross profit generating from each segment.
The Group's centrally incurred administrative expenses,
operating income, assets and liabilities are not attributable to
individual segments.
   3       SEGMENTAL ANALYSIS - continued

                                    6 months ended                                            6 months ended                                         Year ended
                                   31 December 2014                                          31 December 2013                                       30 June 2014
                                     (unaudited)                                               (unaudited)                                           (audited)
                    Human           Animal          Cont'n        Total           Human          Animal      Cont'n       Total         Human        Animal     Cont'n      Total
                   Health           Health         Control                       Health          Health     Control                    Health        Health    Control

                  GBP'000          GBP'000         GBP'000      GBP'000         GBP'000         GBP'000     GBP'000     GBP'000       GBP'000       GBP'000    GBP'000    GBP'000
  Revenue           6,322              397             693        7,412           5,536             327         579       6,442        11,518           762      1,190     13,470
  Cost
   of
   material       (1,798)            (153)           (350)      (2,301)         (1,549)           (121)       (282)     (1,952)       (3,216)         (255)      (595)    (4,066)
             ------------  ---------------  --------------  -----------  --------------  --------------  ----------  ----------  ------------  ------------  ---------  ---------
  Gross
   profit           4,524              244             343        5,111           3,987             206         297       4,490         8,302           507        595      9,404
             ============  ===============  ==============               ==============  ==============  ==========              ============  ============  =========

    Centrally incurred income
    and expenditure not
    attributable to individual
    segments:-
  Dep'n & amort'n of
   non- financial assets                                          (422)                                                  (449)                                              (885)
  Other administrative
   expenses                                                     (3,600)                                                (3,296)                                            (6,685)
  Share based payments                                             (67)                                                   (22)                                               (15)
                                                            -----------                                              ---------                                          ---------
  Segment operating profit                                        1,022                                                    723                                              1,819
                                                            -----------                                              ---------                                          ---------

    Segment operating profit
    can be reconciled to Group
    profit before tax as follows:-
  Segment operating profit                                        1,022                                                    723                                              1,819
  Results from equity
   accounted associate                                                8                                                      5                                                  8
  Finance income                                                      7                                                      2                                                  6
  Finance costs                                                     (4)                                                    (6)                                               (10)

  Group profit                                                    1,033                                                    724                                              1,823
                                                            ===========                                              =========                                          =========


    The Group's revenues from external customers are divided into the following
    geographical areas:
                                    6 months ended                                            6 months ended                                         Year ended
                                   31 December 2014                                          31 December 2013                                       30 June 2014
                                     (unaudited)                                               (unaudited)                                           (audited)
                    Human           Animal          Cont'n        Total           Human          Animal      Cont'n       Total         Human        Animal     Cont'n      Total
               healthcare       healthcare         control                   healthcare      healthcare     control                healthcare    healthcare    Control

                  GBP'000          GBP'000         GBP'000      GBP'000         GBP'000         GBP'000     GBP'000     GBP'000       GBP'000       GBP'000    GBP'000    GBP'000
  United
   Kingdom          4,230              258             518        5,006           3,809             231         451       4,491         7,439           550        950      8,939
  Rest
   of the
   World            2,092              139             175        2,406           1,727              96         128       1,951         4,079           212        240      4,531
             ------------  ---------------  --------------  -----------  --------------  --------------  ----------  ----------  ------------  ------------  ---------  ---------
  Group
   Revenues         6,322              397             693        7,412           5,536             327         579       6,442        11,518           762      1,190     13,470
             ============  ===============  ==============  ===========  ==============  ==============  ==========  ==========  ============  ============  =========  =========


   4            EARNINGS PER SHARE
The calculations of earnings per share are based on the
following profits and number of shares:
                                     6 months ended        6 months       Year ended
                                        31 December           ended     30 June 2014
                                               2014     31 December
                                                               2013
                                        (unaudited)     (unaudited)        (audited)
  Retained profit for the
   period attributable to equity
   holders of the parent                        773             413            1,298
                                   ================  ==============  ===============

                                        Shares '000     Shares '000      Shares '000
                                             Number          Number           Number
  Weighted average number
   of ordinary shares for the
   purpose of basic earnings
   per share                                 40,523          39,985           39,989
  Share options                               2,127               -                -
  Weighted average number
   of ordinary shares for the
   purpose of diluted earnings
   per share                                 42,650          39,985           39,989
                                   ================  ==============  ===============

  Earnings per ordinary share
  Basic (pence)                                1.91            1.03             3.25
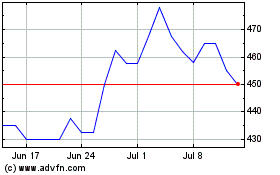
Tristel (LSE:TSTL)
Historical Stock Chart
From Mar 2024 to Apr 2024

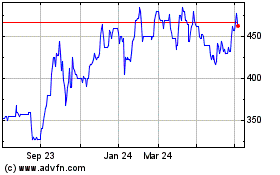
Tristel (LSE:TSTL)
Historical Stock Chart
From Apr 2023 to Apr 2024
