TIDMAIEA
RNS Number : 5902A
Airea PLC
21 February 2014
AIREA plc
Interim Results for the Six Months Ended 31 December 2013
Review of Operations
Introduction
The six months to December 2013 have been a challenging period
for Airea plc as we continue to reshape the business towards our
goal of sustainable profitable growth against a backdrop of ongoing
hostile market conditions. We stated in the annual report that we
could not see any reliable signs of an upturn in market conditions
and this continued to be the case throughout the period. Whilst we
discerned some marginal improvement in demand for our residential
carpet range in the final quarter of the calendar year, this was
patchy and volatile. Demand in the contract flooring market
remained weak as the non-residential construction sector continued
to be subdued. Our revenue reflected this general market picture
and was further impacted by timing issues on larger contracts and
stocking deals.
Against this back-ground of weak demand, the business has
demonstrated financial resilience. Margin improvement, resulting
from the work done on product engineering and price management, and
a lower cost base kept the business in profit and we have
maintained the financial headroom to allow us to operate debt
free.
We continue to make good progress in strengthening the product
portfolio and a number of important product launches were
successfully completed in the first half from which we can expect
to see sales in future periods. New wool mix collections extolling
the virtues of wool over synthetic materials, emphasising the
superior lasting appearance, resilience, cleaning properties and
allergy benefits have been welcomed by retailers. Our carpet tile
collection has been strengthened in the medium price sector and we
have re-launched our best selling product with enhanced design
options at a very competitive price point.
Group results
Revenue for the period was GBP11.6m (2012: GBP13.5m). The
operating profit was GBP222,000 (2012: GBP359,000). After charging
pension related finance costs of GBP200,000 (2012: GBP89,000) and
incorporating the appropriate tax charge the net profit for the
period was GBP16,000 (2012: GBP176,000). Basic earnings per share
were 0.03p (2012: 0.38p).
The change in operating profit resulted from a combination of
reduced sales volumes improved margins and a lower cost base. The
increase in pension related finance costs arises from the new
approach to calculating and presenting the net interest expense on
the net defined liability introduced by a revision to the
appropriate accounting standard. The notional interest is now
calculated as a single net figure, based on the discount rate that
is used to measure the defined benefit obligation. As a consequence
the long term expected return on the plan assets actually held is
no longer used. In common with many other entities, this results in
a lower reported net profit. It does not reflect any real
deterioration in the underlying pension funding level.
Operating cash flows before movements in working capital were
GBP599,000 (2012: GBP929,000). Working capital increased by
GBP373,000 (2012: reduction GBP1,355,000) due to timing of payments
to suppliers. Contributions to the defined benefit pension scheme
were GBP200,000 (2011: GBP217,000) in line with the agreement
reached with the scheme trustees following the last triennial
valuation as at 1(st) July 2011. Capital expenditure of GBP113,000
(2012: GBP134,000) was focussed on essential replacements and
productivity improvements.
Current trading and future prospects
Despite the generally more optimistic tone concerning the wider
economy we have not seen this work through into the particular
sectors in which we operate. The residential carpet market has yet
to see any sustained improvement from an increase in activity in
the housing market, and demand remains volatile. On the contract
flooring side, the dearth of development activity over the last six
years in commercial construction and now the cut backs in public
sector investment has led to challenging market conditions with
intensified competition for the available business. However, the
products we have launched in the first half of our financial year,
combined with the work we have been doing in reshaping the
salesforce, puts us in a stronger competitive position and we
continue to demonstrate our financial resilience. Given the current
trading position, and the ongoing need to carefully husband our
financial resources, the board has decided not to make a dividend
payment at the interim stage.
Enquiries:
Neil Rylance 01924 266561
Chief Executive Officer
Roger Salt 01924 266561
Group Finance Director
Richard Lindley 0113 388 4789
N+1 Singer
Consolidated Income Statement
6 months ended 31st December
2013
Unaudited Unaudited Audited
6 months 6 months year ended
ended ended
31st December 31st December 30th June
2013 2012 2013
GBP000 GBP000 GBP000
Revenue 11,555 13,521 25,049
Operating costs (11,333) (13,162) (24,340)
Operating profit after
exceptional items 222 359 709
Finance income 2 - 2
Finance costs (200) (89) (178)
-------------- -------------- ------------
Profit before taxation 24 270 533
Taxation (8) (94) (90)
--------------
Profit for the period 16 176 443
============== ============== ============
Earnings per share (basic
and diluted) 0.03p 0.38p 0.96p
All amounts relate to continuing
operations
Consolidated Statement of Comprehensive
Income
6 months ended 31st December
2013
Unaudited Unaudited Audited
6 months 6 months year ended
ended ended
31st December 31st December 30th June
2013 2012 2013
GBP000 GBP000 GBP000
Profit attributable to
shareholders of the group 16 176 443
Actuarial losses recognised
in the pension scheme - - 2,350
Related deferred taxation - - (797)
Total comprehensive income/(loss)
for the period 16 176 1,996
============== ============== ============
Consolidated Balance Sheet
as at 31st December 2013 Unaudited Unaudited Audited
31st December 31st December 30th June
2013 2012 2013
GBP000 GBP000 GBP000
Non-current assets
Property, plant and equipment 6,165 6,872 6,428
Deferred tax asset 1,476 2,495 1,476
7,641 9,367 7,904
-------------- -------------- ------------
Current assets
Inventories 8,723 7,501 8,874
Trade and other receivables 3,205 3,467 4,331
Cash and cash equivalents 2,406 3,090 2,747
-------------- -------------- ------------
14,334 14,058 15,952
-------------- -------------- ------------
Total assets 21,975 23,425 23,856
-------------- -------------- ------------
Current liabilities
Trade and other payables (3,797) (4,368) (5,440)
Non-current liabilities
Pension deficit (5,668) (8,129) (5,668)
Deferred tax (41) (41) (41)
(5,709) (8,170) (5,709)
-------------- -------------- ------------
Total liabilities (9,506) (12,538) (11,149)
-------------- -------------- ------------
12,469 10,887 12,707
============== ============== ============
Equity
Called up share capital 11,561 11,561 11,561
Share premium account 504 504 504
Capital redemption reserve 2,395 2,395 2,395
Share option reserve - 16 -
Retained earnings (1,991) (3,589) (1,753)
12,469 10,887 12,707
============== ============== ============
Consolidated Cash Flow
Statement
6 months ended 31st December Unaudited Unaudited Audited
2013
6 months 6 months year ended
ended ended
31st December 31st December 30th June
2013 2012 2013
GBP000 GBP000 GBP000
Operating activities
Profit attributable to
shareholders of the group 16 176 443
Tax charged 8 94 90
Finance costs 198 89 176
Depreciation 377 570 1,137
-------------- -------------- ------------
Operating cash flows before
movements in working capital 599 929 1,846
(Increase)/decrease in
working capital (373) 1,355 416
Contributions to defined
benefit pension scheme (200) (217) (415)
-------------- -------------- ------------
Cash generated from operations 26 2,067 1,847
-------------- -------------- ------------
Investing activities
Purchase of property, plant
and equipment (113) (134) (257)
-------------- -------------- ------------
Financing activities
Equity dividends paid (254) (185) (185)
-------------- -------------- ------------
Net (decrease)/increase
in cash and cash equivalents (341) 1,748 1,405
Cash and cash equivalents
at start of period 2,747 1,342 1,342
Cash and cash equivalents
at end of period 2,406 3,090 2,747
============== ============== ============
Consolidated Statement of Changes in
Equity
6 months ended 31st December
2013
Share capital Share premium Capital Share Retained Total
account redemption option Earnings equity
reserve reserve
GBP000 GBP000 GBP000 GBP000 GBP000 GBP000
At 1st July 2012 11,561 504 2,395 16 (3,580) 10,896
Profit attributable to
shareholders of the group - - - - 176 176
Dividend paid - - - - (185) (185)
-------------- -------------- ------------ --------- ----------
At 1st January 2013 11,561 504 2,395 16 (3,589) 10,887
Profit attributable to
shareholders of the group - - - - 267 267
Other comprehensive income
for the period - - - - 1,553 1,553
Reserve transfer relating
to share based payment - - - (16) 16 -
At 1st July 2013 11,561 504 2,395 - (1,753) 12,707
Profit attributable to
shareholders of the group - - - - 16 16
Dividend paid - - - - (254) (254)
At 31st December 2013 11,561 504 2,395 - (1,991) 12,469
============== ============== ============ ========= ========== ========
Note
BASIS OF PREPARATION AND ACCOUNTING
POLICIES
The financial information for the six month periods ended 31(st) December
2013 and 31(st) December 2012 has not been audited and does not constitute
full financial statements within the meaning of Section 434 of the Companies
Act 2006.
The financial information relating to the year ended 30th June 2013 does
not constitute full financial statements within the meaning of Section
434 of the Companies Act 2006. This information is based on the group's
statutory accounts for that period. The statutory accounts were prepared
in accordance with International Financial Reporting Standards as adopted
by the European Union ("IFRS") and received an unqualified audit report
and did not contain statements under Section 498(2) or (3) of the Companies
Act 2006. These financial statements have been filed with the Registrar
of Companies.
These interim financial statements have been prepared using the recognition
and measurement principles of International Financial Reporting Standards
as adopted by the European Union ("IFRS"). The accounting policies used
are the same as those used in preparing the financial statements for the
year ended 30th June 2013. These policies are set out in the annual report
and accounts for the year ended 30th June 2013. The interim and annual
reports are available on the company's website at www.aireaplc.co.uk.
This information is provided by RNS
The company news service from the London Stock Exchange
END
IR MMGZZNGLGDZM
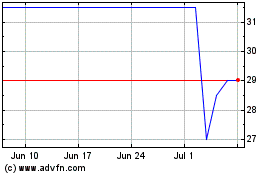
Airea (LSE:AIEA)
Historical Stock Chart
From Mar 2024 to Apr 2024

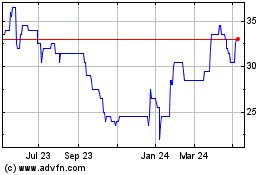
Airea (LSE:AIEA)
Historical Stock Chart
From Apr 2023 to Apr 2024
