Hot Features

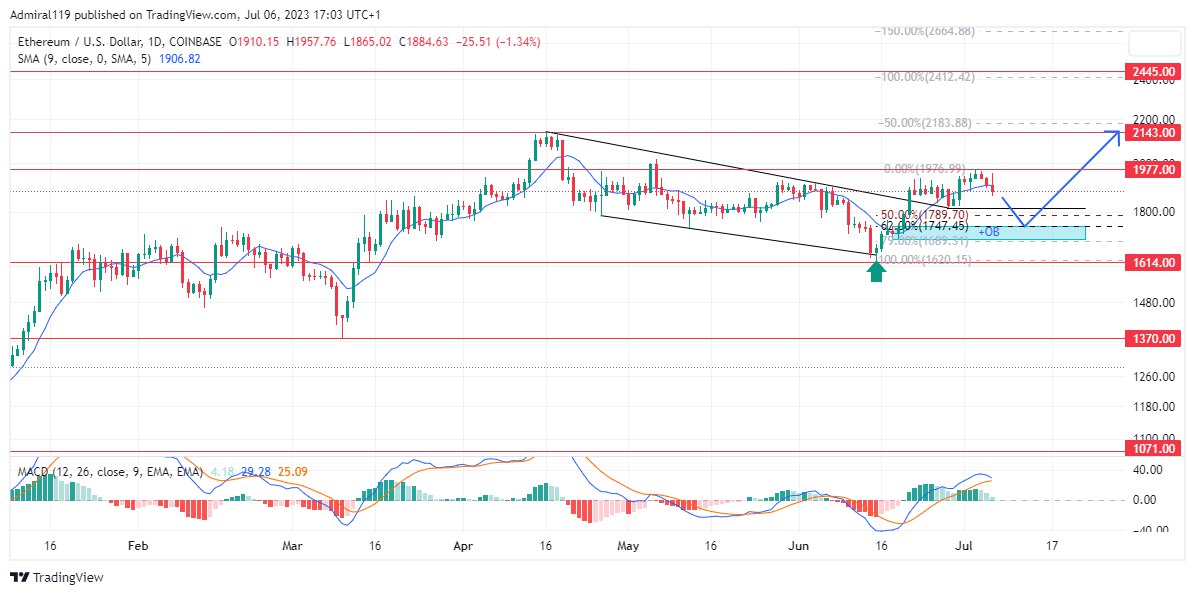
The ETHUSD market is currently witnessing a downward trajectory following the successful invalidation of its previous short-term high. This decline can be attributed to the considerable selling pressure experienced at the $1977.00 supply zone, prompting a necessary retracement. Given the underlying factors driving this retracement, it is anticipated to extend significantly into the discount zone.

Notably, the market has remained within a well-defined range, fluctuating between the price levels of $1614.00 and $1977.00 over the past two months. An analysis of the daily chart reveals the initiation of a bullish trend a few months ago, with the year’s peak reached after a notable upward extension from the $1370.00 demand zone. The prevailing order flow across the market suggests the imminent possibility of establishing a new yearly high.
 Key Levels for ETH:
Demand Levels: $1614.00, $1370.00, $1071.00
Supply Levels: $1977.00, $2143.00, $2445.00
Insights from Technical Indicators:
The market exhibits a pronounced bullish sentiment, as evidenced by the Moving Average Convergence Divergence (MACD) indicator. Following a robust rally from the $1614.00 demand zone, the MACD has recently crossed above the zero line. Furthermore, the Simple Moving Average has generated a buy signal by intersecting the candlestick to the right, in response to the surge. These indicators collectively suggest a favorable market outlook and further support the prevailing bullish sentiment.
Learn from market wizards: Books to take your trading to the next level