Hot Features

Key Highlights
BTC price declines to $18,161low
Bitcoin resumes a range-bound move below the moving average lines

Bitcoin (BTC) Current Statistics
The current price: $19,826.52
Market Capitalization: $416,357,006,611
Trading Volume: $48,325,671,966
Resistance Levels: $50,000, $55, 000, $60,000
Support Levels: $25,000, $20,000, $15,000
Bitcoin (BTC) Price Analysis October 13, 2021
Surprisingly, Bitcoin (BTC) is in a downtrend but declines sharply to $18,161 low as bulls buy the dips. The largest cryptocurrency escapes further decline as bulls buy the dips. The crypto price has rallied to the high of $19,395. Bitcoin will continue its upside momentum if price breaks above the 21-day line SMA.
A break above the 21-day line SMA will propel BTC price to rally above the 50-day line SMA. The bullish momentum will further extend to the next resistance at $22,794. Nonetheless, the current bullish scenario will be invalidated if buyers fail to break above the moving average lines. The cryptocurrency will be compelled to a range-bound move between the $18,210 and $20,000 price levels.
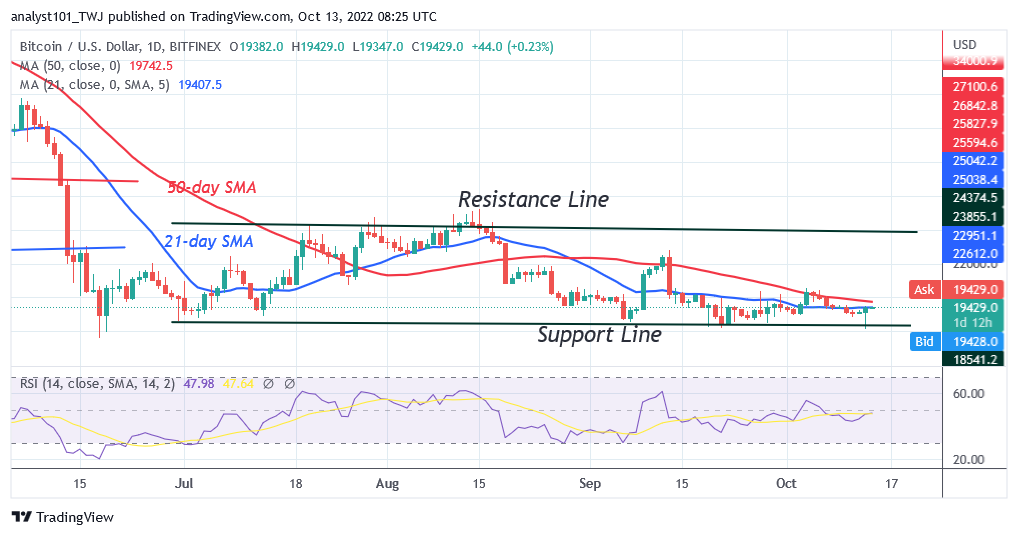
BTC/USD – Daily Chart
Bitcoin Technical Indicators Reading
Despite the recent recovery, the BTC price is in the downtrend zone. It is at level 47 of the Relative Strength Index for period 14. The price bars are below the moving average lines as Bitcoin risks further decline. The current rally has pushed Bitcoin above the 80 range of the daily Stochastic. The cryptocurrency is likely to retrace in the overbought region of the market.
Conclusion
Bitcoin has recovered from the $18,161 low as bulls bouhgt the dips. The cryptocurrency has risen above the $19,000 support. In the previous price action, the $19,000 support has been holding since September 27. Today, buyers are struggling to break above the 21-day line SMA.

BTC/USD – 4 Hour Chart
Learn from market wizards: Books to take your trading to the next level