ADVFN Logo ADVFN

We could not find any results for:
Make sure your spelling is correct or try broadening your search.

Trending Now

Toplists

It looks like you aren't logged in.
Click the button below to log in and view your recent history.

Hot Features

Registration Strip Icon for alerts Register for real-time alerts, custom portfolio, and market movers

GBPUSD Faces Rejection at Level 1.3642, May Further Decline to Level 1.2914

Share On Facebook
share on Linkedin
Print

Key Resistance Levels: 1.4200, 1.4400, 1.4600
Key Support Levels: 1.3400, 1.3200, 1.3000

© Image copyright epsos

GBP/USD Price Long-term Trend: Bearish
GBP/USD is in a downtrend as it may further decline to level 1.2914. On the weekly chart, the currency pair has been fluctuating between levels 1.3160 and 1.3800 since October 25, 2021. The downtrend may resume as price breaks below the moving averages. Meanwhile, on October 25 downtrend, a retraced candle body tested the 61.8% Fibonacci retracement level. The retracement indicates that the Pound will fall to level 1.618 Fibonacci extension or 1.2914.

GBP/USD Faces Rejection at Level 1.3642, May Further Decline to Level 1.2914
GBP/USD – Weekly Chart

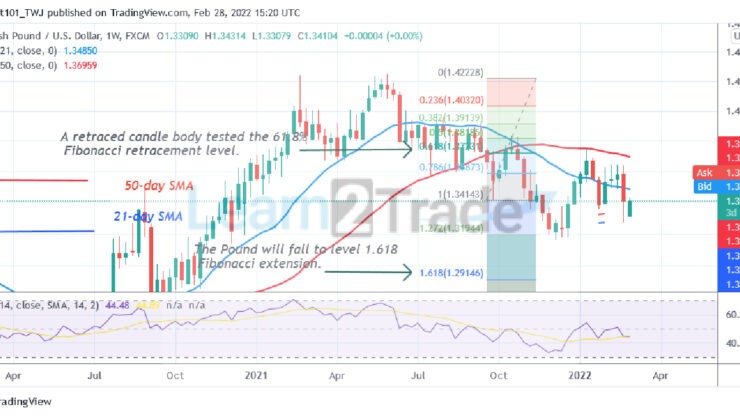
Weekly Chart Indicators Reading:
The Pound is at level 44 of the Relative Strength Index for period 14. The Pound is in the downtrend zone and below the centerline 50. The pair is capable of a further downward move. The 21-day line and 50-day line moving averages are sloping downward indicating the downtrend.

GBP/USD Medium-term Trend: Bearish
On the daily chart, the Pound is below the moving averages. It has fallen to the low of level 1.3300. The pound will further decline if it breaks below level 1.3300. Meanwhile, on January 27 downtrend; a retraced candle body tested the 50% Fibonacci retracement level. The retracement suggests that the Pound will fall to level 2.0 Fibonacci extension or 1.2985.

GBP/USD Faces Rejection at Level 1.3642, May Further Decline to Level 1.2914
GBP/USD – Daily Chart

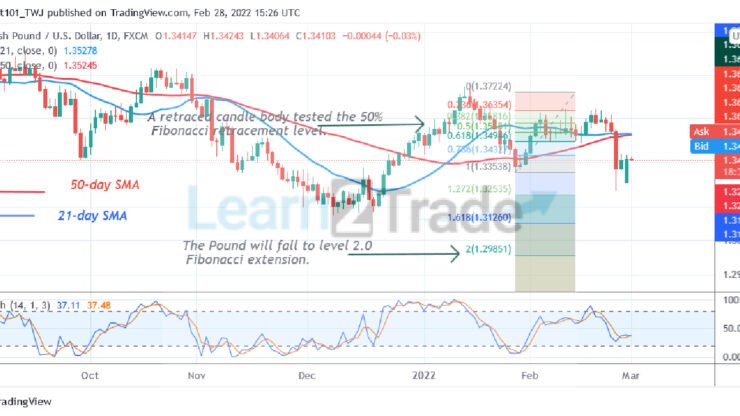
Daily Chart Indicators Reading
The Pound is above the 30% range of the daily stochastic. It indicates that the market is in a bullish momentum. The 21-day and 50-day SMAs are sloping horizontally indicating the sideways move.

General Outlook for GBP/USD
GBP/USD is in a downward move but may further decline to level 1.2914. The Pound will fall as long as it is in the bearish trend zone. Today, GBP/USD is facing resistance at a level 1.3400 high. The pair will fall and revisit the previous low at level 1.3300.

Source: https://learn2.trade

CLICK HERE TO REGISTER FOR FREE ON ADVFN, the world's leading stocks and shares information website, provides the private investor with all the latest high-tech trading tools and includes live price data streaming, stock quotes and the option to access 'Level 2' data on all of the world's key exchanges (LSE, NYSE, NASDAQ, Euronext etc).

This area of the ADVFN.com site is for independent financial commentary. These blogs are provided by independent authors via a common carrier platform and do not represent the opinions of ADVFN Plc. ADVFN Plc does not monitor, approve, endorse or exert editorial control over these articles and does not therefore accept responsibility for or make any warranties in connection with or recommend that you or any third party rely on such information. The information available at ADVFN.com is for your general information and use and is not intended to address your particular requirements. In particular, the information does not constitute any form of advice or recommendation by ADVFN.COM and is not intended to be relied upon by users in making (or refraining from making) any investment decisions. Authors may or may not have positions in stocks that they are discussing but it should be considered very likely that their opinions are aligned with their trading and that they hold positions in companies, forex, commodities and other instruments they discuss.

Leave A Reply

 
Do you want to write for our Newspaper? Get in touch: newspaper@advfn.com