Hot Features
Key Support Levels: 1.3400, 1.3200, 1.3000

GBP/USD Price Long-term Trend: Bearish
GBP/USD pair is in a downtrend but may resume uptrend. The bears have pushed the altcoin to the low of level 1.3216. This is the previous low of December 7. The market will resume upward if the current support holds. Otherwise, the selling pressure will resume. Meanwhile, on July 19 downtrend; a retraced candle body tested the 61.8 % Fibonacci retracement level. The retracement indicates that GBP/USD is likely to fall to level 1.618 Fibonacci extension or level 1.3.
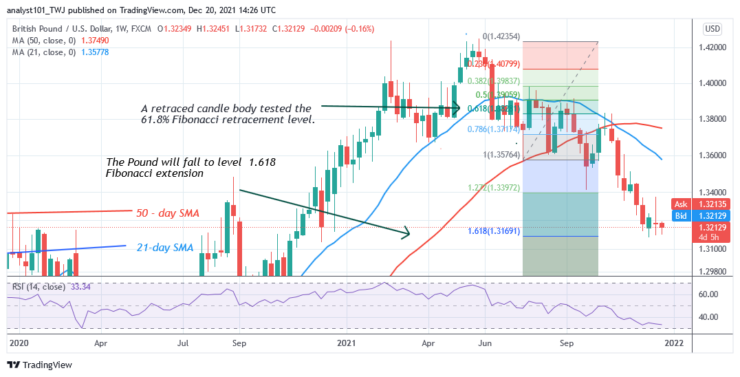
Daily Chart Indicators Reading:
GBP/USD is at level 33 of the Relative Strength Index period 14. The currency pair is approaching the oversold region of the market. The price bars are below the 21-day line and 50-day line SMAs indicating a further downward move.
GBP/USD Medium-term Trend: Bearish
On the daily chart, the pair is in a downward move. The Pound price is making a series of lower highs and lower lows. The moving averages are acting as resistance to the Pound. Meanwhile, on July 19 downtrend; a retraced candle body tested the 50% Fibonacci retracement. The retracement indicates that GBP/USD is likely to fall to level 2.0 Fibonacci extension or level 1.2920.
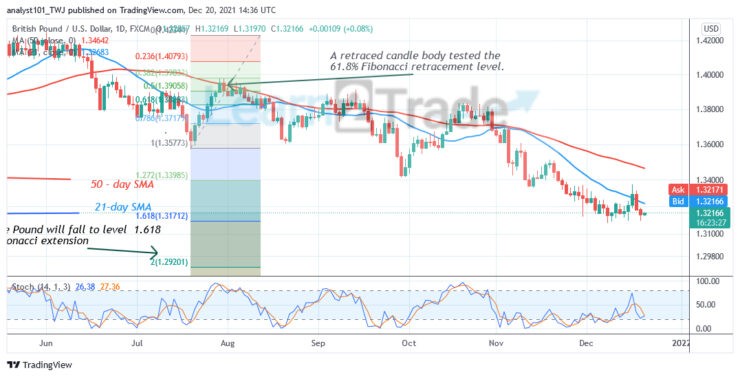
Daily Chart Indicators Reading
The pair is above the 25% range of the daily stochastic. The daily stochastic bands are sloping horizontally. The 21-day and 50-day SMAs are sloping downward indicating the downtrend.
General Outlook for GBP/USD
The Pound is nearing bearish exhaustion as it falls to the oversold region of the market. The Pound is hovering above level 1.3216. The currency will resume an upward move if the current support holds. Otherwise, the market will fall and revisit level 1.618 or 2.0 Fibonacci extension or 1.3169 and 1.2920.
Source: https://learn2.trade