Hot Features

Key Support Levels: $0.25, $0.20,$0.15

DOGE/USD Long-term Trend: Bullish
Since October 29, Dogecoin’s (DOGE) price has been in a downward move. On October 28, the cryptocurrency was in a vertical rally as it reached the high of $0.34. DOGE price was resisted as the altcoin tested the previous resistance zone at $0.34. The market has declined to $0.26 low or above the 21-day SMA. Dogecoin will further decline on the downside if these levels are breached. On the other hand, if the 21-day SMA holds, buyers will recoup above the current support and resume a new uptrend.
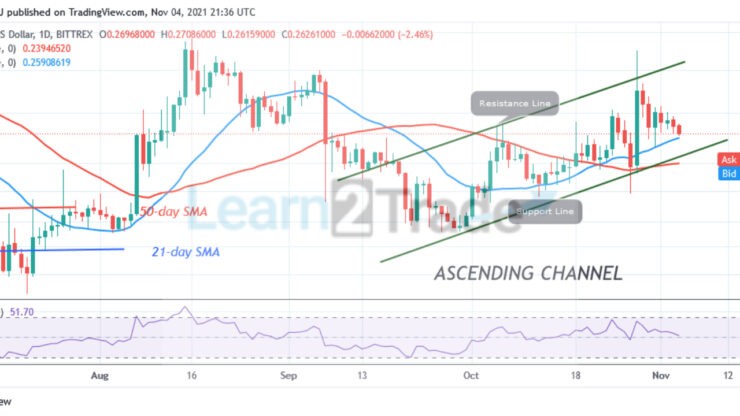
Daily Chart Indicators Reading:
DOGE price has fallen to level 52 of the Relative Strength Index period 14. Despite the retracement, the altcoin is trading in the bullish trend and it is above the centerline 50. The crypto’s price is above the moving averages and it is retesting the 21-day SMA support. The selling pressure will resume if price breaks below the moving averages.
DOGE/USD Medium-term bias: Bearish
On the 4 hour chart, the DOGE price is in a downward move. It has broken below the moving averages. There is a likelihood of price reaching the previous low. Meanwhile, on October 28 downtrend; a retraced candle body tested the 50% Fibonacci retracement level. The retracement indicates that DOGE price will fall to level 2.0 Fibonacci extension or level $0.23.

4-hour Chart Indicators Reading
The market has fallen below the 20% range of the daily stochastic. Dogecoin has fallen to the oversold region of the market. The implication is that the current downtrend has reached bearish exhaustion. The market is likely to resume an upward move. The crypto’s price is below the moving averages.
General Outlook for Dogecoin
Dogecoin is in a downward move. The cryptocurrency is likely to revisit the previous breakout of $0.23. This has been confirmed by level 2.0 Fibonacci extension or level $0.23.
Source: https://learn2.trade