Hot Features

Market volatility, as reflected by the CBOE S&P Volatility Index, also known as the VIX, has remain subdued in the past few weeks since the benchmark made a strong move to the 38 level during the September tech sell-off.
However, the latest choppy performance seen by the S&P 500 since a failed move toward the index’s all-time highs hasn’t corresponded with the VIX. The index continues to be in the process of what could be a sideways consolidation despite a troubled backdrop for the world economy and for the US as well.
Business consultant Jasdeep Singh believes that if we take into account the risk of a potentially contested US Presidential Election and the growing number of daily COVID-19 cases in European countries and America, there is a case to be made that there are significant bearish forces that will likely push the VIX higher. There are technical elements within the market that also suggest that this could be the case in the next few weeks.
A technical overview of the VIX
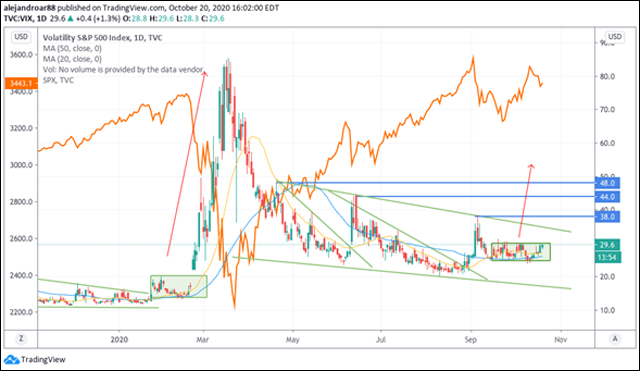
The VIX has been trading in a downward price channel ever since the S&P 500 Index progressively rebounded to all-time highs from the lows seen in March.
This downward channel has been formed by multiple highs along the way – although each new high has been lower than the preceding one.
Massive amounts of liquidity injected to the financial markets have been effective – thus far – in containing volatility. Market players feel comfortable around the idea that the Federal Reserve will jump in to bail out the markets if anything goes wrong.
That said, there are multiple scenarios that could still push the VIX higher – at least in short notice – including the virus situation, the US election, and growing tensions between America and China.
Although the VIX has not yet responded in accordance to those risks, the sideways consolidation that is shown in the chart above indicates that market players are hesitant about where things are headed. This may be why the index has not climbed higher or fallen lower just yet.
The chart also shows that a similar consolidation process was seen right before the pandemic sell-off as investors felt uncertain about the potential impact of a pandemic on the world economy.
Now, it is important to understand that the VIX is a forward-looking indicator of how investors perceive potential volatility in the markets.
This means that the fact that the index remains subdued only a few weeks before the US election is difficult to grasp.
However, one reason for this could be that the VIX is already trading at a level that prices in the volatility of most tail risks.
In that context, a sideways consolidation like the one seen in the chart, is not necessarily favoring a bullish break for the VIX, Investors could actually react positively to a non-contested US election – which would push the VIX lower.
That said, there’s one element Dr. Singh points out in the charts, and that is that there is a bullish divergence seen in both the Relative Strength Index (RSI) and the MACD oscillator, both of which are trending higher despite the index moving lower.

This divergence, shown in the chart above, is a contrarian signal that indicates that price momentum has been moving higher despite the VIX moving downwards.
From a technical standpoint, the combination of this sideways consolidation along with a potential surge in momentum could be signaling that the VIX is poised to move higher in the next few weeks.
Given the uncertain backdrop of COVID and certain geopolitical issues, volatility is something you would expect before the end of the year.
Bottom Line
Sky-high volatility has been the new normal this year with so many factors complicating the outlook of corporate earnings and the health of the global economy.
Although the VIX has remained largely subdued in the past few weeks, chances are that the index will likely see a big jump soon as a combination of negative catalysts could plunge the stock markets into another correction.